
9
The Demography of American Indian Families
Gary D. Sandefur and Carolyn A. Liebler
Introduction
This chapter describes some key features of contemporary American Indian families and changes in these features over time. A major theme of the discussion is that a growing proportion of American Indian children reside with only one parent. The prevalence of single-parent families is especially pronounced on some reservations. These family patterns, combined with depressed economic conditions, place many American Indian children at risk.
To examine American Indian families, we rely primarily on data from the U.S. Bureau of the Census. These data show that American Indian children are less likely to reside with two parents than are children in the total U.S. population. Also, American Indian women are less likely to ever marry and more likely to be divorced than women in general. The trends in these characteristics over time roughly follow trends in the overall U.S. population.
The extent of single parenthood, never marrying, and divorce is higher on some of the reservations than among other segments of the Indian population. These reservations also tend to have high unemployment and poverty rates, and some have unfavorable sex ratios for marriage.
This research was supported by funds provided to the Graduate School at the University of Wisconsin-Madison by the Wisconsin Alumni Research Foundation. We appreciate the comments of Barney Cohen, Ronald Rindfuss, and two anonymous reviewers.
The conditions on the ten largest reservations are such that American Indian women and children, as well as others, on these reservations are likely to need free medical assistance, along with other forms of public assistance, well into the future.
The next section looks at some of the limitations of census data for understanding American Indian families. This is followed by a review of the various groups within the American Indian population that are examined in the ensuing discussion of selected features of American Indian families. The chapter ends with a summary and conclusions.
LIMITATIONS OF CENSUS DATA FOR UNDERSTANDING AMERICAN INDIAN FAMILIES
Studying American Indian families with census data involves some difficulties. The two major problems are the lack of information on kinship and family relationships beyond the household and changes in self-identification that make it very difficult to interpret trends among American Indians. A true story illustrates these two problems. 1 The first author, a member of the Chickasaw Nation in Oklahoma, is one of the great great grandchildren of Ishtokenahe (male) and Simonteche (female). Ishtokenahe and Simonteche came to Oklahoma from Mississippi during the Chickasaw era of the "Trial of Tears," the forced removal of the Cherokee, Chickasaw, Choctaw, Creek, and other groups from the southeastern United States during the early to mid-1800s. Among their children was Gabriel Underwood, the great grandfather of the first author. During his adult years, Mr. Underwood, a full-blood, had three full-blood wives who maintained somewhat separate households. Mr. Underwood moved periodically from household to household during the late 1800s and early 1900s. Although polygamy had been officially outlawed by the Chickasaw Nation before that time, a number of Chickasaws continued to maintain such relationships.
Gabriel Underwood had several children, all full-bloods, some of whom married other Chickasaws, but most of whom married non-Chickasaws. Most of his grandchildren, both full- and half-blood, married non-Chickasaws. His great grandchildren, the first author's generation and the great great grandchildren of Ishtokenahe and Simonteche, are all at least one-quarter Chickasaw and could be members of the Chickasaw nation if they chose to be. But the records about the different people do not always reflect their Indian heritage. Some of their births were recorded as Indian births if the doctor decided that the race of one of the
parents was Indian; some were recorded as white births. Yet some of the people who were considered Indian at birth have never identified themselves as Chickasaws in censuses or elsewhere, while some of those who were not recorded as Indian at birth have always identified themselves as Chickasaws. Others have changed their self-identification back and forth over the years in different censuses.
Further, census data on these individuals will reveal only some features of their family and kinship relationships. The data will show with whom they are currently living and some characteristics of their households and families. But the data will not reveal the relatively recent experience of polygamy in this family, the complexity of kinship networks beyond the nuclear family, or the extent of intermarriage in previous generations.
Many contemporary American Indians can tell similar and in many cases more complicated stories about their family histories and their current family situations. Clan systems, relationships with non-nuclear family members, and ritualistic adoptive relationships play very important roles in the family lives of many contemporary Native Americans. Many American Indians have ancestors who were members of two or more Native American groups and/or ancestors who were not Indian. For these reasons, many American Indians and students of American Indians see census data as inadequate for describing and understanding contemporary American Indian families, households, and kinship systems.
Nonetheless, we assert that one can learn a good deal about contemporary American Indian families by examining census data. In fact, census data provide information that is relevant to consideration of the implications of healthcare reform for Native Americans—the purpose of organizing the workshop at which this paper was originally presented. Information on household size and composition and trends in these over time provide useful background information for this purpose. The aims of this chapter are to examine the trends in these characteristics among American Indians over time, as they are currently, and across subgroups of the American Indian and Alaska Native populations. These subgroups include the national population of American Indians and those people living on reservations and trust lands (shortened here to "reservations"), in Alaska Native Village Statistical Areas (Alaska NVSAs), in Oklahoma Tribal Jurisdiction Statistical Areas (Oklahoma TJSAs), and on 1990's ten most populated reservations.
Groups Within The American Indian Population
Table 9-1 contains selected characteristics of the groups that are examined in this chapter. The purposes of this table and this section of the
TABLE 9-1 Selected Characteristics of the American Indian Population, 1990
|
Population |
Population Size |
Median Age |
Sex Ratio 25-34 |
Family Size |
Poverty Rate |
Unemp. Rate |
Female LFP Ratea |
|
Total U.S. |
248,710,000 |
33.0 |
100.1 |
3.2 |
13.1 |
6.3 |
56.8 |
|
U.S. Indian |
1,959,234 |
26.9 |
103.4 |
3.6 |
31.0 |
14.4 |
55.1 |
|
Reservation |
437,358 |
22.4 |
94.5 |
4.2 |
50.7 |
25.6 |
45.1 |
|
Oklahoma TJSA |
200,789 |
26.4 |
94.7 |
3.4 |
29.8 |
12.4 |
51.9 |
|
Alaska NVSA |
47,244 |
23.1 |
111.2 |
4.3 |
26.8 |
24.5 |
48.3 |
|
Navajo |
123,944 |
22.0 |
92.6 |
4.6 |
56.5 |
29.9 |
38.5 |
|
Pine Ridge |
10,455 |
18.9 |
103.5 |
4.9 |
66.0 |
32.6 |
42.7 |
|
Fort Apache |
9,825 |
21.3 |
96.5 |
4.6 |
52.7 |
35.3 |
45.7 |
|
Gila River |
9,116 |
22.7 |
87.7 |
4.1 |
64.4 |
30.6 |
35.5 |
|
Papago |
8,480 |
24.2 |
97.1 |
4.0 |
65.7 |
23.4 |
32.7 |
|
San Carlos |
7,110 |
21.4 |
92.7 |
4.6 |
62.5 |
31.0 |
29.4 |
|
Zuni Pueblo |
7,073 |
24.1 |
100.1 |
5.0 |
52.5 |
13.8 |
65.2 |
|
Hopi |
7,061 |
25.9 |
110.1 |
4.4 |
49.4 |
26.8 |
44.8 |
|
Blackfoot |
7,025 |
22.8 |
89.1 |
4.0 |
50.1 |
31.1 |
53.2 |
|
Rosebud |
6,883 |
18.6 |
98.1 |
4.4 |
56.6 |
27.3 |
44.6 |
|
a LFP = labor force participation. SOURCES: U.S. Bureau of the Census (1992a:Tables 1, 3, 5, and 6; 1992b:Tables 16, 23, and 40; 1993a:Tables 4, 5, and 9; 1993b:Tables 2, 3, and 44). |
|||||||
chapter are to provide some contextual information about these different groups that can aid in interpreting differences in family patterns and to introduce evidence that might be related to these differences.
The U.S. Indian population includes all individuals who identified themselves or were identified by a respondent in their households as American Indians, Eskimo, or Aleuts on the ''race" question in the census. The reservation Indian population includes all of the first category who resided on an American Indian reservation or trust land as defined by the federal or a state government. The Oklahoma TJSA population includes all American Indians who live in areas delineated by federally recognized tribes in Oklahoma without reservations (only the Osage in Oklahoma officially have a reservation), for which the Census Bureau tabulates data. The population of the Alaska NVSA includes American Indians, Eskimo, or Aleuts residing in tribes, bands, clans, groups, villages, communities, or associations in Alaska that are recognized pursuant to the Alaska Native Claims Settlement Act of 1972, Public Law 92-203.2
Each of these populations is diverse. The U.S. Indian population, for example, contains individuals who have lived on isolated reservations for their entire lives and those whose families left their traditional tribal areas two or more generations ago. The population residing on reservations includes individuals who live on reservations where most of the other residents are Indians and those who live on reservations where the majority of the population is non-Indian. The Oklahoma TJSAs include those of tribes, such as the Cherokee and Choctaw, that were removed to Oklahoma in the 1830s, along with those of tribes, such as the Comanche and Kiowa, that have been in parts of Oklahoma for hundreds of years. The Alaska NVSAs include Indian, Eskimo, and Aleut areas, containing several distinct cultural groups.
To examine some groups that are more homogeneous, we also look at the ten largest reservations in the United States. These range in size from the Navajo reservation, which contains over one-quarter of the total U.S. reservation population, to the Blackfoot reservation, with a population of 7,025.
As one can see from Table 9-1, the American Indian population differs substantially from the total U.S. population in many respects. The U.S. Indian population is younger, poorer, and more likely to be unemployed and has larger families on average than does the U.S. population in general. This is especially true of the reservation population, whose
median age is over 10 years younger than that of the general U.S. population, whose poverty and unemployment rates are close to four times higher, and whose average family size is one full person larger.
The lower median age among American Indians reflects their higher fertility and mortality rates, as discussed elsewhere in this volume. In addition, a population with a lower median age than that of another probably has a higher proportion of adult women in younger age groups, which may well affect differences in marital patterns across populations. Poverty and unemployment represent obvious disadvantages. In addition, larger families have more difficulty making ends meet, other things being equal (Blake, 1989; Sandefur and Sakamoto, 1988; Sweet and Bumpass, 1987).
Each of the ten largest reservations has its own set of distinctive characteristics. The Navajo reservation is located in three states—Arizona, New Mexico, and Utah—and the Zuni Pueblo is in both Arizona and New Mexico. Pine Ridge and Rosebud are Sioux reservations in South Dakota, and the Blackfoot reservation is in Montana. The other reservations are in Arizona. Fort Apache and San Carlos are Apache reservations; Gila River contains the Pima and Maricopa; the Papago have expressed an official preference to be known as the T'Ohono Odham. The populations of these reservations are characterized by their youthfulness, large families, and extraordinarily high poverty and unemployment rates.
Previous research suggests that the characteristics shown in Table 9-1 may very well be connected with the family patterns described below. The median age, poverty rate, and unemployment rate both reflect and affect fertility, marriage, and family patterns among the different segments of the American Indian population, including the reservations. Poor and unemployed individuals are less likely to marry and more likely to divorce (Cherlin, 1992). Consequently, variations in poverty and unemployment across different populations are generally associated with differences in family patterns.
In addition, the sex ratio and the rate of female labor force participation are likely associated with family patterns. The sex ratio—the ratio of men to women—for individuals aged 25-34 is higher for the U.S. Indian population and considerably higher for the Alaska NVSAs than it is for the U.S. population in general. But it is lower for the reservation Indian population and the Oklahoma TJSAs than for the U.S. population in general. Among the reservations, the sex ratio ranges from 87.7 on the Gila River reservation to 110.1 on the Hopi reservation. The sex ratio varies significantly across these reservations.
Table 9-1 displays differences in women's labor force participation across segments of the American Indian population. The female labor force participation rates are very similar for the general U.S. population
and the U.S. Indian population, but considerably lower on the reservations. Among the reservations, the rate of labor force participation ranges from 29.4 percent on the San Carlos reservation to 65.2 percent in the Zuni Pueblo.
Selected Features Of American Indian Families
Children Living with Two Parents
The data from the U.S. census provide us with a "snapshot" of family life that allows us to determine whether children were living with two parents at the time the census was taken, although the data do not permit us to know how long the child has lived with these two parents.3 But differences across population subgroups on this criterion are good indicators of differences in exposure to single parenthood during childhood.
Table 9-2 shows the percentage of children under 18 residing with two parents. This number has been declining for the U.S. Indian population over the past two decades in a pattern similar to the well-known pattern for the general U.S. population. In 1990, just over one-half of American Indian children under 18 lived with two parents, compared with 70 percent of all U.S. children. Fewer than one-half of children on reservations were residing with two parents, while the percentages of children living with two parents in the Oklahoma TJSAs and the Alaska NVSAs were higher than for the national Indian population.
The ten largest reservations in 1990 varied considerably in the percentage of children who resided with two parents. Among the Navajo, approximately 57 percent of children under 18 lived with two parents in 1990, while on the Pine Ridge reservation, just over 35 percent did so. Yet the proportion of children under 18 who lived with two parents was lower on all of the reservations than it was among the U.S. population, and was less than 50 percent on many of the reservations.
Should we be concerned about the prevalence of single-parent families among American Indians? Certainly, the functioning of a child's family is an important factor in the chances that child will have in later life. As Zill and Nord (1994:1) point out, "Among the functions families are expected to fulfill are providing for the basic physical needs of their members, including food, clothing, and shelter; teaching children right from wrong, to respect the rights of others, and to value other social
TABLE 9-2 Percentage of Children Under 18 Residing with Two Parents
|
Population |
1970 |
1980 |
1990 |
|
Total U.S. |
82.1 |
76.7 |
70.2 |
|
U.S. Indian |
68.6 |
62.9 |
54.4 |
|
Reservation |
|
|
48.8 |
|
Oklahoma TJSA |
|
|
65.8 |
|
Alaska NVSA |
|
|
60.8 |
|
Navajo |
|
|
57.2 |
|
Pine Ridge |
|
|
35.2 |
|
Fort Apache |
|
|
55.1 |
|
Gila River |
|
|
35.8 |
|
Papago |
|
|
37.1 |
|
San Carlos |
|
|
53.8 |
|
Zuni Pueblo |
|
|
47.2 |
|
Hopi |
|
|
42.6 |
|
Blackfoot |
|
|
53.2 |
|
Rosebud |
|
|
37.1 |
|
SOURCES: U.S. Bureau of the Census (1973a; 1973b:Table 54; 1983b:Tables 100 and 141; 1992a:Table 6; 1992b:Tables 37 and 41). |
|||
institutions; and monitoring and supervising children in their daily activities to protect them from harm and to ensure that they behave according to the rules of society." Family structure affects the ability of families to fulfill these key functions and thus affects the well-being of children (Hernandez, 1993).
One aspect of family structure that is associated with how well families are able to do their jobs is whether the family has two parents. In examining the consequences of growing up in a single-parent family, McLanahan and Sandefur (1994) show that the benefits children receive from their families depend in part on whether one or both parents are present. When one parent is forced or voluntarily chooses to be a sole parent, children suffer.
Information from the census, the Current Population Surveys, and other data show clearly that one-parent families have considerably fewer economic resources than two-parent families. In 1993, approximately 35.6 percent of families headed by single mothers had incomes below the poverty line, as compared with 6.5 percent of families headed by two parents (U.S. Bureau of the Census, 1995). Not all of the difference in income is due to the consequences of divorce or a decision to bear a child out of wedlock. But our research and that of other social scientists has
clearly shown that divorce and out-of-wedlock childbearing do substantially reduce the income of custodial parents relative to what it would be if they were married. A number of factors create this situation. Among them is that many noncustodial fathers do not pay adequate child support.
The absence of a parent also leads to lower access to parental resources . Fathers who live in separate households see their children less frequently. Interacting with a former spouse and maintaining a relationship with a child who lives in another household can be very difficult and painful. Many fathers respond by reducing the amount of time they spend with their children or disengaging completely (Wallerstein and Kelly, 1980). Family disruption also alters the mother-child relationship. Most single mothers are forced to fill multiple roles simultaneously, without adequate support. Some experience high levels of stress and become anxious and depressed (McLoyd and Wilson, 1991; McLeod and Shanahan, 1993; Hetherington et al., 1978). This can lead to inconsistent and ineffective parenting.
Finally, residing in a one-parent family can lower access to community resources. This occurs partially through income: families with more income can afford to live in communities with better facilities, such as day-care centers, schools, parks, and community centers. Another reason for the connection between family structure and community resources is the higher residential and geographical mobility of children with divorced and separated parents relative to those with two parents (McLanahan, 1983; Haveman et al., 1991; Speare and Goldscheider, 1987). When parents and children live in a community for a long time, they develop close ties that provide emotional support, as well as information about the broader community. When a family moves from town to town or from neighborhood to neighborhood, these ties are undermined and often destroyed.
In sum, then, research suggests that family structure affects the economic, parental, and community resources available to children. The availability of these resources in turn affects direct measures of child and later adult well-being, such as social and emotional adjustment, educational attainment, family formation, and labor force participation.
The data from the census do not allow us to examine in a careful manner the impact of residing in a single-parent family on the economic, parental, and community resources available to children. If, however, living with two parents is an advantage for children, then American Indians are less likely on average to have this advantage.
Possible Factors Associated with the Prevalence of Single-Parent Families
Among the trends associated with the increasing proportion of children living with single parents are the increasing percentages of women who have never married and who are divorced. These increases, in turn, appear to be associated with the growing economic independence of women, due primarily to increased labor force participation, changes in attitudes and values about out-of-wedlock childbearing, and the declining economic situation of men (Cherlin, 1992; McLanahan and Sandefur, 1994). These trends that have affected the U.S. population in general have probably also affected the American Indian population.
No research has explored carefully the factors that might account for Indian and white differences in family patterns. Wilson and Neckerman (1986), Bennett et al. (1989), Mare and Winship (1991), and Cherlin (1992) explore some of the factors that might account for the differences in family patterns among blacks and whites. Among the factors that seem to be involved are a tighter marriage squeeze (ratio of men to women, taking into account the usual difference in the average ages of brides and grooms), the lower employment prospects for black men relative to white men, differences in the meaning of marriage as an institution among blacks and whites, and the continuation of historical patterns that date back at least to the turn of the century. As a group, these factors do not completely account for black/white differences or for changes in the black and white patterns over time. According to Cherlin (1992:112), "The evidence is inconclusive and has been read differently by people with different points of view." Moreover, the experiences of Indians are as different from those of blacks as from those of whites; for example, the rate of intermarriage for Indians is much higher than for either whites or blacks. Thus explorations of black and white differences in family patterns are not necessarily a good guide for the exploration of white and Indian differences.
A detailed examination of the factors associated with white/Indian differences in family patterns would require more work than is possible to summarize in this chapter. Moreover, such an examination would be complicated by the difficulty of examining trends over time among a population growing rapidly as a result of changes in self-identification; the lack of data on the marriage squeeze; and the lack of data on attitudes toward marriage, divorce, and childbearing among American Indians. Nonetheless, it is possible to describe some of the characteristics of the American Indian population that might be associated with the above-described
patterns in percentage of children residing with two parents, including marriage and divorce.4
Women Who Have Never Married
Cherlin (1992) describes the trends in the percentage of U.S. men and women aged 20-24 who have never married for the period 1890 through 1990. These percentages changed very little between 1890 and 1940, declined from 1940 to 1960, and have increased since then. In 1990, however, they were at a level similar to that in 1890. If the increase continues during the 1990s, we will reach historic highs in the percentages of people aged 20-24 who have never married.
Most women eventually marry—historically, over 90 percent of women in each cohort. Projections for those born during the baby boom, however, suggest that under 90 percent of these women will ever marry (Cherlin, 1992; Schoen, 1987). Nonetheless, it is important to bear in mind that it is a delay in age at marriage more than a decline in the percentage who every marry that primarily accounts for the increase in the percentage of never-married women at the early adult ages.
Figure 9-1 displays trends in the percentages of American Indian and all U.S. women aged 25-34 who have never married. This is an older age group than that used by Cherlin. The U.S. trend shows the familiar pattern of a decline in this percentage through 1960 and an increase since then, especially during the most recent two decades. The curve for the U.S. Indian population shows that in 1940, a smaller percentage of Indian women than of all U.S. women had never married, but that this relationship had reversed by 1960. (The percentage of American Indians aged 25-34 who had never married in 1950 is not available in census publications.) The increase in the percentage for American Indians was not as dramatic in the 1970s as it was for all women, but it was larger in the 1980s than for all women.
One must be very cautious about interpreting these trends because of changes in census enumeration procedures and self-identification over
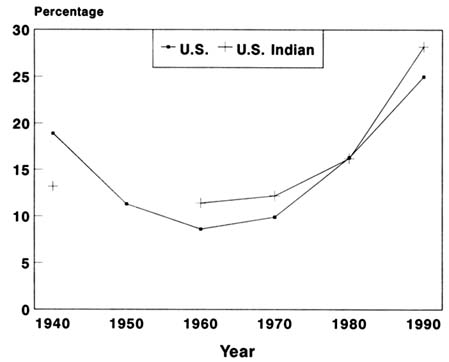
FIGURE 9-1 Percentage of women aged 25-34 who have never married. SOURCES: U.S. Bureau of the Census (1992b:Table 34; 1983b:Tables 100 and 121; U.S. 1973a:Tables 2 and 3; 1973b:Tables 89 and 203; 1963:Table 20; 1953:Table 102; 1943:Table 4).
time, but the fact that the percentage was lower for American Indian women than for white women in 1940, yet higher than for white women in 1960, does match the historical pattern for the nonwhite population in general (Cherlin, 1992).
Because of limitations in the published data, we shift from an age-specific rate to the general rate and look at women aged 15 and over to compare different segments of the Indian population. According to Table 9-3, a higher percentage of women on reservations and in the Alaska NVSAs have never married relative to those in the U.S. Indian population and all women. A smaller percentage of women in the Oklahoma TJSAs have never married relative to all women. A portion of these differences is undoubtedly due to the substantially lower median age on the reservations (22.4) and in the Alaska NVSAs (23.1) than among the other groups (e.g., 33.0 among U.S. women) (see Table 9-1).
TABLE 9-3 Percentage of Women Aged 15+ Who Were Never Married, 1990
|
Population |
Percentage |
|
United States |
23.4 |
|
U.S. Indian |
29.7 |
|
Reservation |
37.1 |
|
Oklahoma TJSA |
21.7 |
|
Alaska NVSA |
35.6 |
|
Navajo |
37.2 |
|
Pine Ridge |
43.5 |
|
Fort Apache |
35.2 |
|
Gila River |
44.1 |
|
Papago |
52.0 |
|
San Carlos |
34.0 |
|
Zuni Pueblo |
31.3 |
|
Hopi |
35.0 |
|
Blackfoot |
32.8 |
|
Rosebud |
40.7 |
|
SOURCES: U.S. Bureau of the Census (1992a:Table 6; 1992b:Table 34). |
|
We also see that the percentage of women on the ten largest reservations aged 15 and over who had never married was higher than that for the U.S. population. The numbers range from a low of approximately 31 percent on the Zuni reservation to a high of 52 percent on the Papago reservation. All of these figures are above the percentage for all women in the United States (23.4). The median ages of the Zuni (24.1) and Papago (24.2) reservations are relatively the same, but the poverty and unemployment rates are higher on the Papago than on the Zuni reservation. In addition, the sex ratio is slightly more favorable in the Zuni Pueblo than among the Papago (see Table 9-1).
Unfortunately, we do not know very much about the historical patterns of marriage on these specific reservations, so it is not clear whether these figures represent new or continuing patterns of delayed marriage and/or permanent single status. Also, we do not have the appropriate data to examine what accounts for the variation across segments of the national Indian population or differences among the ten largest reservations. We can speculate on some possibilities. First, the marriage market may differ significantly across the reservations in ways that are only partially reflected in the descriptive data on the median age, sex ratio, and economic situations of young men and women. Second, the differences
may be due to cultural norms and values regarding the institution of marriage, issues we do not explore here.
Divorce
Cherlin (1992:20-22) summarizes the changes in the divorce rate (proportion of marriages that end in divorce) that have taken place in the United States since 1860. The rate has been rising since the middle of the nineteenth century, with a smaller increase than expected from 1950 to 1960, but a sharp rise from the early 1960s to 1979. The divorce rate declined slightly in the 1980s, but nevertheless is currently higher than predicted by the long-term trend. Nationwide events show a clear effect on the divorce rate: it has increased temporarily after every major war and was lower during the depression of the 1930s.
It is impossible to compare trends in the proportion of marriages that end in divorce for whites and Indians because of the lack of racial identification in marriage and divorce records. What we can do is examine the percentage of women among the American Indian and U.S. populations who are divorced. To reiterate, this is not the same as the percentage of marriages that end in divorce. Such figures are sensitive not only to the proportion of marriages that end in divorce, but also to the marriage and remarriage rates. Figure 9-2 shows the percentage of women aged 14+ or 15+ who were divorced for the years 1940 through 1990. In 1940, a very small percentage of women by contemporary standards were divorced. This figure was slightly higher for American Indians than for the U.S. population in general. The percentage of women divorced has increased steadily since then, and the gap between American Indians and whites has widened since 1960. The combination of an increased proportion of women who have never married and a higher percentage of women who have been divorced helps explain why more American Indian children reside with a single parent.
Table 9-4 shows the percentages of women aged 15+ who were divorced as of 1990 for different segments of the American Indian population. The percentage divorced is the same for Indians on reservations as for the total population of women, and lower for those in Alaska NVSAs. On the other hand, the percentage is higher among Indian women in the Oklahoma TJSAs than among women in general.
The reservations with the highest percentages of divorced women (Pine Ridge and Rosebud) also have the third and fourth highest percentages of women never married (see Table 9-3), and this helps explain the low percentage of children residing with two parents on these reservations (see Table 9-2). In contrast, the Papago reservation has a low general divorce rate, but this is accompanied by the highest percentage of women
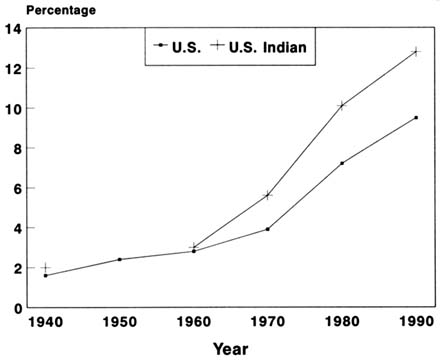
FIGURE 9-2 Percentage of women aged 14+ or 15+ who are divorced.
SOURCES: U.S. Bureau of the Census (1992b:Table 34; 1983a:Table 46; 1973b:Table 203; 1973a:Table 5; 1964:Tables 49 and 177; 1963:Table 10; 1943:Table 4).
never married, which leads in turn to a low percentage of children residing with two parents. And the Navajo reservation has a low divorce rate, is intermediate in the percentage never married, and has the highest percentage of children residing with two parents. In sum, several combinations of factors can result in lower percentages of children residing with two parents.
Interracial Marriage
Intermarriage between whites and Indians in the United States has a long history (Sandefur and McKinnell, 1986). Practical political and economic reasons have promoted marriages between whites and Indians. Prior to the decision of the U.S. government in the early 1800s to ''remove" most of the Indians who were east of the Mississippi to western areas, intermarriage facilitated good relations between Indians and whites. The French were reputed to have no aversion to marrying Indians
TABLE 9-4 Percentage of Women Aged 15+ Who Were Divorced, 1990
|
Population |
Percentage |
|
United States |
9.5 |
|
U.S. Indian |
12.8 |
|
Reservation |
9.5 |
|
Oklahoma TJSA |
12.4 |
|
Alaska NVSA |
5.6 |
|
Navajo |
5.6 |
|
Pine Ridge |
12.4 |
|
Fort Apache |
10.0 |
|
Gila River |
8.7 |
|
Papago |
5.8 |
|
San Carlos |
9.0 |
|
Zuni Pueblo |
6.8 |
|
Hopi |
8.9 |
|
Blackfoot |
9.5 |
|
Rosebud |
14.5 |
|
SOURCES: U.S. Bureau of the Census (1992:Table 6; 1992b:Table 34). |
|
(Lauber, 1913), and one celebrated intermarriage in the colony of New York involving a prominent white man and a wife from the Six Nations was said to have greatly facilitated cooperation between the New York colonial government and the government of the Six Nations (Maury, 1872). Soldiers on the frontier sometimes married Indians; trappers, traders, and agents often did so. There were, in fact, some legal attempts to promote marriages between whites and Indians. In 1784, a bill was presented to the Virginia legislature providing that "every white man who married an Indian women should be paid ten pounds, and five for each child born of such a marriage; and that if any white woman married an Indian she should be entitled to ten pounds with which the county court should buy them livestock" (Beveridge, 1919:239-241). In 1824, William H. Crawford advocated similar legislation before the U.S. Congress. Neither measure became law (Beveridge, 1919).
Past federal government definitions of its Indian service population, which generally used one-quarter Indian blood as the minimum blood quantum, and contemporary tribal definitions of citizenship, which in some cases require demonstrated descent but no blood quantum, represent a response to this history of intermarriage. The proportion of the

FIGURE 9-3 Percentage of married Indians who are endogamous.
SOURCE: Calculations with Public Use Microdata Samples from the 1970, 1980, and 1990 United States censuses.
American Indian population that is the product of intermarriages with non-Indians is quite high and continues to rise (Snipp, 1989).
Figure 9-3 shows that the percentage of both Indian men and women who were exogamous increased considerably over the 20 years from 1970 to 1990. Part of this increase was probably due to the fact that American Indians who changed their self-identification to Indian during the period were more likely to be married to a non-Indian than those who kept the same identity. Our analyses with data from the 1990 public-use microdata samples show as well that younger American Indian cohorts were much more likely to be exogamous than were older cohorts of both American Indian men and women. American Indian men were more likely than American Indian women to be endogamous, i.e., to marry other American Indians.
Summary And Conclusions
Our description of American Indian families has relied largely on published data from the decennial censuses, making it a mostly quantitative exploration. Yellow Bird and Snipp (1994) and John (1988) summarize some of the ethnographic and other qualitative work on American Indian families. Most of this work has focused on specific nations or tribes, and demonstrates that there is as much variation among families and households within the American Indian population as there is between American Indians and other groups in the U.S. population. Our analysis of published census data also illustrates the variations across broad segments of the American Indian population—Oklahoma TJSAs, Alaska NVSAs, and the ten largest reservations.
Nonetheless, the data also show that the trends in marriage, divorce, and living arrangements among the American Indian population have corresponded with these trends in the general population. Over time, the percentage of children living with two parents has decreased, and the percentages of women who have never married and who have divorced have increased, just as has been the case among the U.S. population in general. At the same time, American Indian children are less likely to live with two parents than all U.S. children, and American Indian women are less likely to ever marry and more likely to divorce than are all U.S. women.
The differences are more pronounced on some of the reservations. On the Pine Ridge reservation, for example, 35.2 percent of children lived with two parents, compared with 70.2 percent of all U.S. children; 43.5 percent of women aged 15+ had never married, compared with 23.4 percent of all U.S. women aged 15+; and 12.4 percent of women aged 15+ were divorced, compared with 9.5 percent of all U.S. women aged 15+. The bottom line is that American Indian women and children, especially those on reservations, are in more vulnerable social and economic situations than are all U.S. women and children.
The Oklahoma TJSA statistics for average household size and percentage of women over 15 who have never married are more similar to those for the general U.S. population in some respects than to those for the other Indian groups. But the unemployment rate for the Oklahoma TJSAs is almost twice that of the U.S. population as a whole, and the poverty rate is more than double.
The combination of statistics about the Alaska NVSAs paints an unusual picture. The sex ratio is 111.2 men per 100 women; on the other hand, a high percentage of women over 15 (36 percent) have never married. Part of this is probably due to the very low median age, 23.1, in the
Alaska NVSAs. Those who do marry stay married or remarry right away, putting the percentage of women currently divorced at a remarkably low 5.6 percent and the children living with two parents at 60.8 percent. Even though the people in the Alaska NVSAs are similar to those on reservations in their female labor force participation, large household size, and unemployment, the percentage of people in poverty in the Alaska NVSAs is about half that on reservations (26.8 compared with 50.7).
The reservation population consists of only 94.5 men per 100 women aged 25 to 34, and the median age is quite low. Men may leave the reservation to find work, but this means that 37.1 percent of women over age 15 have never married. This low incidence of marriage does not seem to hold down the average family size (4.2 people per family), but it does mean that fewer than half of children under 18 who live on reservations live with two parents. With the highest unemployment rate of any Indian group (25.6), only 45.1 percent of American Indian women on reservations bother to join the workforce. All of this is exacerbated by the overwhelmingly high poverty rates on reservations.
The variations in marriage and living arrangements for children across the segments of the Indian population and across the reservations are associated with different patterns in median age, sex ratios, female labor force participation, poverty, and unemployment. It is likely that poverty, unemployment, and unfavorable sex ratios on some reservations make marriages very difficult to begin and to maintain. Other differences in cultural norms and values regarding marriage, divorce, and childbearing across the different segments of the Indian population and among the reservations are probably also important factors in creating the differences observed in the data from the decennial censuses.
One implication for health policy of the conditions among American Indians, especially on the reservations, seems obvious. The availability of healthcare through the Indian Health Service, tribal health services, and Medicaid is likely to continue to be very important for American Indian mothers and children because they are in a particularly vulnerable social and economic situation. The levels of poverty and unemployment on some of the reservations make it virtually impossible for many of these women and children to obtain healthcare through employer-based health insurance.
This vulnerability also has implications for proposed changes in social welfare policy. The high percentage of American Indian children living with one parent, combined with high levels of poverty and unemployment, probably leads to greater reliance on Aid to Families with Dependent Children (AFDC), Food Stamps, and other forms of public assistance than is the case among the U.S. population of children. Some of the proposed changes in the AFDC program, such as caps on benefits, limits
on the amount of time a family can receive AFDC, and work requirements, are likely to be very damaging to American Indian mothers and children on reservations, where there are few alternative ways to support a family.
In the long run, improving the lives of American Indian families and children will require substantial investments in the health and education of American Indian people on and off the reservations. In addition, tribal governments, working with private industry, state governments, and the federal government, must continue their efforts to create employment opportunities on the reservations and in traditional Indian areas in Alaska and Oklahoma. Economic self-sufficiency for many Native Americans is still an impossibility in many of the most economically depressed areas.
References
Bennett, N.G., D.E. Bloom, and P.H. Craig 1989 The divergence of black and white marriage patterns. American Journal of Sociology 95:692-722.
Beveridge, A. 1919 The Life of John Marshall. Vol. 1. New York: Houghton Mifflin.
Blake, J. 1989 Family Size and Achievement. Berkeley: University of California Press.
Cherlin, A.J. 1992 Marriage, Divorce, and Remarriage. Cambridge, MA: Harvard University Press.
Haveman, R., B. Wolfe, and J. Spaulding 1991 Childhood events and circumstances influencing high school completion. Demography 23:133-158.
Hernandez, D.J. 1993 America's Children: Resources from Family, Government, and the Economy. New York: Russell Sage Foundation.
Hetherington, M., M. Cox, and R. Cox 1978 The aftermath of divorce. Pp. 148-176 in J.H. Stephens and Marilyn Matthews, eds., Mother-Child, Father-Child Relations. Washington, D.C.: National Association for the Education of Young Children Press.
Hirschfelder, A., and M.K. de Montano 1993 The Native American Almanac: A Portrait of Native America Today . New York: Prentice Hall.
John, R. 1988 The Native American Family. Pp. 325-363 in C.H. Mindel, R.W. Habenstein, and R. Wright, Jr., eds., Ethnic Families in America: Patterns and Variations. New York: Elsevier Science Publishing Co., Inc.
Lauber, A.W. 1913 Indian Slavery in Colonial Times, within the Present Limits of the United States. New York: Columbia University Press.
Mare, R.D., and C. Winship 1991 Socioeconomic change and the decline of marriage for blacks and whites. Pp. 175-202 in C. Jencks and P.E. Peterson, eds., The Urban Underclass. Washington, D.C.: The Brookings Institution.
Maury, A. 1872 Memories of a Hugenot Family. New York: Putnam.
McLanahan, S. 1983 Family structure and stress: A longitudinal comparison of maleand female-headed families. Journal of Marriage and the Family 45:347-357.
McLanahan, S., and G. Sandefur 1994 Growing Up with A Single Parent: What Hurts? What Helps? Cambridge, MA: Harvard University Press.
McLeod, J.D., and M.J. Shanahan 1993 Poverty, parenting, and children's mental health. American Sociological Review 58:351-366.
McLoyd, V.C., and L. Wilson 1993 The strain of living poor: Parenting, social support, and child mental health. Pp. 105-135 in A.C. Huston, ed., Children in Poverty: Child Development and Public Policy. New York: Cambridge University Press.
Sandefur, G.D., and T. McKinnell 1986 American Indian intermarriage. Social Science Research 15:347-371.
Sandefur, G.D., and A. Sakamoto 1988 American Indian household structure and income. Demography 25:71-80.
Schoen, R. 1987 The continuing retreat from marriage: Figures from 1983 U.S. marital status life tables. Social Science Research 71:108-109.
Snipp, C.M. 1989 American Indians: The First of This Land. New York: Russell Sage Foundation.
Speare, A.Jr., and F.K. Goldscheider 1987 Effects of marital status change on residential mobility. Journal of Marriage and Family 49:455-464.
Sweet, J., and L. Bumpass 1987 American Families and Households. New York: Russell Sage Foundation.
U.S. Bureau of the Census 1943 Sixteenth Census of the United States: 1940, Population Characteristics of the Nonwhite Population by Race. Washington, D.C.: U.S. Government Printing Office.
1953 U.S. Census of Population: 1950, Vol. 2, Characteristics of the Population, Part 1, United States Summary. Washington, D.C.: U.S. Government Printing Office.
1963 1960 Census of Population, Subject Reports, Nonwhite Population by Race: Social and Economic Statistics for Negroes, Indians, Japanese, Chinese, and Filipinos, PC(2)-1C. Washington, D.C.: U.S. Government Printing Office.
1964 1960 Census of Population, Vol. 1, Characteristics of the Population, Part 1, United States Summary. Washington, D.C.: U.S. Government Printing Office.
1973a 1970 Census of Population, Subject Report: American Indians, PC(2)-1F. Washington, D.C.: U.S. Government Printing Office.
1973b 1970 Census of Population, Vol. 1, United States Summary, Part 1. Washington, D.C.: U.S. Government Printing Office.
1983a 1980 Census of Population, Characteristics of the Population, General Population Characteristics, United States Summary, PC80-1-B1. Washington, D.C.: U.S. Government Printing Office.
1983b 1980 Census of Population, Characteristics of the Population, General Social and Economic Characteristics, United States Summary , PC80-1-C1. Washington, D.C.: U.S. Government Printing Office.
1992a 1990 Census of Population, General Population Characteristics, American Indian and Alaska Native Areas, CP-1-1A. Washington, D.C.: U.S. Government Printing Office.
1992b 1990 Census of Population, General Population Characteristics, United States, CP-1-1. Washington, D.C.: U.S. Government Printing Office.
1993a 1990 Census of Population, Social and Economic Characteristics, American Indian and Alaska Native Areas, CP-2-1A. Washington, D.C.: U.S. Government Printing Office.
1993b 1990 Census of Population, Social and Economic Characteristics, United States, 1990 CP-2-1. Washington, D.C.: U.S. Government Printing Office.
1995 Current Population Reports, Series P60-188, Income, Poverty, and Valuation of Noncash Benefits, 1993. Washington, D.C.: U.S. Government Printing Office.
Wallerstein, J.S., and J.B. Kelly 1980 Surviving the Breakup: How Children and Parents Cope with Divorce . New York: Basic Books.
Wilson, W.J., and K.M. Neckerman 1986 Poverty and family structure. Pp. 232-259 in S. Danziger and D. Weinberg, eds., Fighting Poverty. Cambridge, MA: Harvard University press.
Yellow Bird, M., and C.M. Snipp 1994 American Indian families. Pp. 179-201 in R.L. Taylor, ed., Minority Families in the United States: A Multicultural Perspective. Englewood Cliffs, NJ: Prentice Hall, Inc.
Zill, N., and C.W. Nord 1994 Running in Place: How American Families Are Faring in a Changing Economy and an Individualistic Society. Washington, D.C.: Child Trends, Inc.


