
Appendix D
Miner Studies
Data from epidemiologic studies of underground miners have played a central role in most efforts to evaluate radon risks, including those of the BEIR VI committee. The BEIR IV report reviewed epidemiologic studies of the following groups of underground miners: uranium miners in the Colorado Plateau, Czechoslovakia, Canada (Ontario, Port Radium, and Beaverlodge), and France; tin miners in Cornwall, United Kingdom, and China; iron and other miners in Sweden; fluorspar miners in Canada; and niobium miners in Norway. The BEIR IV committee based its risk model on analyses of combined data from 4 of these studies: Malmberget in Sweden, Colorado Plateau in the U.S., and Beaverlodge and Ontario in Canada.
Since publication of the BEIR IV report, additional information, including both updating of follow-up and new data analyses, has become available from several of the cohorts noted above, including the cohorts in Colorado, Czechoslovakia, France, China, Ontario, and Port Radium. Results from additional cohorts—New Mexico and Radium Hill in Australia—have also been published. These studies consistently demonstrate excess lung-cancer mortality compared with expected numbers from the general population and increasing risk with increasing exposure to radon progeny.
The recently published studies provide information on issues that could not be addressed adequately in the BEIR IV report. The study in China includes a large number of subjects exposed under the age of 20 and has provided an opportunity for examining the effect on risks of age at first exposure. The Chinese and Ontario studies have provided an opportunity to examine the effects of arsenic exposure. Six of the studies (Colorado, Sweden, China, New Mexico,
Newfoundland, and Radium Hill) include smoking data and have allowed a more effective examination of the combined effects of exposure to smoking and radon progeny. Additional years of follow-up and addition of new studies have also increased the information available on the modifying effect of age at risk, time since exposure, and time since last exposure. Finally, the studies now available include a wide range of exposure rates and have increased the information available on the modifying effect of exposure rate both within individual cohorts and in analyses of combined data from several cohorts.
Not only have new data become available, but informative statistical analyses of the data have been conducted. In most cases, investigators have modeled the hazard (age-specific risk) as a function of exposure and other variables, and this has allowed rigorous examination of the modifying effects of time-related variables, age at exposure, exposure rate, and smoking. That approach is comparable with that used by the BEIR IV committee, and many of the reports have compared findings from the study being evaluated with those predicted by the BEIR IV model. Special analyses addressing the combined effects of smoking and radon have been conducted by Thomas and others (1994), Yao and others (1994), and Moolgavkar and others (1993).
Most important, a working group of principal investigators, under the sponsorship of the U.S. National Cancer Institute (NCI), has analyzed combined data from 11 miner cohorts, including all available cohorts having at least 40 lung-cancer deaths and estimates of each participant's exposure to radon progeny (Lubin and others 1994a, 1995a). These analyses included 2,700 lung-cancer deaths in 68,000 miners, compared with 360 lung-cancer deaths in 22,200 miners included in the BEIR IV committee's analyses. Recent additional analyses of these data have provided a more-detailed examination of exposure-rate effects (Lubin and others 1995b) and of the low-exposure miner data (Lubin and others 1997).
The risk model recommended in the current report is based on analyses of data from the 11 cohorts evaluated by NCI, although for some cohorts data have been updated or modified in other ways. Although the committee chose to conduct its own analyses of these data to develop its risk model, it drew heavily on the extensive results included in the NCI report and papers noted above, particularly for addressing the modifying effects of such variables as smoking, exposure rate, age at first exposure, and time since exposure.
The purposes of this appendix are to describe the characteristics of the epidemiologic studies that were used to develop the committee's risk model and to summarize and discuss results of published analyses of data from these studies, particularly the extensive analyses conducted by NCI. Emphasis is given to information and analyses that have become available since publication of the BEIR IV report. The appendix is limited to lung-cancer risks; analyses of the miner data that address other health end points are discussed in chapter 4.
This appendix begins by providing an overall description of the characteristics of each of the 11 cohorts included in the combined analyses noted above and
then summarizes and compares the cohorts with respect to their informativeness on several issues. It then discusses both the approach and results of statistical analyses, primarily the NCI combined analyses. Analyses reported by investigators for individual studies are not discussed unless they provide insights that are not available from the combined analyses. Discussion of the statistical analysis begins with an overview, which is followed by sections on specific topics. It concludes with an overall evaluation of the analyses and risk models developed in the NCI report. Analyses conducted specifically for the BEIR VI report are described in chapter 3 and appendix A, and are not discussed here. Appendix E provides a comprehensive description of the method for exposure estimation in each study.
SUMMARY AND EVALUATION OF THE MINER COHORTS
The basic features of each of the 11 cohorts included in the NCI analyses are summarized in the text and tables of this section. The statistics presented in Tables D-1 through D-11 refer to the data used in analyses to develop the risk models for this report, which, for 7 of the cohorts, are very similar to data used in the NCI analyses, although in some cases changes in the approach used to allocate person-years resulted in minor changes from tables presented in the NCI report. For Czechoslovakia, exposures were re-evaluated and follow-up data were improved (Tomásek and Darby 1995) in the data set used for the BEIR VI analyses. Some modifications of the data were also made for China, Newfoundland, and France.
Tables D-1 through D-18 present brief descriptions of tabular information on the cohorts. For additional details on these cohorts, the reader is referred to Lubin and others (1994a) and to papers describing results from the individual studies. The cohorts are presented in descending order of number of lung-cancer deaths. In Tables D-1 through D-11, mean values are computed with person-years as weights.
The China Cohort (Table D-1)
Tin mining in the Yunnan Province in southern China dates back almost 2000 years. The China cohort consists of about 17,000 employees of the Yunnan Tin Corporation (YTC), a large nonferrous-metals industry. YTC, which was formed in 1883 and nationalized in 1949, is the largest employer in Geiju City. The NCI became involved with the health-research unit of YTC and the Cancer Institute of the Chinese Academy of Medical Sciences in the study of the China cohort in 1985. The cohort has the largest number of lung-cancer deaths. Miners were exposed to a range of exposure rates, and exposure was relatively long, being second only to the study of Swedish miners. This is the only cohort with substantial numbers of workers exposed as children, and 735 of 980 lung-cancers occurred in miners first exposed under age 20.
TABLE D-1 Summary of China cohort
|
Study site: Yunnan Province, China |
|
Type of mine: Tin |
|
Recent references: Xuan and others 1993; Yao and others 1994 |
|
Definition and identification of cohort: |
|
All participants in a 1976 occupational survey of both active and retired miners who worked in one of 5 divisions of YTC were included. The survey included all employees within these 5 units, which were responsible for all underground mining activities. |
|
Methods for follow-up and ascertainment of lung-cancer deaths: |
|
Vital status was determined from YTC medical, payroll, and retirement records. Lung-cancer deaths were ascertained from a YTC-operated cancer registry. Because YTC compensates lung-cancer cases and their families, ascertainment is considered to be complete. |
|
Number of exposed miners in cohort: 13,649 |
|
Number of exposed person-years: 134,842 |
|
Average cumulative exposure: 286.0 WLM |
|
Average duration of exposure: 12.9 years |
|
Average exposure rate: 1.7 WL |
|
Period of follow-up: 1976–1987 |
|
Average length of follow-up: 10.2 years |
|
Average year of first exposure: 1955.6 |
|
Average age at first exposure: 18.8 years |
|
Number of exposed lung-cancer deaths: |
|
Total: 936 |
|
Cumulative exposure < 100 WLM: 72 (7.7%) |
|
Cumulative exposure < 50 WLM: 33 (3.5%) |
|
Average exposure rate < 0.5 WL: 9 (1.0%) |
|
Other special characteristics of cohort: |
|
A substantial proportion were under age 20 at the start of exposure (73% of lung-cancers occurred in those first exposed under age 20). The exposure duration was much longer than the average of 5.7 for all cohorts. |
|
Available data on smoking: |
|
Data on tobacco use, including cigarettes and bamboo water pipes, are available from 1976 survey but missing for 24% of survey participants. Information on duration and amount smoked is incomplete. |
|
Available data on other mining exposures: |
|
Cumulative arsenic in mg/months/m3—based on measurements from the 1950s. |
|
Miners were assumed exposed to arsenic 7 h/d and above-ground workers 8 h/d. |
|
Results of NCI analyses: |
|
Estimated ERR/exposure = 0. 16% after adjustment for arsenic exposure. |
|
No evidence of nonlinearity in dose-response relation. |
|
Significant decrease in ERR/exposure with increasing attained age, decreasing exposure duration, increasing average exposure rate, and increasing time since last exposure. |
|
Significant variation of ERR/exposure with categories of age at first exposure, but pattern was not consistent. |
|
Special problems: |
|
Difficulties were encountered in linking cases with survey forms because of removal of forms from files, but this difficulty is thought to have been resolved satisfactorily. |
|
Special analyses: |
|
Combined effects of smoking and radon exposure are addressed in analyses by Yao and others (1994). |
The Czech Cohort (Table D-2)
Metal mining in western Bohemia has been carried on since the 15th and 16th centuries, and the study of miners who began mining between 1948 and 1957 (know as the "S cohort") was initiated in 1970. The first results were published in 1972, making it one of the first miner studies to report findings; several updates have been published. As noted in Table D-2, most analyses have focused on the S cohort. The Czech cohort includes a wide range of exposure levels.
TABLE D-2 Summary of Czech cohort
|
Study site: Western Bohemia, Czech Republic |
|
Type of mine: Uranium |
|
Recent references: Sevc and others 1988, 1993; Tomásek and others 1993, 1994a,b |
|
Definition and identification of cohort: |
|
Most analyses, including NCI analyses, have focused on the "S cohort," which consists of uranium miners who started working in western Bohemia in 1948–1957. Sevc and others (1988) also evaluated additional workers, including miners who started working in middle Bohemia in 1968–1975, iron miners, and burnt-clay miners; these additional workers had much lower cumulative exposures than the early uranium miners and were not included in the NCI analyses. |
|
Methods for follow-up and ascertainment of lung-cancer deaths: |
|
Both vital status and disease outcome were established from the population registry at the Ministry of Interior, examination of district death-registry records, oncologic notification records that were maintained by the Ministry of Health, and pathology records at district hospitals. |
|
Number of exposed miners in cohort: 4,320 |
|
Number of exposed person-years: 102,650 |
|
Average cumulative exposure: 196.8 WLM |
|
Average duration of exposure: 6.7 years |
|
Average exposure rate: 2.8 WL |
|
Period of follow-up: 1952–1990 |
|
Average length of follow-up: 25.2 years |
|
Average year of first exposure: 1951.0 |
|
Average age at first exposure: 30.1 years |
|
Number of exposed lung-cancer deaths: |
|
Total: 701 |
|
Cumulative exposure < 100 WLM: 73 (10%) |
|
Cumulative exposure < 50 WLM: 11 (1.6%) |
|
Average exposure rate < 0.5 WL: 0 (0.0%) |
|
Available data on smoking: |
|
No information is available on the cohort analyzed at NCI. |
|
Available data on other mining exposures: |
|
No specific data are available, but Tomásek and others (1994a) Note that miners were potentially exposed to arsenic and that miners who worked in the Jachymov mine were exposed to much higher levels of arsenic than those who worked in other mines. Data indicating how long mine workers were employed in various specific mines were available to Tomásek and others (1994a). |
|
Results of NCI analyses: |
|
Estimated ERR/exposure = 0.34% (0.2–0.6%) |
|
Some evidence of nonlinearity in dose-response relation with decrease in risks at highest cumulative exposures. |
|
Significant decrease in ERR/exposure with increasing attained age, decreasing exposure duration, increasing average exposure rate, decreasing age at first exposure, and increasing time since last exposure. |
|
Special studies: |
|
Sevc and others (1988) reported increased incidence of basal cell carcinoma of skin. |
|
Special analyses: |
|
Tomásek and others (1993) examined mortality from cancer other than lung-cancer (see chapter 4) |
|
Additional results: |
|
Sevc and others (1988) did not find evidence of significantly increased risks in the recent uranium miners (initially exposed 1968 and later), but risks were compatible with those obtained from the more highly exposed early workers. Statistically significant excess risks were observed in both iron and burnt-clay miners, and their experience was also comparable with that of the early uranium miners (S cohort). Sevc and others (1988) also conducted analyses of specific cell types. |
|
Tomásek and others (1994a) found that the ERR/exposure was significantly larger for miners who worked more than 20% of their employment period in the Jachymov mine; arsenic exposure is a possible explanation for this finding. Tomásek and others also found no evidence of an exposure-rate effect in analyses that excluded miners who ever experienced exposure rates exceeding 10 WL; however, these analyses excluded large numbers of miners with modest average exposure rates, and lack of power might partially explain this finding. |
|
Analyses by Tomásek and others (1994a) were based on exposure and follow-up data that had been improved over those used in earlier analyses, including the NCI analyses. The exposure revision involved correcting previous errors, estimating exposure for each month in each man's employment history, and taking account of exposures received in other mines. Improvements in follow-up, described by Tomásek and others (1994b), increased the numbers of persons who had died from lung-cancer available for study. The overall ERR/exposure estimate based on the revised data was 0.61%, compared with 0.37% based on the earlier data. |
The Colorado Plateau Cohort (Table D-3)
The study of uranium miners in the Colorado plateau is one of the earliest studies to document excess lung-cancer rigorously; initial findings were published in the 1960's. The study was established by the U.S. Public Health Service, and cohort follow-up is now conducted by the U.S. National Institute for Occupational Safety and Health. Mining in the Colorado plateau—including parts of Arizona, Colorado, New Mexico, and Utah—expanded rapidly in the late 1940s, but by 1970 many mines had closed. Exposure rates for this cohort were relatively high, and this cohort has both the highest mean exposure and highest
TABLE D-3 Summary of the Colorado cohort
|
Study site: Colorado Plateau, United States |
|
Type of mine: Uranium |
|
Recent references: Hornung and Meinhardt 1987; Moolgavkar and others 1993; Thomas and others 1994 |
|
Definition and identification of cohort: |
|
Workers in Arizona, Colorado, New Mexico, and Utah who had completed at least 1 month of underground uranium mining, who volunteered for at least one medical examination between 1950 and 1960, and who provided personal and occupational data of sufficient detail for follow-up and for exposure estimation. Another 115 workers were also included but included only once in the joint analysis; these workers were retained for separate NCI analyses of the Colorado cohort, but included only once in joint analyses. Most NCI analyses were restricted to the portion of the data with cumulative exposure less than 3,200 WLM, and the statistics below are also based on this restriction. |
|
Methods for follow-up and ascertainment of lung-cancer deaths: |
|
Vital status was ascertained from records of mining companies, state vital-statistics offices, the U.S. Social Security Administration, the Internal Revenue Service, and the Veterans Administration; from the National Death Index; and by direct contact. Cause of death was determined from state death certificates. |
|
Number of exposed miners: 3,347 |
|
Number of exposed person-years: 79,556 |
|
Average cumulative exposure: 578.6 WLM |
|
Average duration of exposure: 3.9 years |
|
Average exposure rate: 11.7 WL |
|
Period of follow-up: 1950–1990 |
|
Average length of follow-up: 26.3 years |
|
Average year of first exposure: 1953.0 |
|
Average age at first exposure: 31.8 years |
|
Number of exposed lung-cancer deaths: |
|
Total: |
|
Cumulative exposure < 3,200 WLM: 334 |
|
Cumulative exposure < 100 WLM: 20 (6.0%) |
|
Cumulative exposure < 50 WLM: 13 (3.9%) |
|
Average exposure rate < 0.5 WL: 0 (0.0%) |
|
Available data on smoking: |
|
Data were obtained from annual censuses of miners and from mail questionnaires on 1–4 occasions from 1950 to 1960, and at other times from 1963 to 1969. Data have been updated more recently but results were unavailable. |
|
Available data on other mining exposures: |
|
Information on number of years previously worked in hard-rock mines and estimates of total WLM received in these mines were available. |
|
Results of NCI analyses: |
|
Estimated ERR/exposure = 0.42% (0.3–0.7%). |
|
Evidence of nonlinearity in dose-response relation when all data included; consistent with linearity when analyses were restricted to cumulative exposures not exceeding 3,200 WLM, as in NCI analyses. |
|
Significant decrease in ERR/exposure with increasing attained age, decreasing exposure duration, increasing average exposure rate, and increasing time since exposure. No evidence of modification by age at first exposure. |
TABLE D-3 Summary of the Colorado cohort
|
Special analyses: |
|
Thomas and others (1994) used a case-control approach to investigate the joint effects of smoking and radon exposure. Their analyses also included consideration of the detailed exposure-rate history. Moolgavkar and others (1993) applied biologically based 2-stage clonal expansion model to the Colorado data. |
average exposure rate (nearly the same as that of Port Radium) of the 11 cohorts evaluated here. The cohort contributes almost no direct information on effects of exposure at low exposure rates (< 1 WL).
The Ontario Cohort (Table D-4)
The Ontario cohort used in the NCI analyses includes only uranium miners, although the complete cohort includes those engaged in other types of mining (gold, nickel, and copper) in the province of Ontario. Uranium mines began operation in 1955 and continued into the early 1960s. The cohort includes some workers who had previously worked in gold mines. The first findings of the Ontario study were published in 1981. This cohort has the largest number of workers, and makes the strongest contribution of the 11 cohorts to estimation of effects at lower cumulative exposures and exposure rates. The average exposure rate is one of the lowest, along with those of Sweden, Beaverlodge, Radium Hill, and France.
TABLE D-4 Summary of the Ontario cohort
|
Study site: Ontario, Canada |
|
Type of mine: Uranium |
|
Recent references: Muller and others 1984; Kusiak and others 1991, 1993. |
|
Definition and identification of cohort: |
|
The cohort included miners who attended required miners' chest clinics from January 1 1955, to December 31, 1984, and who had been employed for a minimum of 60 months in dusty jobs in a nonuranium mine or for a minimum of 2 weeks in a uranium mine. Miners who had also worked in mines outside Ontario, females, and men with missing dates of birth were excluded. |
|
Methods for follow-up and ascertainment of lung-cancer deaths: |
|
Vital status and cause of death were determined for 1955–1986 by searching the Mortality Database of Statistics, Canada. |
|
Number of exposed miners in cohort: 21,346 |
|
Number of exposed person-years: 300,608 |
|
Average cumulative exposure: 31.0 WLM |
|
Average duration of exposure: 3.0 years |
|
Average exposure rate: 0.9 WL |
|
Period of follow-up: 1955–1986 |
|
Average length of follow-up: 17.8 years |
|
Average year of first exposure: 1963.8 |
|
Average age at first exposure: 26.4 years |
|
Number of exposed lung-cancer deaths: |
|
Total: 285 |
|
Cumulative exposure < 100 WLM: 225 (79%) |
|
Cumulative exposure < 50 WLM: 174 (61%) |
|
Average exposure rate < 0.5 WL: 100 (35%) |
|
Available data on smoking: |
|
Data from several surveys are available. Beginning in 1976, each miner's smoking history was recorded when he made his annual visit to a chest clinic; in 1990–1991, a questionnaire was sent to all miners in Ontario whose addresses could be found. |
|
Available data on other mining exposures: |
|
Estimates of total radon-progeny exposure and arsenic exposure from gold mining are available. Miners with known exposure to asbestos or radon-progeny outside Ontario were excluded, but many Ontario uranium miners had previously worked in gold mines. |
|
Results of NCI analyses: |
|
Estimated ERR/exposure = 0.89% (0.5–1.5%) |
|
No evidence of nonlinearity in dose-response relation. |
|
Significant decrease in ERR/exposure with increasing average exposure rate. No evidence of effect modification by attained age, exposure duration, time since exposure, or age at first exposure. |
|
Special analyses: |
|
A report by Muller and others (1984) included evaluation of risks of cancers other than lung-cancer. A report by Kusiak and others (1993) included evaluation of smoking data and of specific cell types of lung-cancer. |
The Newfoundland Cohort (Table D-5)
Underground mining of fluorspar in St. Lawrence, Newfoundland, began in 1936 and continued until 1978. The average exposure rate is high, and the cohort has the second highest mean WLM.
The Swedish Cohort (Table D-6)
The Swedish cohort includes iron miners in Malmberget, Sweden, located above the Arctic circle. The study includes some who began mining as early as 1897. This is an older cohort with the longest mean duration of exposure of the 11 cohorts. The average exposure rate is the lowest of the 11 cohorts, and this cohort makes a strong contribution to the estimation of effects at lower exposure rates.
The New Mexico Cohort (Table D-7)
New Mexico was a leading producer of uranium from the 1960s through the 1980s, and the New Mexico cohort is the most recently employed miner cohort in
TABLE D-5 Summary of the Newfoundland cohort
|
Study site: Newfoundland, Canada |
|
Type of mine: Fluorspar |
|
Recent references: Morrison and others 1988. |
|
Definition and identification of the cohort: |
|
Men who were employed by one of 2 local mining companies from 1933 to 1978 and who had adequate personal identifying information were included. |
|
Methods for follow-up and ascertainment of lung-cancer deaths: |
|
Vital status and cause of death were determined for the years 1950–1984 by searching the Mortality Database of Statistics, Canada. |
|
Number of exposed miners: 1,751 |
|
Number of exposed person-years: 33,795 |
|
Average cumulative exposure: 388.4 WLM |
|
Average duration of exposure: 4.8 years |
|
Average exposure rate: 4.9 WL |
|
Period of follow-up: 1950–1984 |
|
Average length of follow-up: 23.3 years |
|
Average year of first exposure: 1954.1 |
|
Average age at first exposure: 27.5 years |
|
Number of exposed lung-cancer deaths: |
|
Total: 112 |
|
Cumulative exposure < 100 WLM: 18 (16%) |
|
Cumulative exposure < 50 WLM: 15 (13%) |
|
Average exposure rate < 0.5 WL: 8 (7.1%) |
|
Available data on smoking: |
|
Information on smoking was obtained through several surveys (1960, 1966, 1970, 1978) and was available for 48% of the cohort. |
|
Available data on other mining exposures: None. |
|
Results of NCI analyses: |
|
Estimated ERR/exposure = 0.76% (0.4–1.3%). |
|
Modest evidence of nonlinearity in dose-response relationship (p = 0.06); estimated power of exposure was 1.32. |
|
Significant decrease in ERR/exposure with increasing attained age, decreasing exposure duration, increasing average exposure rate, and increasing time since exposure. No evidence of modification by age at first exposure. |
the United States. Exposures of this cohort were generally lower than those of the earlier Colorado plateau miners. The study of these miners was initiated by the University of New Mexico in 1977.
The Beaverlodge Cohort (Table D-8)
The Beaverlodge uranium mine, in northern Saskatchewan, Canada, began operations in 1949 and closed in 1982. The mines were operated by Eldorado Resources Ltd., a government corporation. Exposure rates were low in this cohort, leading to the second lowest mean WLM.
TABLE D-6 Summary of the Swedish cohort
|
Study site: Malmberget area in northern Sweden |
|
Type of mine: Iron |
|
Recent references: Radford and St. Clair Renard 1984 |
|
Definition and identification of the cohort: |
|
Men who were born in 1880–1919, were alive on January 1, 1951, and worked underground in more than one calendar year in various mines in northern Sweden were included. Company and union records were the principal sources used to identify workers; medical surveys and parish records were also used. |
|
Methods for follow-up and ascertainment of lung-cancer deaths: |
|
Vital status and cause of death were determined by using each worker's Swedish personal identification number and parish records; this information is thought to be nearly complete. Death certificates were used as source for cases; 70% of lung-cancer deaths confirmed by autopsy or thoracotomy. |
|
Number of exposed miners: 1,294 |
|
Number of exposed person-years: 32,452 |
|
Average cumulative exposure: 80.6 WLM |
|
Average duration of exposure: 18.2 years |
|
Average exposure rate: 0.4 WL |
|
Period of follow-up: 1951–1991 |
|
Average length of follow-up: 25.7 years |
|
Average year of first exposure: 1934.1 |
|
Average age at first exposure: 27.4 years |
|
Number of exposed lung-cancer deaths: |
|
Total: 79 |
|
Cumulative exposure < 100 WLM: 36 (46%) |
|
Cumulative exposure < 50 WLM: 17 (22%) |
|
Average exposure rate < 0.5 WL: 78 (99%) |
|
Available data on smoking: |
|
As a result of several surveys, there is information on smoking history of more than half the men living in 1970; such information is available for all lung-cancer deaths. |
|
Available data on other mining exposures: |
|
None. However, arsenic, chromium, and nickel were not present beyond trace amounts in the bedrock and were not detected in samples of mine air. Diesel equipment was not introduced in the mines until 1960, after most of the lung-cancer deaths had left the mines or died. |
|
Results of NCI analyses: |
|
Estimated ERR/exposure = 0.95% (0.1–4.1%). |
|
No evidence of nonlinearity in dose-response relation. |
|
Significant decrease in ERR/exposure with increasing attained age and increasing time since exposure. |
|
No evidence of significant modification by exposure duration, time since exposure, or age at first exposure. Modification by exposure rate was of borderline statistical significance when treated quantitatively. |
|
Special studies: |
|
The role of silicosis was investigated in a case-control study; the conclusion was that silicosis did not contribute to lung-cancer risk. |
TABLE D-7 Summary of the New Mexico cohort
|
Study site: Grants, New Mexico, United States |
|
Type of mine: Uranium |
|
Recent references: Samet and others 1989, 1991, 1994. |
|
Definition and identification of the cohort: |
|
Men who had undergone a mining-related physical examination at the Grants Clinic in Grants, New Mexico, and who had worked at least 1 year underground in New Mexico before December 31, 1976, were included. Personnel records were reviewed to document underground exposure. |
|
Methods for follow-up and ascertainment of lung-cancer deaths: |
|
Vital status was determined by searching New Mexico vital-statistics records, the New Mexico Tumor Registry, and state driver's license records; the cohort was also matched against records of the Social Security Administration and the U.S. National Death Index. Death certificates were obtained and the cause of death coded by one nosologist. |
|
Number of exposed miners: 3,457 |
|
Number of exposed person-years: 46,800 |
|
Average cumulative exposure: 110.9 WLM |
|
Average duration of exposure: 5.6 years |
|
Average exposure rate: 1.6 WL |
|
Period of follow-up: 1943–1985 |
|
Average length of follow-up: 17.0 years |
|
Average year of first exposure: 1965.7 |
|
Average age at first exposure: 28.0 years |
|
Number of exposed lung-cancer deaths: |
|
Total: 68 |
|
Cumulative exposure < 100 WLM: 10 (15%) |
|
Cumulative exposure < 50 WLM: 6 (8.8%) |
|
Average exposure rate < 0.5 WL: 3 (4.4%) |
|
Available data on smoking: |
|
Grants Clinic records provided information on whether workers were current, former, or never-smokers. |
|
Available data on other mining exposures: |
|
Information on whether workers had previously worked in a hard-rock mine was available from Grants Clinic records. |
|
Results of NCI analyses: |
|
Estimated ERR/exposure = 1.72% (0.6–6.7%). |
|
No evidence of nonlinearity in dose-response relation. |
|
Significant decrease in ERR/exposure with attained age and decreasing exposure duration. |
|
No evidence of significant modification by exposure rate or time since exposure. |
|
Modification by age at first exposure was of borderline significance when treated quantitatively. |
|
Special characteristics: |
|
A high proportion (44%) of the study population was Hispanic or American Indian. Analyses were adjusted for ethnicity. |
|
Special analyses: |
|
Samet and others (1994) investigated the effect of exposure to silica; no evidence of such an association was found. |
TABLE D-8 Summary of the Beaverlodge cohort
|
Study site: Saskatchewan, Canada |
|
Type of mine: Uranium |
|
Recent references: Howe and others 1986; L'Abbe and others 1991; Howe and Stager 1996 |
|
Definition and identification of the cohort: |
|
Men who had ever worked at the Beaverlodge uranium mine during 1948–1980 were included except those with no recorded birth year, incomplete job histories, evidence of error in recorded birth date, or history of working for Eldorado Resources Ltd. at sites other than Beaverlodge. |
|
Methods for follow-up and ascertainment of lung-cancer deaths: |
|
Vital status and cause of death were determined for 1950–1980 by searching the Mortality Database of Statistics, Canada. |
|
Number of exposed miners: 6,895 |
|
Number of exposed person-years: 67,080 |
|
Average cumulative exposure: 21.2 WLM |
|
Average duration of exposure: 1.7 years |
|
Average exposure rate: 1.3 WL |
|
Period of follow-up: 1950–1980 |
|
Average length of follow-up: 14.0 years |
|
Average year of first exposure: 1962.6 |
|
Average age at first exposure: 28.0 years |
|
Number of exposed lung-cancer deaths: |
|
Total: 56 |
|
Cumulative exposure < 100 WLM: 38 (68%) |
|
Cumulative exposure < 50 WLM: 31 (55%) |
|
Average exposure rate < 0.5 WL: 13 (23%) |
|
Available data on smoking: |
|
No information is available for analyses conducted at NCI. Results from case-control study suggest that tobacco use was unlikely to have biased the estimates of ERR/ exposure for this cohort. |
|
Available data on other mining exposures: None. |
|
Results of NCI analyses: |
|
Estimated ERR/exposure = 2.21% (0.9–5.6%) |
|
No evidence of nonlinearity in dose-response relation. |
|
Significant decrease in ERR/exposure with decreasing exposure duration and increasing average exposure rate. |
|
No evidence of significant modification by attained age, time since exposure, but evidence of significant modification by time since last exposure, or age at first exposure. |
|
Special studies: |
|
L'Abbe and others (1991) conducted a case-control study to investigate the possibility of confounding by smoking and other mining experience. Little evidence of such confounding was found. |
|
Howe and Stager (1996) conducted a nested case-control study in which exposures were re-estimated for 65 men who died of lung-cancer and 126 matched controls. The revised estimates were based on a more-thorough review of individual employment records that allowed subjects to be assigned to more-specific mine areas than in the initial assessment and also used arithmetic means of measurements of area exposure instead of the geometric means that had been used earlier. Overall, the revised cumulative exposures were about 60% higher than the original estimates. In spite of this increase, the estimated lung-cancer ERR per 100 WLM based on the revised estimates was 3.26, higher than the value of 2.70 based on the original estimates. This |
|
increase was attributed to a reduction in random exposure-measurement error. In addition, analyses based on the revised exposure estimates provided no evidence of an inverse exposure-rate effect, whereas earlier cohort analyses based on the original estimates provided strong evidence of such an effect. |
The Port Radium Cohort (Table D-9)
Like the Beaverlodge mine, the Port Radium uranium mine, in the Northwest Territories, Canada, was operated by Eldorado Resources Ltd. The mine was in operation from 1930 to 1960; because of its earlier dates of operation, miners were exposed to substantially higher exposure rates than those at Beaverlodge. The Port Radium and Colorado cohorts had nearly the same average exposure rate, which was the highest of the 11 cohorts.
TABLE D-9 Summary of the Port Radium cohort
|
Study site: Northwest Territories, Canada |
|
Type of mine: Uranium |
|
Recent references: Howe and others 1987 |
|
Definition and identification of the cohort: |
|
The cohort consisted of men who had worked in the mine since 1940 and who were known to be alive on January 1, 1945, except those with various missing or invalid data. |
|
Methods for follow-up and ascertainment of lung-cancer deaths: |
|
Vital status and cause of death were determined for the years 1950–1980 by searching the Mortality Database of Statistics, Canada. |
|
Number of exposed miners: 1,420 |
|
Number of exposed person-years: 30,454 |
|
Average cumulative exposure: 243.0 WLM |
|
Average duration of exposure: 1.2 years |
|
Average exposure rate: 14.9 WL |
|
Period of follow-up: 1950–1980 |
|
Average length of follow-up: 25.3 years |
|
Average year of first exposure: 1952.3 |
|
Average age at first exposure: 27.6 years |
|
Number of exposed lung-cancer deaths: |
|
Total: 39 |
|
Cumulative exposure < 100 WLM: 7 (18%) |
|
Cumulative exposure < 50 WLM: 2 (5.1%) |
|
Average exposure rate < 0.5 WL: 0 (0.0%) |
|
Available data on smoking: None |
|
Available data on other mining exposures: None |
|
Results of NCI analyses: |
|
Estimated ERR/exposure = 0.19% (0.1–0.6%). |
|
No evidence of nonlinearity in dose-response relation. |
|
Significant decrease in ERR/exposure with increasing attained age, decreasing exposure duration, and time since last exposure. |
|
No evidence of significant modification by exposure rate or age at first exposure. |
The Radium Hill Cohort (Table D-10)
The Radium Hill mine, in a remote area of eastern South Australia, produced uranium ore for export to Great Britain and the United States in 1952–1961. The mine was owned and operated by the South Australian Department of Mines. A limitation of the study is that, because of emigration, 26% of the miners could not be traced. Exposure rates were low, and the study had the lowest mean WLM of the 11 cohort studies.
TABLE D-10 Summary of the Radium Hill cohort
|
Study site: South Australia |
|
Type of mine: Uranium |
|
Recent references: Woodward and others 1991 |
|
Definition and identification of the cohort: |
|
Hourly workers employed at Radium Hill during its period of operation (1952–1961) were included. |
|
Methods for follow-up and ascertainment of lung-cancer deaths: |
|
Vital status was determined by searching death records throughout Australia for the period 1960–1987. For earlier years (1952–1959), the search was restricted to South Australia. Other sources were also used to locate workers. For the data used in the NCI analyses, 26% of the cohort could not be traced. |
|
Number of exposed miners: 1,457 |
|
Number of exposed person-years: 24,138 |
|
Average cumulative exposure: 7.6 WLM |
|
Average duration of exposure: 1.1 years |
|
Average exposure rate: 0.7 WL |
|
Period of follow-up: 1948–1987 |
|
Average length of follow-up: 21.9 years |
|
Average year of first exposure: 1956.0 |
|
Average age at first exposure: 29.2 years |
|
Number of exposed lung-cancer deaths: |
|
Total: 31 |
|
Cumulative exposure < 100 WLM: 30 (97%) |
|
Cumulative exposure < 50 WLM: 29 (94%) |
|
Average exposure rate < 0.5 WL: 16 (52%) |
|
Available data on smoking: |
|
Smoking-status data (never-smoker, ever-smoker, or unknown) were available for about half the cohort from a 1984 survey of cohort members and their next of kin; collection of smoking information is continuing. |
|
Available data on other mining exposures: None |
|
Results of NCI analyses: |
|
Estimated ERR/exposure = 5.06% (1.0–12.2%) |
|
No evidence of nonlinearity in dose-response relation. |
|
No evidence of significant modification by attained age, exposure duration, exposure rate, age at first exposure, or time since last exposure. |
|
Special problems: |
|
A high proportion (26%) of subjects could not be traced. |
The French Cohort (Table D-11)
Uranium mining in France began in 1946, and the cohort includes miners in several uranium mines in various locations in France, some of which are still in operation. These mines are operated by a subsidiary of the Commissariat a l'Energie Atomique. Duration of exposure was relatively long in the French mines, but exposure rates were low.
TABLE D-11 Summary of the French cohort
|
Study site: Mines in 3 areas in the center of France and in an area near the western coast. |
|
Type of mine: Uranium |
|
Recent references: Tirmarche and others 1993 |
|
Definition and identification of the cohort: |
|
Men who had worked at least 2 years underground in uranium mines in France and who started worked in 1946–1972 were included. Thirty-nine foreign workers were excluded. |
|
Methods for follow-up and ascertainment of lung-cancer deaths: |
|
Vital status was determined from several sources, including company medical records, national records, and local physicians and hospitals and by tracing workers through last known addresses. Cause of death was determined for 96% of workers who had been identified as deceased. |
|
Number of exposed miners: 1,769 |
|
Number of exposed person-years: 29,172 |
|
Average cumulative exposure: 59.4 WLM |
|
Average duration of exposure: 7.2 years |
|
Average exposure rate: 0.8 WL |
|
Period of follow-up: 1948–1986 |
|
Average length of follow-up: 24.7 years |
|
Average year of first exposure: 1956.8 |
|
Average age at first exposure: 29.5 years |
|
Number of exposed lung-cancer deaths: |
|
Total: 45 |
|
Cumulative exposure < 100 WLM: 33 (73%) |
|
Cumulative exposure < 50 WLM: 22 (49%) |
|
Average exposure rate < 0.5 WL: 24 (53%) |
|
Available data on smoking: None. |
|
Available data on other mining exposures: |
|
Available data indicate only whether workers had previous mining experience. |
|
Results of NCI analyses: |
|
Estimated ERR/exposure = 0.36% (0.0–1.3%). |
|
No evidence of nonlinearity in dose-response relation. |
|
No evidence of significant modification by attained age, exposure duration, exposure rate, or time since last exposure. Significant modification by age at first exposure when treated quantitatively. |
Summary and Comparison of the Underground-Miner Cohorts
The informativeness of an epidemiologic study for quantifying the exposure-response relationship depends on several factors, including the size of the population, the number of cases of the disease of interest, and the size and distribution of the exposures. In general, studies with the greatest ranges of exposure and exposure rate are likely to be most informative with respect to investigating the shape of the exposure-response function and modifying effects of exposure rate. However, cohorts in which most subjects have been exposed primarily at lower exposure rates and to lower cumulative exposures might be more relevant for evaluating the effect of exposures at residential levels. Tables D-12 through D-15 provide a comparison of exposures and exposure rates among the cohorts and give special attention to describing cohorts in terms of the information available at lower exposures and exposure rates.
In addition to providing quantitative information on the dependence of risks on exposure and exposure rate, the miner data are used to address the modifying effects of attained age, time since exposure, and age at first exposure. Table D-16 provides summary information on the 11 miner cohorts, and Table D-17 provides
TABLE D-12 Number of exposed miners, person-years, lung-cancer deaths, and mean WLM and WL
|
Study |
Number of workers |
Number of person-years |
Number of lung-cancers |
Mean WLMa |
Mean duration |
Mean WLa |
Weighted mean WLb |
|
China |
13,649 |
134,842 |
936 |
286.0 |
12.9 |
1.7 |
2.3 |
|
Czechoslovakia |
4,320 |
102,650 |
701 |
196.8 |
6.7 |
2.8 |
4.2 |
|
Coloradoc |
3,347 |
79,556 |
334 |
578.6 |
3.9 |
11.7 |
17.0 |
|
Ontario |
21,346 |
300,608 |
285 |
31.0 |
3.0 |
0.9 |
1.6 |
|
Newfoundland |
1,751 |
33,795 |
112 |
388.4 |
4.8 |
4.9 |
12.2 |
|
Sweden |
1,294 |
32,452 |
79 |
80.6 |
18.2 |
0.4 |
0.4 |
|
New Mexico |
3,457 |
46,800 |
68 |
110.9 |
5.6 |
1.6 |
5.7 |
|
Beaverlodge |
6,895 |
67,080 |
56 |
21.2 |
1.7 |
1.3 |
2.5 |
|
Port Radium |
1,420 |
31,454 |
39 |
243.0 |
1.2 |
14.9 |
33.4 |
|
Radium Hill |
1,457 |
24,138 |
31 |
7.6 |
1.1 |
0.7 |
1.0 |
|
France |
1,769 |
39,172 |
45 |
59.4 |
7.2 |
0.8 |
2.6 |
|
Totald |
60,606 |
888,906 |
2,674 |
164.4 |
5.7 |
2.9 |
10.8 |
|
a Weighted by person-years; includes 5-year lag interval. b Weighted by WLM received at each exposure rate. c Exposure limited to < 3,200 WLM. d Totals adjusted for miners and lung-cancers that were included in both the Colorado and New Mexico Studies. |
|||||||
TABLE D-13 Number of person-years, lung-cancer deaths, and mean WLM and WL among exposed miners with cumulative exposure less than 100 WLM
|
Study |
Number of person-years |
Number of lung-cancers |
Mean WLMa |
Mean durationa |
Mean WLa |
Weighted mean WLb |
|
China |
41,656 |
72 |
48.2 |
4.0 |
1.1 |
1.2 |
|
Czechoslovakia |
27,100 |
73 |
60.8 |
4.4 |
1.3 |
1.0 |
|
Colorado |
17,956 |
20 |
43.4 |
0.9 |
4.6 |
7.4 |
|
Ontario |
276,838 |
225 |
20.4 |
2.7 |
0.8 |
0.9 |
|
Newfoundland |
18,251 |
18 |
19.5 |
16.9 |
2.0 |
4.7 |
|
Sweden |
21,836 |
36 |
45.7 |
12.7 |
0.3 |
0.4 |
|
New Mexico |
28,403 |
10 |
32.2 |
3.8 |
0.8 |
1.3 |
|
Beaverlodge |
59,305 |
38 |
14.1 |
1.6 |
1.1 |
2.0 |
|
Port Radium |
16,858 |
7 |
29.0 |
0.8 |
5.4 |
8.4 |
|
Radium Hill |
24,047 |
30 |
7.5 |
1.1 |
0.7 |
1.0 |
|
France |
33,087 |
33 |
29.9 |
8.8 |
0.4 |
0.6 |
|
Totalc |
564,772 |
562 |
26.2 |
3.8 |
1.1 |
1.5 |
|
a Weighted by person-years; includes 5-year lag interval. b Weighted by WLM received at each exposure rate. c Totals adjusted for miners and lung-cancers that were included in both the Colorado and New Mexico studies. |
||||||
information on attained age, age at first exposure, and time since last exposure in a format suitable for comparison.
Table D-12 shows several measures of the size of the individual miner cohorts and of the magnitude of the exposures and exposure rates. Although the number of exposed miners is greatest for the Ontario cohort, the China, Czechoslovakia, and Colorado cohorts all have more lung-cancer deaths because of their higher exposures. Those 4 cohorts contribute 2,256 (84%) of the total of 2,674 lung-cancer deaths in exposed miners. The highest average exposure rates (WL) are found in the Colorado, Newfoundland, and Port Radium cohorts, whereas the lowest average rates are found in Ontario, Sweden, Beaverlodge, Radium Hill, and France. The average cumulative exposures (WLM) follow similar patterns, although China and Czechoslovakia also have relatively large WLM because miners in these countries were employed for relatively long periods. Overall, the average duration of exposure is short, 5.7 years, with China, Czechoslovakia, Sweden, and France exhibiting somewhat longer durations.
Tables D-13 through D-15 provide similar information but limited to portions of the cohort exposed at levels more directly applicable to estimating risks at lower exposures and exposure rates. Tables D-13 and D-14 show that Ontario contributes 225 (40%) of the total of 562 lung-cancers in exposed miners with
TABLE D-14 Number of person-years, lung-cancers, and mean WLM and WL among exposed miners with cumulative exposure less than 50 WLM
|
Study |
Number of person-years |
Number of lung-cancers |
Mean WLMa |
Mean durationa |
Mean WLa |
Weighted mean WLb |
|
China |
21,815 |
33 |
26.4 |
2.8 |
0.8 |
0.8 |
|
Czechoslovakia |
9,182 |
11 |
27.4 |
2.5 |
1.0 |
0.7 |
|
Colorado |
11,750 |
13 |
26.0 |
0.7 |
3.7 |
6.5 |
|
Ontario |
244,785 |
174 |
13.9 |
2.2 |
0.7 |
0.5 |
|
Newfoundland |
15,458 |
15 |
9.8 |
19.3 |
1.0 |
2.5 |
|
Sweden |
12,625 |
17 |
25.7 |
9.3 |
0.3 |
0.3 |
|
New Mexico |
20,504 |
6 |
16.6 |
3.4 |
0.5 |
0.8 |
|
Beaverlodge |
55,717 |
31 |
10.5 |
1.4 |
1.0 |
1.5 |
|
Port Radium |
12,127 |
2 |
15.5 |
0.8 |
3.2 |
5.3 |
|
Radium Hill |
23,693 |
29 |
6.7 |
1.0 |
0.7 |
1.0 |
|
France |
25,770 |
22 |
18.1 |
7.9 |
0.3 |
0.4 |
|
Totalc |
454,159 |
353 |
14.8 |
3.2 |
0.9 |
1.0 |
|
a Weighted by person-years; includes 5-year lag interval. b Weighted by WLM received at each exposure rate. c Totals adjusted for miners and lung-cancers that were included in both the Colorado and New Mexico studies. |
||||||
cumulative exposures less than 100 WLM, and 174 (49%) of the total of 353 lung-cancer deaths in miners with cumulative exposures less than 50 WLM. Table D-15 shows that Ontario and Sweden contribute 178 (71%) of the total of 251 lung-cancers in exposed miners with average exposures less the 0.5 WL; however, because of the longer duration of exposure in Sweden, the mean exposure among those in this low-exposure-rate category is much lower for Ontario (10.7 WLM) than for Sweden (79.4 WLM). With the committee's categorical exposure-rate model, the quantitative risk estimates for exposure at residential levels are based on the portion of the miner data with exposure rates less than 0.5 WL, although estimates of parameters indicating the effects of attained age and time since exposure were based on all miner data.
Table D-16 shows that the average age at first exposure is much lower in China than in any of the other cohorts. Table D-17 shows that there are no striking differences among the cohorts with regard to the distribution of cancers by attained age and time since last exposure although Sweden contributes little information to the under 55 age category. China contributes 735 (85%) of the 862 lung-cancers among those first exposed under age 20 and all 54 lung-cancers among those first exposed under age 10.
TABLE D-15 Number of person-years, lung-cancers, and mean WLM and WL among exposed miners with average exposure rates less than 0.5 WL (zero exposure data omitted)
|
Study |
Number of person-years |
Number of lung-cancers |
Mean WLMa |
Mean durationa |
Mean WLa |
Weighted mean WLb |
|
China |
1,106 |
9 |
35.6 |
9.6 |
0.31 |
0.38 |
|
Czechoslovakia |
33 |
0 |
—c |
—c |
—c |
—c |
|
Colorado |
291 |
0 |
—c |
—c |
—c |
—c |
|
Ontario |
87,670 |
100 |
10.7 |
4.4 |
0.22 |
0.32 |
|
Newfoundland |
7,362 |
8 |
8.4 |
4.1 |
0.16 |
0.28 |
|
Sweden |
30,646 |
78 |
79.4 |
18.2 |
0.37 |
0.41 |
|
New Mexico |
11,710 |
3 |
11.6 |
3.9 |
0.22 |
0.34 |
|
Beaverlodge |
27,692 |
13 |
3.5 |
1.3 |
0.36 |
0.30 |
|
Port Radium |
103 |
0 |
—b |
—b |
—b |
—b |
|
Radium Hill |
8,781 |
16 |
7.9 |
1.7 |
0.39 |
0.41 |
|
France |
23,720 |
24 |
25.2 |
7.6 |
0.25 |
0.36 |
|
Totald |
198,720 |
251 |
21.1 |
6.3 |
0.27 |
0.39 |
|
a Weighted by person-years; includes 5-year lag interval. b Weighted by WLM received at each exposure rate. c There were no lung-cancers and very few person-years in the Czechoslovakia, Colorado, and Port Radium cohorts with average exposure rates < 0.5 WL, so means are not presented for these cohorts. d Totals adjusted for miners and lung-cancers that were included in both the Colorado and New Mexico studies. |
||||||
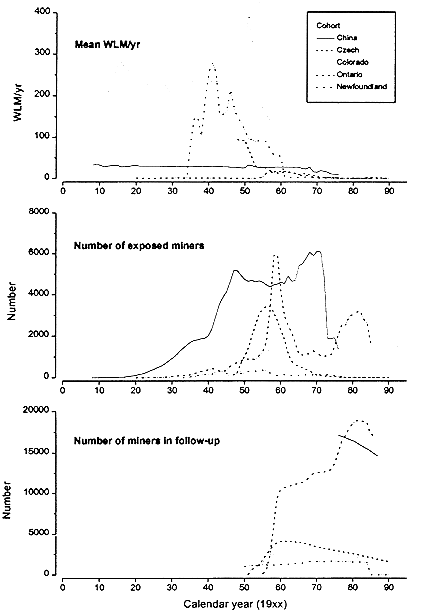
Figures D-1 and D-2 present further information comparing various aspects of exposure among the 11 cohorts. Because of the considerable variation in the numbers of miners and levels of exposure among the cohorts, it was necessary to use different scales for the ordinates. Figure D-1a contrasts the times and levels of exposure and clearly illustrates the generally high levels in Colorado, Newfoundland, and Port Radium and the decreasing exposure levels in the 1950s and 1960s. The very constant estimated exposure levels in China and Sweden cohorts could reflect the use of natural ventilation in the early years of mining but could also reflect the need to rely on retrospective evaluation of exposures because of the absence of exposure measurements in the early years of mine operations. Figure D-1b clearly shows the large size and long duration of employment for the China cohort, the long duration of employment for the Sweden cohort, and the strong rise and fall in employment for the Czechoslovakia and Ontario cohorts. Figure D-1c shows the number of workers in follow-up by calendar year; these numbers increase as cohort members are added but decrease as deaths occur. Most of the miners still in follow-up in 1990 were in the Ontario and China cohorts.
TABLE D-16 Follow-up period, year first exposed, age first exposed, and years exposed
|
|
|
Mean among exposed |
||
|
Study |
Follow-up period |
Length of follow-up |
Year of first exposure |
Age at first exposure |
|
China |
1976–1987 |
10.2 |
1955.6 |
18.8 |
|
Czechoslovakia |
1952–1990 |
25.2 |
1951.0 |
30.1 |
|
Coloradoa |
1950–1990 |
26.3 |
1953.0 |
31.8 |
|
Ontario |
1955–1986 |
17.8 |
1963.8 |
26.4 |
|
Newfoundland |
1950–1984 |
23.3 |
1954.1 |
27.5 |
|
Sweden |
1951–1991 |
25.7 |
1934.1 |
27.4 |
|
New Mexico |
1943–1985 |
17.0 |
1965.6 |
28.0 |
|
Beaverlodge |
1950–1980 |
14.0 |
1962.6 |
28.0 |
|
Port Radium |
1950–1980 |
25.3 |
1952.3 |
27.6 |
|
Radium Hill |
1948–1987 |
21.9 |
1956.0 |
29.2 |
|
France |
1948–1986 |
24.7 |
1956.8 |
29.5 |
|
Total |
1943–1991 |
17.7 |
1954.0 |
25.2 |
|
a Exposures limited to <3,200 WLM. |
||||
Figure D-2 shows the number of miners in each of the cohorts by duration of exposure and illustrates that miners with long exposure durations were predominantly in China, Czechoslovakia, Ontario, and Sweden. This figure also illustrates the relatively short duration of employment for many of the workers in the Ontario and Beaverlodge cohorts.
Data on Other Exposures
Some cohorts of underground miners have been exposed to dust, arsenic, silica, and diesel exhaust in addition to radon progeny. Because these exposures are not expected in conjunction with residential exposure, a concern is that the presence of such exposure in mines might have resulted in risks per WLM that overestimate risks in the residential setting. If relevant data are available, it is possible to adjust partially for such exposures; thus, in cohorts in which these exposures have occurred, the adequacy of available data is a factor in evaluating the usefulness of the cohort in estimating residential risks. However, because such data are probably never sufficiently detailed and accurate to permit certainty that adjustments are adequate, cohorts that are relatively free of such exposures probably have the least potential for bias from this source. Further discussion of these exposures is found in appendix F.
Smoking is of concern as a confounder and because the high prevalence of smoking among miners might have led to higher risks than would be expected in the general population. In addition, there is considerable interest in understand-
TABLE D-17 Number of lung-cancers among exposed miners, by attained age, age at first exposure, and time since last exposure
|
|
Number of lung-cancers by |
||||||||
|
|
Attained agea |
Age at first exposure exposure |
Time since last exposure |
||||||
|
Study |
<55 |
55- |
65+ |
<20 |
20- |
30+ |
<5 |
5–15 |
>15 |
|
China |
348 |
484 |
148 |
735b |
131 |
70 |
121 |
293 |
522 |
|
Czechoslovakia |
276 |
275 |
154 |
21 |
227 |
454 |
150 |
266 |
286 |
|
Coloradoc |
134 |
105 |
97 |
47 |
83 |
204 |
54 |
110 |
170 |
|
Ontario |
101 |
125 |
65 |
21 |
125 |
139 |
46 |
92 |
147 |
|
Newfoundland |
71 |
35 |
12 |
25 |
42 |
45 |
40 |
41 |
31 |
|
Sweden |
5 |
22 |
52 |
10 |
51 |
18 |
25 |
19 |
35 |
|
New Mexico |
30 |
28 |
11 |
4 |
15 |
49 |
33 |
23 |
12 |
|
Beaverlodge |
25 |
25 |
15 |
0 |
1 |
55 |
19 |
21 |
16 |
|
Port Radium |
20 |
22 |
15 |
1 |
4 |
35 |
4 |
12 |
24 |
|
Radium Hill |
15 |
20 |
19 |
0 |
8 |
24 |
1 |
5 |
26 |
|
France |
21 |
17 |
7 |
1 |
12 |
32 |
12 |
17 |
16 |
|
Totald |
1,039 |
1,156 |
592 |
862 |
695 |
1,120 |
500 |
893 |
1,284 |
|
a Results for attained age include lung-cancers in unexposed minors. b 54 of these lung-cancers occurred in miners first exposed under age 10 (no others occurred in such miners). c Exposures limited to <3200 WLM. d Totals adjusted for miners and lung-cancers that were included in both the Colorado and New Mexico studies. |
|||||||||
ing the modifying effects of smoking on risks associated with radon exposure. These issues are discussed in detail in appendix C. Tables D-1 to D-11 describe the available data on smoking for each of the cohorts and also note analyses related to smoking that have been conducted.
RESULTS OF STATISTICAL ANALYSES OF DATA ON UNDERGROUND MINERS
Radon and Lung Cancer Risk: A Joint Analysis of 11 Underground Miners Studies
Analyses based on combined data from 11 underground-miner cohorts have recently been conducted (Lubin and others 1994a) as a collaborative effort among the principal investigators. Those analyses provide the most comprehensive summary of available data on lung-cancer risks in miners. Although, as noted above, the BEIR VI committee chose to base its risk model on analyses specifically conducted for this purpose, the committee relied on the NCI analyses for


detailed exploration of several relevant issues. An objective of this appendix is to summarize and evaluate these combined analyses. For full detail, the reader is referred to the NCI report or one of the related publications (Lubin and others 1995a,b, 1997).
The general approach taken in the NCI analyses was to model the hazard (age-specific risk) as a function of exposure and other variables. Specifically, most analyses were based on linear relative-risk models in which the relative risk (RR) is written as RR = 1 + βw, where w represents cumulative exposure in WLM and β is the excess relative risk (ERR) per exposure. Modification of risk by such factors as exposure rate was investigated by fitting categorical models of the form RR = 1 + βjw, where j indexes categories of the modifying factor or by fitting models that treating such factors as quantitative variables, z. With the latter approach, both exponential models, RR = 1 + w exp(γ z), and power models, RR = 1 + wzγ, were fitted.
Although time since last exposure was evaluated with the approach described above, time since exposure was handled by expressing the cumulative exposure (minus a 5-year lag interval) as the sum of components received in various time periods. For example w5–14 was the cumulative exposure received 5–14 years before the age at risk being evaluated. Separate coefficients were then fitted for the different time components. This approach was similar to that used by the BEIR IV committee, although the extended follow-up of the cohorts allowed the inclusion of an additional category.
Analyses relied on internally based comparisons and did not make use of external vital statistics. With a relative-risk model, the risk of lung-cancer is expressed as the product of baseline risk and relative risk. The baseline risk was modeled by including separate parameters for each 5-year age group. Some analyses allowed the baseline risk to depend on calendar-year period, although the final models did not do so. When data were available, baseline risks were adjusted for categories of arsenic exposure or for whether subjects had previous mining experience. For the Beaverlodge cohort, it was also found necessary to introduce a parameter expressing the difference in baseline risks in exposed and unexposed miners; and for New Mexico, analyses were adjusted for ethnicity. In joint analyses based on combined data from several cohorts, separate baseline-risk parameters were estimated for each cohort.
The NCI report first presents separate analyses of each of the 11 cohorts, starting with a simple model with a constant ERR/exposure, RR = 1 + βw. Results from those analyses are shown in the first column of Table D-18. Departures from linearity in each of the cohorts were then investigated by evaluating models of the form RR = [1 + βwk]eθw. That was followed by investigation of the modifying effects of attained age, age at first exposure, exposure rate, exposure duration, time since last exposure, and time since exposure. The effects of those variables were investigated both individually and after the inclusion of other variables. Results for the individual cohorts based on exponential model are
summarized in Table D-18. Special analyses addressing the effects of smoking and of other miner exposures were conducted for cohorts for which data on these factors were available. Those results are discussed in appendix A.
After presenting ''parallel analyses" of each of the individual cohorts, the NCI report presents joint analyses based on data from all cohorts. Those joint analyses evaluated the modifying effects of all the variables noted above, both acting individually and in combination with other variables. Analyses also investigated homogeneity both of the overall magnitude of the risk estimate and of parameters describing effect modification.
On the basis of the analyses described above, evidence of an exposure-response relationship was found for all cohorts evaluated, and this relationship was found to be adequately described by a linear dose-response function (although for Colorado it was necessary to restrict exposures to those less than 3,200 WLM to achieve consistency with linearity). As in the BEIR IV committee analyses, the magnitude of ERR/exposure was found to depend on time since exposure and attained age. In addition, ERR/exposure was found to depend on exposure rate (or, alternatively, exposure duration), with an increase in risk with decreasing exposure rate (or increasing exposure duration). The magnitude of ERR/exposure was not found to depend on age at start of exposure. Modifying effects of the above variables were judged to be reasonably consistent among the 11 cohorts.
The overall magnitude of ERR/exposure varied substantially among the cohorts, ranging from 0.2 to 5.1 per 100 WLM, as is demonstrated in Table D-18. Even after adjustment for the modifying effects of time since exposure, attained age, and either exposure rate or exposure duration, evidence of heterogeneity remained. It was therefore necessary to include "between-cohort" variation in expressing the uncertainty in the risk estimates.
Four models for estimating risks of lung-cancer resulting from exposure to radon and radon progeny were developed. Two of them were based on continuous treatment of modifying variables, and 2 were based on categorical treatment of these variables. The latter models were recommended as being more appropriate for estimating individual risk for both occupational and residential exposure. In addition, models based on both exposure rate and exposure duration were developed. The categorical models were very similar to those recommended by the current BEIR VI committee, although parameter values differed slightly because of the changes in the data described earlier in this appendix.
Lifetime risks were estimated for each of these models, with separate estimates for males and females and for ever-smokers and never-smokers. In these calculations, the same ERR was applied regardless of sex or smoking status (that is, a multiplicative model was assumed). Risk estimates were provided for both lifetime and occupational exposure to radon and for a range of exposure rates. In addition, attributable risks associated with an estimated exposure distribution for the United States were calculated. For the additional calculations, the ERR was
TABLE D-18 Estimates of ERR/exposurea (with 95% CI) and of various parametersb (with p-values) to quantify modifying effects
|
Modifying effect ofc |
|||||
|
Study |
ERR/exposure, % |
Attained age 60 |
Rn progeny (WL) |
Age at first exposure > 30 |
Time since last exposure > 10 |
|
China |
0.16 (0.1–0.2) |
0.92 (0.002) |
0.57 (<0.001) |
0.94 (0.01) |
0.86 (<0.001) |
|
Czechoslovakia |
0.34 (0.2–0.6) |
0.93 (<0.001) |
0.77 (<0.001) |
1.05 (<0.001) |
0.93 (<0.001) |
|
Colorado |
0.42 (0.3–0.7) |
0.92 (<0.001) |
0.94 (<0.001) |
1.00 (0.90) |
0.98 (0.02) |
|
Ontario |
0.89 (0.5–1.5) |
0.99 (0.05) |
0.99 (0.37) |
0.99 (0.37) |
0.99 (0.37) |
|
Newfoundland |
0.76 (0.4–1.3) |
0.92 (<0.001) |
0.94 (0.002) |
0.99 (0.44) |
0.94 (<0.001) |
|
Sweden |
0.95 (0.1–4.1) |
0.86 (0.01) |
0.02 (0.07) |
0.96 (0.36) |
0.88 (0.02) |
|
New Mexico |
1.72 (0.6–6.7) |
0.90 (0.02) |
0.94 (0.19) |
0.95 (0.05) |
0.97 (0.33) |
|
Beaverlodge |
2.21 (0.9–5.6) |
0.99 (0.89) |
0.62 (<0.001) |
1.03 (0.34) |
0.87 (<0.001) |
|
Port Radium |
0.19 (0.1–0.6) |
0.87 (0.01) |
0.98 (0.18) |
1.00 (0.92) |
0.90 (0.01) |
|
Radium Rill |
5.06 (1.0–12.2) |
0.97 (0.67) |
0.46 (0.43) |
0.98 (0.55) |
1.02 (0.79) |
|
France |
0.36 (0.0–1.2) |
0.89 (0.14) |
1.14 (0.59) |
0.55 (0.004) |
1.00 (0.96) |
|
a Estimates adjusted for age (all studies), other mine exposure (China, Colorado, Ontario, New Mexico and France), an indicator of Rn-exposure (Beaverlodge), and ethnicity (New Mexico). Taken from table 5, Lubin and others (1994a). b Estimates of proportional change (exp (γ)) in ERR/exposure based on model in which ERR is given by βw exp(γ x), where w is exposure in WLM and x is variable of interest. Taken from table 10, Lubin and others (1994a). c p value for test of null hypothesis, γ = 0. Taken from table 10, Lubin and others (1994a). |
|||||
estimated separately for ever-smokers and never-smokers by using data from the 6 cohorts for which data on smoking were available. Even though the data were reasonably consistent with a multiplicative interaction, the best-fitting model was submultiplicative, and, in separate analyses by smoking status, ERR for never-smokers was estimated to be about 3 times that for ever-smokers. Lubin and Steindorf (1995) discuss the issue of accounting for smoking in calculating risks and provide justification for the approach used for calculating attributable risks in the NCI report; this same approach was used for the committee's risk assessment, as described in chapter 3.
Lifetime risks based on those models were similar to the risks based on the comparable models developed by the BEIR VI committee. No attempt was made in the NCI report to evaluate uncertainty in the resulting estimates of lifetime risk. The analyses of the BEIR VI committee add greater attention to uncertainty, as discussed in chapter 3 and appendix A.
Analyses Evaluating the Shape of the Exposure-Response Function
Current estimates of lung-cancer risks resulting from exposure to radon and radon progeny at the lower exposures encountered in the residential setting have been obtained through linear extrapolation from risk estimates derived from studies of underground miners. The risk models presented in the NCI report are also based on linear extrapolation, and this choice was made after evaluation of the shape of the exposure-response function both in individual cohorts and in the joint analyses.
To investigate departures from linearity on the multiplicative scale, models of the form RR = [1 + βw]eθ (linear-exponential model) and RR = [1 + βwk] (nonlinear model) were fitted to determine whether nonzero values for the parameters θ and κ substantially improved the fit of the model. The analyses were conducted with the entire exposure range for each of the cohorts and were restricted to cumulative exposures less than 200 WLM. Only for the Colorado cohort was there clear evidence of nonlinearity; for this reason, analyses of this cohort were restricted to cumulative exposures under 3,200 WLM; with this restriction, tests for nonlinearity were no longer statistically significant. For other cohorts, the only instance where a p value less than 0.05 was achieved was for the linear-exponential model in the Czechoslovakian cohort; in this case, the p value for a test of γ = 0 was 0.03, whereas that for the nonlinear model was 0.07. With 11 cohorts and 2 models, a single p value under 0.05 could occur by chance.
Details on tests for nonlinearity are presented in the NCI report only for a simple model that did not include modifying effects of other variables. However, those tests were repeated with the variables included; the result was that only for Czechoslovakia was there any evidence of significant departure from linearity.
As discussed earlier, there is evidence that the exposure-rate effect depends on cumulative exposure. If that were the case, the shape of the exposure-response curve would necessarily be different for various fixed exposure rates; in particular, it could not be linear at all exposure rates.
Analyses Addressing the Modifying Effects of Attained Age, Age at Exposure, Time Since Exposure, Time Since Last Exposure, and Exposure Rate
The BEIR IV committee found that relative risk depended on both attained age and time since exposure, and it included the modifying effects of these factors in its recommended risk model. Although the BEIR IV analyses indicated that exposure rate modified risk in the Colorado cohort, such evidence was not found in the other 3 cohorts, and the recommended model did not include modification by exposure rate. No evidence of modification by age at first exposure was found by the BEIR IV committee, but data on miners exposed under age 20 were sparse in the 4 cohorts evaluated (see Tables D-16 and D-17).
A difficulty in evaluating the effects of the variables considered in this section is that they are all strongly interrelated. As workers age, time since exposure or time since last exposure might also be increasing. It is also possible that smoking habits changed with time, and available smoking data were not adequate to evaluate how this might affect results. For many of the cohorts, exposure rates were much higher in the earlier calendar years than in later ones, and the higher rates might predominate in the longer time-since-exposure periods. In general, those dependences were addressed in the NCI report by evaluating the modifying effect of a specific variable after adjustment for other variables. However, it is not possible to be certain that those adjustments were adequate.
In describing the data over the range of the variables covered by them, it might not be important whether or not a particular variable exhibits a causal relationship or which variables are used to describe the observed pattern. However, in extrapolating to values outside the range of the data, the choice of variables and how they are used to model the data can be very important. For example, if the effect of other variables were incorrectly attributed to exposure rate, this could lead to erroneous estimates of risk at the relatively low rates encountered in residential exposures.
Interactions among the modifying variables evaluated or with cumulative exposure are also possible. For example, the effect of time since exposure might vary with age at exposure, or the effect of any of the variables might vary with exposure rate or with cumulative exposure. Such interactions were generally not investigated, and it is doubtful that the available data are adequate to do so effectively. However, joint analyses estimating the various modifying effects
were conducted with various restrictions on cumulative WLM; in general, these analyses provided little evidence of important variation of modifying effects with cumulative WLM.
The NCI analyses on which the final models were based did not include adjustment of baseline risks for calendar year. Analyses based on a simple linear model without consideration of modifying effects of other variables were repeated with adjustment for calendar year; the results changed little.
Attained Age
Like previous analyses by the BEIR IV committee, the NCI analyses indicated that ERR/exposure declined with attained age; that is, the increase with age in the excess lung-cancer risk attributable to radon was not as rapid as the background rate for the nonexposed.
Initial analyses examined the effect of attained age in each of the 11 cohorts, treating this as both a categorical and a continuous variable. With the categorical treatment, significant effects were seen for the China, Czechoslovakia, Colorado, Newfoundland, and New Mexico cohorts; with the quantitative treatment, Sweden and Port Radium could be added to this list indicated in Table D-18. For all cohorts, the estimated quantitative parameter indicated a decline in risk with increasing attained age. Joint analyses of the 11 cohorts indicated that the effect persisted with inclusion of time since exposure and of either exposure rate or duration and that there was no clear evidence of heterogeneity of this effect among cohorts.
Age at First Exposure
Evaluation of age at exposure would require creating "windows" in a manner comparable with the treatment of time since exposure. As an alternative (and simpler) approach, age at first exposure was examined. For miners with short exposure durations, the 2 variables should be highly correlated, but this is not necessarily the case for miners with longer exposure durations. In the China cohort, which contributes many of the data on those exposed early in life, many miners were employed for longer periods.
Only for the China cohort were there substantial data for persons exposed under age 20. Even in that cohort, few workers were first exposed under age 10, and, exposure must have been skewed to the older end of the age range. Age-at-exposure effects that have been identified for low-LET exposure have been strongest in the very young (UNSCEAR 1994). Also, if the decline in risk with attained age and time since exposure applies to those exposed early in life, risk of radon-induced lung-cancer would have become negligible by the ages when lung-cancer usually occurs, and this would greatly limit the ability to detect an
age-at-exposure effect. Whether the decline in risk with age and time depends on the age at initial exposure was not investigated, and it is unlikely that data were adequate to address this question adequately.
With a categorical treatment of age at first exposure, substantial improvement in the fit of the model was observed only for China and Czechoslovakia. With quantitative treatment (see Table D-18), New Mexico and France also demonstrated such improvement. For China, New Mexico, and France, the quantitative estimates indicated a decrease with increasing age at first exposure. For Czechoslovakia, the effect was in the opposite direction, but analyses by Tomásek and others (1994a), based on revised exposure and follow-up data, did not identify such an effect. No clear trend was present with the categorical treatment applied to all 11 cohorts and ERR/exposure for those under age 20 was generally similar to ERR/exposure for those age 20 and older. The effects of age at first exposure were re-evaluated with inclusion of other variables (time since exposure, attained age, and exposure rate or duration); details are not given, but this approach did not lead to modification of the decision not to include age at first exposure in the final model.
Time Since Exposure and Time Since Last Exposure
In initial analyses of individual cohorts, NCI addressed the effects of both time since last exposure and time since exposure,1 with both treated as categorical variables. Inclusion of either of the variables substantially improved the fit of the model (p < 0.05) in the China, Czechoslovakia, Colorado, Newfoundland, and Port Radium cohorts. For the Beaverlodge cohort, time since last exposure substantially improved the fit, but time since exposure did not, and, in general, the improvement in fit seemed to be stronger for time since last exposure. For cohorts with substantial improvement in fit, ERR/exposure was found to decrease with either decreasing time since last exposure or decreasing time since exposure. Limited power could have been the reason that effects were not demonstrated in the remaining cohorts; the Ontario cohort was the only large cohort in this category.
Analyses with time since last exposure treated as a quantitative variable were also conducted and were based on the exponential model (see Table D-18). Using this approach, all cohorts noted above showed a substantial improvement in fit; in addition, such an improvement was found for the Swedish cohort. In all
but Radium Hill and France, the estimated effect indicated a decline in risk with increasing time since last exposure.
Joint analyses of data from all 11 cohorts were based on time-since-exposure windows. Time since exposure was found to significantly improve the fit of the model even after inclusion of attained age and of either exposure rate or exposure duration. Joint analyses also included specific statistical tests to address the homogeneity of the time-since-last-exposure effect across cohorts after adjustment for other variables. Those analyses, which treated time since last exposure as a quantitative variable, provided evidence that the modifying effects of this variable varied significantly across cohorts. No analyses addressing lack of homogeneity of time since exposure effects are presented.
Although results based on both time since exposure and time since last exposure are presented, it is difficult to separate the effects of these 2 variables, because many miners had fairly short durations of exposure. Comparison of p values for the 2 approaches applied to individual cohorts suggests that time since last exposure improved the fit slightly more than time since exposure.
Another aspect of the time-since-exposure effect is the minimal latency period. To address that issue, analyses based on each of several lag periods were conducted. They indicated that the 5-year lag period was a reasonable choice.
Exposure rate and duration of exposure
Considerable variation in exposure rate occurred among the 11 cohorts. The highest exposure rates generally occurred in early calendar-year periods, and they declined in later years. Exposure rate varied from < 0.3 WL to more than 30 WL, and exposure duration varied from < 1 year to more than 35 years.
It is important to note that exposure rates for individual miners must be inferred from average estimates of both WL and hours spent in the mine in a specific period. In most cohorts, these values were available only on an annual basis, and both were subject to measurement error. A particular concern is that earlier measurements, when exposure rates were largest, were generally subject to much greater errors than later measurements.
Analyses treating both exposure duration and average exposure rate as categorical variables were conducted for each of the 11 cohorts. For exposure duration, significant improvements in fit were found for all cohorts except Ontario, Sweden, Radium Hill, and France. For exposure rate, significant improvements were found for all cohorts except Sweden, New Mexico, Port Radium, Radium Hill, and France. The direction of these effects with quantitative treatment of exposure rate indicated a decrease in risk with increasing exposure rate in all cohorts except France (see Table D-18).
Because higher exposures were generally observed in earlier periods of mine operation, there was concern that the exposure-rate effect might represent a time-
since-exposure effect. However, the exposure-rate effect persisted after adjustment for time since exposure.
Considerable effort was given to determining whether the effect of exposure rate was best described by using exposure rate directly or by using exposure duration and to determining whether a power or exponential model was more appropriate. The analyses did not provide a clear-cut answer, and final risk models used power models for both exposure rate and exposure duration. Analyses addressing homogeneity of the effect across cohorts provided evidence of lack of homogeneity for exposure rate with the exponential model but not for the other models evaluated (duration with the exponential model and both rate and duration with the power model).
Brenner and Hall (1990) have postulated that the inverse exposure-rate effect might be primarily a high-dose (or high-dose-rate) phenomenon. The NCI report presents ERR/exposure estimate by categories defined by both cumulative exposure and exposure rate. These suggest that the exposure-rate effect is strongest at the highest cumulative exposures, but data are inadequate to estimate the exposure-rate effect reliably at very low cumulative exposures.
Lubin and others (1995b) recently conducted further analyses of data from the 11-underground miner cohorts addressing the inverse exposure-rate effect. These analyses confirmed inverse exposure-rate effects in all cohorts but one. Separate measures of the exposure-rate effect (based on the power model) were estimated for each of 6 categories defined by cumulative exposure, and they indicated a lessening of the effect with decreasing exposure. Data in the lowest exposure category (< 50 WLM) were compatible with no inverse exposure-rate effect.
Most of the NCI analyses were based on either total duration of exposure or average exposure rate obtained as the total WLM divided by exposure duration. Although those variables were allowed to change as miners were followed, analyses did not take full account of the variation in exposure rate that might have occurred over a miner's employment period. For example, once the exposure was completed and the latency period had passed, a miner with a constant exposure rate of 4 WL would be treated similarly to a miner with an exposure rate of 7 WL for the first half of his exposure period and similarly to a miner with a rate of 1 WL for the second half. For miners with longer exposure periods, this approximation might not have been adequate. However, analyses were conducted that included separate estimates of the modifying effect of exposure rate (or exposure duration) for each of 4 time-since-exposure windows; these analyses yielded no indication that this treatment improved the fit over analyses based on a single average exposure rate.
Tomásek and others (1994a) and Thomas and others (1994) conducted analyses of data from the Czech and Colorado cohorts, respectively, in a way that took into account detailed exposure rate histories. They fitted a model based on ![]() , where i indexes periods (months for the Czech cohort and years for the Colorado
, where i indexes periods (months for the Czech cohort and years for the Colorado
cohort), and wi indicates the exposure rate in period i. It can be shown that if the exposure rate were constant over the entire exposure period, then ![]() - 1 would correspond to γ in the power model described above that was applied in the NCI combined analyses. For both the Czech and Colorado data,
- 1 would correspond to γ in the power model described above that was applied in the NCI combined analyses. For both the Czech and Colorado data, ![]() - 1 was estimated to be about -0.5. The comparable values estimated for those cohorts in the NCI analyses were similar: -0.66 for the Czech cohort and -0.78 for the Colorado cohort.
- 1 was estimated to be about -0.5. The comparable values estimated for those cohorts in the NCI analyses were similar: -0.66 for the Czech cohort and -0.78 for the Colorado cohort.
Arsenic and Other Exposures
Two of the miner cohorts (China and Ontario) had quantitative data on arsenic exposure, and Ontario, Colorado, New Mexico, and France had data indicating whether miners had previous mining experience. Analyses were conducted to investigate the effect of those variables on lung-cancer risks after adjustment for radon VVLM. Risks were found to increase with increasing arsenic exposure and to be larger for subjects with previous mining experience than for subjects without such experience. ERR/exposure for radon exposure was estimated both with and without adjustment for arsenic exposure or previous mining experience. For the China cohort, that reduced ERR/exposure from 0.61% to 0.16% but did not have a large effect on estimates from the other cohorts. There was no significant variation in ERR/exposure across categories of arsenic exposure or previous mining experience. It is noted that in all NCI analyses discussed thus far, the baseline risk was adjusted for arsenic and other exposures in cohorts for which data were available. It is possible, of course, that inadequate data or lack of data on such exposures could have biased results for any of the cohorts.
The effect of exposure to silica was investigated by Samet and others (1994) By examining whether the presence of silicosis, a fibrotic lung disease caused by silica, was associated with lung-cancer in a case-control study of New Mexico underground uranium miners. No evidence of such an association was found, but data were too sparse to rule out the possibility that silica exposure could substantially bias lung-cancer risk estimates for miners. Radford and St. Clair Renard (1984) investigated the role of silicosis in a case-control study and found no evidence of association with lung-cancer risk.
Overall Evaluation of Statistical Analyses Conducted Thus Far, with Emphasis on NCI Report
Overall, the NCI analyses provide a comprehensive summary of nearly all the relevant data on underground miners exposed to radon and radon progeny. The application of the same methods to all cohorts (parallel analyses) facilitate comparing results across cohorts, and combining data across cohorts (joint analyses) provides greater power for investigating various issues than would be available from any single cohort. The statistical methods are appropriate and in
general provide an extremely thorough investigation of issues that are important for radon risk assessment. Careful attention is given to investigating the homogeneity of effects across cohorts and to determining which models provide the best description of the data.
Nevertheless, additional analyses might be desirable. For example, investigation of age at exposure was limited to consideration of age at first exposure, possibly because the use of "windows" for both age at exposure and time since exposure would have been too cumbersome with the use of Poisson regression. Analyses based on age at exposure would be desirable especially if substantial numbers of workers with very early ages at start of exposure continued to be exposed for many years.
The NCI analyses of exposure rate (or exposure duration) were limited primarily to consideration of average exposure rate and did not take account of detailed exposure histories. However, efforts by Tomásek and others (1994a) and by Thomas and others (1994) to use those histories more precisely yielded results that were similar to those obtained in the NCI analyses and based on the average exposure rate.
The NCI analyses did not take account of errors in the exposure measurements (including estimates of both exposure rate and duration, both of which are needed to estimate exposure). Those errors are generally thought to be largest for early periods of mine operations, when exposure rates were highest. In addition, there is considerable variation in the quality of exposure measurements across cohorts. In general, random error in exposure measurements tends to bias overall risk coefficients downward and might also distort the shape of the exposure-response curve. Because estimates of exposure in early years of mine operations are often subject to greater errors than estimates in more recent years, estimates of the modifying effects of exposure rate and possibly of other time-related factors might be exaggerated. Statistical methods are available for adjusting for exposure-measurement errors but tend to be difficult to use. Furthermore, the application of those methods requires that the error structure be specified, an extremely difficult undertaking, given the complexity of the structure and the lack of adequate data for quantifying many sources of error.
It is difficult to investigate the separate modifying effects of the variables evaluated in the NCI analyses, and this could have important implications for extrapolating to values outside the range of the data. A general difficulty is that we do not have adequate knowledge of the biologic rationale of patterns of risk associated with various factors. The lack of adequate biologic understanding has necessitated the descriptive approach taken in the NCI analyses and in analyses conducted to develop the BEIR VI risk models. However, despite its limitations, the descriptive approach provides extremely valuable information and very likely must serve, with appropriate caution, as the basis for developing risk estimates for both occupational and residential exposure.


