
6
Evaluation and Proposed Improvements
Explicit recognition of modeling uncertainty in the Corps of Engineers 's risk analysis methods should result in a better understanding of the accuracy of both flood risk and flood damage reduction estimates. Early applications of the risk analysis methods, however, illustrate that inadequacies must be overcome before the methods can be expected to yield consistent, defensible results.
This chapter recommends improvements the Corps should make in its risk analysis methods for flood damage reduction studies to overcome the shortcomings identified in previous chapters. This chapter addresses three broad issues: (1) the completeness of the set of uncertainties included in the analysis, (2) the importance of recognizing and effectively dealing with differences between natural variability and knowledge uncertainty, and (3) the treatment of interrelationships among the uncertainties.
CONCERNS WITH THE RISK ANALYSIS METHODS
The three key questions to be asked of risk analysis methods are:
-
Is the set of uncertainties included in the analysis complete?
-
Are uncertainties of different types treated appropriately?
-
Are the interrelationships among uncertainties correctly quantified?
In addressing these questions, the current methods are only partially satisfactory. There are important ways in which the methods should be
improved.
To some extent, improvements needed in the Corps's risk analysis methods arise from a lack of clearly articulated goals of the risk analysis. As noted in a 1995 National Research Council report (NRC, 1995, pp. 120–21, 136–43), “A framework is needed to understand the structure of risk and uncertainty analysis efforts for flood protection project evaluation, and to understand the relative roles of the natural variability of flood volumes, reservoir operations, hydraulic system performance, stage–discharge errors, and uncertainty in hydrologic, hydraulic, and economic parameters.”
This recommendation remains relevant. The current framework does not span the full range of uncertainties important to flood risk and flood damage reduction, it does not clearly differentiate between natural variability and knowledge uncertainty or the relative roles of these uncertainties, and it does not recognize the importance of spatial structure and correlation among uncertainties. A clear a priori articulation of the goals of the risk analysis approach would help illuminate the needed structure of the analysis and help identify conceptual gaps.
ENGINEERING PERFORMANCE
The Corps's risk analysis methods in its flood damage reduction studies use probability concepts in several ways. These might be classified using three levels, as shown in Table 6.1. At the uppermost level, natural variability arising from inter-annual variations in flood severity is quantified by the flood–frequency curve and is indexed by a flood's annual probability of exceedance. At the middle level, project performance measures are defined using probabilities for engineering performance and dollars for economic performance. These measures incorporate both natural variability and knowledge uncertainty. At the lowest level, uncertainty in performance measures is specified. This is knowledge uncertainty in the output measures resulting from knowledge uncertainty in the input information. The input information pertains to hydrologic, hydraulic, geotechnical, and economic factors.
Knowledge Uncertainty
For economic performance, knowledge uncertainty is measured by percentile values of the expected annual damage and expected annual
TABLE 6.1 Levels of Inclusion of Probability in Risk Analysis
|
Engineering Performance |
Economic Performance |
|
|
Natural Variability |
Range of flood frequency |
Range of flood frequency |
|
Performance Measure |
Annual exceedance probability, Conditional nonexceedance probability |
Expected annual damage, Expected annual benefit |
|
Uncertainty of the Performance Measure |
No specification |
Percentile values of annual damage and benefit Variance of expected annual damage, and of expected annual benefit |
benefits of the project plan. A key omission in the Corps's risk analysis procedure is that there is no comparable quantification of knowledge uncertainty in the engineering performance. Variations in flood–frequency and stage–discharge relationships are defined based on uncertain knowledge of the analysis parameters, but there is no comparable specification of the resulting variation in the risk measures defining engineering performance.
In the previous chapter, Table 5.2 shows the results of a risk analysis calculation made using the Hydrologic Engineering Center Flood Damage Assessment (HEC-FDA). The table lists 11 probability measures of engineering performance, but each is a variation on the basic themes of annual exceedance probability or conditional nonexceedance probability. It is axiomatic that every measure of uncertainty is itself uncertain. Knowledge uncertainty in the economic performance measures is described by the percent variation in estimated values. There is presently no comparable presentation of knowledge uncertainty in the engineering performance measures reported by the analysis (with the exception that both the mean and the median of the annual exceedance probability are
reported).
This omission had an important impact on the use of risk analysis in the procedures for levee certification. In 1993 the Federal Emergency Management Agency (FEMA) and the Corps agreed that a levee could be certified as providing adequate flood protection in the event the annual exceedance probability was less than 1 percent. In effect, they chose the mean value of this measure, ignoring uncertainties in the annual exceedance probability. After several years of this practice, some levees certified by this procedure provided inadequate levels of flood protection when compared to the previous criterion used (100-year flood plus 3 feet of freeboard), and the Corps and FEMA abandoned the 1 percent mean annual exceedance probability criterion for a more complicated scheme (described in Chapter 7). This policy change might not have been necessary had it been recognized from the beginning that the annual exceedance probability contains knowledge uncertainty, which can be quantified using percentile values like those used for the economic performance measures.
The Monte Carlo simulation upon which the risk analysis is based generates a set of N values of the annual exceedance probability of the target stage for each reach. Such a distribution computed for an arbitrary location in the Beargrass Creek study is shown in Figure 6.1. The vertical axis is the annual exceedance probability of the target stage at a damage reach. The horizontal axis is its cumulative probability distribution, which is found using the Monte Carlo simulation. The median value of the annual exceedance probability in this damage reach is 0.05, and the range is from 0.005 to 0.157, which measures the extent of the knowledge uncertainty of this statistic. The distribution is slightly positively skewed and the mean annual exceedance probability is 0.055. This means that in any year, the annual expected exceedance probability of flooding exceeding the target stage is about 5.5 percent, so the return period of flooding in this reach is approximately 18 years (1/0.055). This is the “chance of getting wet” for somebody living next to the creek in this reach.
Suppose one wished to define a conservative criterion limiting the “chance of getting wet.” One such criterion could be the one-sided 90 percent confidence level value of the annual exceedance probability, shown in Figure 6.1 to be 0.113. This means that a person living next to the creek can be 90 percent sure that the chance of flooding in any given year is less than 11.3 percent. Equivalently; this citizen could be 90 percent sure that flooding would occur not more frequently than an average of once every 8.8 years (1/0.113). Thus, 8.8 years would be the level of

FIGURE 6.1. The distribution of the annual exceedance probability for a location in the Beargrass Creek study.
protection afforded to this citizen if the level of protection was defined to be the annual exceedance probability achieved with 90 percent confidence.
Engineering performance is currently measured by many different criteria (annual exceedance probability, both expected and median; estimated long-term risk for 10, 25, and 50 years; and conditional nonexceedance probability for p = 0.1, 0.04, 0.02, 0.01, 0.004, and 0.002). The result is a range of risk measures in which the user can easily get lost. The concept of conditional nonexceedance probability is particularly confusing to the public, as pointed out by an earlier NRC committee (NRC, 1995, p. 162). By measuring engineering performance in a manner directly conformal to the way economic performance is measured, the effects of a project on both types of performance can be more readily stated and compared.
The committee recommends that the Corps standardize the annual exceedance probability as its principal engineering performance measure for decision making in flood damage reduction studies. The range of variation of this measure resulting from knowledge uncertainty should be specified by a table of percentile values in the same way as is currently
done for the economic performance measures.
HYDROLOGIC ANALYSIS
Analysis of hydrologic and hydraulic uncertainties in the risk analysis method proceeds according to the interlinking relationships discussed in Chapter 3 and illustrated in Figure 3.1. This method is based on the Corps's traditional deterministic procedures and is validated by a long history of use. However, a number of specific improvements are needed, most of them reflecting inadequacies in the treatment of natural variability vs. knowledge uncertainty.
Parameter Uncertainty for the LP3 Distribution
The current algorithm described in Appendix F of the HEC-FDA manual for generating parameter uncertainty for the log-Pearson Type III (LP3) distribution first generates an uncertain mean and variance as if the logarithms of the floods are normally distributed. This can be done using the known sampling distribution for these parameters with normal samples. However, the algorithm then applies a transformation to generate the corresponding mean and standard deviation for an LP3 distribution, because the exact sampling distribution of the mean and variance of the LP3 distribution is not available. However, the approximation that is used, based upon an expected probability adjustment in Bulletin 17B (IACWD, 1981), has no theoretical justification of which the committee is aware. The sampling scheme implemented in HEC-FDA is intended to provide consistent estimates between traditional estimates of the expected probability frequency curve historically used by the Corps, and that derived from the Monte Carlo procedure. This allows consistent comparisons between risk analysis studies and the historical approach.
Additional uncertainty enters the calculation of flood damage due to knowledge uncertainty regarding the choice of model to use for the statistical distribution of floods. One way the Corps might attempt to address model uncertainty is by assessing whether the LP3 distribution, or some other family of distributions, is more appropriate for describing floods. This, however, would represent a challenge for which there is little guidance in the scientific literature. Furthermore, it is not clear that much would be gained by incorporating that uncertainty, as compared to working with the LP3 distribution and exploring thoroughly the joint
uncertainty of all three parameters of the distribution. In the committee 's judgment, use of the LP3 distribution is reasonable, but a procedure should be developed that more adequately captures the true posterior distribution of the LP3 distribution parameters in a Bayesian sense (Bobee and Ashkar, 1991; Chowdhury and Stedinger, 1991; Stedinger, 1983a).
Neglecting Skew Uncertainty
Hydrologic uncertainty is simpler to deal with than other sources of uncertainty when the analysis is based upon a stationary gauged record. For the most part, hydrologic uncertainty in estimators of the parameters is determined by the limited length of the flood series available to estimate the values of the parameters of the LP3 distribution commonly used in the Corps's method. In that sense, the uncertainty is objective and is described by standard statistical sampling theory (Chow et al., 1988; Chowdhury and Stedinger, 1991; IACWD, 1981;).
When a flood record must be corrected for land use changes, storage, or channel changes, the length of record is still likely to be the primary determinant of hydrologic uncertainty, although subjective assessments of the quality of any adjustments to measured flows are also important. Possible nonstationarity due to subtle shifts in climate and storm paths, which are difficult to document, is sometimes a concern. If regional relationships are used to develop flood curves, then the corresponding estimates of prediction error should be employed (Tasker and Stedinger, 1989).
In its analysis for gauged sites, the Corps bases its description of hydrologic uncertainty upon the confidence interval calculation procedure in Bulletin 17B (IACWD, 1981), a document that contains procedures that federal agencies agreed to employ in the mid-1970s. The Bulletin 17B procedure for calculating confidence intervals employs the assumption that the coefficient of skewness of the logarithms of the floods is correctly specified, independent of the data (Stedinger, 1983b). The actual coefficient of skewness employed is generally a weighted average of the at-site sample skewness and a regional or generalized skewness estimator (IACWD, 1981). The weighted skewness estimators clearly incorporate estimation error because of sampling error in the at-site skewness estimators and also in the regional skewness estimators (McCuen, 1979; Tasker and Stedinger, 1986). As a result, the intervals calculated with the Bulletin 17B procedure are too small. Equations that incorpo-
rate variability in weighted skewness estimators are available (Chowdhury and Stedinger, 1991; Stedinger et al., 1993) and should be used.
It is not appropriate for the Corps to ignore the large uncertainty in the estimated coefficient of skewness of the LP3 distribution used to describe flood risk. Clearly, an operational procedure to adjust uncertainty in the skewness coefficient can be developed using available sampling theory (Bobee and Ashkar, 1991).
Errors in Flood Frequency Curves Derived from Rainfall–Runoff Modeling
Although classical flood–frequency analysis is based on analysis of observed discharge data, practical requirements in Corps flood damage reduction project planning often lead to the use of rainfall–runoff modeling to synthesize the flood–frequency curves used in planning studies. In its risk analysis, the Corps treats these synthetic flood–frequency curves as being of equivalent accuracy to flood–frequency curves derived from a graphical fit to a set of observed flood discharge data. However, synthetic flood–frequency curves have additional error in them because of uncertainties involved in rainfall–runoff modeling. This additional error can be estimated by the difference between the flood–frequency curve developed from observed discharge data at a gauging station, and a flood–frequency curve synthesized at the same location by rainfall–runoff modeling. The committee recommends that the Corps further examine this approach as a way of quantifying the additional error introduced by using rainfall–runoff modeling to produce flood frequency curves at ungauged sites.
Errors in the Stage-Discharge Relationship
The Corps's Engineering Manual (EM) for risk analysis, EM 1110-2-1619 (USACE, 1996b), describes several methods for estimating errors in the stage –discharge relationship: using variability of observed gaging data and rating curves at stream gaging stations, comparing observed high-water marks during historical floods with those produced by water surface profile computation, by sensitivity studies of the effects of variations in Manning's n on water surface elevation, and by standard estimates of error in cross-section profile elevations. When these alternative
methods are applied, there can be substantial differences in the results. The Corps's Engineering Manual recommends taking the highest and lowest estimated water surface elevation for a specified discharge from all the methods and dividing the result by 4 to estimate the standard deviation, on the basis that two standard deviations above and below the mean contain 95 percent of the variability of normal distribution of errors.
GEOTECHNICAL RELIABILITY
Geotechnical reliability is an important consideration in flood damage reduction projects involving levees. The reliability computation accounts for the potential of the levee to breach through soil failure even when the water surface elevation is not sufficiently high to overtop the levee. The method for quantifying geotechnical reliability is described in Chapter 4 and is applied in the case of the Grand Forks case study described in Chapter 5.
As is the case with other parts of the Corps's risk analysis, the geotechnical reliability model does not separate natural variability from knowledge uncertainty. This has important implications. The natural variability (treated as stochastic variability) arises from spatial variations in soil conditions and levee construction. The knowledge uncertainty arises from modeling assumptions made in calculating geotechnical performance. The former varies independently, or nearly so, from one reach to another. The latter is systematic, or nearly so, across all reaches. Probabilistically, the natural variability in site conditions may be independent from one reach to another (presuming large enough reaches to neutralize spatial autocorrelation effects in modeling natural variations), while the knowledge uncertainties are highly correlated. The important implication arises when one calculates the probability of at least one levee failing anywhere along the river. If the reaches are independent, then conceptually, this probability rises according to a relation of the form,
Pr{≥ 1 levee failure} = 1 − (1 − p)n, (6.1)
where p is the probability of failure in any one reach and n is the number of reaches. This probability rises quickly with increasing n. Alternatively, if the reaches are perfectly correlated, the probability of at least
one levee failing anywhere along the river is given by Pr {≥1 levee failure}= p. Just as natural variability and knowledge uncertainty are distinguished in the hydrologic and hydraulic modeling, so too should these types of uncertainty be treated distinctly and differently in the geotechnical modeling.
Levee failures caused by seepage under or through the levee—and even slope instabilities, which are influenced by pore pressures internal to the levee—depend not just on water height, but also on the duration of flooding. Flood duration is not considered in the current geotechnical reliability model, and indeed may be difficult to accommodate in the risk analysis method at all. To this extent, the geotechnical reliability model is an approximation. This is not a crucial limitation, given other approximations in the risk method, but the geotechnical calculations might be significantly improved if duration information were generated by the hydrology and hydraulics model and incorporated in the geotechnical model.
Although the geotechnical reliability model is a sound first step, it is also a new approach. The model would benefit greatly from field validation. The nation has many years of experience with levee performance and, unfortunately, also with levee failures. Much of this experience is documented, and much is accessible to federal agencies. The Corps should undertake statistical ex post studies to compare predictions of geotechnical failure probabilities made by the reliability model against frequencies of actual levee failures during floods.
It should also be pointed out that geotechnical failure of a levee(s) is not the only way in which a flood damage reduction project might fail; for example, hydraulic facilities may fail or detention basins may overflow. The committee thus recommends that the Corps also conduct statistical ex post studies with respect to the performance of other flood damage reduction measures (e.g., detention basins, hydraulic facilities). These studies should be conducted to identify the vulnerabilities (failure modes) of these systems and to verify engineering reliability models.
ECONOMIC PERFORMANCE
The assessment of economic performance of a project is measured by project net benefits. Net benefits are the difference between benefits and costs, where benefits are defined as the reduction in flood damage resulting from the project. Assessment of economic performance builds upon hydrologic, hydraulic, and geotechnical factors that enter into the
assessment of engineering performance, plus the computation of flood damage to structures or other activity in the floodplain. While engineering performance is focused on risk at each damage reach, economic assessment is more complex, involving the integration of information at several spatial scales.
In the Beargrass Creek case study (Chapter 5) there are five spatial scales of analysis, as shown in Table 6.2. The three main scales are the following:
-
project scale at which all the economic analysis is summarized,
-
damage reach scale used for most analysis in HEC-FDA, and
-
structure scale where the assessment of damage to structures is carried out.
The single project is subdivided into 21 damage reaches, which contain 2051 structures. In between these three main scales are two others:
-
three main river reaches, used to identify the components of the project plan, and
-
hydraulic cross sections (263), used for determining the water surface profile.
At Beargrass Creek, there are, on average, about 100 structures per damage reach.
Monte Carlo simulation is repeated, independently, 100 times for each structure. Four variables are randomized for each structure: first-floor elevation, value of the structure, value of the contents, and other valuesof the facility. The results of these simulations are aggregated by damage category (e.g., single-family residential, multifamily residential)
TABLE 6.2 Scales of Spatial Analysis in the Beargrass Creek Study
|
Spatial Scale |
Uses of Spatial Unit |
|
Project (1) |
Expected Annual Damage (EAD) and Benefit-Cost analysis |
|
Main River Reaches (3) |
Incremental analysis to get National Economic Development (NED) plan |
|
Damage Reaches (21) |
Basic unit for analysis using HEC-FDA, including flood–frequency curves |
|
Hydraulic Cross Sections (263) |
Water surface elevation profile computation |
|
Structures (2,051) |
Structure inventory |
to form a damage-stage function with uncertainty for each category of damage. The category damage functions are aggregated to form a damage–stage function for each reach. In effect, about 400 random variables are accumulated into a single random variable for each reach, which is damage as a function of stage. This process is illustrated in Figure 6.2 for damage to multifamily structures in damage reach SF-9 at Beargrass Creek.
Development of the distribution of damages considering each structure in a reach is the first stage of the risk analysis. In the second stage, Monte Carlo simulation is done 10,000–100,000 times for each damage reach. Three functions are randomized in this second stage: the flood discharge–probability curve for flood magnitude, the stage –discharge curve for water surface elevation, and the damage–stage curve for the degree of damage. For each randomization in stage 2, the damage curve is integrated across the probability range of flood severity to determine the expected annual damage for that replicate. The ensemble of all the expected annual damage estimates so formed from the 10,000–100,000 simulations yields the probability distribution of the flood damage at that reach for each plan being considered.
Once this analysis is complete, the expected annual damage (EAD) for the project is found by summing the mean values of the expected annual damages for each reach. Statistics of the percentile distribution (25%, 50%, 75%) of the expected project damage for this plan are currently computed by summing the corresponding percentile values of the distributions of each reach. Hence, the values of 22 random variables at the damage reach scale are aggregated to form a single random variable at the project scale, which defines the flood damage for a given plan.
The Engineering Regulation that guides the evaluation process for flood damage reduction projects (USACE, 1996b) calls for a table showing the probability distribution of the reduction in expected annual damage due to the project plan, with percentiles at 5%, 25%, 50%, 75%, 95%, and it calls for a similar table for the percentile distribution of project plan net benefits. The reduction in expected annual damage is found in each case by subtracting the damage with the plan from that without the plan. Thus, a percentile distribution describing project benefits is computed as the difference between with-plan and without-plan percentile distributions of flood damage.
The procedure of adding and subtracting percentile values of statistical distributions of flood damage as if they were arithmetic quantities is statistically unsound because it ignores the degree of interdependence or correlation among these distributions.

INTERDEPENDENCE IN RISK ANALYSIS FOR FLOOD DAMAGE ASSESSMENT
The principal variables of the flood damage assessment—flood discharge, stage, and damage—are functionally dependent on one another through the stage–discharge curve and the damage–stage curve at each damage reach. Because all these curves also contain uncertainty determined independently for discharge, stage, and damage, the end result is that discharge, stage, and damage are strongly correlated variables. The principle of transforming the flood–frequency curve into a stage–frequency curve, and then into a damage–frequency curve takes account of that interdependence.
However, care must still be taken to sample each function correctly, and there are several choices as to how the derived damage functions should be selected. The choice will affect the computed variance of expected damages for the reach due to economic uncertainty. Understanding the correct error structure for generating damage functions requires understanding correlation between errors in structural value and content value at individual structures, and it requires understanding correlation errors in first-floor elevations of structures at different locations. These issues are not addressed in the current implementation of HEC-FDA.
It appears that apart from treating the interdependence and the interaction among the three main variables at each damage reach, the current version of the risk analysis procedure assumes that all the random variables are statistically independent. In the Engineering Manual describing the procedure (USACE, 1996a), correlation is mentioned only twice: once on p. 5-1 (“Any correlation of separate factors should also be considered in the analysis and accounted for in the combination of individual uncertainties”) and once on p. 5-4, which shows a relationship between the uncertainty in the stage–discharge relationship and the slope of the river. The flow charts describing t.he computational procedure in this manual make no further reference to correlation or interdependence, and the input data to the HEC-FDA program do not include correlation coefficients or other representations of interdependence.
It would appear, at least on the surface, that some of the input variables used in the analysis are highly dependent. For example, the value of a structure and the value of its contents would usually be correlated, such that if a particular structure is actually more valuable than an estimate would indicate, most likely its contents are also more valuable than the estimate. Similarly, if the first-floor elevation of a structure is in error by some margin, say one foot too high, it is likely the first-floor ele-
vation of an adjacent structure is also too high by a similar amount. This is because both structures have their elevations estimated from topographic mapping, and errors in mapping tend to be systematic over some distance.
These two examples introduce two different types of interdependence —cross-correlation between two variables (e.g., value of structure and value of contents) and spatial interdependence of the same variable at two locations (e.g., first floor elevations of adjacent structures). The spatial correlation issue has special significance in flood damage assessment because of the different spatial scales at which the various components of the problem are being analyzed (Table 6.2).
CORRELATION LENGTH
There are several measures to describe the degree of spatial correlation ρw as a function of distance w between two locations. The simplest of these is the correlation length, Lr, also called the scale of fluctuation (Vanmarcke, 1983), which is the integral of the area under the spatial correlation function ( Figure 6.3) and which is calculated as,
Because correlation is a dimensionless quantity while distance has the dimension of length, the value of Lr also has the dimensions of length; hence the name correlation length. There are other measures of spatial correlation available, most notably the variogram used in geostatistics (Cressie, 1993), but correlation length sufficiently describes the degree of spatial correlation for purposes of this discussion.
In the Beargrass Creek study, for example, the first-floor elevations of the structures were estimated from 1-inch-to-100-feet topographic mapping, using a contour interval of 2 feet. As a check, the first-floor elevations of 195 structures were determined by land surveying from which it was concluded that “the average of the absolute values of the differences between the estimated and surveyed first floor elevations for this sample is 0.62 ft.”(USACE, 1997c, p. B-5). Because the ( x,y) location of each structure is determined through surveying, as well as the elevation z, it follows that the horizontal distance between each pair of structures can be found, and a spatial correlation function of the errors
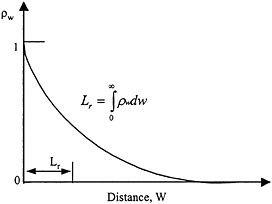
FIGURE 6.3 The spatial correlation function, ρw, and correlation length, Lr.
could have been constructed with the information gathered in the flood damage reduction study.
SPATIAL AGGREGATION
Spatial aggregation refers to the assembly of a set of random variables within a defined region into a single variable representative of that region. This happens within each damage reach when damage to structures is aggregated into a damage–stage curve for the reach, and it happens at the project scale when statistical measures of damage at the reach level are accumulated to form measures of the damage for the project.
The three basic spatial scales of analysis in flood damage assessment are shown in Figure 6.4 for the South Fork of Beargrass Creek. This figure shows water surface profiles for four different flood severities, with the locations of the structures superimposed. The river reach of approximately 12 miles in length is divided into 15 damage reaches for statistical analysis, averaging 0.8 miles in length. If a larger-than-anticipated precipitation depth corresponds to a specified exceedance
probability, it will result from an unusually severe storm over most, if not all, of the drainage area. The corresponding uncertainties in the project flood discharge are those likely to systematically propagate throughout all the damage reaches.
Similarly, the laws of hydraulics impose a significant degree of continuity of water surface profiles through damage reaches. The backwater effect of the bridge constriction at the upper end of damage reach SF-1 propagates some distance upstream, perhaps through damage reaches SF-2 and SF-3 but probably not any farther. Backwater effects extend for longer distances in flatter terrain. Although there are likely to be correlations between errors in damages between adjacent structures within a damage reach, it is unlikely that these correlations in structure damage would extend over long distances. It is expected that the correlation length for errors in the flood discharge estimates may be on the order of the length of the whole river reach, and that the correlation length for errors in flood stage is of the order of one damage reach. The correlation length of errors in structure damage, however, is probably much less than the length of a damage reach.
An important principle in spatial aggregation is that when quantities are averaged over nonoverlapping intervals, the correlation between the averaged quantities goes to zero when the averaging interval becomes much larger than the correlation length (Vanmarcke, 1983, p. 199). In other words, if the length of the damage reach, ΔL, is significantly larger than the correlation length of the errors in structure damage, Lr, then the stage–damage curves in adjacent damage reaches can be considered statistically independent. However, the representation of the variance of variables within each reach will still be in error.
Because the correlation length of errors in hydrology and hydraulics is probably much longer than that of errors in the damages, it is likely that the assumption of independence of the flood–frequency curves and stage–discharge curves for each damage reach is invalid. Indeed, the opposite argument can probably be made, namely that errors in flood– discharge and stage–discharge relationships are highly correlated between adjacent damage reaches.
In the HEC-FDA program (USACE, 1998a, p. 7-15) the 25 percent, 50 percent, and 75 percent values of the damage reduced by project plans are displayed, computed by subtracting the corresponding percentiles of the damages with and without the plan and summing the results over all reaches in the project. This process of adding and subtracting percentiles of distributions as if they were expected values is not statistically sound. The values of percentiles of distributions depend on the variance and other moments of the distribution. As shown in Equations 6 and 9 of Appendix D, the variance of a sum or difference of a pair of random variables depends in part on the correlation between them. Because these correlations have not been accounted for in the risk analysis procedure, there is no guarantee that the percentile variabilities of project flood damages and benefits determined in the current manner correctly reflect the actual variability of the damage reduced by the project plan.

other moments of the distribution. As shown in Equations 6 and 9 of Appendix D, the variance of a sum or difference of a pair of random variables depends in part on the correlation between them. Because these correlations have not been accounted for in the risk analysis procedure, there is no guarantee that the percentile variabilities of project flood damages and benefits determined in the current manner correctly reflect the actual variability of the damage reduced by the project plan.
The procedure of adding up the percentile values at each reach to get values for the project is valid in the event that the damage distributions at each reach are perfectly correlated. In that case, if the project damage is at its 25 percent value, the reach damages are also all identically at their 25 percent values, and the values for the reaches can legitimately be summed to give the value for the project. The long correlation length of the hydrologic and hydraulic uncertainties makes it likely that the reach damages are correlated, but that correlation will not be perfect. Indeed, the Monte Carlo simulations for each reach are based on the assumption that the reaches are independent.
There is thus an internal contradiction in the method—to determine variability in project reduced damage and net benefits, the summation made over values at the damage reaches relies on the assumption that reach damages are perfectly correlated from reach to reach; however, the computational procedure used to create the damage values treats each reach completely independently of its neighboring reaches upstream and downstream. If the reaches are perfectly correlated, they all behave in complete statistical cohesion, with damage errors everywhere being equally higher or lower than expected values. Such perfect correlation is rare in nature and unlikely in this instance because of the random events that occur as a flood moves through a river system.
Consider again the basic questions asked at the beginning of this chapter. For risk analysis of economic performance, is the computational procedure theoretically valid? The answer is that it is not. The basic procedure of integrating the discharge, stage, and damage through Monte Carlo simulation is reasonable; however, there are several unresolved issues regarding correlation and spatial aggregation at the structure scale, correlation from the structure scale to the damage reach scale, and correlation from the damage reach scale to the project scale. The second question raised at the beginning of the chapter is whether there are ways of improving the precision of the probability estimates. The following section suggests some ways of doing that.
COMPUTATIONAL ALTERNATIVES TO MINIMIZE CORRELATION EFFECTS
The addition of formal measures of risk to the flood damage assessment procedure is a necessary step, which recognizes the inherent uncertainty in the computations and their results. It is also a complex procedure. Unfortunately, the rigors of treatment of combinations of random variables allow only a limited number of standard operations, far fewer than if the uncertainty in the variables is ignored.
In effect, the current risk analysis procedure evolved from an earlier deterministic procedure by randomizing uncertain variables, solving equations for each randomization, and then averaging over the results to get expected values. This is a valid process provided that correlation is introduced where appropriate in generating random variables. There may also be some ways to change the computational process to minimize or eliminate the effects of correlation, as discussed below.
Determine the Scale of Randomization
The Monte Carlo analysis should be conducted at the spatial scale at which the results are required. If results are required for the project, the Monte Carlo replicates should be constructed at the project. In other words, a Monte Carlo project realization would be defined by a set of random variables specifying everywhere in the project the errors in flood discharge, stage, and damage to each structure. Then, the resulting engineering and economic performance measures can be determined for this realization. By repeatedly generating such project realizations, the statistical variability in the project engineering and economic performance measures can be determined. As a part of this project realization calculation, corresponding performance measures can also be determined for each damage reach so that the distribution of damages by category and reach could be defined. In addition, this approach also allows quantification of the project benefits and of the reduced risk of flooding at each individual structure in the project. Advances in computing power mean that methodological approximations employed in past practice, such as aggregation of all the structure computations to the damage reach scale, may no longer be needed.
Introduce Correlation in Monte Carlo Simulation
Correlation in random variables should be introduced where necessary by selecting the random variables in Monte Carlo analysis using a system for generating correlated sets of variables rather than using a system that generates independent sets of variables. This practice is common in groundwater modeling where correlated sets of hydraulic conductivities and other aquifer properties are generated by Monte Carlo simulation. Similarly, there is a long history of generating correlated random variables to describe stream flow in a basin or region (Salas, 1993).
Randomize Structures Jointly
The damage reach mainly functions as a place of aggregation of structures to an index location, and this should be considered in the context of other structures. If the view shown in Figure 6.2 is adopted, each structure can be left at its original location and can be attributed with the computed water surface elevations with and without the plan for different flood severities. In that manner, each structure can be randomized in association with its near neighbors. The damage reach is really a labeling device to show how damage varies along the river. If the Corps elects to retain the two-stage Monte Carlo simulation process (simulate the structures first, then the damage reaches), the method should generate appropriate flood stage–damage functions for each reach. If a set of structure elevations, structure values, and content values are generated jointly to create a realization of the economics for a reach, one obtains one realization of the damage function for the reach. These empirical reach–damage functions computed at the first stage can be generated and stored for use at the second-stage reach-level Monte Carlo analysis. Thus, instead of using some artificial method for generating reach –damage functions, one can sample from the 100 functions generated randomly at the first stage. These would be combined with descriptions of flood–frequency and flow–stage relationships. This would retain the economic spatial interdependencies within a reach for use in the second-stage analysis.
Randomize Hydrology and Hydraulics for River Reaches
The flood hydrology and hydraulics should be randomized at the scale of the river reach rather than at the damage reach. In this manner the flood profiles for a given event would move randomly up and down in cohesion over the whole reach, as regional hydrology and hydraulics suggest they should. This concept would also allow quantification of uncertainty in the spatial extent of the floodplain boundary. There is some upper limit on how long a river reach can be to be considered as a single statistical entity. The whole Upper Mississippi River basin, for example, would need to be subdivided significantly for such an analysis.
Analyze Statistical Variability in Project Benefits Rather than Damage
For the economic analysis, the project benefits are measured by the reduced damage at each structure. For each project plan and cycle of randomization, the issue of prime concern is the difference between the damage with the plan compared to the damage without it. That calculation is presently conducted by determining the flood damage for all structures in a damage reach and then aggregating over the damage reaches to get the expected annual damage for the project. Finally, after all aggregation is complete, the project benefits are determined by taking the difference in damage with and without the project plan. An alternative to this computation is to consider the project benefits structure by structure and then to aggregate those benefits over the project.
Figure 6.5 shows the water surface profiles for existing conditions and under a proposed flood damage reduction plan for the 10-year and 100-year floods in a damage reach. The box symbols shown in the figure are the first-floor elevations of the structures in this damage reach. In each case, the proposed water surface profiles (shown by the solid lines) lie beneath the existing profiles (shown by the dashed lines), more so at the downstream end of the reach than at the upstream end. The difference in elevation between the water surface profile and the first floor elevation of the structure measures the depth of flooding at each structure, which is then related to the flood damage.
If the flood severity is indexed by its annual probability p (p = 1/T, where T is return period of the flood) and by its location x in river miles along the river, then the damage at that location can be denoted as D(p, x). If the damages under existing conditions and with-plan conditions are

FIGURE 6.5 Comparison of water surface profiles for existing conditions and with a proposed flood damage reduction plan. This profile is from damage reach SF-9, Beargrass Creek.
denoted by De, and Dw, respectively, then the project benefit B for a particular flood at location x is given by
B(p,x) = De(p,x) − Dw(p,x). (6.3)
The annual benefits of the plan for this severity over the whole project are then determined by integration over the length L of river affected by the project:
If the project benefit is determined for a set of floods, p, then the expected annual benefit (EAB) of the project considering all floods is found by integrating the benefits over the range of p:
By comparing this value to the project costs, the economic value of the project is determined.
This method of determining the project benefits does not require any more information than is used in the current procedure. It just manipulates that information according to a different computational sequence. This method has some advantages:
-
It permits localized benefits and the risk of flooding to be determined down to the level of individual structures, instead of lumping all structures into a damage reach value
-
It visually shows the difference between the existing and proposed flood profiles so that the effects of the plan at particular locations and for different flood severities can easily be seen.
-
The computation in Equations 1–3 in Appendix D can be done for each Monte Carlo replicate of the flood water surface profile considering random errors in the profile and in the elevations of the structures. By summing across the whole project the damage reduced at each structure, Monte Carlo replicates for benefits for the whole project can be found, and their mean and percentile distribution can be determined once the Monte Carlo simulations are complete. This is a valid statistical procedure not confounded by the problem of aggregating probability distributions from each damage reach as is now done in HEC-FDA.
-
By calculating the difference between the existing-conditions and with-plan damage estimates at each structure, the effects of errors in elevation and in values of the structure and its contents at a particular structure will be diminished. In other words, if the first-floor elevation of a structure is in error, the damage to a structure under existing and proposed conditions will be affected by nearly the same amount, so when the benefits are determined by taking the difference in the two damage values, the effect of the error in first-floor elevation will nearly be cancelled out. Similar considerations apply to the effects of all other errors being considered. It is also possible that this approach will significantly diminish the effects of correlation in the errors.
It is possible that this approach to determining the variability in the project benefits will result in significantly smaller variance estimates than those currently being determined because the current estimates are
being made by taking the differences between two large and highly variable numbers—the project damage estimates with and without the plan after all randomization is complete. The key point is that what matters in economic assessment of flood damage is not so much the absolute magnitude of the flood damage, but rather the extent to which the proposed plan will reduce that damage. The committee recommends that the computational procedure for risk analysis of economic performance focus on the uncertainty in the project benefits rather than on the uncertainty in the project flood damage.
Statistically Compare Net Benefits from Alternative Plans
If an accurate estimate of the variance of the damage reduced by a project plan can be found, it could be used to determine whether one project plan has expected annual net benefits that are better than those of another plan in a statistical sense. In other words, it is possible that the addition of a marginal component to a plan slightly increases the expected annual net benefits but that the increase is not statistically significant when compared to the uncertainty of estimating the annual benefits. In this manner, the statistical measures of the variability of the benefits could have a greater influence on project decision making than they currently do.
It is perhaps impossible to achieve complete statistical rigor in a complex problem like risk analysis for flood damage assessment. The key is to be able to construct an analysis capturing the critical aspects of the statistical variability of the problem without excessive investment in details, which may have an insignificant impact on the final risk estimates. Alternative computational methods need to be tested in further case studies of flood damage reduction projects so that a deeper appreciation is obtained of the advantages and limitations of these alternatives in risk analysis.


