Wastewater-based Disease Surveillance for Public Health Action
As the COVID-19 pandemic emerged in early 2020, public health officials worked quickly to establish clinical testing and set up systems to track the spread of the disease. The U.S. response also included the rapid development of wastewater surveillance to monitor trends and anticipate disease incidence in communities. By spring of 2020, several wastewater surveillance efforts were being supported by a variety of funding sources, and the National Wastewater Surveillance System was established in September 2020 to build upon those efforts with pilot sites in eight states. As of October 2022, the NWSS comprised more than 1,250 sampling sites in 42 states, covering a population of 133 million individuals.
A National Academies’ report examined the potential value and limitations of wastewater surveillance data for prevention and control of infectious disease. The report concludes that the experience during COVID-19 demonstrates that wastewater surveillance data are useful for informing public health action and are worthy of further development and continued investment.
In September 2020, the U.S. Centers for Disease Control and Prevention (CDC) launched the National Wastewater Surveillance System (NWSS) in partnership with the U.S. Department of Health and Human Services in order to coordinate the many efforts across the nation to use wastewater surveillance. The NWSS has helped expand the network of utilities and health departments monitoring SARS-CoV-2 in wastewater and provided support and guidance for sampling, analyzing, and interpreting data for public health action. Figure 1 below shows the National Wastewater Surveillance System (NWSS) as of October 2022.
Wastewater surveillance systems collect samples of untreated municipal wastewater that are then analyzed in the laboratory for biomarkers of infection, most commonly pathogen DNA or RNA that are shed by infected persons. Wastewater surveillance does not track or identify infectious disease for an individual person or household; rather, it detects the presence and changing quantities of a pathogen within the larger community. The measurement can be used to understand the prevalence of infection in a community and inform public health decisions.
The concept of wastewater-based epidemiology first emerged in the 1940s to better understand polio transmission in a population. Wastewater surveillance initiatives in the 1990s, 2000s, and 2010s were used in global polio eradication efforts, to detect prevalence of the flu, and to monitor the use of pharmaceutical and illicit drugs. The COVID-19 pandemic spurred rapid innovation, development, and implementation of wastewater surveillance. In 2022, wastewater surveillance has been used for monkeypox and the re-emergence of poliovirus.
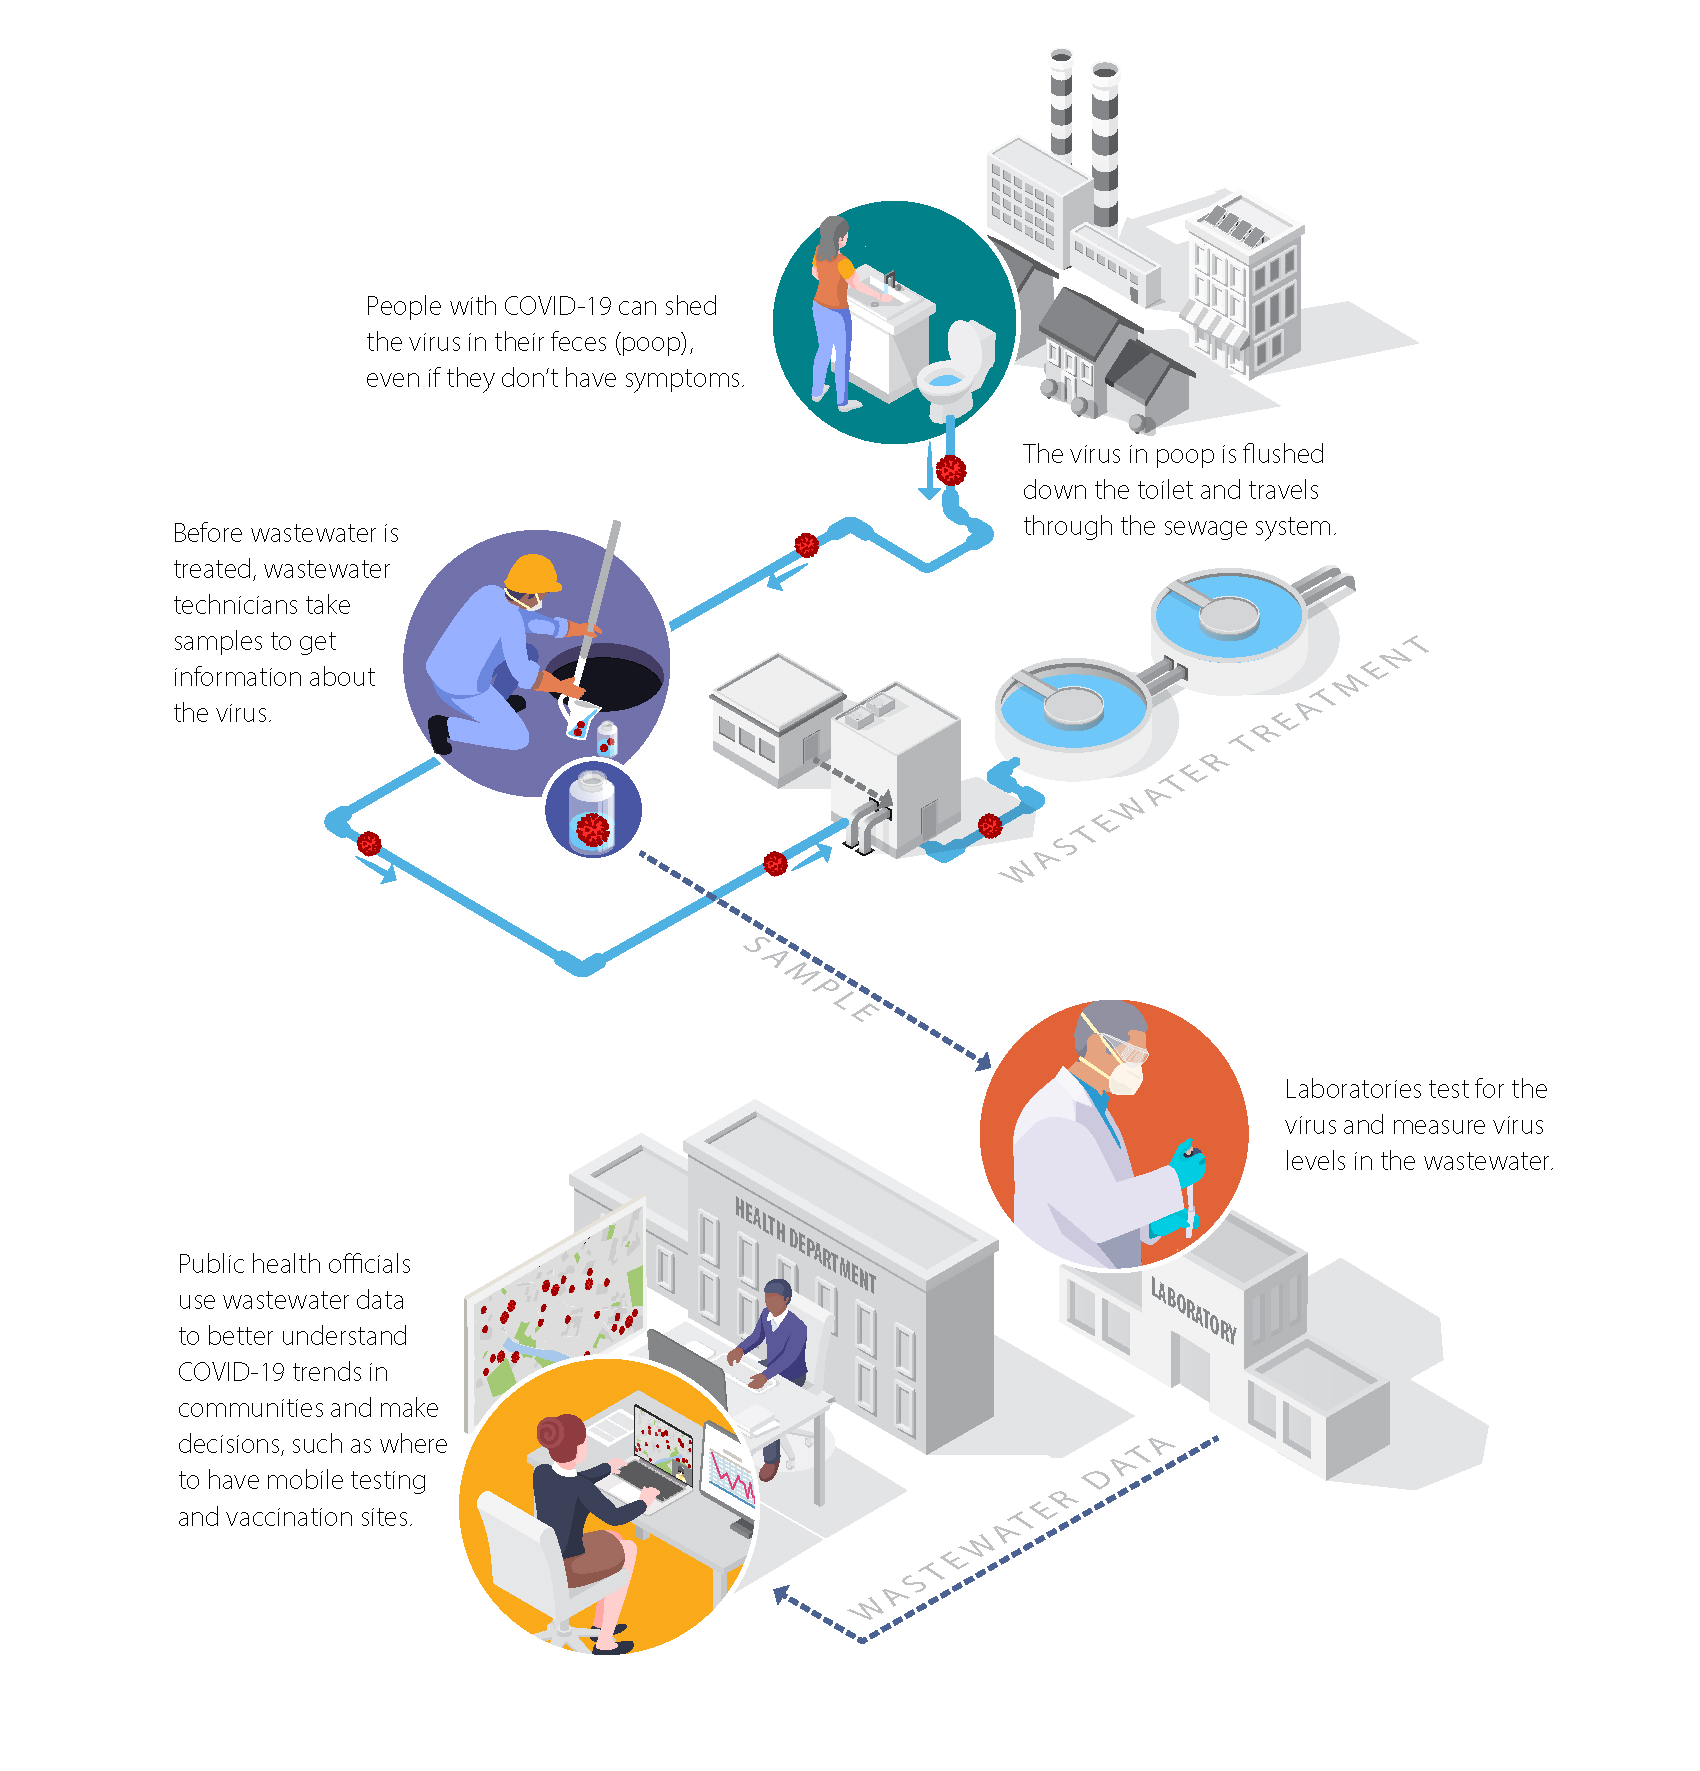
Figure 2 Components of a community-level wastewater surveillance system. Infected persons can shed DNA and RNA from an infection into the wastewater system through feces and also through urine, saliva, and other sources. Household wastewater is discharged into the sewer system and collected at the inflow to the wastewater treatment plant, where sampling occurs. The sample is then analyzed in a laboratory, and the data are analyzed and published on internal- or external-facing dashboards. These data are then used by state, tribal, local, territorial, and national officials to support decision making on public health interventions, and the distribution of resources to support public communication. SOURCE: Adapted from https://www.cdc.gov/healthywater/surveillance/pdf/Wastewater-COVID-infographic-h.pdf.
Where is wastewater sampled?
Community-level wastewater surveillance sampling generally takes place where sewage flows into wastewater treatment facilities. The geographic area serviced by a network of pipes (sewers) feeding into an individual wastewater treatment plant is termed a “sewershed.” Sewersheds can range in size from very small (a few hundred) to very large (over a million) people. Samples can also be taken at pump stations and manhole sites to monitor disease trends within smaller areas (“sub-sewersheds”), as shown in the example below for Jefferson County, Kentucky.
In the United States, 84 percent of households are connected to a wastewater treatment plant (U.S. Census, 2022). The remaining unsewered population is not directly addressed by this epidemiological approach, although some members of this population regularly commute to sewered areas for work, school, or other activities.
Figure 3 Map of sewersheds and sub-sewersheds used for SARS-CoV-2 in Jefferson County, Kentucky. Triangles are wastewater treatment plants. Shaded areas represent sewersheds (delineated by heavy black borders) and sub-sewersheds. Circles are individual sub-sewershed sampling locations. SOURCE: Reproduced from Holm et al., 2022b with permission from the Royal Society of Chemistry. https://pubs.rsc.org/en/content/articlepdf/2022/ew/d1ew00672j
Wastewater surveillance has been a critical tool in tracking poliovirus because, in its absence, asymptomatic poliovirus shedding can remain undetected and allow community spread until detected through clinical cases of acute flaccid paralysis (which occurs in ≤0.5 percent of infections). Detection through wastewater triggers targeted screening of the community, which is more efficient and cost-effective than continuous large-scale population-based screening of individuals.
How Do the Data Help Us Track Viral Trends?
A large fraction of people infected with COVID-19 shed the SARS-CoV-2 virus in their stool, even when they are asymptomatic. Studies have confirmed correlations between wastewater viral data and conventional disease surveillance data (such as clinical testing and hospitalization) for specific localities. When infections are low, wastewater results can help identify when the pathogen begins to circulate in the community or when prevalence starts to increase. When infections are high, wastewater results can help identify increasing, plateauing, or declining trends in the prevalence of infection within the sewershed.
Wastewater surveillance data can be used to supplement conventional disease surveillance information in important ways. For example, because wastewater surveillance does not require people’s active participation, it avoids data biases due to testing availability and care-seeking behavior. In addition, wastewater surveillance has become more important as people increasingly take COVID-19 tests at home that are not reported to local health officials. Many state and municipal agencies have developed internal and public-facing dashboards to provide up-to-date SARS-CoV-2 wastewater levels, like the example below.
Figure 4 Example dashboard that presents wastewater data in addition to other surveillance data from Milwaukee, Wisconsin. SOURCE: Reproduced from Holm et al., 2022b with permission from the Royal Society of Chemistry. https://www.dhs.wisconsin.gov/covid-19/wastewater.htm
Using Wastewater Data to Determine Local Trends
Sewersheds within the same U.S. regions often exhibit similar SARS-CoV-2 dynamics, but wastewater data can provide more spatial resolution to distinguish trends in nearby communities or within a community. For example, the figure below shows trends in wastewater data for the cities of Palo Alto, San Jose, and Sunnyvale, which are all in Santa Clara County, California.
Figure 5 Dashboard of SARS-CoV-2 RNA data from Northern California without other surveillance data. SOURCE: Sewer Coronavirus Alert Network, https://soe-wbe-pilot.wl.r.appspot.com/charts. Courtesy of Zan Armstrong, Alexandria Boehm, and Marlene Wolf
The City of Houston, Texas collected and analyzed samples from 39 wastewater treatment plants throughout the metropolitan area to identify localized trends as shown in the figure below. Several communities conducted sampling at locations in addition to the wastewater treatment plant to identify neighborhood-scale trends that were not detectable in sewershed-level observations.
Figure 6 Spatial plot of 39 wastewater treatment plants in Houston, Texas, colored by viral load as of June 14, 2021, and with arrows indicating if the location was experiencing an increasing, decreasing, or plateauing trend compared to the previous week. The size of the arrow signifies the magnitude of the trend. SOURCE: https://covidwwtp.spatialstudieslab.org/
Wastewater Surveillance for Detecting SARS-CoV-2 Variants
As SARS-CoV-2 has mutated throughout the course of the COVID-19 pandemic, wastewater variant tracking has been used to understand the spread of known and emerging variants. PCR-based testing for Alpha, Delta, and Omicron variants has become widely implemented in wastewater surveillance efforts because it provides a more comprehensive representation than the small fraction of clinical cases being analyzed for variants. Once developed, PCR test results can be generated within hours, producing quantitative data on the relative amounts of variants circulating among the population in a sewershed as shown in the figure below. Wastewater surveillance has in some cases provided information on variants prior to clinical data. For example, in the California Bay Area in late 2021, the Omicron variant was detected with PCR assays in some sewersheds before Omicron cases in the community were detected clinically.
Figure 7 PCR (polymerase chain reaction) testing was applied to water samples from eight mid-sized wastewater facilities in southeast Virginia to understand the variants circulating in those communities. NOTE: VOC = variants of concern. SOURCE: Hampton Roads Sanitation District.
A second approach uses genome sequencing to track emerging SARS-CoV-2 variants, including novel lineages, without prior knowledge of the suspected variant sequence. Because of the complexity of the analysis, sequencing has not been performed as frequently as PCR-based testing, although genome sequencing technology and analysis methods for wastewater have matured substantially since the beginning of the pandemic.
How Have the Data Informed Public Health Decisions?
When analyzed in comparison with other disease surveillance information, wastewater surveillance data are useful in informing public health responses. The data can be useful not only to confirm viral trends but also to inform public health policies and public health and clinical resource allocations. Explore the examples below to learn how local, state, federal, and international groups have used the data to inform public health actions:
In July 2020, Utah conducted wastewater surveillance across the state to examine the status of viral spread as diagnostic testing decreased. The decrease in levels of SARS-CoV-2 RNA in wastewater provided confidence that disease trends were actually decreasing, consistent with clinical testing data trends.
The Los Angeles County Department of Public Health uses eight indicators to provide the department to provide the department with an early alert of concerning trends that could result in future high rates of transmission and/or increased illness severity. One of these indicators is determining the number of sewer systems with a twofold or greater increase in wastewater SARS-CoV-2 concentration. Depending on the level of concern, the county institutes mitigation measures (e.g., testing, masking indoors, contact tracing) for priority sectors such as skilled nursing units, K–12 schools, and persons experiencing homelessness.
In North Carolina, SARS-CoV-2 wastewater data are one of seven key metrics to monitor for increasing community spread and illness.1 The weekly average SARS-CoV-2 virus copies found per person from the 25 network sampling sites across the state are evaluated along with the percent of emergency room visits for COVID-19-like symptoms, the number of COVID-19 hospital admissions, the number of reported COVID-19 cases, vaccination and booster rates, the presence of COVID-19 variants among new cases, and CDC’s COVID-19 community levels by county. All seven metrics are assessed together and compared over time to understand the current threat of the virus in the state.
New Zealand’s Prime Minister Jacinda Arden ended a 3-day lockdown for Auckland based on negative results for wastewater testing despite three new cases of COVID-19 in the county’s largest city. She attributed her decision to community transmission data from wastewater surveillance and announced that the rest of the county would drop to Level 1 restrictions (de Jong, 2021).
Using wastewater data combined with other surveillance data, the City of Tempe canceled public special events and meetings on March 19, 2020, and the mayor issued an order for the temporary closure of dining, fitness, and recreation venues.
In Ohio, a 10-fold increase in SARS-CoV-2 RNA levels within the state’s wastewater surveillance system triggered an email warning to state and local health departments, utilities, and community leaders. The notifications were used to inform actions and allocate resources (Kirby et al., 2021). Within the warning areas, the state offered local health departments testing, vaccination, and contact tracing unit support. As of May 2022, 1,500 email warnings had been generated.
In Utah, SARS-CoV-2 RNA levels in wastewater were incorporated in a metric alongside a 7-day positivity rate and 14-day case rates (equally weighted) to rank the state’s 99 small area statistical health units for intervention. Decision makers used this risk ranking, along with other considerations such as the existing resources in the area (e.g., existing testing sites), at a weekly meeting to prioritize where to send resources. An estimated 1.5 million tests were allocated based on this prioritization.
In Oklahoma City, ZIP codes with high levels of SARS-CoV-2 RNA in wastewater relative to the rest of the city were identified. The Oklahoma City Public School District then conducted targeted communication to parents of students in high-load areas. Text messages encouraged parents to get tested and vaccinated, and they provided information about where to get tested and vaccinated. To complement the communication campaign, area hospitals and the health department deployed targeted vaccination and testing efforts in the area.
Through a partnership with the Chesapeake Local Health Department, City Waterworks, Hampton Road Sanitation District, and local university partners, the State of Virginia used sub-sewershed-level wastewater sampling in the Chesapeake area to target vaccination campaigns to high-prevalence areas and educate the public.
The City of Davis, California, used wastewater surveillance data to determine where to send geotargeted public health communications (e.g., door hangers, texts, phone calls, emails) on how to reduce the risk of contracting COVID-19 and where to get tested.2 For example, in July 2021, 3,000 door hangers were delivered in response to spikes in levels of SARS-CoV-2 RNA in wastewater in three different neighborhoods.
In June 2021, the Town of Beaufort, North Carolina, and the state health department issued a joint press release warning that elevated levels of SARS-CoV-2 were detected in the wastewater, although the number of new COVID-19 cases detected had not increased in testing results. Residents of the town were reminded to stay vigilant and get vaccinated.
In central Oklahoma, physicians used the breakdown of the Omicron and Delta variants in the wastewater to decide where to allocate monoclonal antibody therapies.
In Houston, Memorial Hermann Health System found the city’s data on levels of SARS-CoV-2 RNA in wastewater to be the most reliable indicator in predicting upcoming hospital capacity needs related to COVID-19. It found that trends of increasing SARS-CoV-2 RNA in wastewater provided an early indicator of an increasing rate of change of hospitalization by 2 weeks and used this information to prepare in the fall of 2021 and in the winter of 2022 when the hospital system’s capacity was stressed. Decisions such as which unit to open next (e.g., post anesthesia care unit or common space), how to ensure adequate staffing for the new unit (e.g., contracts with nursing agencies or rescheduling provider staff), and whether to initiate deferrals of elective surgeries were based on the wastewater trends.
Increasing General Public Awareness of Disease Risks
The public has shown strong interest in wastewater surveillance data. Wisconsin’s dashboard, for example, was visited 127,000 times in the first 18 months. Likewise, Houston’s dashboard was visited 107,000 times as of May 15, 2022, with as many as 10,000 clicks in a single day. Both dashboards experienced increased attention during COVID-19 surges. Increased risk awareness of COVID-19 trends is one of several factors that predicts increased protective health behaviors among the general public (Cipolleta et al., 2022).
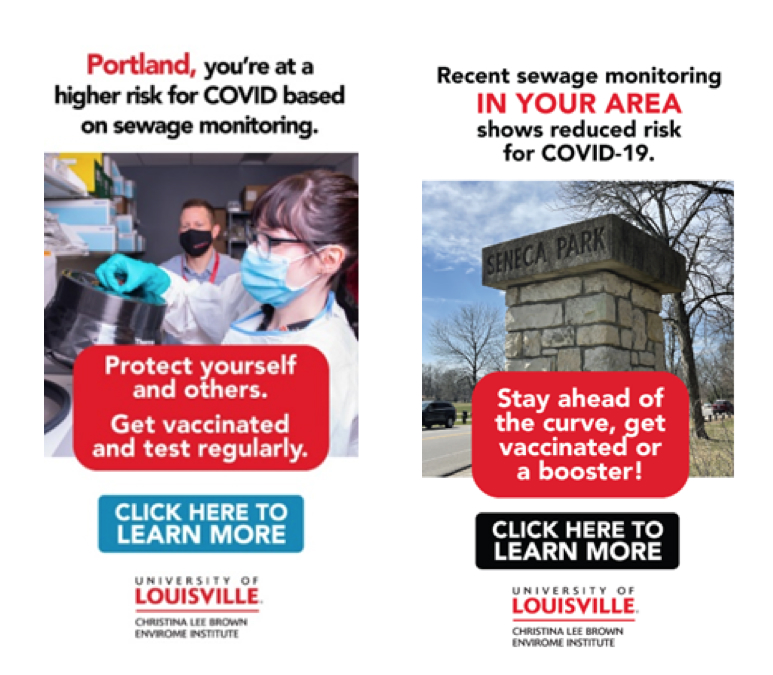
Figure 8 After an ad campaign in the highest-risk sewersheds, the number of COVID-19 tests increased compared to other similar-sized sewersheds. SOURCE: Ted Smith, University of Louisville, personal communication, 2022.
A Vision for National Wastewater Surveillance
Wastewater surveillance is and will continue to be a valuable component of the nation’s strategy to manage infectious disease outbreaks, including continued surveillance of SARS-CoV-2 variants, resurgences of known pathogens, and newly emergent pathogens.
The emergency establishment of wastewater surveillance has proven its value, and the efforts at local and national scales to establish the NWSS provide a solid basis for expanded applications.
Going forward the CDC and partners should pursue the following to further develop the use of wastewater surveillance and the NWSS to advance public health strategies:
To achieve its goals, a national wastewater surveillance system should be flexible, equitable, integrated, actionable, and sustainable. Flexibility includes the ability to track multiple pathogens simultaneously and pivot quickly to new threats. To be equitable, the system should cover all population demographics and work to engage underrepresented communities and extrapolate findings, where feasible, to unsewered communities. Integration, including coordination and collaboration across multiple partners (e.g., utilities, laboratories, and public health agencies) and triangulation of data from different disease surveillance systems, is essential. For the information to be actionable, data must also be timely, available, reliable, representative, and interpretable. Finally, the system needs to be fiscally and operationally sustainable.
When evaluating potential targets for future wastewater surveillance, CDC should consider three criteria: (1) public health significance of the threat, (2) analytical feasibility for wastewater surveillance, and (3) usefulness of community-level wastewater surveillance data to inform public health action. These criteria would guide strategic allocation of effort and resources toward a system that is responsive to important public health needs, technically capable, and valuable in the context of the broader universe of surveillance approaches.
Temporal and spatial resolution of the NWSS sampling program should be subject to intentional design, informed by rigorous and iterative analysis of data for prioritized pathogens. Collaborative and frequent analysis of incoming NWSS data is essential to determine the spatial and temporal scales of sampling and analysis needed, both for effective COVID-19 monitoring as well as detection of emerging pathogens.
CDC should take additional steps to bring the benefits of wastewater surveillance to critical areas not addressed by the NWSS. Steps CDC could take include (1) creating a comprehensive outreach program about the potential benefits of joining the national system; (2) reducing financial and staff capacity barriers to joining the system; and (3) assessing whether tools can be used to extrapolate data from monitored regions to estimate disease burden in areas without wastewater surveillance.
As part of a national wastewater surveillance system, strategic incorporation of sentinel sites is recommended as a mechanism for early detection. Such sentinel sites could include wastewater surveillance at major international airports with a large number of global travelers to detect emerging pathogens and antimicrobial resistance genes.
The Need for Sustained Federal Investments
The COVID-19 pandemic emergency spurred many researchers and utilities to volunteer their labor and donate resources in support of the effort, but the vision of a sustained national wastewater surveillance system necessitates a shift from volunteerism to a strategic national plan. Federal funding is needed to continue to advance sampling and analysis methods and tools and maintain workforce capacity. Federal funding also helps support coordination among public health agencies, analytical laboratories, and wastewater utilities that is essential to generating reliable data and support its interpretation and use.
About This Project
Conducted at the request of the Centers for Disease Control and Prevention (CDC), Wastewater-based Disease Surveillance for Public Health Action examines the value of wastewater surveillance as a tool to trace, prevent, and control the spread of infectious diseases in the United States beyond COVID-19. This publication is the culmination of Phase 1 of the project. Read the Phase 1 Statement of Task.
Phase 2 of the project, which is ongoing, will conduct an in-depth study of opportunities and barriers relevant to increasing the use and utility of wastewater surveillance. The Phase 2 report is expected to release in mid-2024. Read the Phase 2 Statement of Task.
An ad hoc committee of the National Academies of Sciences, Engineering, and Medicine will review community-level wastewater-based disease surveillance and its potential value toward prevention and control of infectious diseases in the United States. The committee will:
Describe wastewater-based disease surveillance and how it differs from other approaches to disease surveillance and other wastewater monitoring for contaminants.
Review how wastewater-based surveillance has been useful in understanding COVID-19 in communities and informing local public health decisions.
Examine the potential value of specific applications of wastewater-based disease surveillance for understanding and preventing disease and illness beyond COVID-19 and factors that may limit its application in the United States.
Describe the general characteristics of a robust, integrated approach for national use of wastewater-based disease surveillance.
Discuss broad approaches to increase the public health impact of wastewater surveillance in the United States and the most effective strategies for federal, state, and local coordination to achieve national implementation of wastewater surveillance for an array of diverse infectious disease health indicators.
For the purpose of this study, community-level wastewater-based disease surveillance implies sampling at wastewater treatment plants and does not include local surveillance at neighborhood or institutional scales. To inform the study, the committee will briefly review ongoing and planned U.S. federal, state, local, tribal, and territorial efforts as well as international case examples for implementing wastewater-based disease surveillance. The committee’s report will include conclusions and recommendations on wastewater-based surveillance in federal, state and local public health efforts in the prevention and control of infectious diseases. Applications of wastewater-based surveillance for non-infectious agents, in global settings, and for facility-level surveillance are outside the scope of this review, but the committee may identify these for future evaluation.
Statement of Task (Phase 2)
The committee will conduct an in-depth study of opportunities and barriers relevant to increasing the use and utility of wastewater surveillance for the prevention and control of infectious diseases in the United States. Specifically, the committee will:
Define specific characteristics for development and implementation of a robust, integrated wastewater-based infectious disease surveillance program and discuss technical constraints and opportunities associated with wastewater sampling, testing, and data analysis, including:
Methods and/or quality criteria, including genomics and sequencing, to detect pathogens, including strain- or variant-specific methods. Methods for discovery of unknown emerging pathogens can also be considered.
Data reporting, data analysis, and data interpretation for detecting emerging threats to public health and estimating disease incidence and prevalence, including data integration with other surveillance data for improving predictive models.
Identify significant technical limitations that could impact the feasibility of using wastewater surveillance as a platform for generating data for indicators of public health status and risk.
Describe the research, development, and information sharing needed to meet emerging needs and increase impact of wastewater surveillance for improving public health in the United States.
Identify resources for supporting wastewater surveillance.