
5
NAWQA Cycle II Goals—Understanding
INTRODUCTION
“Understanding” is the last of the three primary goals set for the National Water Quality Assessment (NAWQA) Program (with the status and trends goals described in Chapters 3 and 4, respectively). The NAWQA Cycle II Implementation Team (NIT) guidance document (Gilliom et al., 2000; see also Appendix A) states that this goal “is to improve explanation and understanding of: the sources of contaminants, their transport through the hydrologic system, the effects of contaminants and physical alterations on stream biota and ecosystems, . . . and implications for the quality of drinking water.” To make progress in the realm of understanding the major factors that affect water quality, model development and application are essential. Understanding can be gained through the linkage of field studies with the analytical use of models, where observations are compared to a conceptual relationship expressed mathematically. Success of such a model in explaining observations is regarded as a measure of understanding the primary factors or mechanisms involved. Conversely, model development and application require understanding. The studies that provide an understanding of contaminant sources and their transport can be viewed as the raw materials for the design and development of water quality models. The previously described status and trends networks can provide such information, and therefore the proposed application of models in Cycle II rests firmly on the knowledge gained from Cycle I.
Models are developed to provide predictions of water quality conditions both spatially and temporally (i.e., through geographic extrapolation or prediction of future conditions). Detailed understanding of contaminant sources and their trans-
port to water resources and an ability to predict future conditions are key to the development of efficient management and policies to protect the beneficial uses of the nation’s water resources, including drinking water and viable ecosystems. As NAWQA progresses into Cycle II with an increased emphasis on its understanding goal, the importance of model application, as recommended by previous National Research Council (NRC, 1990, 1994) committees, should not be underestimated. Understanding and prediction, embodied in water quality models, are the cornerstones of water resources management for the future.
This chapter discusses four topics related to the goal of understanding cause and effect as related to water quality. First, the important role that models play in scientific understanding is explored. Understanding evolves from the thorough evaluation of data, and this is certainly one of the primary functions of model application. Models represent conceptual and mathematical relationships between the observations that we interpret as cause and effect. They are formulated at a wide range of temporal and spatial scales to represent a variety of phenomena— from rapid chemical reactions to long-term changes in the global environment. Each scale represents a different aggregation of controlling variables, so models are often not directly transferable between scales. This results in a hierarchy of models according to scale and highlights the importance of choosing models appropriately. They are also formulated in a variety of ways, including those based on mass-balance, statistical regression, and process-based (mechanistic) models. Regardless of the means of model formulation, there are several sources of uncertainty, including measurement uncertainty in the observations that serve as input and verification, model structure uncertainty, and parameter uncertainty. The quantification of uncertainty is important in providing perspective for interpretation of model results. Despite uncertainty, models play an important role in understanding causal factors that affect water quality, and model application is one way to illuminate the degree of understanding that exists. Different aspects of these topics are reviewed later in this chapter to highlight associated strengths and pitfalls in model application.
Second, the practical aspects of the overall proposed Cycle II implementation strategy are discussed. As a starting point, Cycle I of NAWQA naturally serves as the foundation for Cycle II. For example, key components of the surface water and groundwater monitoring assessments as well as the pilot-scale monitoring in lake and reservoir sediments conducted in Cycle I are carried over and expanded in Cycle II to form the National Trend Network for Streams, National Trend Network for Contaminants in Sediment, and National Trend Network for Ground Water (discussed in Chapter 4). Cycle I activities will also help form the planned Cycle II spatial studies of effects of land-use change on stream and groundwater quality. These trend assessments (both spatial and temporal) provide both the initial information needed to design the “targeted studies” proposed for Cycle II (see more below) and a context that gives a sense of their national priority (see in discussion of trends in Chapter 4). The two new components
proposed for Cycle II that specifically reflect an increased emphasis on understanding and model application are:
-
targeted water quality studies (that will variously address the six themes and 17 objectives of the understanding goal), and
-
hydrologic systems analysis (HSA) to be guided by a newly formed Hydrologic Systems Team (HST).
As discussed in detail later, the plan is for “targeted studies” to focus on a limited set of the most important water quality topics and link these studies with other parts of the Cycle II design (Gilliom et al., 2000). Thus, each specific targeted study will be designed and executed by various topical teams composed of one or more planned Cycle II study units, and they will be assisted by a single, nationally responsible HST. These so-called targeted studies will focus on the major factors that govern water quality. The contaminants studied in Cycle I (e.g., pesticides, nutrients, volatile organic compounds) and the new drinking water source status assessments planned for Cycle II (see Chapter 3) are expected to provide the foundation for targeted study design wherever possible.
Third, the six themes and their corresponding objectives developed to describe the understanding goal (Gilliom et al., 2000; see also Appendix A) in Cycle II are assessed. These six themes were developed by categorization of the wide variety of scientific studies to be conducted by Cycle II study units to determine where commonalties or synergies between studies exist on a regional or national scale. Further perspective on the problem of setting goals and priorities on a national scale can be gained by relating the themes to the conceptual “source-transport-receptor” (STR) model described in the NIT guidance. The STR is a simple conceptual framework that can be used to organize a wide range of studies from across the nation to show both how they relate to each other and where information may be lacking. Although it is not explicitly stated in the latest NIT report, five of the six themes proposed for the understanding goal can be categorized according to the STR model as follows:
|
Model Component |
NIT Understanding Theme |
|
Source |
Sources of contaminants |
|
Transport |
Contaminant movement from land surface to groundwater Contaminant movement from land surface to surface water Groundwater-surface water interactions |
|
Receptor |
Effects on stream ecosystems |
The last understanding theme proposed for Cycle II, “extrapolation and forecasting,” relates to the use of models for synthesis and prediction of water quality conditions for unsampled geographic areas (extrapolate) and future conditions (forecast). Indeed, it is the objective of Cycle II to “link the status and trend studies with an understanding of the natural and human factors that affect water quality” (Gilliom et al., 2000). Defining the relationships of the studies to each other suggests how regional- and national-scale understanding can be approached and is the first step in linking diverse information to use in setting future directions and in identifying gaps in understanding that may hinder extrapolation and forecasting. Thus, it is important that the targeted studies are interpreted in the context of these themes (or other conceptual frameworks) so that they may be evaluated in terms of geographic applicability and national priority. The discussion of extrapolation and forecasting and the many portions of this chapter that lead into it directly address the committee’s statement-of-task issues (2) (extrapolation) and (4) (aggregation of information at regional and national scales) (see Chapters 1 and 8 for further information).
The fourth and final section includes the conclusions and recommendations for this chapter. The general conclusions of each section are followed by specific recommendations presented in the same order as the chapter sections. This chapter, focusing on the understanding goal for Cycle II and the related themes and objectives put forward by NAWQA, directly addresses the committee’s state-ment-of-task issue (1), on methods for the improved understanding of causative factors affecting water quality conditions.
ROLE OF MODELS IN UNDERSTANDING CAUSE AND EFFECT
Introduction
Models may serve several functions with respect to understanding the causes and effects of water quality conditions. For example, they can be used as tools for diagnosis and explanation of the underlying mechanisms associated with the fate and transport of pollutants in the environment. They can serve as frameworks to integrate observations that vary in time and space and to predict the spatial and temporal distribution of future events. Models also are useful to focus and organize one’s thinking about an environmental system. Good models should be consistent with current scientific understanding, and insofar as they are representative of reality, models provide a framework for organizing, communicating, and applying knowledge.
Model application, as recommended by the previous NRC committees, is gaining in importance as NAWQA progresses into Cycle II with an increased emphasis on the goal of understanding the major factors that affect observed water quality conditions (status) and trends. Understanding contaminant sources and contaminant transport to water resources is important for the development of
effective management strategies to protect drinking water quality and the condition of stream ecosystems. Targeted studies and proposed model applications, which provide higher resolution (in time and space) than synoptic surveys, are important for identification and differentiation of natural and anthropogenic sources of contaminants in groundwater and surface water. Models are becoming increasingly important for water quality management, a notable example is the model used for the U.S. Environmental Protection Agency (EPA) Total Maximum Daily Load (TMDL) Program (NRC, 2001). For such applications, models may have a variety of uses that extend beyond their initial purpose(s).
Models exist in many forms. The models expected to play a major role in Cycle II of NAWQA are categorized into statistical models and analyses, geographic information system (GIS) analyses, process-based models, and hybrid statistical-GIS-process based models. Mathematical models are often characterized as either empirical or mechanistic (process oriented), even though most useful models have elements of both. In the purest sense, an empirical model is based on a statistical fit to data; the only substantive input is in the selection of predictor and response variables. Similarly, in pure form, a mechanistic model is a mathematical characterization of scientific understanding of the critical processes in the natural system; the only data input is in the selection of model constants, initial and boundary conditions.
Mass Balance
The NAWQA Planning Team suggested that mass balance of constituents of concern could be utilized in a number of ways, especially related to explanatory science, a major activity proposed for Cycle II (Mallard et al., 1999). Simple mass-balance models will be utilized to help quantify the sources of contaminants to streams and aquifers. Mass balance (material balance) is frequently the beginning of quantitative assessment of the sources of nonpoint source (NPS) pollutants and their fate in the environment (e.g., Nolan, 1998; Vollenweider, 1975).
Figure 5-1 shows a simplistic approach to developing a mass balance. A control volume is defined, and rates of mass inputs and mass outputs cutting across the surface of the control volume are estimated. Next, transport within the control volume and across its borders are characterized, and sources and sinks of the constituent of concern within the control volume are defined. Lastly, the rate of change in mass per unit time in the control volume is obtained. For dissolved or particulate waterborne constituents, mass is defined as the product of water volume and constituent concentration. Thus, a mass balance of the water is also essential for waterborne constituents.
The spatial and temporal scales of a mass balance may vary over several orders of magnitude, depending on the objectives of the study in question. Control volumes may range from entire watersheds as in river basin models to infinitesimal slices as in numerical transport models. Other model characteristics also
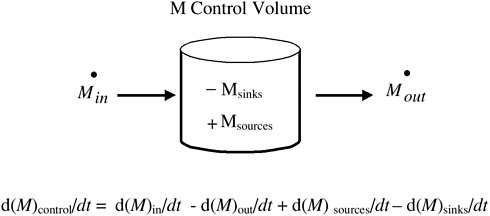
FIGURE 5-1 Components of a simple mass-balance system and the continuity equation.
vary. When the entire watershed is not subdivided spatially, it is assumed to be spatially homogenous and the model is characterized as “lumped parameter.” In contrast, when the watershed is subdivided, the model is characterized as “distributed parameter.” Essentially, there are subcontrol volumes nested in a control volume for distributed parameter modeling. Distributed mass-balance models may be further subdivided into process-level mass-balance models. The pollutant may be considered conservative or reactive and assigned appropriate rates. Transport may be assumed to be convective (advective) or a combination of convective and diffusive (dispersive) flow, and the model may be deterministic or stochastic. The choice of constructing a particular mass balance is dictated in part by the study objectives and the availability of data. There is a continuum of mass-balance efforts ranging from conceptual mass balance of aggregated data to comprehensive numerical models that operate in small time and space intervals.
The requirements for constructing even a simplified, conceptual mass balance may entail substantial data and information collection. Take, for instance, determining sources of nitrogen in a stream where the land use is predominantly agricultural. The sources may include nitrogen inflow from the upstream reach, agricultural surface runoff, precipitation, discharge of collected subsurface drainage, groundwater discharge contributions into the stream, and so forth. The nitrogen species may include soluble (e.g., nitrate, ammonia, organic nitrogen) as well as particulate forms (e.g., sediment-bound nitrogen, plankton-bound nitrogen, other organic particulates). The nitrogen loading into the stream will have to be evaluated in terms of both concentration (mass per unit water volume) and mass (concentration × water volume). Thus, the nitrogen emission into a stream can become quite complex.
The examples taken from U.S. Geological Survey (USGS) studies in Box 5-1 illustrate the value of conducting mass balance for NPS pollutants. They not only provide significant insights into, and understanding of the problem situation, but also guide the design for further data collection, such as selection of fixed-site monitoring stations, and aid in the interpretation of the data collected. Moreover, the mass-balance approach may be used to track historical changes and provide predictions into the future with changes in management alternatives, land use, or environmental-ecological conditions, and so on.
There are also other simple conceptual frameworks that can be used to view mass balance data that give insight into the behavior of systems. These include the concepts of “retention” and “relative residence time.” Retention is defined as the fraction of inflow mass that is retained in a control volume (such as a reservoir) and can be represented by the equation: R = (inflow mass – outflow mass) ÷ inflow mass (Dillon and Rigler, 1974). This is an expression of net losses, or sedimentation of conservative (nonreactive) substances. Retention can be used to compare systems to each other and to determine its relationship with other factors. Residence time of a substance can be thought of as replacement rate and may be defined as T = control mass ÷ inflow mass per unit time. For example, if a reservoir holds 100 million gallons (MG) of water and the inflow rate is 50 MG per year, then the residence time of water Tw is (100 MG ÷ 50 MG per year), or 2 years. The residence time of a nutrient or pollutant can similarly be calculated. As discussed in Chapter 2, providing such simple measures for lakes and reservoirs where NAWQA data exist would be of benefit and likely stimulate further needed work.
In conclusion, conducting mass balances on constituents of concern is a worthy effort for Cycle II of NAWQA. Mass balances identify the sources and sinks of pollutants and their fate. They are a central tool for obtaining a better understanding of a problem situation. The committee recommends that at least a conceptual mass balance be developed for nonpoint source pollutants and constituents of concern for TMDLs in all Cycle II study units. The reactivity of a given NPS pollutant may be generic, but the extent of biological and chemical reactions of the pollutant is highly dependent upon site-specific conditions. Moreover, having such a knowledge base of mass-balance data is essential for evaluating the effectiveness of alternative best management practics to reduce pollutant loads. Depending on the availability of funding and expertise, more comprehensive mass-balance (e.g., hydrologic or hydraulic water quality) models might be applied to the more critical pollutants of selected study units.
Statistical Models of Water Quality
As noted above, a statistical (or empirical) water quality model reflects greater attention to fitting the pattern in a data set than to describing mechanisms. Perhaps the simplest example of a statistical water quality model is the relation-
|
BOX 5-1 The question of why mass balances and other model applications should be conducted is addressed below. Five examples of computations by NAWQA or other USGS study teams are briefly summarized to underscore the significance of their findings or implications.
|
ship between concentration and streamflow, referred to as a rating curve model. Such models describe the often weak relationship between the concentration of a water quality constituent and river discharge. Rating curve models are used widely for extrapolating water quality loads when only a few measurements are available and for performing trend assessments. The widespread use of such statistical models is reviewed by Cohn (1995), who also discusses research developments and statistical issues involved in estimating loads from the concentration-discharge relationship. Since such rating curve models are used so widely, it is important that research be performed to improve these models. The data sets developed by NAWQA provide an excellent resource with which to test and improve rating curve-based water quality models.
As is often the case, improvements in one’s ability to model the processes that give rise to water quality changes are likely to come from improvements in one’s ability to understand those processes. Even a purely statistically based water quality model can be improved by introducing a physical basis. O’Connor (1976) used a deterministic approach to derive expressions for the spatial and temporal distribution of conservative dissolved solids in rivers in such a way that they could be expressed as rating curves. Similarly, Duffy and Cusumano (1998) document the physical situations that give rise to hysteretic (looped) behavior of concentration-discharge relationships. The USGS has historically made many contributions to the literature on statistical water quality (rating curve) models (see Cohn, 1995, for a review) with a focus on statistical innovations. Future improvements in rating curve and other statistically based water quality models are likely to come from the integration of statistical and physical process-oriented models. NAWQA should devote greater attention to research that seeks to improve the important concentration discharge model based on physical reasoning and physical process interpretations of the concentration discharge relationship of the type introduced by O’Connor (1976) and refined by Duffy and Cusumano (1998).
Statistical water quality models range from the very simple concentration-discharge models described above to the more complex regional multivariate statistical models such as SPARROW (Spatially Referenced Regression on Watershed Attributes). SPARROW is an effort to provide resource managers with spatially detailed information describing the location and magnitude of nutrient sources and watershed factors that affect the delivery of important chemical and biological constituents to receiving waters. Early applications of SPARROW to the Chesapeake Bay (Preston and Brakebill, 1999) and elsewhere have proven quite promising. The results of SPARROW modeling efforts led to an illustration of the spatial distribution of pollutant loads within the basin; such information is instrumental in watershed management programs that seek to target nutrient reduction areas. The committee recommends that NAWQA continue research relating to the improvement of SPARROW and to the application of this model to other watersheds in Cycle II. Continued comparisons should be per-
formed between the output of SPARROW and analogous, yet more complex, process-oriented watershed-based water quality models. Also, as discussed in Chapter 4, SPARROW can be explored further for regionalization and extrapolation of NAWQA data.
Process-Oriented Models of Water Quality
Process-based (or mechanistic) watershed models are mathematical representations of one’s current understanding of hydrologic and water quality processes. A number of comprehensive, physically based watershed models now exist that are intended to simulate most watershed processes, ranging from hydrological state variables such as groundwater, streamflow, and evapotranspiration to water quality and sediment transport. A common feature of these models is the large number of parameters required relative to the available data. As a consequence, parameter selection becomes an art, and the models suffer from a general lack of rigorous testing. This suggests that the large process models are likely to be more useful for quantitatively representing processes and interactions in research studies than for forecasting the outcomes of proposed management actions. In addition, overparameterization means that the models lack an error term, so the research applications of these models is limited to informal analysis, because formal hypothesis testing is not truly possible.
One notable gap in process modeling identified in a recent NRC study (NRC, 2001) of the scientific basis for EPA’s TMDL program is the lack of simple process models. Simulation models can, in principle, be crafted on a continuous scale of process detail, and there is nothing inherently correct, or better, about the scale of existing process models. The fact that current models are overparameterized suggests that simpler mechanistic expressions identifiable from the available data (in other words, those that support parameter estimation from the available data) should be considered as a viable alternative. One recent example of a model designed from this perspective is described in Borsuk et al. (2001); by avoiding overparameterization, Borsuk et al. were able to optimize the model fit to available data and also calculate a prediction error term. Accordingly, the committee recommends that process modeling within NAWQA avoid overparameterized models whenever possible.
To address problems of model selection, application, and analysis, a set of modular modeling tools, termed the Modular Modeling System (MMS; Leavesley, 1997) is being developed by the National Research Program of the USGS. The MMS approach attempts to enable a user to selectively couple the most appropriate process algorithms from applicable models to create an “optimal” model for the desired application. Where existing algorithms are not appropriate, new algorithms can be developed and easily added to the system. This modular approach to model development and application provides a flexible
method for identifying the most appropriate modeling approaches given a specific set of user needs and constraints.
Nearly all of the programmatic objectives relating to the development of the MMS satisfy the NAWQA Cycle II objectives relating to the greater use of models for improving our understanding of the causes and effects of water quality. Integration of water quality-based modules within the MMS is a natural extension to both the MMS and the existing watershed-based water quality models. Furthermore, it may be quite possible to integrate water quality models that are not watershed based into the MMS modeling framework. The committee recommends that NAWQA attempt to merge developments in watershed based water quality models with the current Modular Modeling System, while striving to avoid overparameterized models.
Uncertainty Must Be Considered
Water quality modeling is inherently uncertain. There is often significant uncertainty associated with the input, output, model structure, and parameters of water quality models. Uncertainty exists regardless of the model structure and regardless of whether the models have a statistical or process-oriented foundation. It is essential that all modeling studies account for the various sources of uncertainty; otherwise the results of such studies can be misunderstood. Statistical methods such as the simple rating curve approach and SPARROW can provide detailed uncertainty statements associated with estimates of long-term loads in the form of confidence intervals for predictions and/or standard errors associated with model parameters. As noted above, process-oriented modeling studies often lack sufficient data for parameter estimation; as a consequence, there is little basis for, and experience in, thorough error analysis with these models. The committee recommends that the HST attempt to quantify uncertainty associated with all aspects of its water quality modeling evaluations and that the HST develop a position paper on uncertainty.
PROPOSED IMPLEMENTATION APPROACH FOR THE UNDERSTANDING GOAL OF CYCLE II
Several practical aspects of conducting scientific research have to be considered in an evaluation of the potential for successful implementation. In the case of NAWQA, these aspects include preliminary procedures such as defining objectives and selecting targeted studies to meet these objectives. Then there is a requirement for coordination of the hydrological and water quality models chosen for application. Sufficient staff, expertise, and financial support are all part of what is needed for successful implementation of a program, especially at the national scale. The degree of attention to each of these aspects will determine the success of Cycle II implementation.
The process of selecting topics for targeted studies to meet the understanding goal in Cycle II has not yet been clearly defined. The sequence of events suggested in the NIT planning document (Gilliom et al., 2000) begins with a statement of the 17 objectives that relate to the understanding goal. The implementation strategy to address these objectives is described in two main steps: (1) select topics for targeted studies to be addressed by topical study teams and (2) establish the HST to provide guidance in hydrologic and water quality model application. However, there is only a loose relationship between the 17 objectives and the subsequent four initial topic areas of targeted studies described in Gilliom et al. (2000). Although the topics suggested seem appropriate, they do not improve the focus since they relate to multiple objectives.
In the final section of the most recent NIT guidance document (Gilliom et al., 2000), an example design is presented for a targeted study topic on “sources and transport of agricultural chemicals into streams and shallow ground water” that will be designed and implemented by the Agricultural Chemical Source and Transport Team (ASTT). This planned targeted study includes a set of clearly defined hypotheses. The degree of focus demonstrated by this example is what seems to be lacking in the 17 objectives that are proposed. The example of the targeted study to be done by ASTT is one of the strongest parts of the planning document.
In relation to the many objectives, the committee suggests that more thought should be given to how information from multiple study units will be analyzed and integrated to address questions of national significance. The understanding objectives must be more clearly defined and stated in terms of testable hypotheses that can then be addressed by targeted studies designed for that purpose, as in the ASTT example. This probably means that objectives should not only be simplified, but also reduced in number.
At the May 2000 committee meeting at La Jolla, California, Dr. Robert Gilliom (USGS-NAWQA staff and lead of the NIT) provided a status report on the developing Cycle II themes, including the use of modeling tools. In that report, Gilliom stated that all Cycle II study units will utilize planning models, 75 percent of the study units will carry out mass-balance studies, 75 percent of the study units will conduct integrated field studies, 50 percent of the study units will conduct watershed flow and transport studies, and 25 percent of the study units will carry out comprehensive analysis and modeling of selected hydrologic cycle systems. A national Hydrologic Systems Team consisting of six to eight handson experts will be appointed to provide modeling guidance to the study units. It is clearly stated that the primary role of the HST is “not to provide technical support, but instead to provide leadership in conducting hydrologic systems studies” (Gilliom, 2000b).
The committee is concerned whether or not sufficient staff, resources, and expertise are allocated in the current planning to ensure the successful widespread use and application of models suggested for NAWQA. In the current plan, it is
uncertain that the HST will be able to ensure the widespread use of models. Will each topical study team need its own subset of an HST to ensure that the model implementation is effective? Is there enough dedicated staff expertise within each study unit for this work? Model application is labor intensive, and to be successful, appropriate staff must be specifically designated for it.
Some of the committee’s concern comes from a brief budget analysis presented in the NIT report (Gilliom et al., 2000), which suggests to the committee that the understanding goal is underfunded for the effort needed. However, it is not clear to the committee how various activities that crosscut the themes of Cycle II (i.e., support for modeling) are to be funded, nor is it the committee’s task to deal in any detail with budget and resource issues. The NIT report recognizes this problem and clearly states that the understanding issues “can only partially be addressed by Cycle II investigations, even in all three groups of study units.” With the expressed resource constraints, the number and complexity of the objectives for understanding and the staff resources and expertise issues must be carefully addressed in finalizing plans for targeted studies and modeling implementation.
The financial support available will ultimately govern what can be accomplished in Cycle II. As noted throughout this report, the USGS as an organization is uniquely qualified to pursue this national monitoring work. No other federal agency has the organization and infrastructure to collect, analyze, and report on the water resources of the nation with the long-term consistency critical to the success of this program. This capability has been repeatedly demonstrated through its Cycle I achievements (see also Chapters 1 and 8). Thus, the budget will be a key determinant of what can and will be accomplished in Cycle II.
THEMES AND OBJECTIVES OF CYCLE II UNDERSTANDING GOAL
As noted previously, five of the six themes proposed for the understanding goal for Cycle II of NAWQA can be categorized according to the STR model. The sixth and last theme, “extrapolation and forecasting,” relates to the use of models for the purposes of synthesis and prediction. The simple categorization of studies in this conceptual framework is a convenient way to make an initial assessment of where background information exists or where it is lacking. It provides a view of the status of current understanding, where commonalties or synergies between study units may exist that may benefit from coordination of modeling research, and what elements of understanding are in need of further investigation. The individual themes of the STR model are discussed below in terms of the proposed approaches and practical difficulties that should be considered in the design of studies to address the stated objectives. Ultimately, the information that arises from the various understanding themes (to be addressed by the formation of topical teams and targeted studies) will be assembled in the form of models.
Sources of Contaminants
The four objectives that address the understanding theme “sources of contaminants” cover a variety of environmental scales and settings and are described in Gilliom et al. (2000):
Objective U1: Large-scale sources: Identify and quantify the most important large-scale natural and anthropogenic sources of selected contaminants to major streams and aquifers with mixed land-use influences and contaminant sources.
Objective U2: Urban and agricultural sources: Identify and quantify the most important sources of selected contaminants to recently recharged groundwater and to streams within urban and agricultural settings.
Objective U3: Spatial and temporal aspects of sources: Characterize and determine the relative importance of spatial, seasonal, and short- and long-term interannual variability of natural and anthropogenic sources of contaminants to surface and ground waters.
Objective U4: Mobilizing and metabolizing sources: Determine the relative influence of natural processes and human activities in creating contaminants or mobilizing naturally occurring contaminants.
Approaches to these four objectives are presented in an early version of the NIT report entitled Preliminary Draft of Themes and Objectives for Cycle II Investigations—4/19/2000 (Gilliom, 2000b). The comments below refer to this version, despite its preliminary status, since the more recent Cycle II guidelines (Gilliom et al., 2000; see also Appendix A) do not provide any specific approaches for their implementation. Rather, the more recent guidance presents a broader strategy of forming the topical teams and the HST that will develop approaches (targeted studies) at some future time to address the understanding objectives. (Comments on the proposed teams as an approach are discussed in previous sections of this chapter.) Although this makes the current version of the guidance somewhat less specific, presumably some of the earlier ideas for implementing studies to address these four objectives will be considered by the topical teams. Therefore, some general comments on these are included below.
The proposed approach for Objective U1 is that a large-scale mass-balance analysis will be developed for a selected basin (major stream) and/or major aquifer for selected constituents in most Cycle II study units (Gilliom, 2000b). The mass-balance analyses will be developed as fully as possible from Cycle I results and other existing data, with the objective of identifying and quantifying the primary sources of contaminants. In a subset of study units, the mass-balance analysis will be enhanced by additional data collection and model analysis.
As noted previously, the strength of the mass-balance approach is that it is based on conservation of mass and quickly highlights where observations are inadequate. However, the documentation of a balanced mass budget may not be
simple depending on the resolution required. Several initial considerations for sampling design necessary to address this objective can be helpful. First, the timing of observations has important implications for how well they characterize a mass flow and therefore how complete a description they provide. For example, it is well known that for many substances, the majority of transport in a watershed takes place during a few major storm events each year; if the sampling program misses these critical times, an annual budget of inputs and outputs for a “control volume” will not be accurate. Another problem in producing a mass balance is that both water flow and mass concentration measurements are required; since concentration measurements are not routinely recorded as continuously as flow, interpolation methods will have to be applied to develop mass load estimates. A further complication is that many chemical and microbial contaminants, such as phosphorus or fecal coliforms, from different sources may be indistinguishable once they mix within a water mass. Sampling designs with appropriate spatial resolution may partially solve this problem, but in some cases, highly specific analyses may be necessary to identify different sources of the same contaminant; Boxes 5-2 and 5-3 provide examples of this and the use of simple mass balance for source identification.
There are some shortcomings of land-use data as a basis for making inferences about sources. Land use (as described in the environmental framework chapter [Chapter 1] of Gilliom et al., 2000; See Appendix A) can sometimes be used as a major explanatory factor for contaminant sources, but this does not account for sources of contaminants that are independent of land use (such as atmospheric inputs or wildlife sources of pathogens that are mobile). Routinely available land-use coverages (derived from remote sensing) may not provide high enough resolution to identify some sources, particularly anthropogenic point sources not apparent at the low resolution of land use. Another factor not accounted for by using an aggregated explanatory variable such as percentage land use is landscape position. The proximity of a contaminant source to a water resource may be very influential and more important than land use as an explanatory factor. High-resolution data at a subbasin scale and model application may be needed to obtain satisfactory understanding of large-scale natural and anthropogenic contaminant sources. The design for mass-balance estimation may also require indexing methods such that subbasin inputs can be estimated for those not measured because of the large geographic scales involved.
For Objective U2, the draft NIT guidance (Gilliom, 2000b) states that “for selected agricultural and urban areas, usually the most important nonpoint source areas identified in Objective [U1], sources within these land use areas will be specifically identified, and to the extent possible, quantified.” For example, what are the sources of a particular pesticide to an urban stream, such as atmospheric deposition, lawn runoff, and spills? Although the approach is not clearly defined in the April 2000 NIT guidance, the Cycle I land-use surveys (LUSs) should provide insight into sources of contaminants from urban and agricultural land
|
BOX 5-2 With respect to the understanding theme of determining natural and anthropogenic sources of pollutants in water, the basic inventory of geology, land use, and land cover of the landscape provides an idea of potential sources of contamination. EPA’s Source Water Assessment Program provides guidance for such evaluations. In addition, basic water quality monitoring provides information on the relative importance of different contaminants that actually reach the aquatic environment. In some cases, very specific supplementary analyses can be used to identify the sources of routinely monitored contaminants. For example, coliphage analyses can be used to supplement fecal coliform and Escherichia coli monitoring, and can give insight into whether the source is human, non-human, or some combination thereof. To take analytical specificity a step further, ribotyping (i.e., of ribosomal DNA from different sources of E. coli) can be used to identify specific animal sources of fecal contamination; however, substantial analytical effort is required to achieve this. An extensive reference library of ribotypes must be built (such as the one at the University of Pennsylvania) to interpret field data. Where highly specific “fingerprinting” analyses can be used, models may not be needed to distinguish between natural and anthropogenic contaminant sources. The source of fecal coliform contamination of Kensico Reservoir in the early 1990s was identified as an example of a “simple” screening-level analysis as defined by EPA (1997). Routine monitoring data showed |
uses for recently recharged groundwater. The Trends Network and Land Use Studies will also provide a database on urban and agricultural sources, albeit at low resolution. In the statistical (regression) relation of GIS-derived land use to water quality concentration data, the sample data should be stratified between stormflow and baseflow and analyzed accordingly. Stormflow usually contains higher concentrations of many contaminants and often represents a greater proportion of surface runoff. The database should include a way to identify the type of flow that concentration measurements represent so that analyses are interpreted appropriately.
To understand the origin of contaminant sources in greater detail, supplementary high-resolution sampling may be needed. Sources of contaminants to streams from runoff and spills are best addressed by storm event sampling, rather than baseflow sampling. Sources of contaminants from atmospheric deposition
|
several interesting features. A comparison of inflow and outflow data showed that fecal coliform concentrations leaving the reservoir were typically higher than those entering it; therefore the source of contamination was located within the local drainage basin. A second feature of the data was that peak concentrations occurred each autumn and were pronounced in the main basin of the reservoir. Field reconnaissance pointed to several possible sources including waterfowl, inflow tributaries draining suburban areas, septics, sewers, aqueduct inflows, and runoff from natural areas. Estimates of mass loadings from these sources suggested that quantitatively, they were about equally divided between waterfowl, storm water, and all other inputs. In addition, peak concentrations in the main basin of the reservoir coincided with the presence of migratory waterfowl that roosted there at night. As a remedial measure, a waterfowl harassment program was initiated in 1993 and coliform levels immediately dropped below Surface Water Treatment Rule limits for source waters. In this case, routine monitoring pointed to the location of coliform sources (i.e., originating within the basin), quantitative estimation of the mass loadings indicated the relative importance of sources, and correlation of waterfowl presence with elevated coliform concentrations pointed to a specific coliform source. Confirmation of the hypothesis that waterfowl were a major source of coliforms was done through coliphage sampling (i.e., a specific “fingerprinting” method). In this case, simple screening-level methods were sufficient to identify the problem and to suggest corrective management actions for an important drinking water reservoir of the New York City water supply system. |
require direct monitoring of wet and dry deposition, and representative samples are not easy to obtain because of the spatial variability of weather and orographic effects. (Although atmospheric deposition as a source is mentioned as an approach for Objective U2, it seems to be more appropriate for U1, which will address large-scale phenomena.)
As noted previously, the example ASTT presents an excellent set of clearly articulated hypotheses for its proposed study (Gilliom et al., 2000). This example targeted study, designed to investigate sources and transport of agricultural chemicals, is an excellent model for the Cycle II topical teams to follow to develop focus for the objectives and further targeted study development.
The preliminarily proposed NIT approach (Gilliom, 2000b) for the characterization of variability (U3) is: “through existing data and Cycle I data analysis, describe the importance of historical changes in anthropogenic sources of con-
|
BOX 5-3 An example of model application for the purpose of identifying nutrient sources is the phased approach to TMDL development for phosphorus that is currently in progress for New York City reservoirs. It began in 1994 with estimation of phosphorus loads from different sources in each basin using export coefficients, land use, and population density (as described in Reckhow et al., 1980). These loading estimates highlighted the relative importance of different sources in each of the reservoir drainage basins and therefore major sources that could be managed for nutrient reduction. The Vollenweider (1976) model (a steady-state model that relates loading to lake concentration) was then used to estimate the load needed to achieve a target lake concentration. Comparison of current and target loads demonstrated which basins needed nutrient reductions. More detailed hydrodynamic and eutrophication models are under development; these process-based models will allow calculation of phosphorus TMDLs to be defined in terms of more specific use-impairment measures than the general condition of eutrophication. It is hoped that these models will lead to phosphorus goals (TMDLs) based on distributions of chlorophyll or trihalomethane formation potential. |
taminants to those currently present in surface and ground waters.” Some contaminants that were applied or released at some time in the past may persist for long periods and only now be reaching receptors. Conversely, recent increases in contaminant use or release may not impact receptors for years or decades in the future. The proposed approach implies that Cycle I data should be analyzed using the space-for-time concept to predict future water quality and its distribution. This objective, however, should be stated separately from the idea of characterizing variability of contaminant sources. Variability of sources, both spatially and temporally, should be addressed first using existing data. Then the space-for-time concept can be explored, taking lag time (legacy) and exponential effects into account.
Although no approach was provided for Objective U4 in either version of the NIT report, this objective strives to understand the role of humans in such water quality problems as acid rain, mercury accumulation in aquatic biota, polychlorinated biphenyl (PCB) deposition, and the impacts of all of these contaminants on the ecosystem. An important example of a situation related to this objective that NAWQA may wish to examine in Cycle II is the fate of PCBs in the Hudson
River. A recent EPA decision was made to dredge PCB-laden sediments from the river, and will present an opportunity to monitor conditions before and after remediation. Determining the relative influence of anthropogenic versus natural effects will require an understanding of these substances in terms of each component of the STR model. That is, models should be used as analytical tools to elucidate an understanding of the origin of contaminant sources, their transport characteristics, and their impacts on receptors. It will not be possible to manage these problems until such understanding is gained.
Recommendations
-
NAWQA should consider evaluation of the variability of sources and contaminant occurrence as a first step for the objectives related to “understanding contaminant sources”; this should take place prior to subsequent space-for-time and targeted study design.
-
Sampling design should consider interpolation and indexing considerations that may be necessary to develop as complete a mass balance as possible.
-
For the identification of sources, when feasible, monitoring programs should employ highly specific or supplementary analyses that permit distinction between different sources of the same contaminant (e.g., coliphage or ribotyping of microbiological specimens, isotopic analyses of some chemicals).
-
Some sampling strategies may require higher resolution to assess some contaminant sources. Sample data should be stratified between stormflow and baseflow to develop relationships between land use and stream concentrations for many contaminants.
Contaminant Fate and Transport
There will be an increased emphasis in Cycle II on process-oriented studies and modeling to assess water quality at watershed scales. These models are directly applicable to the four objectives (U5 to U8) that have been developed for better understanding of the transport processes by which contaminants move from the land surface to either surface water or groundwater (Gilliom et al., 2000). Research into the fate and transport of contaminants requires the use of tracer techniques (in the broad sense of the term) and ways to elucidate the age and flow rates of water masses where these cannot be readily measured. Since specific protocols for this were not presented in the latest NIT guidance, more general, conceptual comments are offered.
Objective U5: Saturated zone transport: Examine the extent to which the concentrations of specific contaminants in surficial aquifers are related to (a) types and distributions of land use in their recharge areas, (b) distributions of ground-
water residence times, and (c) physical and biogeochemical processes in the saturated zone.
Objective U6: Unsaturated zone transport: Examine the influence of natural and anthropogenic factors on the concentrations and transformations of specific contaminants in the unsaturated zone, and on their flux through the unsaturated zone to shallow groundwater.
Objective U7: Land surface-to-stream transport: Determine how differences in watershed characteristics (e.g., soils, terrain, climate, geology) affect the transport of contaminants from watershed land surfaces into streams.
Objective U8: Within-stream transport: Determine how differences in characteristics of the stream within its catchment (e.g., terrain, climate) affect the transport of contaminants along streams.
The models and software packages to be used to help implement the above objectives by the planned HST in Cycle II will be coordinated with the needs of other NAWQA national synthesis teams as well as the study units. Regarding the HST, an October 2000 draft memorandum on hydrologic systems analysis and modeling planned for Cycle II (Gilliom, 2000a) states that the “primary focus of the HST will be on linking the most important hydrologic processes for each particular study area to a unified view of the nature and behavior of regional-scale hydrologic systems. Investigations will emphasize comparative analysis of the roles of common and unique aspects of hydrologic behavior in the wide range of hydrologic environments of the nation. Use of models will facilitate the development of comparative studies that are quantitative, objective, and hypothesis-driven.” The committee supports this statement of the HST’s focus. However, hypotheses cannot be tested without an error term, and this fact has implications (noted above) for the choice of models. Further, some uniformity in the use of models and software packages is requisite for national comparisons and aggregation of results. The HST should ensure such comparability.
In addition to these candidate models, Gilliom (2000a) states that simple mass-balance models will be constructed for major contaminants to help identify and quantify the sources of contaminants to streams and aquifers. Such mass-balance models may be simple, but as noted previously, they may pose difficulties in estimating sources and sinks, depending on available data and the resolution required for some contaminants.
Ephemeral Streamflow
Ephemeral streamflows can contribute contaminants to perennial streams and/or shallow aquifers. These contributions are more likely to be a significant issue, where these streams and aquifers are common. The current NAWQA program is not geared to the assessment of this type of contaminant transport,
although some sampling of this nature has been conducted during Cycle I in the Central Arizona Basins Study Unit (William Wilber, USGS, personal communication, 2000; see Figure 1-1).
Contaminants can be contributed by two types of ephemeral streams: effluent dominated and flash flood dominated. The former includes streams where the flows are from wastewater treatment or reclamation plants (e.g., Las Vegas Wash in Las Vegas, Nevada). The latter includes flows (often flash floods) produced by precipitation; these flows may pose a more difficult sampling situation since they are irregular and often quite substantial. Ephemeral streams that are tributary to perennial streams can pose a significant threat to the perennial stream’s water quality. Shallow groundwater systems may also be at risk since ephemeral flows are often a significant source of groundwater recharge in the arid West.
An example of perennial stream contamination by ephemeral flood flows was reported by Harwood (1995). This researcher studied the North Floodway Channel of Albuquerque, New Mexico, which drains an urban area of approximately 90 square miles. This ephemeral channel discharges to the Rio Grande, which is perennial in the Albuquerque area. Harwood found that the urban storm water contributions of dissolved zinc, lead, and aluminum were significant. Although the work was preliminary, the implication that other ephemeral channels in the Albuquerque area might contribute similar or greater amounts of contamination is clearly indicated. This scenario might be found in other parts of the arid West, where urban areas are drained by ephemeral streams that could be transporting a broad spectrum of contaminants (e.g., metals and organic compounds) to perennial streams or perhaps recharging them to shallow aquifers. In view of this gap in knowledge, NAWQA should develop strategies to sample ephemeral streamflows in Cycle II where possible, especially in perceived high-risk areas, such as those in which contamination could threaten perennial streams, lakes or reservoirs, or shallow groundwater systems.
Recommendations
-
The HST should ensure some uniformity (and/or compatibility) in the use of models and software packages in Cycle II to enable national comparisons and aggregation of data and results. As previously discussed, to test research hypotheses, the HST must also address error terms and uncertainty in model selection and application.
-
The current NAWQA program is not geared to the assessment of ephemeral streamflows that can be an important contaminant source in arid areas in particular. NAWQA should develop strategies to sample ephemeral streamflows, especially in perceived high-risk areas, such as those in which contamination could threaten perennial streams, lakes or reservoirs, or shallow groundwater systems.
Groundwater-Surface Water Interactions
Our understanding of groundwater and surface water interactions has changed dramatically in recent years. Groundwater-surface water (GW-SW) interactions occur in all types of hydrogeologic and climatologic settings at all spatial and temporal scales (Winter et al., 1998). Groundwater can interact with streams, lakes, estuaries, bays, wetlands and coastal areas. The interconnection between groundwater and surface water means that they often behave as one reservoir and should be treated and managed as a single resource (Winter et al., 1998). Their interaction can have important ramifications for water quality because water, chemical constituents, and microorganisms can be transferred between the two reservoirs.
Although the NAWQA program has evolved from its original separate surface water and groundwater study units (Hirsch et al., 1988) there still needs to be more emphasis on GW-SW interactions and their effects on water quality in Cycle II. Indeed, one of the themes for Cycle II is GW-SW interactions with the associated question, What is the role of exchanges and interactions between groundwater and surface water in determining the degree and timing of contaminant levels and their effects on water quality? Associated with this theme are three objectives:
Objective U9: Large-scale groundwater-surface water interactions: Determine the influence of groundwater quality on stream quality and the influence of stream quality on groundwater quality at stream reach and larger scales in a broad range of environmental settings.
Objective U10: Small-scale groundwater-surface water interactions: Evaluate the effects of the riparian zone, including near-stream wetlands, various land uses or land covers and land management practices, on exchanges of water and associated chemicals in all directions between the land surface, shallow groundwater, hyporheic zone, and streams.
Objective U11: Hyporheic zone groundwater-surface water interactions: Increase understanding of the role of the hyporheic zone on the transport and fate of contaminants in both groundwater and surface water.
These objectives will be met in Cycle II through a variety of means (e.g., riparian zone mapping, baseflow synoptic studies, examination of stream stage changes), although groundwater flowpath studies occupy a prominent role in meeting each objective (Gilliom et al., 2000). During Cycle I, flowpath studies in many study units were dropped because of funding constraints and the lack of background information (Mallard et al., 1999). The flowpath studies conducted to date have emphasized relatively shallow systems with short flowpaths where groundwater discharges to streams. Recommendations by the NAWQA Cycle II
Planning Team (NPT) emphasize the importance of flowpath studies and encourage each Cycle II study unit to conduct at least one well-designed flowpath study.
The interface between groundwater and surface water systems is now recognized as a distinct zone, called the hyporheic zone (Gibert et al., 1990; Vervier et al., 1992). This refers to a region where active and dynamic exchange of water, microorganisms, and nutrients occurs between the surface water and the adjacent groundwater system (Gibert et al., 1990; Triska et al., 1989; Vervier et al., 1992). The hyporheic zone, or GW-SW ecotone, can be an important component in understanding surface water quality and near-surface groundwater quality in NAWQA study units (Hinkle et al., 2001).
Although there are study units that appear to be surface water dominated (e.g., Willamette Basin, New England Coastal Basins) and some that are groundwater dominated (e.g., Central Arizona Basins, High Plains Regional Ground Water Study), such outward appearances can be deceiving. Even in arid areas GW-SW interactions can be important. For example, one of the current thrusts of the USGS’s Ground-Water Resources Program is the examination of GW-SW interactions in the arid Southwest. Similarly, a study unit ostensibly dominated by surface water can have important groundwater aspects—the Willamette Basin is an example (Hinkle et al., 2001). Groundwater-surface water interactions should be addressed in some Cycle II study units where they have not previously been considered (e.g., San Joaquin-Tulare River Basins).
Some excellent GW-SW interaction work has already emerged from Cycle I of NAWQA. For example, the nitrogen work in the Delmarva Peninsula by Bohlke and Denver (1995) showed that nitrate concentrations in two streams were strongly influenced by the nature of the adjacent groundwater flow systems (shallow versus deep circulation). Pesticide studies in the agricultural Eastern Iowa Basins (Squillace et al., 1993) indicated that GW-SW exchange has a profound influence on pesticide concentrations in both streams and the adjacent aquifers. McMahon and Bohlke (1996), working along the South Platte River Basin, showed that denitrification and GW-SW mixing within the alluvial aquifer sediments might greatly decrease the nitrate added to streams by discharging groundwater. Efforts such as these should be expanded, especially in agricultural areas.
Hyporheic zone investigations have also been conducted under NAWQA auspices. For example, Hinkle et al. (2001), working in the Willamette Basin Study Unit, showed that along a large (ninth-order) stream, significant nitrate uptake and reduction occurred along hyporheic flowpaths (see Box 5-4). They also noted strong vertical redox gradients and suggested that since nitrogen cycling is strongly influenced by redox conditions, nitrogen cycling is likely influenced by GW-SW interactions that control fluxes of redox species.
The emphasis on process-based models in Cycle II dictates the use of models that adequately represent GW-SW coupling, especially the hyporheic zone (GW-SW ecotone). This region of active interchange between the stream and groundwater can have steep gradients in a variety of important water quality
|
BOX 5-4 Hyporheic zone studies are frequently conducted at relatively small scales. However, in the Willamette Basin Study Unit, researchers have conducted a study that addresses hyporheic zone interactions on a large scale (Hinkle et al., 2001). This collaboration between the NAWQA Willamette Basin Study Unit group and the USGS National Research Program describes a multidisciplinary study (physical, isotopic, geochemical, and microbiological) of groundwater-surface water physicochemical interactions in a large (ninth-order) stream system. The integrated multidisciplinary approach is also significant in that it indicates that groundwater-surface water interaction water quality studies depend on a variety of techniques. The study suggests that hyporheic zone processes might be relevant in the management of the water quality of large streams. Large-stream hyporheic zones may possess the capability for nitrogen cycling (nitrate uptake and/or reduction; nitrification). Furthermore, nitrogen cycling in the hyporheic zone of large streams, especially near the water table, may be particularly sensitive to shifts in changing redox conditions due to dynamic groundwater-surface water interactions. Calculation of groundwater solute loads to large streams based on regional groundwater geochemistry, without accounting for hyporheic zone biogeochemical transformations, could result in significant errors. Research results may also have implications for water management issues other than just water quality. For example, uncertainties in streamflow measurements resulting from variations in proportions of river water in open channels versus hyporheic zones may have water rights or water use implications. |
parameters (e.g., dissolved oxygen, redox conditions, dissolved organic and inorganic carbon, nitrogen species). It is imperative in Cycle II that NAWQA endeavors to include hyporheic processes in augmenting its understanding of water quality processes in GW-SW systems, as has been done in the Willamette Basin (Hinkle et al., 2001). Efforts to couple hyporheic zone modules to existing models should be accelerated, and the committee notes that a hyporheic module has recently been developed for MODFLOW. Since TOPMODEL (Beven, 1997) is often used in watershed studies, efforts might be directed toward adapting it to treat chemical transport. Some rudimentary attempts using TOPMODEL to simulate the transport of dissolved organic carbon (DOC) have already been made (Boyer et al., 1996; Hornberger et al., 1994) by coupling TOPMODEL to simple mixing-cell models. However, more work needs to be done. It may be appropri-
ate to consider developing a hyporheic simulator for TOPMODEL. Where detailed data are lacking, simple hyporheic zone transport models can be used in data analysis (Bencala and Walters, 1983).
In conjunction with appropriate models, experiments should be designed to elucidate the water quality-controlling processes at the GW-SW interface (see Hinkle et al., 2001). Some of these experiments should be conducted in conjunction with the planned flowpath experiments for Cycle II. Tracer tests should be an integral part of these experiments, and the tests should be conducted in a variety of study units that subsume the land-use, hydrogeologic, and climatologic characteristics of the nation. Collaboration should be sought with individuals in USGS’s Ground-Water Resources, Toxic Substances Hydrology, and National Research Programs and in the academic community (e.g., state Water Resources Research Institutes). Furthermore, study units should be encouraged to develop a process-based approach to the characterization of GW-SW interactions and their effects on water quality. If this means seeking out collaborators and cooperators, then that should be encouraged as well.
Recommendation
-
The hyporheic zone, or groundwater-surface water ecotone, can be an important component in understanding surface water quality and near-surface groundwater quality in NAWQA study units. All appropriate Cycle II study units should endeavor to (1) design a process-based approach to characterize GW-SW interactions and their effects on water quality and (2) use process-based models that can include GW-SW interaction components to delineate the spatial and temporal variations in GW-SW interchange and the concomitant water quality changes. This may mean seeking out collaborators and cooperators to find the needed expertise and study sites, and this should be encouraged as well.
Effects on Stream Ecosystems
As part of the targeted studies of factors governing water quality, three objectives relate directly to understanding the causes of degradation of stream ecosystems. Studies proposed under these objectives will assess the effects on stream biota and ecosystems of contaminants, contaminant mixtures, habitat modification, and other stressors (Gilliom et al., 2000).
Objective U12: Ecological effects of contaminants: Evaluate sediment or water toxicity at sites representing the range of environmental concentrations and mixtures of contaminants. At sites found to be toxic, determine concentrations and mixtures present in sediment and/or water and screen selected biota for physiological indicators of exposure such as biomarkers, as appropriate based on contaminants present.
Objective U13: Ecological effects of nutrient enrichment: Evaluate the relation between community structure and trophic dynamics among streams receiving varying levels of enrichment from allochthonous carbon, nitrogen, and phosphorus.
Objective U14: Ecological effects of habitat modification: Characterize and evaluate the relation between streamflow characteristics, physical habitat, and community structure.
The objective (U12) relating to understanding the ecological effects of contaminants is being considered in the first phase of Cycle II by assessing methyl mercury accumulation in aquatic organisms, a wise choice for a target contaminant (see Chapter 3 for detailed discussion of this pilot program). The committee thinks that this is an appropriate direction for NAWQA in Cycle II. Some of the other directions implied under the general description of Objective U12 in Gilliom et al. (2000) sound like the beginnings of an ecotoxicology program, which would not be an appropriate course for NAWQA to take. It is not clear what studies would be done to evaluate “sediment or water toxicity at sites representing the range of environmental concentrations and mixtures of contaminants.” To do this properly could consume most of NAWQA’s resources in Cycle II. It would be inadvisable for NAWQA to embark upon a major ecotoxicology program since one already exists in USGS’s Biological Resource Division (BRD). Thus, it is critical that Objective U12 be clarified so that the types of studies being considered are clearly articulated and potential collaborative relationships with other internal and external (such as BRD) programs can be more clearly defined.
The effects of nutrient enrichment (U13) will be considered in the first phase of Cycle II, although these effects will be considered only in agricultural streams in this first phase (Gilliom et al., 2000). NAWQA justifies its focus on this objective by noting that the EPA will be developing regional nutrient criteria for streams during the time that the first monitoring phase of Cycle II is occurring. The committee feels that such an initial focus on Objective U13 is a wise decision. The NAWQA data should be able to make a significant contribution to these important regulatory decisions that will have considerable impact on the nation’s water quality in the future. However, focusing its attention only on nutrient enrichment in agricultural streams reduces its ability to contribute to the nationwide debate in all regions. Clearly there are nutrient enrichment problems in urban ecosystems as well, and regulations will not be able to ignore them. In addition, unless excess sedimentation is factored into this study design, its results will be of limited value (see Chapter 3 for further discussion). The presence of excess sediments not only alters turbidity (which is acknowledged in Gilliom et al., 2000), but also alters habitat available for algae. The response to excess nutrients will vary greatly depending on whether the stream has stable rock surfaces or unstable, shifting sediments. The presence of excess sediments in stream channels may be a consequence of present land use in the watershed or may be a
legacy of past land use. In either case, sedimentation cannot be ignored. As discussed at length in Chapter 3, sediment is such an important water quality issue that it demands more attention from NAWQA and the USGS, both in direct status and trends measures (Chapter 4) and through other measures in ecological and habitat assessments.
Habitat degradation is often argued to be the most significant cause of ecological impairment (e.g., Naiman et al., 1995); thus it is appropriate that NAWQA have this as one of its objectives (U14). This represents an issue that will permeate most of the other attempts to synthesize ecological data in Cycle II. Thus, even though it will not be directly addressed through targeted studies in the first phase of Cycle II, it will be impossible to consider effects of nutrient enrichment (U13) or to consider effects of agricultural (e.g., Objective T6) or urban land-use change (e.g., Objective T4) without evaluating habitat degradation. The committee notes that considerable progress with this objective could and should be made using existing Cycle I data and the information being collected as part of the status and trends assessments.
Altered flow regime is often a significant component of habitat alterations. Because of its expertise in hydrology and hydrologic modeling, the USGS is particularly well suited to explore the linkages between flow regime, biological indicators, and ecosystem processes. Although this aspect of habitat alteration is included in the description of this objective, it does not appear that it will be investigated in the first group of Cycle II sites, except perhaps indirectly in studies associated with the urban gradient (Gilliom et al., 2000). Current approaches to understanding the relationships between altered flow regime, habitat alteration, and ecological impacts have relied on physical habitat simulation models (e.g., PHABSIM; Stalnaker et al., 1995) or on exploring essential components of the natural flow regime (Poff et al., 1997; Richter et al., 1996). USGS scientists have considerable data and expertise in this area and could make a significant contribution to understanding the linkages between flow alterations, aquatic biota, and water quality. Thus, NAWQA should consider including studies on the impact of alterations in hydrologic regime in its later-phase Cycle II plans.
The three objectives discussed here have evolved over the course of the committee’s deliberations, and it is important to note that understanding the impacts of exotic species has been eliminated from the most recent list of Cycle II objectives. In many situations, it may be impossible to understand the factors resulting in degraded stream ecosystems without knowledge of the impacts of exotic species. There are also important feedbacks between degraded water quality conditions and vulnerability of stream assemblages to invasion by exotic species. The NAWQA data set could be used to make a valuable contribution to our understanding of this phenomenon. One important component of many biotic indices is some measure of the relative abundance of native versus exotic species, and this information should already be contained in the NAWQA database. Thus, although there may not be a specific objective relating to exotic species, data
already collected and being analyzed by NAWQA will be valuable for examining these questions. NAWQA should find some way to encourage this synthesis, perhaps by developing cooperative arrangements with individuals working in the Fish and Wildlife Service’s Invasive Species Program.
Assessment of Biological Integrity
Biological assessments focus on the living components of aquatic ecosystems and use those components to assess ecological health. They are typically used to help diagnose physical, chemical, and biological degradation of water resources and the cumulative effects of multiple sources of pollution. Because biological assessments are based on measures of the biota, which are continuously exposed to degraded water quality, they can provide a more integrative measure of water quality than simple grab samples taken for measures of water chemistry. Biologi-
|
BOX 5-5 Methods for biological assessment have made considerable progress since the first publication of the Index of Biotic Integrity (IBI; Karr, 1981). The first IBI was developed to assess fish in the Midwest, but it has since been modified to be used with fish in other parts of the country (Karr and Chu, 1999). A benthic IBI was developed for use with benthic macroinvertebrates based on data collected by the Tennessee Valley Authority (Kerans and Karr, 1994), and this metric has also been adapted for application in different parts of the United States. The IBI is a multimetric index developed from measured attributes of biological samples taken at sites representing a range of human influence. Attributes of the biological assemblage (e.g., taxa richness, relative number of sensitive taxa, relative abundance of different functional feeding groups) are scored, and those with the greatest ability to discriminate between sites are included in the metric. Usually 10-15 attributes of the assemblage are scored, and the scores are combined into a single IBI measure whose statistical properties are known (Karr and Chu, 1999). A somewhat different approach to biological assessment is used in measures such as the North Carolina Biotic Index (Lenat, 1993). This approach is based on considerable knowledge of the sensitivity of different benthic macroinvertebrate taxa to pollutants, resulting from extensive collections in a wide range of environmental settings. Each taxon is given a sensitivity rating based on its tolerance to degraded conditions. An |
cal assessments are an integral part of all themes of the NAWQA program— status, trends, and understanding.
Although extensive research has been conducted on methods and approaches for biological assessments (see Box 5-5), there is considerable debate not only about the best methods for assessing biological integrity (“biointegrity”) of surface waters as required by the Clean Water Act, but also about the definition of biointegrity itself. In this regard, the USGS’s NAWQA program is in excellent position to make a meaningful contribution to the methods debate based on results from Cycle I studies in which it has conducted bioassessments based on fish, benthic invertebrate, and algal assemblages. This should be a top priority of the recently formed Ecological Synthesis Team. The synthesis will be able to address questions of which indices and which taxonomic groups (fish, invertebrates, or algae) provide the most sensitive and robust assessment of biotic integrity based on a nationwide database that will be unique. This research has been much slower
|
index score for a site is given based on the tolerance values of the organisms collected at the site. A simple yet apparently widely applicable index based on sensitive organisms is the EPT richness index, which represents the total number of taxa found at a site in the following three predominantly benthic aquatic insect orders, chosen because of their sensitivity to pollutants: Ephemeroptera (mayflies), Plecoptera (stoneflies), and Trichoptera (caddisflies). The Europeans and Australians have taken a somewhat different approach to biological assessment, which they have called RIVPACS (Wright, 1995). This method is based on extensive sampling of benthic macroinvertebrates in streams and rivers that are minimally impacted by humans. The biological assemblages, geographic locations, and physical attributes from these reference sites are combined in a multivariate statistical analysis that predicts the biological assemblage expected at a site based on its location. Samples collected from the site are then compared with this expected condition, and deviations from the expected can be attributed to anthropogenic effects. This approach is currently being explored in the western United States (Hawkins et al., 2000). The use of algae in biological assessments has not been as widely applied as that of benthic macroinvertebrates or fish. Algae (more specifically, periphyton) respond fairly rapidly to changing conditions in streams and thus are less representative of longer-term conditions. Their abundance can be highly variable depending on time (e.g., since the most recent storm event). Nonetheless, biological indicators based on algal assemblages have been developed for different parts of the country. |
than other aspects of NAWQA largely because of problems encountered with the processing and identification of the large number of samples collected in Cycle I, although these problems have now been resolved and the data backlog is being reduced. In particular, the Ecological Synthesis Team should determine if all of the biological assessments are necessary. For example, what insights to water quality conditions do invertebrate measures provide that are not provided by fish? What insights are provided by algal indices that are not apparent with other indices? This data set should be employed to suggest cost-effective ways to use biological monitoring in Cycle II when resource limitations do not permit everything to be measured.
In addition to evaluating different indices, it is critical that the Ecological Synthesis Team explore quantitative relationships between biotic indices and other measures of water quality. This topic is well suited for some rigorous modeling approaches. As state and local regulatory agencies incorporate more biological monitoring into their programs, it is crucial that the linkage between biological assessments and more traditional chemical measures of water quality be evaluated. Regulators need to know what leads to impairment of biological integrity and what must be regulated to reverse the trend of biological impairment. With its nationwide database, the USGS is in a position to make a meaningful contribution to this important issue.
One data set from a Cycle I study unit in which biological indicators were extensively studied (Cuffney et al., 1997) has revealed an interesting pattern of response that bears further investigation. Many of the indicators exhibited a threshold response to water quality degradation along a gradient of agricultural intensity; they declined precipitously at certain levels of an agricultural intensity index and then showed little change as agricultural intensity increased. Further investigations of the generality of this threshold response along other land-use gradients are planned as part of the Ecological Synthesis Team’s work. This is an important direction for further research because, if thresholds are a general phenomenon, that could impact local, state, and national priorities for ecosystem rehabilitation. If a goal is to achieve maximum improvement in biological assemblages, these data would suggest that focusing rehabilitation efforts on sites near the threshold rather than on highly degraded sites would be most cost-effective.
Recommendations
-
It would be inadvisable for NAWQA to embark upon a major ecotoxicology program that would overlap with the USGS’s Biological Resources Division program. Thus, it is critical that Objective U12 be clarified to better articulate proposed studies so that potential collaborative relationships with other programs can be more clearly defined.
-
Focusing NAWQA’s attention only on nutrient enrichment in agricultural
-
streams reduces its ability to contribute to the nationwide debate in all regions. Clearly, there are nutrient enrichment problems in urban ecosystems as well, and NAWQA should assess these as well, to the extent possible.
-
Habitat degradation is often argued to be the most significant cause of ecological impairment. Thus, NAWQA should reconsider including studies on the impact of alterations in hydrologic regime and sediment transport in its laterphase Cycle II plans.
-
Although there may not be a specific objective relating to exotic species, data already collected and being analyzed by NAWQA will be valuable for examining questions about their impacts. NAWQA should find ways to encourage this synthesis, perhaps by developing cooperative arrangements with the U.S. Fish and Wildlife Service’s Invasive Species Program.
-
The USGS’s NAWQA program is in an excellent position to make a meaningful contribution to the debate on which biological indices are most meaningful based on results from Cycle I studies in which it has conducted bioassessments based on fish, benthic invertebrate, and algal assemblages. This should be a top priority of the Ecological Synthesis Team. Further, the information developed on which indices are most informative should be employed to suggest cost-effective ways to use biological monitoring in Cycle II. In addition to evaluating different indices, it is critical that the Ecological Synthesis Team explore quantitative relationships and potential threshold responses between biotic indices and other measures of water quality.
Extrapolation and Forecasting
Geographic extrapolation of analyses from NAWQA study units to unmeasured areas and forecasting future water conditions (e.g., based on land management changes) is an essential feature of NAWQA. In the Cycle I national synthesis reports (see also Chapter 6), scientific inferences tend to be expressed in terms of “percent of the samples,” which in effect restricts the geographic coverage to NAWQA watersheds. Strictly speaking, this is incompatible with the initial NAWQA program goal “to describe the status and trends in the quality of the nation’s ground- and surface-water resources,” but it is nonetheless a prudent strategy given the limited basis for extrapolation to unsampled areas (representativeness issues that are fundamental to extrapolation considerations are also discussed in Chapters 2 and 4).
It is noteworthy that the Cycle II goals have been scaled back to describing “water-quality conditions for a large part of the nation’s water resources” (emphasis added), while three Cycle II understanding objectives (U15 to U17; see below) explicitly address extrapolation and forecasting. These are both improvements to NAWQA; the first acknowledges the limitations in coverage of the NAWQA study units, and the second targets a scientific basis for inferences beyond the study unit site samples.
Objective U15: Evaluation of empirical extrapolation and forecasting models: Develop, evaluate, and improve empirical models for spatial extrapolation and forecasting using statistically based methods such as regression analysis.
Objective U16: Evaluation of deterministic extrapolation and forecasting models: Systematically evaluate and test selected existing simulation models for their potential value in extrapolation and forecasting of water quality in streams and groundwater.
Objective U17: Application of extrapolation and forecasting models: Apply the most appropriate empirical and deterministic models to specific extrapolation and forecasting objectives.
The three understanding objectives for Cycle II address extrapolation to unmeasured geographic areas and future forecasting. Based on the brief statement and description of objectives in the NIT guidance (Gilliom et al., 2000; see Appendix A), empirical and mechanistic (simulation) models are expected to play a key role in this extrapolation and forecasting theme. Beyond that, no additional details are presented in the Cycle II implementation guidelines to describe how this will be accomplished, except that consideration will be given to “knowledge of land use and contaminant sources, natural characteristics of the land and hydrologic system, and our understanding of governing processes.”
Despite the absence of details on extrapolation and forecasting planned for Cycle II, several papers and reports have been prepared by USGS-NAWQA scientists that provide an indication of related techniques that may be applied in Cycle II. For example, Nolan et al. (1997) mapped the United States based on nitrate input risk groups to statistically assess (using boxplots and analysis-of-variance techniques) the relationship between risk group and groundwater nitrate concentration (based on NAWQA measurements). Black et al. (2000), Rupert (1998), and Tesoriero and Voss (1997) all used logistic regression to develop statistical models to predict the probability of contaminant (nitrate and pesticides) concentration exceedances in surface and groundwater from land use and various land features.
These articles indicate a consistent strategy to develop statistical relationships between NAWQA water quality data and predictor variables that are widely measured and reported. This is a prudent strategy. However, NAWQA scientists have recognized the importance of technical support for modeling and hydrologic system analysis with plans to establish the HST (Gilliom et al., 2000). In a similar manner, NAWQA should establish a statistical model support team (perhaps as a subgroup within HST) to provide guidance on the selection and application of these increasingly important modeling tools. This should be an easy task for USGS to support, since some of the best hydrologic statisticians in the United States already are employed by the USGS. As noted in Chapter 4, USGS has long been a leader in “regionalization” and extrapolation, of streamflow data in particular. The statistical model support group should build on this experience to
adapt methods for water quality assessments. Among the issues that this proposed group could advise on are (1) conditions permitting extrapolation of statistical model inferences to unsampled areas, (2) alternative regression and multivariate methods such as smoothing and robust estimation, (3) consequences of extensive model specification searching, and (4) statistical support for causal conclusions and application of emerging methods in causality assessment (e.g., Spirtes et al., 2001). These specifications parallel the prior recommendations for a focus on parsimonious and adaptive models; including Bayesian and Kalman filtering analysis.
Recommendation
-
NAWQA should establish a statistical model support team (perhaps as a subgroup within the HST) to provide guidance on the selection and application of the increasingly important modeling tools. This group can build on the USGS’s historical strength and experience in regionalization and extrapolation of streamflow. Also the group should explore and advise on various issues, including more parsimonious and adaptive models, new techniques (e.g., Bayesian), and previously discussed issues such as uncertainty assessment.
CONCLUSIONS AND RECOMMENDATIONS
The application of water quality models is an essential activity to achieve the understanding goal of Cycle II NAWQA. The status and trends networks provide the basis for modeling contaminant sources and their transport, and therefore, the proposed application of models in Cycle II will rely heavily on the knowledge gained from Cycle I. Modeling of contaminant sources and their transport to water resources, and hence an ability to predict future conditions, are key to the development of efficient management and policies to protect the beneficial uses of the nation’s water resources, including drinking water and viable ecosystems. Therefore, the application of water quality models is the cornerstone of water resource management for the future, and this was clearly recognized by the NRC as early as 1990 when model application was recommended for NAWQA.
Several types of models are proposed for application in Cycle II. The committee presents an overview of models, including those categorized as conceptual, mass balance, statistical regression, process based (mechanistic), and hybrids of these. The systematic arrangement of these models in a hierarchy of spatial and temporal scales can be linked to, and will advance the development of, the Modular Modeling System. When more complex models are applied, the focus should be on those that can be parameterized with data. Once models are applied, the quantification of uncertainty is important to provide perspective for interpretation of model results; therefore, written guidance to standardize the documentation of uncertainty should be developed.
Successful implementation of model application will require detailed planning to accommodate the practical aspects of the Cycle II implementation strategy. The practical aspects to be dealt with include a clear statement of objectives, coordination of hydrological and water quality models, designation of appropriate staff resources, and optimization of financial support.
The six themes with 17 objectives that describe the understanding goal for Cycle II were developed (in the preliminary planning) by categorization of the wide variety of scientific studies proposed by the Cycle II study units. This is the first step needed to determine where commonalties or synergies exist between studies on a regional or national scale. From this, topics are to be selected for targeted studies to meet the understanding goal, but the selection process has not yet been clearly defined. A greater distillation of this collection of ideas is needed since it does not appear that the objectives have been sufficiently refined and focused. The final section of the NIT guidance (Gilliom et al., 2000) presents an example for targeted study development by an Agricultural Chemical Source and Transport Team. This is a strong example that included a set of more clearly defined hypotheses for study. NAWQA should build on this example to further define and clarify study development. It also may be useful to relate the proposed studies and their components to the conceptual source-transport-receptor model presented in the NIT guidance. The STR could be used to organize a wide range of studies from across the nation to show how they relate to each other and where information may be lacking. It is important that the targeted studies are interpreted in the context of NAWQA’s themes and related objectives for Cycle II so they may be evaluated in terms of geographic applicability and national priority.
At this important juncture in the development of NAWQA, the committee concludes that the USGS has several major opportunities to advance scientific understanding of factors that affect water quality conditions. As noted throughout this report, the USGS as an organization is uniquely qualified to pursue this national monitoring work. No other federal agency has the organization and infrastructure to collect, analyze, and report on the water resources of the nation with the long-term consistency critical to the success of this program. However, the committee is concerned whether sufficient staff, resources, and expertise are allocated to ensure that modeling implementation can be accomplished and that targeted studies can be adequately developed. Although the NIT report (Gilliom et al., 2000) recognizes the resource problem, its resolution will ultimately govern what can be accomplished in Cycle II.
Given these general conclusions from the review of NAWQA plans for the understanding goal in Cycle II, there are many specific recommendations that the committee offers; these are listed below in order of the chapter sections.
Recommendations for Modeling Approach
-
Conducting mass balances on constituents of concern is a worthy effort in Cycle II. It is strongly recommended that at least a conceptual mass balance be developed for nonpoint source pollutants studied in each study unit.
-
The committee recommends, as discussed in Chapters 2 and 3, that although lakes and reservoirs are not a prominent focus of NAWQA, there are opportunities to use a mass-balance approach to examine and compare their behavior. NAWQA should use the data collected to summarize retention and residence time for key contaminants. This will contribute to understanding system behavior and provide data to stimulate further studies of controlling factors of water quality.
-
The USGS and NAWQA should continue research on improving rating-curve and other statistically based water quality models. Future improvements are likely to come from the integration of statistical and physical process-oriented models. Research should focus on physical reasoning and physical process interpretations of the concentration-discharge relationship of the type introduced by O’Connor (1976) and Duffy and Cusumano (1998).
-
Early applications of SPARROW (e.g., to the Chesapeake Bay; Preston and Brakebill, 1999) have proven quite promising. The committee encourages NAWQA to continue research relating to the improvement and application of SPARROW.
-
NAWQA-USGS should focus on simple, parsimonious process models (i.e., models that are not overparameterized) where parameter estimation and mechanistic expressions can relate to available data. Further, consistent with the recent NRC study of the scientific basis of EPA’s TMDL program (NRC, 2001), NAWQA should encourage that such models be usable in an adaptive framework. This includes techniques such as Bayesian analysis, Kalman filtering, and data assimilation that allow model forecasts to be updated and improved over time with monitoring data.
-
All future NAWQA studies should attempt to evaluate the uncertainty associated with all aspects of their water quality modeling evaluations, and the Hydrologic Systems Team should develop a guidance document on this topic.
Recommendations for Implementation
-
The 17 objectives for the understanding goal, as presented in the NIT report, are complex and address too many issues to have a good focus. Further, the process of selecting topics for targeted studies to meet the understanding goal in Cycle II has not yet been clearly defined. The example of the ASTT, however, was well done, presenting clearly defined hypotheses and a focus lacking in other areas. The committee recommends that NAWQA build on this example to develop and refine its targeted study approach.
-
NAWQA must resolve staffing, expertise, and resource issues if the objectives of the understanding goal are to be successfully addressed in Cycle II. It is unclear what portion of the objectives can be met at the level of resources suggested in planning documents and whether sufficient staff expertise is available for model application and implementation.
Recommendations on Understanding Themes and Objectives
Sources of Contaminants
-
NAWQA should consider evaluation of the variability of sources and contaminant occurrence as a first step for the objectives related to “understanding contaminant sources”; this should take place prior to subsequent space-for-time and targeted study design. NAWQA should also consider collaboration with other agencies that may have pertinent data to evaluate statistical properties of contaminant variability.
-
Sampling design should include interpolation and indexing considerations that may be necessary to develop as complete a mass balance as possible.
-
For the identification of sources, when feasible, monitoring programs should employ highly specific or supplementary analyses that permit distinction between different sources of the same contaminant (e.g., coliphage or ribotyping of microbiological specimens, isotopic analyses of some chemicals).
-
Some sampling strategies may require higher resolution to assess some contaminant sources. Sample data should be stratified between stormflow and baseflow for the development of relationships between land use and stream concentrations for many contaminants.
Contaminant Fate and Transport
-
The HST should ensure some uniformity (and/or compatibility) in the use of models and software packages in Cycle II to enable national comparisons and aggregation of data and results. As previously discussed, to test research hypotheses the HST must also address error terms and uncertainty in model selection and application.
-
The current NAWQA program is not geared to the assessment of ephemeral streamflows that can be an important contaminant source in arid areas in particular. NAWQA should develop strategies to sample ephemeral streamflows, especially in perceived high-risk areas, such as those in which contamination could threaten perennial streams, lakes or reservoirs, or shallow groundwater systems.
Groundwater-Surface Water Interactions
-
The hyporheic zone, or groundwater-surface water ecotone, is an important component in understanding surface water quality and near-surface groundwater quality. All appropriate Cycle II study units should endeavor to (1) design a process-based approach to characterize GW-SW interactions and their effects on water quality and (2) use process-based models that can include GW-SW interaction components to delineate the spatial and temporal variations in GW-SW interchange and the concomitant water quality changes. This may mean seeking out collaborators and cooperators to find the needed expertise and study sites, and this should be encouraged as well.
Effects on Stream Ecosystems and Assessments of Biological Integrity
-
It would be inadvisable for NAWQA to embark upon a major ecotoxicology program that would overlap with the USGS’s Biological Resources Division program. Thus, it is critical that Objective U12 be clarified to better articulate proposed studies so that potential collaborative relationships with other programs can be more clearly defined.
-
Focusing NAWQA’s attention only on nutrient enrichment in agricultural streams reduces its ability to contribute to the nationwide debate in all regions. Clearly, there are nutrient enrichment problems in urban ecosystems as well, and NAWQA should assess these to the extent possible.
-
Habitat degradation is often argued to be the most significant cause of ecological impairment. Thus, NAWQA should reconsider including studies on the impact of alterations in hydrologic regime and sediment transport in its later-phase Cycle II plans.
-
Although there may not be a specific objective relating to exotic species, data already collected and being analyzed by NAWQA will be valuable for examining questions about their impacts. NAWQA should find ways to encourage this synthesis, perhaps by developing cooperative arrangements with the U.S. Fish and Wildlife Service’s Invasive Species Program, for example.
-
The USGS’s NAWQA program is in excellent position to make a meaningful contribution to the debate on which biological indices are most meaningful based on results from Cycle I studies in which it has conducted bioassessments based on fish, benthic invertebrate, and algal assemblages. This should be a top priority of the Ecological Synthesis Team. Further, the information developed on which indices are most informative should be employed to suggest cost-effective ways to use biological monitoring in Cycle II. In addition to evaluating different indices, it is critical that the Ecological Synthesis Team explore quantitative relationships and potential threshold responses between biotic indices and other measures of water quality.
Extrapolation and Forecasting
-
NAWQA should establish a statistical model support team (perhaps as a subgroup within the HST) to provide guidance on the selection and application of the increasingly important modeling tools. This group can build on the USGS’s historical strength and experience in regionalization and extrapolation of streamflow. Also the group should explore and advise on various issues, including more parsimonious and adaptive models, new techniques (e.g., Bayesian), and previously discussed issues such as uncertainty assessment.
REFERENCES
Alexander, R. B., R. A. Smith, and G. E. Schwarz. 2000. Effects of stream channel size on the delivery of nitrogen to the Gulf of Mexico. Nature 403:758-761.
Bachman, L. J., and P. J. Phillips. 1996. Hydrologic landscapes on the Delmarva Peninsula, Part 2, Estimates of base-flow nitrogen load to Chesapeake Bay. Journal of American Water Resources Association 32(4):779-791.
Bencala, K. E., and R. A. Walters. 1983. Simulation of solute transport in mountain pool-and-riffle stream: A transient storage model. Water Resources Research 19:718-724.
Beven, K. J. 1997. Distributed Hydrological Modelling: Applications of the TOPMODEL Concept. New York: Wiley & Sons.
Black, R. W., A. L. Haggland, and F. D. Voss. 2000. Predicting the probability of detecting organochlorine pesticides and polychlorinated biphenyls in stream systems on the basis of land use in the Pacific Northwest, USA. Environmental Toxicology and Chemistry 19:1044-1054.
Bohlke, J. K., and J. M. Denver. 1995. Combined use of groundwater dating, chemical and isotopic analyses to resolve the history and fate of nitrate contamination in two agricultural watersheds, Atlantic coastal plain, Maryland. Water Resources Research 31(9):2319-2339.
Borsuk, M. E., D. Higdon, C. A. Stow, and K. H. Reckhow. 2001. A Bayesian hierarchical model to predict benthic oxygen demand from organic matter loading in estuaries and coastal zones. Ecological Modelling 143:165-181.
Boyer, E. W., G. M. Hornberger, K. E. Bencala, and D. M. McKnight. 1996. Overview of a simple model describing variation of dissolved organic carbon in an upland catchment. Ecological Modelling 86:183-188.
Cohn, T. A. 1995. Recent advances in statistical methods for the estimation of sediment and nutrient transport in rivers. In Vogel, R. M. (ed.) U.S. National Report 1991-1994—Contributions in Hydrology. Washington, D.C.: American Geophysical Union. Available online at http://www.agu.org/revgeophys/cohn01/cohn01.html.
Cuffney, T. F., M. R. Meador, S. D. Porter, and M. E. Gurtz. 1997. Distribution of fish, benthic invertebrate and algal communities in relation to physical and chemical conditions, Yakima River basin, Washington, 1990. U.S. Geological Survey Water-Resources Investigations Report 96-4280. Raleigh, N.C.: U.S. Geological Survey.
Dillon, P. J., and F. H. Rigler. 1974. A test of a simple nutrient budget model predicting the phosphorus concentration in lake water. Journal of the Fisheries Research Board of Canada 31:1771-1778.
Duffy, C. J., and J. Cusumano. 1998. A low-dimensional model for concentration-discharge dynamics in groundwater stream systems. Water Resources Research 34(9):2235-2247.
EPA (U. S. Environmental Protection Agency). 1997. New York City Watershed: Filtration Avoidance Determination. Mid-Course Review. Available online at http://www.epa.gov/r02earth/water/nycshed/fadrev2.htm.
Gibert, J., M. J. Dole-Olivier, P. Marmonier, and P. Vervier. 1990. Surface water/groundwater ecotones. Pp. 199-225 in Naiman, R. J., and H. Decamps (eds.) Ecology and Management of Aquatic-Terrestrial Ecotones. Park Ridge, N.J.: The Parthenon Publishing Group.
Gilliom, R. J. 2000a. Hydrologic systems analysis and modeling in Cycle II of NAWQA. Draft memo, submitted to the NRC committee, October 3.
Gilliom, R. J. 2000b. Preliminary draft of themes and objectives for Cycle II investigations. Draft memo, submitted to NRC committee, April 19.
Gilliom, R. J., K. Bencala, W. Bryant, C. A. Couch, N. M. Dubrovsky, L. Franke, D. Helsel, I. James, W. W. Lapham, D. Mueller, J. Stoner, M. A. Sylvester, W. G. Wilber, D. M. Wolock, and J. Zogorski. 2000. Study-Unit Design Guidelines for Cycle II of the National Water Quality Assessment (NAWQA). U.S. Geological Survey NAWQA Cycle II Implementation Team. Draft for internal review (11/22/2000). Sacramento, Calif.: U.S. Geological Survey.
Harwood, A. K. 1995. The Urban Stormwater Contribution of Dissolved Trace Metals from the North Floodway Channel, Albuquerque, NM, to the Rio Grande . Professional project report, Master of Water Resources Administration Degree, University of New Mexico.
Hawkins, C. P., R. H. Norris, J. N. Hogue, and J. W. Feminella. 2000. Development and evaluation of predictive models for measuring the biological integrity of streams. Ecological Applications 10:1456-1477.
Hinkle, S., J. Duff, F. Triska, A. Laenen, E. Gates, K. Bencala, D. Wentz, and S. Silva. 2001. Linking hyporheic flow and nitrogen cycling near a large river in the Willamette Basin, Oregon. Journal of Hydrology 244(3-4):157-180.
Hirsch, R. M., W. M. Alley, and W. G. Wilber. 1988. Concepts for a National Water-Quality Assessment Program. U.S. Geological Survey Circular 1021. Denver, Colo.: U.S. Geological Survey.
Hornberger, G. M., K. E. Bencala and D. M. McKnight. 1994. Hydrological controls on dissolved organic carbon during snowmelt in the Snake River near Montezuma, Colorado. Biogeochemistry 25:147-165.
Karr, J. R. 1981. Assessment of biotic integrity using fish communities. Fisheries 6:21-27.
Karr, J. R., and E. W. Chu. 1999. Restoring Life in Running Waters. Washington, D.C.: Island Press.
Kerans, B. L., and J. R. Karr. 1994. A benthic index of biotic integrity (B-IBI) for rivers of the Tennessee Valley. Ecological Applications 4:768-785.
Leavesley, G. H. 1997. The Modular Modeling System (MMS)—A modeling framework for multidisciplinary research and operational applications. Pp. 27-31 in Freeman, G. E., and A. G. Frazier (eds.) Proceedings of the Scientific Assessment and Strategy Team Workshop on Hydrology, Ecology, and Hydraulics. Volume 5 of Kelmelis, J. A. (ed.) Science for Floodplain Management into the 21st Century. Washington, D.C.: U.S. Government Printing Office.
Lenat, D. R. 1993. A biotic index for the southeastern United States: Derivation and list of tolerance values, with criteria for assigning water quality ratings. Journal of the North American Benthological Society 12:279-290.
Mallard, G. E., J. T. Armbruster, R. E. Broshears, E. J. Evenson, S. N. Luoma, P. J. Phillips, and K. R. Prince. 1999. Recommendations for Cycle II of the National Water Quality Assessment (NAWQA) Program. U.S. Geological Survey NAWQA Planning Team. U.S. Geological Survey Open-File Report 99-470. Reston, Va.: U.S. Geological Survey.
McMahon, P. B., and J. K. Bohlke. 1996. Denitrification and mixing in a stream-aquifer system: Effects on nitrate loading to surface water. Journal of Hydrology 186:105-128.
McMahon, G., and M. D. Woodside. 1997. Nutrient mass balance for the Albemarle-Pamlico Drainage Basin, North Carolina and Virginia. Journal of American Water Resources Association 33(3):73-589.
Naiman, R. J., J. J. Magnuson, D. M. McKnight, and J. A. Stanford. 1995. The Freshwater Imperative. Washington, D.C.: Island Press.
Nolan, B. T. 1998. Modeling approaches for assessing the risk of nonpoint-source contamination of ground water. U.S. Geological Survey Open-File Report 98-531. Denver, Colo.: U.S. Geological Survey.
Nolan, B. T., B. C. Ruddy, K. J. Hitt, and D. R. Helsel. 1997. Risk of nitrate in groundwaters of the United States–A national perspective. Environmental Science and Technology 31:2229-2236.
NRC (National Research Council). 1990. A Review of the USGS National Water Quality Assessment Pilot Program. Washington, D.C.: National Academy Press.
NRC. 1994. National Water Quality Assessment Program: The Challenge of National Synthesis. Washington, D.C.: National Academy Press.
NRC. 2001. Assessing the TMDL Approach to Water Quality Management. Washington, D.C.: National Academy Press.
O’Connor, D. J. 1976. The concentration of dissolved solids and river flow. Water Resources Research 12(2):279-294.
Poff, N. L., J. D. Allan, M. B. Bain, J. R. Karr, K. L. Prestegaard, B. D. Richter, R. E. Sparks, and J. C. Stromberg. 1997. The natural flow regime. Bioscience 47:769-784.
Preston, S. D., and J. W. Brakebill. 1999. Application of Spatially Referenced Regression Modeling for the Evaluation of Total Nitrogen Loading in the Chesapeake Bay Watershed. U.S. Geological Survey Water-Resources Investigations Report 99-4054. Reston, Va.: U.S. Geological Survey.
Puckett, L. J. 1999. Estimation of nitrate contamination of an agro-ecosystem outwash aquifer using a nitrogen mass-balance budget. Journal of Environmental Quality 28(6):2015-2025.
Reckhow, K. H., M. N. Beaulac, and J. T. Simpson. 1980. Modeling Phosphorus Loading and Lake Response Under Uncertainty: A Manual and Compilation of Export Coefficients. EPA-440/5-80-011. Washington, D.C.: U.S. Environmental Protection Agency.
Richter, B. D., J. V. Baumgartner, J. Powell, and D. P. Braun. 1996. A method for assessing hydrologic alteration within ecosystems. Conservation Biology 10:1163-1174.
Rupert, M. G. 1998. Probability of Detecting Atrazine and Elevated Concentrations of Nitrate (NO2+NO3-N) in Ground Water in the Idaho Part of the Upper Snake River Basin. U.S. Geological Survey Water-Resources Investigations Report 98-4203. Boise, Idaho: U.S. Geological Survey.
Smith, R. A., G. E. Schwarz, and R. B. Alexander. 1997. Regional interpretation of water-quality monitoring data. Water Resources Research 33(12): 2781-2798.
Spirtes, P., C. Glymour, and R. Scheines. 2001. Causation, prediction, and search. In Adaptive Computation and Machine Learning (book series). 2nd edition. Cambridge, Mass.: MIT Press.
Squillace, P. J., E. M. Thurman, and E. T. Furlong. 1993. Groundwater as a nonpoint source of atrazine and diethylatrazine in a river during base flow conditions. Water Resources Research 29(6):1719-1729.
Stalnaker, C., B. L. Lamb, J. Henricksen, K. Bovee, and J. Batholow. 1995. The Instream Flow Incremental Methodology: A Primer for IFIM. Biological Report No. 29. Fort Collins, Colo.: U.S. Department of Interior, National Biological Service.
Tesoriero, A. J., and F. D. Voss. 1997. Predicting the probability of elevated nitrate concentrations in the Puget Sound Basin: Implications for aquifer susceptibility and vulnerability. Ground Water 35:1029-1039.
Triska, F. J., V. C. Kennedy, R. J. Avanzino, G. Zellweger, and K. E. Bencala. 1989. Retention and transport of nutrients in the third-order stream in northwestern California: Hyporheic processes. Ecology 70:1893-1905.
Vervier, P., J. Gilbert, P. Marmonier, and M. J. Dole-Olivier. 1992. A perspective on the permeability of the surface freshwater-groundwater ecotone. Journal of the North American Benthological Society 11:93-102.
Vollenweider, R. A.. 1975. Input-output models with special reference to the phosphorus loading concept in limnology. Schweitz. Z. Hydrol. 37(1):53-84.
Vollenweider, R. A.. 1976. Advances in defining critical loading levels for phosphorus in lake eutrophication. Memorie dell’Istituto Italiano di Idrobiologia 33:53-83.
Winter, T. C., J. W. Harvey, O. L. Franke, and W. M. Alley. 1998. Ground Water and Surface Water: A Single Resource. U.S. Geological Survey Circular 1139. Denver, Colo.: U.S. Geological Survey.
Wright, J. F. 1995. Development and use of a system for predicting the macroinvertebrate fauna in flowing waters. Australian Journal of Ecology 20:181-197.


