
2
Transition from Cycle I to Cycle II: Representativeness of Study Units
INTRODUCTION
The National Water Quality Assessment (NAWQA) Program was designed to assess the status of and trends in the quality of the nation’s groundwater and surface water resources and to link the status and trends with an understanding of the natural and human factors that affect the quality of water (Gilliom et al., 1995). Cycle I (1991-2001) of the program set out to accomplish this goal with plans to sample 60 study units (reduced to 59 in 1996)1 that would cover more than half of the nation’s land area and account for about 70 percent of the nation’s drinking water use.2 However, because of budgetary constraints, a total of eight study units that were slated for monitoring from 1997 to 2001 in Cycle I were never initiated. Thus, Cycle I of NAWQA included a total of 51 study units and the High Plains Regional Ground Water (HPGW) Study that was initiated in 1999 (see Chapter 1 for further information on Cycle I monitoring). Despite cutbacks, a major effort during Cycle I was the compilation and synthesis of study unit data to make inferences about “regional” and “national” water quality (e.g., USGS, 1999).
Continuing budget constraints have now dictated that the number of study units in Cycle II be reduced from 59 (for planning purposes) to 42, plus the HPGW study (see Figure 2-1 and Table 2-1). As in Cycle I, the Cycle II study units will
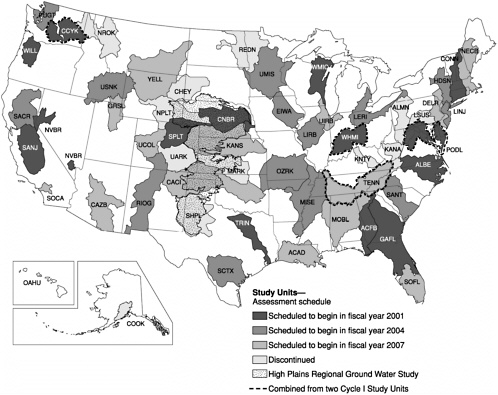
TABLE 2-1 Planned Cycle II NAWQA Study Unitsa
|
Abbreviation |
Name |
Scheduled Starting Year |
|
ACAD |
Acadian-Pontchartrain Drainages |
2007 |
|
ACFB |
Apalachicola-Chattahoochee-Flint River Basins |
2001 |
|
ALBE |
Albemarle-Pamlico Drainages |
2001 |
|
CACI |
Canadian-Cimarron River Basins |
2007 |
|
CAZB |
Central Arizona Basins |
2007 |
|
CCYK |
Central Columbia Plateau-Yakima River Basinb |
2001 |
|
CNBR |
Central Nebraska Basins |
2001 |
|
CONN |
Connecticut, Housatonic, and Thames River Basins |
2001 |
|
DELR |
Delaware River Basin |
2007 |
|
EIWA |
Eastern Iowa Basins |
2004 |
|
GAFL |
Georgia-Florida Coastal Plain Drainages |
2001 |
|
GRSL |
Great Salt Lake Basins |
2007 |
|
HDSN |
Hudson River Basin |
2004 |
|
KANS |
Kansas River Basin |
2007 |
|
LERI |
Lake Erie-Lake St. Clair Drainages |
2004 |
|
LINJ |
Long Island-New Jersey Coastal Drainages |
2004 |
|
LIRB |
Lower Illinois River Basin |
2004 |
|
MISE |
Mississippi Embayment |
2004 |
|
MOBL |
Mobile River Basin |
2007 |
|
NECB |
New England Coastal Basins |
2007 |
|
NVBR |
Nevada Basin and Range |
2001 |
|
OZRK |
Ozark Plateaus |
2004 |
|
PODL |
Potomac River Basin and Delmarva Peninsulac |
2001 |
|
PUGT |
Puget Sound Basin |
2004 |
be monitored in rotation in three successive periods of high-intensity data collection that start in 2001, 2004, and 2007, respectively. The reduction in the number of Cycle II study units naturally raises questions of coverage and representativeness. The issue of how representative the study units are of the nation as a whole assumes even greater importance as NAWQA moves into Cycle II with a reduced number of study units but an emphasis on designing investigations predicated on process-based models (Mallard et al., 1999).
It is interesting to note that the Cycle I goal has often been stated as describing “the status and trends in the quality of the nation’s ground-water and surface-water resources” (Hirsch et al., 1988), while the Cycle II goal is stated as describing “water-quality conditions for a large part of the nation’s water resources” [emphasis added] (Gilliom et al., 2000a). The committee notes that the addition of the words “large part” is a significant and appropriate clarification of some earlier descriptions. In this regard, such inferences refer to the NAWQA study units, which are distributed across the nation but not clearly established to be “representative” of the nation. For the most part, recent written explanations of NAWQA results appear to be appropriately expressed; for example, Kolpin et
|
Abbreviation |
Name |
Scheduled Starting Year |
|
RIOG |
Rio Grande Valley |
2004 |
|
SACR |
Sacramento River Basin |
2004 |
|
SANJ |
San Joaquin-Tulare River Basins |
2001 |
|
SANT |
Santee River Basin and Coastal Drainages |
2004 |
|
SCTX |
South-Central Texas |
2004 |
|
SOCA |
Southern California Coastal Drainagesd |
2007 |
|
SOFL |
Southern Florida Drainages |
2007 |
|
SPLT |
South Platte River Basin |
2001 |
|
TENN |
Tennessee River Basine |
2007 |
|
TRIN |
Trinity River Basin |
2001 |
|
UCOL |
Upper Colorado River Basin |
2007 |
|
UIRB |
Upper Illinois River Basin |
2007 |
|
UMIS |
Upper Mississippi River Basin |
2004 |
|
USNK |
Upper Snake River Basin |
2004 |
|
WHMI |
White, Great and Little Miami River Basinsf |
2001 |
|
WILL |
Willamette Basin |
2001 |
|
WMIC |
Western Lake Michigan Drainages |
2001 |
|
YELL |
Yellowstone River Basin |
2007 |
|
aRefer to Table 1-1 for a listing of states included in each planned Cycle I study unit (many of which are continued in Cycle II) and for definitions of those Cycle I study units that were discontinued or merged for Cycle II (see more below). bMerged from CCPT and YAKI Cycle I Study Units. cMerged from POTO and DLMV Cycle I Study Units. dCalled Santa Ana Basin (SANA) in Cycle I. eMerged from UTEN and LTEN Cycle I Study Units. fMerged from MIAM and WHIT Cycle I Study Units. |
||
al. (1998) were careful to state inferences as 73 percent of the sampling sites or 54 percent of the wells sampled. Thus, NAWQA scientists should continue to endeavor to correctly state the geographic extent of scientific inferences.
This chapter assesses the coverage and representativeness of NAWQA study units and provides recommendations designed to help ensure that Cycle II remains as effective as Cycle I in assessing water quality status, trends, and understanding. More specifically, the chapter begins with an assessment of the representativeness of the nationwide study unit approach to NAWQA that is continued (albeit with a reduced number of study units) into Cycle II. Next, the importance of lakes, reservoirs, coastal waters, and permafrost and their coverage in Cycle II is evaluated. The adequacy of the Cycle II study design for monitoring groundwater and surface water is then assessed (see Chapters 3 to 5 for further information). The last section is a summary of the chapter’s conclusions and recommendations.
This assessment of the coverage and representativeness of the reduced number of study units planned for Cycle II is fundamental to addressing the crosscutting issues of extrapolation and aggregation of NAWQA data, posed in the committee’s statement of task. If the reduced number of study units drastically altered the coverage and representativeness of NAWQA (e.g., by focusing only on urbanized areas), it would affect the potential for extrapolation and aggregation, as well as the potential for trend analysis and cause-and-effect studies.
REPRESENTATIVENESS OF THE STUDY UNIT APPROACH
Background
Representativeness depends upon the degree to which the study unit sites represent the variety of land uses and contaminant sources in the nation’s watersheds and aquifers. In the language of the Cycle II design guidelines (Gilliom et. al., 2000b), “knowledge of land use and contaminant sources, natural characteristics of the land and hydrologic system, and our understanding of governing processes” have to be considered in judging representativeness. To develop a representative group of 42 study units from the original monitored or planned 59 study units in Cycle I, NAWQA program staff employed both quantitative (linear programming) and qualitative (“expert judgment”) approaches. These approaches are discussed below.
The Hydrologic Setting Regions Approach
The representativeness of the Cycle II study units with respect to hydrologic characteristics is addressed through the identification and delineation of hydrologic landscapes (Winter, 1995, 2000, 2001) and hydrologic setting regions throughout the United States (Wolock et al., 2000). Winter’s concept is based on the idea that a single, simple physical feature—called a fundamental hydrologic landscape unit (FHLU)—can be described as the basic building block of all landscapes. This feature is an upland adjacent to a lowland separated by a steeper break in slope. The hydrologic system of a fundamental landscape unit consists of the movement of (1) surface water, controlled by the slopes and permeabilities of its surfaces; (2) groundwater, controlled by the hydraulic characteristics of its geologic framework; and (3) atmospheric water exchange, controlled by climate. This classification system is relevant to NAWQA because these hydrologic processes exert substantial control over water quality. The hydrologic setting region approach used in the NAWQA analysis combines Winter’s three characteristics, plus temperature, in a geographic information system (GIS), and uses statistical analyses to define a total of 17 hydrologic regions (Wolock et al., 2000).
Details of the hydrologic landscape approach within NAWQA are presented in the NAWQA Cycle II Implementation Team (NIT) report by Gilliom et al.
(2000a). However, the three critical characteristics are (1) land surface form (relief, percentage of flat land in various portions of the region); (2) geologic texture (soil and bedrock permeabilities); and (3) climate (mean annual precipitation minus potential evapotranspiration for 1961 to 1990). Note that geologic texture does not directly consider lithology and mineralogy, both of which can profoundly influence water chemistry and, hence, water quality. It would therefore be quite possible to classify two aquifers as similar based on high permeabilities (e.g., a recent basalt and a cavernous limestone) although they might be quite dissimilar in terms of mineralogy or lithology and water quality. This is a shortcoming in the current classification methodologies.
These three characteristics were then combined with temperature (which can also profoundly affect water quality) and averaged for a total of 2,244 hydrologic cataloging units (HCUs). Wolock et al. (2000) then used GIS, principal components, and cluster analyses to operationalize Winter’s hydrologic landscapes concepts to define 17 hydrologic setting regions for the 50 states. These regions were mapped over the entire nation and combined with the map of NAWQA Cycle I study units to help select sites for Cycle II that correspond to the occurrence of the hydrologic setting regions across the nation. Thus, hydrologic setting regions can be used to help achieve representativeness for key natural hydrologic factors as long as the initial set of NAWQA study sites provides adequate coverage of the 17 region types.
For a hydrologic setting to be significant in a particular study unit, it had to cover at least 10 percent of the study unit’s total area. Furthermore, the selected Cycle II study units were chosen to cover 20 percent of the national extent of each hydrologic setting. (In addition, total drinking water use in the selected study units could not fall below 50 percent of the national drinking water use, as described further below.) Based on this exercise, 16 of the 17 hydrologic settings were included in the Cycle II study units. The only setting omitted (cold arid hills) occurs solely in Alaska but represents a very small percentage of the land area of the only Cycle I study unit located in Alaska (Cook Inlet Basin; see more below).
Study Unit Reduction
The actual selection of 42 Cycle II study units from the 59 monitored or planned study units in Cycle I was accomplished through use of a linear programming approach (LPA) to ensure that the reduced number of study units would still represent at least 50 percent of the nation’s drinking water by use, while reflecting a cross section of the nation’s hydrologic settings (as discussed above) and ecological regions. Semiquantitative analyses (SQA) were also employed to ensure that the final group of 42 study units included the top 10 regions representing major contaminant sources (urban, agricultural, and natural), major aquifer systems, and sufficient ecological diversity (as reflected by the critical watershed
|
BOX 2-1 The reduction from 59 (monitored or planned) study units to 42 for Cycle II was achieved using a linear programming approach (LPA) in conjunction with semiquantitative analyses (SQA) to account for factors not considered by LPA (Gilliom et al., 2000a). The LPA was used to optimize the selection of study units based on maximizing drinking water use and distributing the study units over a representative range of hydrologic setting regions. The former is closely correlated with population, while a representative range of hydrologic settings depicts regions with a broad range of natural transport and ecological characteristics. The LPA was also subject to three constraints: (1) for a hydrologic setting to be considered significant in a study unit, it had to comprise at least 10 percent of the study unit’s area; (2) the selected study units had to include at least 20 percent of the national extent of each hydrologic setting; and (3) total drinking water use (groundwater public + groundwater domestic + surface water public) in the selected study units should not fall below 50 percent of national drinking water use. Only 16 of the 17 hydrologic settings were considered because one of the settings (cold arid hills) occurs only in Alaska, covering most of the state but just 2 percent of the COOK Study Unit. The initial LPA exercise produced 42 specific study units for continuation into Cycle II. SQA was subsequently employed to ensure that major contaminant sources (agricultural, urban, natural) and aquifer systems were represented. For each source category, the top 10 study units (of the original 59) were listed. To these three groups were added the study units required to represent coverage of the major aquifer systems. This exercise produced a “top-priority” group of 27 study units. |
concept discussed below). Finally, those study units that had been selected for discontinuation were subsequently examined to ascertain if they possessed characteristics that would otherwise warrant their inclusion in the final 42. Box 2-1 describes the approach employed, and details can be found in Gilliom et al. (2000a).
A brief discussion of the critical watershed concept is warranted. This concept is derived from the publication Rivers of Life (The Nature Conservancy, 1998), which designated 327 small watersheds as “critical watersheds” to maxi-
|
The LPA was then rerun, constrained to included the 27 top-priority study units in the solution set; the consequent reduction in hydrologic setting coverage and drinking water use was then evaluated. The new solution set consisted of the 27 top-priority study units and 15 other units for a total of 42. The new set of 42 study units represented just a 6 percent reduction in the total national drinking water use and was deemed acceptable because it still represents 56 percent of the national drinking water use. At this point, each of the original 59 study units was evaluated individually through SQA based on study unit coverage of ecologically critical watersheds. The NAWQA Cycle II Implementation Team also evaluated the 17 nonselected study units to determine if any had other characteristics that would merit their inclusion in the final 42 Cycle II study units. Five were so indicated: Albemarle-Pamlico Drainages (ALBE); Lower Tennessee River Basin (LTEN); Great and Little Miami River Basins (MIAM); White River Basin (WHIT); and Upper Colorado Basin (UCOL). To accommodate these, combining adjacent study units was considered. Ultimately, eight study units were combined into four: UTEN (Upper Tennessee River Basin) + LTEN; MIAM + WHIT; DLMV + POTO (Delmarva Peninsula + Potomac River Basin); and CCPT + YAKI (Central Columbia Plateau + Yakima River Basin). This produced a group of 29 study units. The LPA was run a third time using this group of 29 in the solution set and resulted in 13 additional study units to obtain a group of 42. Since the 13 nonselected study units contained the desirable UCOL and ALBE Study Units, these two were included in the final group of Cylcle II study units by dropping the Upper Arkansas River Basin (UARK) and the Allegheny and Monongahela Basins (ALMN) Study Units. These were discontinued because both have low agricultural and urban source contaminant rankings. When completed, the LPA and SQA approach produced a final group of 42 study units that account for about 61 percent of the national drinking water use. |
mize coverage of “at risk” fish and mussel species. The watersheds were selected using the total number and percentage of threatened and endangered fish, mussel, and crayfish species. These watersheds represent 15 percent of the total number of eight-digit HCUs in the continental United States and include all known imperiled and vulnerable fish and mussel species. A value of 0 to 5 was assigned to each study unit based on the amount of coverage of critical watersheds (see Gilliom et al., 2000a, Appendix H). (Box 2-1 also describes how the critical watersheds were incorporated into the selection process.)
Through iterative use of LPA-SQA, the 42 planned Cycle II study units represent most of the regions that, regardless of the method of categorization, reflect the diversity in water quality and ecological characteristics of the nation’s waters. The robustness of this approach can perhaps be best exemplified by examining the resulting suite of 42 study units selected for monitoring in Cycle II. Collectively, they account for (1) 16 of the nation’s 17 hydrologic setting regions; (2) about 40 percent of the nation’s land area (down 10 percent from the Cycle I plan); (3) 61 percent of the drinking water use (down about 10 percent from the Cycle I plan); (4) 80 percent of the nation’s agricultural land; (5) about 80 percent of the nation’s pesticide and fertilizer use; and (6) 76 percent (203 of 266) of the metropolitan statistical areas (MSAs3) within the continental United States have some overlap with at least one planned Cycle II study unit, while almost half (49 percent) of the total MSA area in the United States is within the planned Cycle II program area (Curtis Price, U.S. Geological Survey [USGS], personal communication, 2001).
However, a case could be made that none of the proposed 42 Cycle II study units includes a region of continuous or discontinuous permafrost, which would exert a strong control on the occurrence of groundwater. While the sole study unit covering this regime (Cook Inlet Basin; see Figure 2-1 and Table 1-1) has been slated for discontinuation, in terms of population and water use, this regime is not significant. However, its elimination does compromise the ability of the program to comment on the effects of climate change. The reason for this is that high-latitude regions, with their large expanses of ice, will respond quickly to warming or cooling and produce dramatic climatic (and hydrologic) changes (because of albedo changes), more so than temperate or tropical regions. This is referred to as “polar amplification” (Peter Fawcett, University of New Mexico, personal communication, 2001).
In addition, certain types of land use may not be represented adequately in the 42 Cycle II study units. For example, industries such as mining and forest products, whose operations can have a substantial influence on both surface water and groundwater quality, may not be well represented in either the original Cycle I or the reduced set of Cycle II study units, although several “mining indicator” lakes and reservoirs were sampled between 1992 and 2000 (Gilliom et al., 2000b). Similarly, the petrochemical industry, a potential major source of contamination, may not be well represented in Cycle II study units. Since major petrochemical areas were not specifically included as input information in determining the reduced set of study units, there is no way of easily determining how well or
poorly these areas are represented without further analysis. (In this regard, the committee notes that data from the Census Bureau’s Census of Manufacturers or Annual Survey of Manufacturers could be used to help characterize the presence and intensity of various industrial sources of pollution in the planned Cycle II study units.)
Despite these potential shortcomings, the committee feels that the LPA-SQA methodology is an effective tool that provides a sound basis for reducing the number of study units in Cycle II without compromising the goals and objectives of the NAWQA program. Because of its ability to maximize results given certain constraints (i.e., diminishing resources) the LPA approach merits further application in other areas of the NAWQA program. For example, one area in which the NAWQA program might benefit from LPA is the area of sampling from drinking water intakes in reservoirs and lakes. Although the NAWQA program does not have an extensive limnological component, it is sampling at the drinking water intakes in about a dozen lakes and reservoirs (Timothy Miller, USGS, personal communication, 2000). If there are resources for sampling just a small or fixed number of lakes or reservoirs, LPA could be used to optimize the return on sampling—perhaps by finding the combination of lakes or reservoirs supplying the most people or having the largest drainage basins or the most agricultural lands, etc.
The LPA could also be used to assist selecting appropriate sites for surface water urban gradient studies (the “space-for-time” approach, discussed in Chapters 4 and 5). These planned Cycle II studies will be conducted in metropolitan areas with populations >100,000 persons. For these studies, the LPA could perhaps be used to help select sites that might represent different hydrologic settings and differing degrees of urban intensity to maximize results. Such expanded use of LPA within NAWQA might be an excellent way to optimize studies with already limited resources.
The committee notes that there are other useful methodologies that NAWQA scientists might consider when determining the representativeness of study units. For example, the urban intensity index is composed of variables (land cover, infrastructure, population, and socioeconomics) that reflect urbanization (McMahon and Cuffney, 2000). To assess the effects of urbanization, NAWQA watersheds with similar natural characteristics can be compared according to a gradient of the urban intensity index. One obvious advantage of such an approach is that a continuum of effect is quantified. A more detailed discussion of this index is in provided in Chapter 5.
An Alternate Approach to Representativeness: EMAP
Since representativeness continues to be an important consideration in NAWQA as it enters its second decade of monitoring, it may be instructive to examine NAWQA in light of another monitoring program, the Environmental
Monitoring and Assessment Program (EMAP; see also Chapter 7) of the U.S. Environmental Protection Agency (EPA). This program, initiated at approximately the same time as NAWQA, took an altogether different approach to sampling despite the fact that the goals of both programs are similar. That is, EMAP also includes a national assessment of water quality. More specifically, EMAP was to “monitor the condition of the nation’s ecological resources to evaluate the cumulative success of current policies and programs and to identify emerging problems before they become widespread or irreversible” (Messer et al., 1991). Specific objectives of EMAP were to (1) estimate current status, trends, and changes in selected indicators of the nation’s ecological resources on a regional basis with known confidence; (2) estimate the geographic coverage and extent of the nation’s ecological resources with known confidence; (3) seek associations between selected indicators of natural and anthropogenic stresses and indicators of the condition of ecological resources; and (4) provide annual statistical summaries and periodic assessments of the nation’s ecological resources (EPA, 1991).
Ecological resources certainly encompass far more than just surface water and groundwater resources; however, the EMAP core research strategy document (EPA, 1997) indicates an overlap with NAWQA objectives in a number of topics concerned with water quality. The difference in the sampling approaches chosen for the two programs highlights the importance of how representative the NAWQA study units are. In particular, EMAP was based on a national probability sampling approach that was designed to permit statistical inference to a national or regional population. Probability sampling was not the basis for the selection of the NAWQA study units; rather, they were chosen to ensure that the most important national water quality issues in the nation’s largest and most significant hydrologic systems were addressed (USGS, 1995). Failure to employ a probability sample to choose sampling sites does not prevent national inferences using NAWQA data, but it does underscore the need to express inferences correctly or to augment analyses with additional information or data to address the issue of representativeness. Although the absence of probability sampling does mean that NAWQA scientists cannot simply rely on statistical theory for inference or extrapolation to unsampled watersheds, such inferences are not prohibited if NAWQA scientists adequately consider and explain the representativeness of the sampling program to unsampled watersheds. Chapter 4 and particularly Chapter 5 discuss how inferences can be potentially extended to other areas.
It should also be noted that the use of a probability sample, as proposed in EMAP, does not directly support cause-and-effect studies or inferences, nor can trend analyses be accomplished any less cautiously. Furthermore, EMAP has never come to fruition as a national monitoring program (see Chapter 7); it remains in a regional and research mode. There are many unanswered questions about how to approach a probability sample for groundwaters as well as ecological resources.
LAKES, RESERVOIRS, COASTAL WATERS, AND PERMAFROST
Background
The NAWQA program, by design, does not sample many lakes (including the Great Lakes) and reservoirs, and monitoring of coastal waters such as saline estuaries is very limited (see also Chapter 3). However, lakes and reservoirs are undeniably important drinking water sources since about 82 million people in the United States (about 37 percent of the population served by public supply) rely on these surface water sources (William Wilber, USGS, personal communication, 2001). The exclusion of lakes, reservoirs, and coastal waters was a decision made early in the program because of a lack of human and financial resources. Thus, the emphasis in NAWQA continues to be freshwater streams and aquifers (Gilliom et al., 2001; Hirsch et al., 1988).
NAWQA’s limited water quality data collection in lakes and reservoirs is oriented toward basic status and trends themes but not understanding. In its review of the NAWQA pilot program, the National Research Council (NRC, 1990) noted that long-term trends of the water quality of lakes and estuaries should be part of a national assessment and receive the same level of attention as streams and groundwater. That report recommended initial steps to monitor lakes, including the following: (1) lakes should be included but only as they affect downstream water quality; (2) one or more of the first study units should include a lake that is a significant contributor to downstream water quality; and (3) mathematical models should be developed at the initial stages for study units involving lakes. Therefore, although lakes, reservoirs, and coastal waters (estuaries) are not currently a major focus of the program, there is (at least in theory) a provision for the program to expand in that direction.
As noted previously, there are about a dozen drinking water reservoirs that NAWQA does sample at the public water supply intakes (Timothy Miller, USGS, personal communication, 2000). Therefore, NAWQA’s program coverage of lakes and reservoirs is, by design, unrepresentative. Nevertheless, since lakes and reservoirs can often be important components of the local or regional hydrologic system, water quality studies, and public drinking water supplies, NAWQA activities in Cycle I study units that have “important” lakes and reservoirs basically were limited to sampling upstream and downstream. Thus, large reservoirs and lakes are essentially treated as “black boxes.” Sampling in lakes and reservoirs was generally restricted to examining sedimentation and contaminant concentrations in cores (e.g., Callender and Van Metre, 1997). While NAWQA personnel can assess status and trends in water quality in some lakes and reservoirs, they are not positioned to assess understanding. Likewise, in some study units that are tributary to estuaries, NAWQA is measuring chemical fluxes into those coastal water bodies, but it is not examining resulting estuarine water quality or processes in the estuaries.
Importance of Lakes, Reservoirs, Coastal Waters, and Permafrost
The omission of data on lakes and reservoirs in a national water quality assessment means that a primary source of public drinking water is not fully taken into consideration. While NAWQA sampling of streams flowing into reservoirs and lakes provides some measure of contaminant occurrence in source waters, considerable processing can take place in the reservoir or lake that is not accounted for. As noted previously, 37 percent of the population served by public water supplies receives its water from lakes and reservoirs. In addition, the long-term interests of commercial and sport fishing industries, recreational activities, and wildlife protection may not be served if lakes, reservoirs, and coastal waters are not part of the national assessment. Lack of evaluation of water quality status and trends in these water bodies means that effective assessment of pollutants or ecosystem stressors is not possible. As noted by the NRC (1990), it is important to identify and understand water quality trends before they reach the crisis stage. Degradation of water resources used for drinking water, recreation, and wildlife habitat would constitute significant health, aesthetic, and financial losses.
In terms of scientific understanding and management capability, the exclusion of lakes and reservoirs precludes an opportunity to understand significant physical, chemical, and biological processes that alter water quality. For example, an essential difference between lakes or reservoirs and streams is that lakes and reservoirs have longer residence times. Stream residence times are on the order of hours, days or perhaps months, whereas lakes and reservoirs have residence times on the order of months and years. Thus, lakes and reservoirs act as settling basins that retain substances as water flows through them, often resulting in an improvement of water quality in the outflows compared to the inflows. For this reason, lake sediments are often the best place to look for detection of (especially hydrophobic) toxic substances that accumulate in the aquatic environment. However, as previously noted, there has been a limited amount of lake sediment coring and analyses conducted in Cycle I of NAWQA (e.g., Callender and Van Metre, 1997). Since few lake sedimentation data are being collected, future application of integrated models that link watersheds to lakes and reservoirs may not be possible.
In addition to having longer residence times, lakes and reservoirs possess a large diversity of habitats caused by variations in temperature stratification, depth, and light penetration. This compartmentalization results in thriving communities of unique combinations of organisms that have a variety of effects on water quality. These effects range from the release of substances into the water column (e.g., internal loading of phosphorus during anoxia) to the removal of substances from the water column through processes such as sedimentation and bioaccumulation by higher organisms. The lacustrine environment amplifies the roles that many processes play in altering water quality, especially those related to sedimentation and those resulting from the development of permanent and
transient biological communities. The short residence time of water in streams means that reactions and processes have less time to occur, so their effects are often more subtle and more difficult to measure. Omission of the measurement of water quality parameters in lakes and reservoirs reduces the ability to detect the effects of biological processes.
The planned Cycle II study unit reduction to 42 still appears to maintain good coverage of systems in which lakes and reservoirs are important. Watersheds with lakes and reservoirs in a variety of hydrologic settings still exist in the reduced Cycle II coverage, for example, Connecticut, Housatonic, and Thames River Basins (CONN); Mobile River Basin (MOBL); Rio Grande Valley (RIOG); Sacramento River Basin (SACR); Tennessee River Basin (TENN); Trinity River Basin (TRIN); and Willamette Basin (WILL). In most of these planned study units, lakes and reservoirs have multipurpose roles, providing water for uses other than drinking water. No weight is given to the trophic condition of the lakes and reservoirs, however, so it is unknown how many or what percentage are eutrophic, oligotrophic, and so forth.
Streams and groundwaters that are sources to coastal waters and estuaries are still well represented relative to the original (planned) 60 study units. In fact, the reduction to 42 study units does not concede much in the way of the original coverage of watersheds draining to estuaries. Still present are the following study units, all of which have estuarine systems: Acadian-Ponchartrain Drainages (ACAD); Apalachicola-Chattahoochee-Flint River Basins (ACFB); Albemarle-Pamlico Drainages (ALBE); CONN; the Delaware River Basin (DELR); Hudson River Basin (HDSN); MOBL; Potomac River Basin and Delmarva Peninsula (PODL); SACR; and Santee River Basin and Coastal Drainages (SANT).
In addition, a case could be made that none of the proposed 42 study units includes a region of continuous or discontinuous permafrost, which would exert a strong control on the occurrence of groundwater. The lone study unit covering this regime, Cook Inlet Basin, is slated for elimination in Cycle II (Gilliom et al., 2000a). As noted earlier, this regime is not significant in terms of population and water use. However, its elimination will limit the program’s ability to comment on the effects of climate change.
Cycle II Opportunities
Despite the lack of detailed limnological and coastal water investigations in Cycle I, there are still opportunities for the Cycle II NAWQA program to assess some impacts of lakes, reservoirs, and coastal waters on water quality. The NAWQA program could compile the relative sedimentation efficiency or retention of various substances in lakes. (In this case, retention is defined as the inflow minus the outflow divided by the inflow [Dillon and Rigler, 1974].) Annual inflow and outflow loads could be used to calculate measures of retention as water moves through a lake or reservoir. For example, lakes typically retain 50
percent to 80 percent of their incoming phosphorus loads on an annual basis, and net retention is related to the trophic condition or level of biological activity (Janus, 1989). Comparison of the retention capabilities of various bodies could provide guidance as to whether it would be beneficial to examine processes in greater detail. Detailed studies could be used to target sites with low, medium, and high retention for further work, with the ultimate goal of understanding the mechanisms so that predictions, management strategies, and policy can be established.
This would be a useful contribution that might not require significant resources and might help to stimulate other studies, as well. There are also opportunities for collaboration with other agencies that are more involved with lakes, reservoirs, and coastal waters; these are discussed in more detail in Chapter 7.
SURFACE WATER AND GROUNDWATER
As discussed previously, surface water sampling under NAWQA focuses primarily on streams rather than lakes, reservoirs, and estuaries. Nonetheless, lakes, reservoirs, and wetlands are also found in many of the Cycle I and (planned) Cycle II study units. It should be noted that although NAWQA surface water sites include a wide variety of streams and land usage (see Chapter 1), they do not represent a statistically representative sample of stream sites (Miller and Wilber, 1999).
A variety of groundwater regimes are also monitored in the NAWQA program. The hydrologic setting approach considers geologic textures (e.g., permeabilities), and the SQA ensured that the major aquifer systems are represented in the Cycle II study units. The Cycle II study units do not lose much in terms of groundwater regions: only the permafrost (Alaska) and volcanic island (Hawaii) regimes are lost from Cycle I. One could argue that since these two areas have quite unique systems that are not represented elsewhere and do not include much of the nation in terms of population and drinking water use, their exclusion does not compromise the objectives of the program.
It is interesting to note that the planned Cycle II study units represent most of the different groundwater regions of the nation as defined by Heath (1982, 1984), with the exception of Alaska, Hawaii, Puerto Rico-Virgin Islands, and the Colorado Plateau-Wyoming Basin. Heath’s classification scheme is based upon five features:
-
system components and their arrangement;
-
nature of the water-bearing openings (primary or secondary origin);
-
mineral composition of the dominant aquifers (soluble or insoluble);
-
water storage and transmission characteristics of the dominant aquifers; and
-
nature and location of recharge and discharge areas.
Unlike the previously described hydrologic landscape scheme, Heath’s classification scheme does account for mineral composition of the dominant aquifers—a characteristic that can influence water quality and water chemistry. Heath’s scheme is more suited to groundwater studies and, unlike the hydrologic landscape scheme, avoids any hydroclimatologic criteria. Nonetheless, it provides a further indication that the Cycle II NAWQA study units are reasonably representative of the nation’s groundwater regimes.
Surface water regimes are well represented in terms of wetlands, lakes, reservoirs, and the variety of streams, although they are not all extensively sampled. Ephemeral streams, which occur in a number of study units, are not specifically addressed. This potential program limitation is discussed in more detail in Chapter 5.
CONCLUSIONS AND RECOMMENDATIONS
Cycle II of NAWQA will sample 42 study units as opposed to the 60 originally planned in Cycle I. Because of this necessary reduction, issues of representativeness and coverage are even more central to the Cycle II NAWQA program. Inferences to unsampled areas must be approached critically, since NAWQA does not use a probabilistic approach. Without a probabilistic approach, the greater number of study units is desirable. Assessing the coverage and representativeness of Cycle II is fundamental to fully address the crosscutting issues of extrapolation and aggregation raised in the committee’s statement of task. This assessment provides a base for continuing to address these issues in later chapters.
However, the committee feels that the budgetary-imposed reduction in the number of study units will still maintain good coverage of the nation’s water resources. The primary reason for maintaining good coverage and representativeness is the commendable and iterative use of hydrologic setting regions, coupled with the linear programming approach and expert judgment-based semiquantitative analyses to select the reduced number of study units. As a result, about 40 percent of the nation’s land area and 60 percent of its drinking water use will be represented in Cycle II. The 42 study units will account for about 80 percent of the nation’s agricultural land area and about 80 percent of the national pesticide and fertilizer use. Seventy-nine large metropolitan areas (>250,000 population) and approximately 76 percent of the nation’s MSAs occur in the 42 Cycle II study units.
Lakes, reservoirs, and coastal waters were specifically excluded from the original NAWQA design. Nevertheless, the NAWQA program is sampling certain lakes and reservoirs that provide drinking water and is also sampling some lake and reservoir sediment. For this reason, the Cycle II emphasis on lakes and reservoirs must continue to be limited to some aspects of status and trends of water quality but cannot address understanding. Estimates are being made of
chemical fluxes into certain estuaries that are extremely important to other agencies’ programs (e.g., the National Oceanic and Atmospheric Administration), although NAWQA does not specifically assess coastal waters themselves.
Streams and groundwater systems are adequately covered in Cycle II despite the elimination of the Cook Inlet Basin (Alaskan) and Oahu (Hawaiian) study units. One could argue that since these two areas have quite unique systems that are not represented elsewhere and do not include much of the nation in terms of population and drinking water use, their exclusion does not compromise the objectives of the program. However, eliminating the Cook Inlet Basin Study Unit does mean that none of the proposed 42 Cycle II study units includes a region of continuous or discontinuous permafrost, thus limiting the program’s ability to comment on the effects of climate change.
Certain other aspects of “representativeness” may be lacking in the Cycle II study units. For example, even though drinking water use is closely correlated with population (and thus urban areas), the use of a concept such as the urban intensity index in selecting Cycle II study units may have resulted in more “representative” (vis-à-vis urban areas) study units. In addition, it is not clear whether or not the planned Cycle II (reduced) group of study units may be representative of certain types of land use that can heavily impact water quality such as mining, the forest products industry, or the petrochemical industry, for example.
The following are the committee’s recommendations:
-
Maintain sampling in lakes and reservoirs that are important public water supplies, collaborating with other organizations where feasible.
-
Investigate the expanded use of the LPA-SQA methodology for other aspects of the NAWQA program (e.g., identifying sampling sites in the space-for-time studies; important reservoirs and lakes).
-
Clearly state the geographic extent (or other qualifiers) of any inferences or generalizations that NAWQA scientists may make. This is critical since the NAWQA title implies a study that has national statistical representativeness.
-
Clarify the representativeness of NAWQA Cycle II study units related to major sources of potential pollution, such as mining, forest products, petrochemical, and related industries.
REFERENCES
Callender, E., and P. C. Van Metre. 1997. Reservoir sediment cores show U.S. lead declines. Environmental Science and Technology 31(9):424A-428A.
Dillon, P. J., and F. H. Rigler. 1974. A test of a simple nutrient budget model predicting the phosphorus concentration in lake water. Journal of the Fisheries Research Board of Canada 31:1771-1778.
EPA (U.S. Environmental Protection Agency). 1991. Environmental Monitoring and Assessment Program Guide. EPA/620/R-93/012. Washington, D.C.: U.S. Environmental Protection Agency, Office of Research and Development.
EPA. 1997. Environmental Monitoring and Assessment (EMAP) Research Strategy. EPA/620/R-98/001. Washington, D.C.: U.S. Environmental Protection Agency, Office of Research and Development.
Gilliom, R. J., W. M. Alley, and M. E. Gurtz. 1995. Design of the National Water Quality Assessment Program—Occurrence and Distribution of Water-Quality Conditions. U.S. Geological Survey Circular 1112. Sacramento, Calif.: U.S. Geological Survey.
Gilliom, R. J., K. Bencala, W. Bryant, C. Couch, N. Dubrovsky, D. Helsel, I. James, W. Lapham, M. Sylvester, J. Stoner, W. Wilber, D. Wolock, and J. Zogorski. 2000a. Prioritization and Selection of Study Units for Cycle II of NAWQA. U.S. Geological Survey NAWQA Cycle II Implementation Team. Draft for internal review. Sacramento, Calif.: U.S. Geological Survey.
Gilliom, R. J., K. Bencala, W. Bryant, C. A. Couch, N. M. Dubrovsky, L. Franke, D. Helsel, I. James, W. W. Lapham, D. Mueller, J. Stoner, M. A. Sylvester, W. G. Wilber, D. M. Wolock, and J. Zogorski. 2000b. Study-Unit Design Guidelines for Cycle II of the National Water Quality Assessment (NAWQA). U.S. Geological Survey NAWQA Cycle II Implementation Team. Draft for internal review (11/22/2000). Sacramento, Calif.: U.S. Geological Survey.
Gilliom, R. J., P. A. Hamilton, and T. L. Miller. 2001. The National Water-Quality Assessment Program—Entering a New Decade of Investigations. U.S. Geological Survey Fact Sheet 071-01. Reston, Va.: U.S. Geological Survey. Available online at http://water.usgs.gov/pubs/FS/fs-071-041/pdf/fs07101.pdf.
Heath, R. C. 1982. Classification of ground-water systems of the United States. Ground Water 20(4):393-401.
Heath, R. C. 1984. Ground Water Regions of the United States. U.S. Geological Survey Water-Supply Paper 2242. Washington, D.C.: U.S. Government Printing Office.
Hirsch, R. M., W. M. Alley, and W. G. Wilber. 1988. Concepts for a National Water-Quality Assessment Program. U.S. Geological Survey Circular 1021. Denver, Colo.: U.S. Geological Survey.
Janus, L. L. 1989. Nutrient Residence Times in Relation to the Trophic Condition of Lakes. Ph.D. dissertation. McMaster University.
Kolpin, D. W., J. E. Barbash, and R. J. Gilliom. 1998. Occurrence of pesticides in shallow groundwater of the United States: Initial results from the national water-quality assessment program. Environmental Science and Technology 32:558-566.
Mallard, G. E., J. T. Armbruster, R. E. Broshears, E. J. Evenson, S. N. Luoma, P. J. Phillips, and K. R. Prince. 1999. Recommendations for Cycle II of the National Water Quality Assessment (NAWQA) Program. U.S. Geological Survey NAWQA Planning Team. U.S. Geological Survey Open-File Report 99-470. Reston, Va.: U.S. Geological Survey.
McMahon, G., and T. F. Cuffney. 2000. Quantifying urban intensity in drainage basins for assessing stream ecological conditions. Revised manuscript prepared for the Journal of the American Water Resources Association. Raleigh, N.C.: U.S. Geological Survey.
Messer, J. J., R. A. Linthurst, and W. S. Overton. 1991. An EPA program for monitoring ecological status and trends. Environmental Monitoring and Assessment 17:67-78.
Miller, T. L., and W. G. Wilber. 1999. Emerging drinking water contaminants: Overview and role of the National Water Quality Assessment Program. Pp. 33-42 in Identifying Future Drinking Water Contaminants. Washington, D.C.: National Academy Press.
NRC (National Research Council). 1990. A Review of the USGS National Water Quality Assessment Pilot Program. Washington, D.C.: National Academy Press.
The Nature Conservancy. 1998. Rivers of Life: Critical Watersheds for Protecting Freshwater Biodiversity. Arlington, Va.: The Nature Conservancy.
USCB (U.S. Census Bureau). 2001. About Metropolitan Areas. Available online at http://www.census.gov/population/www/estimates/aboutmetro.html.
USGS (U.S. Geological Survey). 1995. Design of the National Water-Quality Assessment Program: Occurrence and Distribution of Water-Quality Conditions. U.S. Geological Survey Circular 1112. Reston, Va.: U.S. Geological Survey.
USGS. 1999. The Quality of Our Nation’s Waters: Nutrients and Pesticides. U.S. Geological Survey Circular 1225. Reston, Va.: U.S. Geological Survey.
Winter, T. C. 1995. A landscape approach to identifying environments where ground water and surface water are closely interrelated. Pp. 139-144 in Charbeneau, R. J. (ed.) Groundwater Management, Proceedings of the International Groundwater Management Symposium, San Antonio, Texas. New York, N.Y.: American Society of Civil Engineers.
Winter, T. C. 2000. The vulnerability of wetlands to climate change: A hydrologic landscape perspective. Journal of the American Water Resources Association 36(2):305-311.
Winter, T. C. 2001. The concept of hydrologic landscapes. Journal of the American Water Resources Association 37(2):335-349.
Wolock, D. M., T. C. Winter, and G. McMahon. 2000. Delineation of hydrologic setting regions in the United States using geographic information system tools and multivariate statistical analyses. Unpublished manuscript. Denver, Colo.: U.S. Geological Survey.


