
CHAPTER 9
EFFECTS OF IMPROVED FUEL UTILIZATION ON DEMAND FOR FUELS FOR ELECTRICITY
(Chapter 9 was written by Elias Gyftopoulos and Thomas Widmer under the general supervision of the committee, which reviewed the work at several stages and suggested modifications that have been incorporated. While every committee member has not necessarily read and agreed to every detailed statement contained within, the committee believes that the material is of sufficient merit and relevance to be included in this report.)
INTRODUCTION
This chapter estimates the potential reduction of fuel for electricity in 1985 resulting from improved utilization of fuel in industrial, residential, and commercial end-uses. Because a fraction of the fuel used for electricity is coal, improved fuel utilization is a method complementary to other available methods for reducing sulfuric oxides and sulfates discharged into the atomosphere by electric powerplants. The chapter also evaluates the potential effect on fuel-demand for electricity resulting from some alternate methods of space heating.
PATTERNS OF FUEL SUPPLY AND DEMAND
This section presents statistical data for the U.S. patterns of fuel supply and demand (SRI 1972) in 1968 and projections for these patterns for 1985 (Dupree and West 1972). Although many projections have been made for 1985, for the purposes of this report, we will consider only the projections of the U.S. Department of the Interior (Dupree and West 1972).
In 1968, the amount of fuel consumed in the U.S. was about 57 quads (1 quad=1015 Btu) exclusive of about 3 quads used as feedstock materials. It was distributed among the fuel sources approximately as follows:
|
Petroleum products |
43.5% |
|
Coal |
23.0% |
|
Natural Gas |
32.0% |
|
Nuclear and hydrostatic head |
1.5% |
|
|
100% |
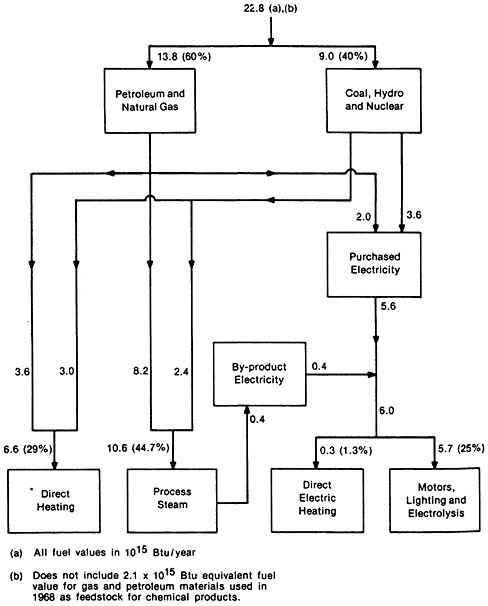
It was consumed in the major sectors of the economy in the amounts shown in the first and second columns of Table 9–1, namely 41 percent in the industrial sector, 34 percent in the residential and commercial sector, and 25 percent in the transportation sector. Some of the fuel was consumed in the form of electricity (columns 3 and 4, Table 9–1) which was primarily (92 percent) from utilities and to a lesser degree (8 percent) generated as by-product of industrial processes. The fuels used in electricity generation were 53.5 percent coal and 46.5 percent others.
The principal end-uses of fuels in industry in 1968 can be classified in the four major catagories shown at the bottom of Figure 9–1 among which the fuels are distributed as follows:
|
Direct combustion heating |
29.0% |
|
Process steam |
44.7% |
|
Direct electric heating |
1.3% |
|
Motors, lighting and electrolysis |
25.0% |
|
|
100% |
The principal end-uses of fuels in the residential and commercial sector are shown in Table 9–2. We see from the data in Figure 9–1 and Table 9–2 that process steam raising, space and process heating, and refrigeration and air conditioning in 1968 represented the major end-uses of fuels in sectors other than transportation. These processes consumed over 50 percent of the coal in 1968 as illustrated by the data in Table 9–3.
Several projections have been made about the fuel demand in 1985. For the purposes of this report, the projections of the U.S. Department of the Interior have been used (Dupree and West 1972). The projected demand in the major sectors is shown in the first column of Table 9–4 exclusive of fuels for feedstock materials. It will be distributed among the principal fuel sources approximately as follows:
|
Petroleum product |
42% |
|
Coal |
28% |
|
Natural Gas |
25% |
|
Others |
5% |
|
|
100% |
Some of the anticipated fuel demand will be supplied by utilities in the form of electricity as whown in the third column of Table 9–4. Comparing the data in Tables 9–4 and 9–1 we see that in 1985 the demand for all fuels is projected to be about two times as large, and for electricity about three times as large as those in 1968. The demand for fuels for electricity generation is projected to be as shown in Table 9–5. We see from this table that 37 percent of electricity will be generated from coal in
TABLE 9–2
Major End-Uses of Residential and Commercial Fuel in 1968 (excluding feedstock)
|
|
|
|
|
FUEL |
|
|
|
End-use |
|
Percentage of sector fuel % |
Electricity 1015 Btu(1) |
Petroleum and gas for direct firing 1015 Btu |
Coal for direct firing 1015 Btu |
Total 1015 Btu |
|
Heating |
Space |
56 |
0.48 |
9.84 |
0.57 |
10.89 |
|
Water |
13 |
0.9 |
1.55 |
NIL |
2.45 |
|
|
Refrigeration and air conditioning |
16 |
3.0 |
0.1 |
NIL |
3.1 |
|
|
Total |
85 |
4.38 |
11.49 |
0.57 |
16.44 |
|
|
(1) 1 kw-hr of electricity=10,000 Btu fuel in power plant. |
||||||
TABLE 9–3
Selected End-Uses of Coal in 1968(1)
|
End-use |
106 tons |
Percentage of coal consumption % |
|
|
Industrial |
Process steam |
87 |
18.5 |
|
Heating |
51 |
11 |
|
|
Residential and Commercial |
Heating |
49(2) |
10.5 |
|
Refrigeration and air-conditioning |
56(3) |
12 |
|
|
Total |
243 |
52 |
|
|
(1) Total consumption 13.1 quads or 470×106 tons at 28×106 Btu/ton. (2) Weighted average of direct coal usage and electricity produced by using 53.5% of fuels in the form of coal. (3) Based on 53.5% of electricity produced from coal. |
|||
1985 whereas 53.5 percent of electricity was generated from coal in 1968.
POTENTIAL FOR IMPROVED EFFECTIVENESS
Industrial Sector
As discussed in a report to the Energy Policy Project of the Ford Foundation (Gyftopoulos et al. 1974) many opportunities exist for the application of existing technology to the enormous fuel flow in industrial heating processes so as to yield large fuel savings. For example, the bulk of industrial fuel (about 45 percent in 1968) is consumed in raising process steam. Wherever process steam is required in reasonable amounts, an opportunity exists to produce electricity at small cost in fuel consumed. For example, if process steam at 200 psi or 382 F is generated by burning a hydrocarbon fuel, (CH2) n, over 60 percent of the available useful work of the fuel is lost. Much of this loss may be prevented by burning fuel in a gas turbine and using the turbine exhaust to generate steam (Figure 9–2a), by generating steam at a pressure higher than 200 psi and expanding the steam in a steam turbine to 200 psi at which pressure it is exhausted to process (Figure 9–2b), or by a combination of these two (Figure 9–2c). Figure 9–3 compares a combined system (Figure with the more widely used present practice of spearate generation of steam and electricity.)
Typical results of the electricity generated by the various topping systems are summarized in Table 9–6. The electricity produced, if considered as a by-product of the process heat, should be charged with the fuel consumption over and above that required when process steam is produced directly without the intervening
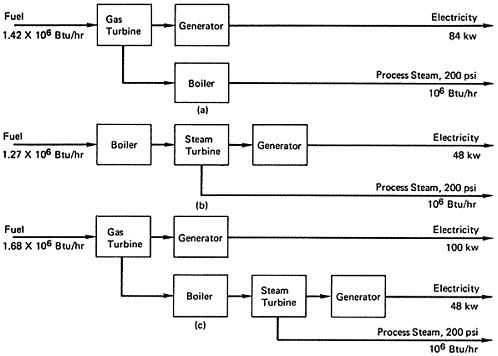
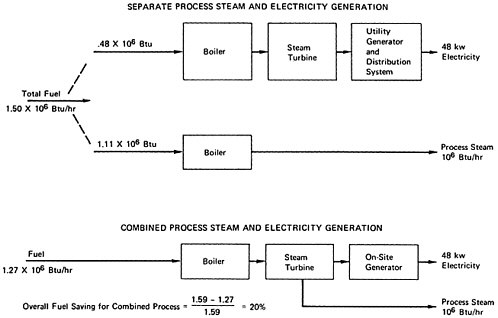
TABLE 9–6
Kilowatts of By-Product Electric Power for 106 Btu/hr of Steam Supplied to Industrial Process
|
|
Steam-Turbine Power, kw |
Gas-Turbine Power, kw |
Total Combined Gas and Steam-Turbine System Power. kw |
||
|
Process Steam Pressure, psi |
Alone |
Fed From Exhaust of Gas Turbine |
Alone |
Followed by a Steam Turbine |
|
|
50 |
77 |
|
84 |
|
|
|
200 |
49 |
48 |
84 |
100a |
148 |
|
400 |
34 |
|
84 |
|
|
|
a The power of the gas turbine is increased from 84 to 100 kw because some of the available useful work of the fuel necessary for the steam turbine is consumed in the gas turbine. |
|||||
topping system. On this basis, the fuel consumption for each of the cases shown in Table 9–6 is about 4230 Btu of available useful work for each kw-hr of electricity. These figures translate into an effectiveness of electricity generation of 0.8. The corresponding figure for the best central station powerplant is less than 0.4; that is, electricity is produced at less than half the fuel consumption of the best central-station powerplant.
Other fuel savings can be achieved through use of organic Rankine bottoming systems for recovery of availability from waste heat of industrial combustion processes. Wherever heat is rejected at temperatures 700 F or higher, an opportunity exists to produce electricity at no fuel consumption. A typical arrangement of a bottoming system combined with a radiant tube furnace is shown in Figure 9–4.
In 1968, industrial by-product electricity was 0.12×10¹² kw-hr reducing the amount of fuel consumed by utilities by about 1.2 quads (assuming that, on the average, 1 kw-hr generated by a utility consumes 10,000 Btu of fuel in the powerplant). It is estimated that the amount of incremental fuel consumed by industry for the generation of this by-product electricity is about 0.5 quads and, therefore, that a net fuel saving of 0.7 quads was achieved.
If all process steam could be raised in combination with electricity generation, then the upper limit for industrial by-product electricity generation in 1968 was 0.7×10¹² kw-hr and could be achieved for an incremental fuel consumption of 2.9 quads (Table 9–7). The fuel that would have been saved by the utilities would have been 7 quads and, therefore, the net fuel saving would have been 4.1 quads. In addition, it is estimated that bottoming systems could have generated 0.1×10¹² kw-hr at no fuel consumption in 1968 (Table 9–7).
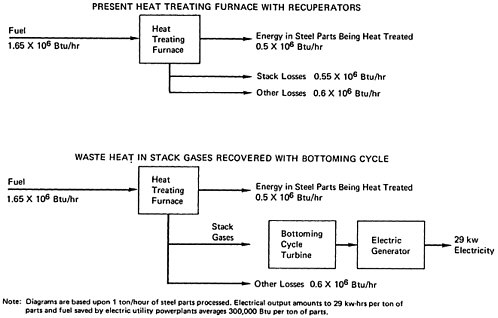
TABLE 9–7
Upper Limit for Industrial By-Product Electricity Generation in 1968
|
Industrial process |
Fuel saving method |
Total fuel consumption 1012 Btu |
By-product electricity 1012 kw-hr |
Incremental fuel required 1015 Btu |
|
Process-steam raising |
Topping cycles |
13.2 |
0.7 |
2.9 |
|
Direct combustion heating |
Bottoming cycles |
6.5 |
0.1 |
NIL |
|
Total |
19.7 |
0.8 |
2.9 |
|
The corresponding fuel that could have been saved by the utilities was 1 quad. In summary, in 1968 total fuel consumed by industry was 23 quads, and fuel saved by means of by-product electricity generation was 0.7 quads out of a maximum possible 5.1 quads.
In 1985, total fuel demand by industry is projected to be 41.9 quads. If by-product electricity generation continues at the 1968 rate, the fuel saving will be:
(0.7×10¹⁵) (41.9×10¹⁵ 23×1015)=127.×1015 Btu out of a possible maximum of
(5.1×10¹⁵) (41.9×10¹⁵ 23×1015)=9.3×10¹⁵ Btu It follows that maximum by-product electricity generation could result in additional fuel saving of 8 quads in 1985.
Decrease of fuel for electricity can also be brought about through improved effectiveness of industrial processes. An illustration of this decrease is provided by the Hall process for reduction of A1203 to aluminum metal. In this process, electrolysis is carried out in carbonlined boxes into which carbon rods project. An electrical potential is applied so that the box serves as the cathode and the rods as the anode. Upon electrolysis the alumina is decomposed; the aluminum metal is deposited at the cathode in a molten condition and the oxygen is deposited at the anode.
Considerable variations in the electricity requirements for primary aluminum production exist from plant to plant; typical numbers of production cells range from 13,600 to 16,400 kw-hr per ton of aluminum. Primary aluminum production in the U.S. was 3.25×10⁶ tons in 1968. Assuming an average electrical demand of 15,000 kw-hr per ton, the electrical consumption by the aluminum industry amounted to 4.9×10¹⁰ kw-hr in 1968, or about 3.7 percent of total U.S. electricity needs.
Analysis of the Hall cell voltage shows that only 1.6 to 1.8 volts, out of almost 5 volts drop across the cell, is required for the basic electrolysis process. The remainder is necessary as a result of voltage drops (resistive losses) across various electrical resistances in the cell circuit. Because the electrolysis voltage is relatively independent of current through the cell, aluminum production is approximately proportional to the current. The parasitic resistive losses, on the other hand, are proportional to the square of the current. It follows that the fraction of electricity effectively utilized for the electrolytic reduction of A1203, increases as the cell current is decreased. For example, decreasing the current of a typical cell from 105,000 amps to 82,000 amps would decrease electricity consumption per ton of aluminum by 16 percent. Although such current decrease would decrease production per cell by 22 percent total production can be maintained at the desired level by installing more cells, namely at the expense of higher capital costs. In general, the optimum cell current density decreases as power costs increase. At the lower current electrical consumption is only about 12,500 kw-hr per ton of aluminum (Gyftopoulos et al. 1974). Assuming that primary aluminum production will be 10×106 tons in 1985, the electricity saving would be 2.5×10¹⁰ kw-hr and, therefore, the fuel saving 0.25 quads.
Residential and Commercial Sector
An opportunity exists for reduced electricity demand for refrigeration and air conditioning equipment in the residential and commercial sector. In 1968, refrigeration and air conditioning consumed 20.7 percent of all U.S. electricity and 5.4 percent of all fuels. If the same
percentage is valid for 1985, the fuel demand for this end-use would be 5.9 quads. The opportunity exists for application of existing technology to improve the effectiveness of refrigeration equipment. For example, present central air-conditioning systems for homes have a performance index of 8.5 Btu per watt-hr. This can be readily increased to 12 Btu per watt-hr by means of well-known heat-transfer methods. It is estimated that a 30 percent average improvement in performance of all refrigeration equipment is reasonable for 1985. This improvement would result in a fuel saving of 1.8 quads.
Another large factor in electricity consumption is lighting for commercial and public buildings. Recent FEA guidelines for lighting and thermal operations indicate a potential saving of 43 percent in this end-use (FEA). This would represent 133×109 kw-hr or 1.3 quad fuel saving by electric powerplants in 1985.
POTENTIAL FOR SHIFTING TO ALTERNATE SOURCES FOR SPACE HEATING
This section presents the limiting effects of using alternate methods of space heating.
In 1968, space heating consumed 10.89 quads or 19 percent of all fuels of which 0.57 quads was in the form of coal. If the same percentage is valid for 1985, the fuel demand for space heating will be 20.8 quads (0.19×10¹⁵ Btu). In addition, it is estimated that electrical and coal space heating will gradually increase from 0.48 and 0.57 quads in 1968 to 1.1 and 1 quads in 1985, respectively.
In direct-firing space heating, only a fraction of the heating value of the fuels is used in raising the space temperature, the remaining being lost up the stacks of the burners. The fraction that is used
varies widely depending on the type and maintenance of the burner. For our purposes, we will assume that 70 percent of the heating value of the fuels contributes to space heating.
If all the space heating needs in 1985 were to be switched either to pure resistance electric heating, electric heat pump heating, or coal gas heating then the fuel demand would be modified as follows:
Pure resistance heating
|
Increase in electrical load |
=0.7(20.8−1.1)1015 =13.8 quads =4.04×10¹² kw-hr |
|
Increase in fuel demand |
=40.4−19.7=20.7 quads |
In the extreme, this increase might result in the following distribution between fuels:
Heat pump heating
Assuming a national average coefficient of performance (COP) for heat pumps of 1.8, then
|
Increase in electrical load |
=4.04×10¹²/1.8 =2.25×10¹² kw-hr |
|
Increase in fuel demand |
=22.5−19.7 =2.8 quads |
For the maximum shift to coal, this increase would result in the following distribution between fuels:
Another possible means of shifting home heating load from oil and natural gas to coal-based energy is the alternative of gas
from coal gasifications; assuming a gasification and distribution efficiency of 0.62, demand would be modified as follows:

EVALUATION OF CAPITAL COST FACTORS
Costs Related to Improved Effectiveness
The evaluation of the relative benefits of various fuel saving methods necessitates consideration of both capital requirements and fuel pricing practices.
From an aggregate capital availability point of view, it is important to compare the capital for supplying additional fuel with that for saving an equal amount of fuel through improved effectiveness measures.
Some estimates for capital required to supply various forms of energy are listed in Table 9–8. All figures are normalized to the equivalent of one barrel of oil per day.
For an industrial installation needing 1 megawatt of electricity, if this electricity were to be provided by a coal-fired powerplant, with a load factor of 0.7, the capital required would be:
|
Coal-fired powerplant (AGA 1974) |
$ 456,000 |
|
Distribution |
180,000a |
|
Coal supply (28 barrels of oil per day equivalent annual average) |
48,000 |
|
Total |
$ 684,000 |
|
(a Note: Capital investment in distribution system for industrial customers assumed to be $13,000 per 1760 kw-hr of electricity per day which is energetically equivalent to 1 barrel of oil per day; comparable figure used for residential customers in Table 9–8 is $20,500.) |
|
TABLE 9–8
Approximate Capital Costs for Supplying the Fuel Equivalent of One Barrel of Oil Per Day (6×10⁶ Btu/day) in Various Forms
|
1. |
GAS FROM COAL GASIFICATION |
||
|
|
|
Coal production (Eastern deep mine) |
$ 2,800 (a) |
|
Gasification plant (AGA 1974) |
10,000 |
||
|
Transmission and distribution system |
7,400 (b) |
||
|
|
$20,200 |
||
|
(a) |
At 0.62 plant and distribution efficiency |
||
|
(b) |
Assumes $1.35 per million Btu ($8.10 per barrel of oil equivalent) as the average cost of transmission and distribution to residential customers in the Eastern United States. Fifty percent of this figure is assumed to derive from capital charges computed at 20 percent annually, namely |
||
|
2. |
OIL FROM NEW DOMESTIC SOURCE |
||
|
|
|
Production (off-shore) (7) |
$5,000–$8,000 (c)(d) |
|
Refining |
1,000 |
||
|
Transportation and distribution |
3,000 (e) |
||
|
|
$9,000–$12,000 |
||
|
(c) |
Includes bonuses paid on leases |
||
|
(d) |
Estimates for shale oil, synthetic crude from coal, or tertiary recovered oil vary from $10,000 to $20,000 per barrel per day. |
||
|
(e) |
For Alaskan oil, the pipe line alone costs $5,000 per barrel per day. |
||
|
3. |
ELECTRICITY FROM COAL-FIRED POWERPLANT |
||
|
|
|
Coal production (Eastern deep mine) |
$ 5,500 (f) |
|
Electric plant (AGA 1974) |
36,500 (g) |
||
|
Transmission and distribution system |
20,500 (h) |
||
|
|
$62,500 |
||
|
(f) |
Electricity generated at 0.34 plant and distribution efficiency. |
||
|
(g) |
Estimate based on average capital cost $456/Kw for new coal-fired generating plants greater than 1,300 Mw capacity that could be on-stream by 1981, and load factor 1.0. |
||
|
(h) |
Assumes 1.28¢ per kw-hr as average cost of distribution to residential customers, with 50 percent of this figure attributed to capital costs, as in note (b) above. |
||
On the other hand, suppose that the industrial installation has a potential application for a 1.0 megawatt bottoming-cycle engine generator to recover waste heat from a large continuous metal processing furnace with an annual utilization factor of 0.7. At $400 per kw, the capital required would be $400,000 and the fuel consumed would be zero. To this may be added $62,000 for 50 percent emergency supply diesel generators and, therefore, the capital investment would be $462,000.
From these results we see that the investment for incremental electricity from a coal-fired powerplant would require about 48 percent more than that for the on-site bottoming-cycle system. For an oil-fired powerplant, the advantage of the bottoming cycle is even greater.
On the other hand, whether the advantage of the fuel-saving over the increased fuel supply method will be evident to the industrial firm depends on fuel pricing policies. If the price of fuel reflects the true cost of new fuel supplies then the bottoming cycle is advantageous. If the price of fuel is based on averages over old and new sources then the bottoming cycle and, therefore, the advantage of the fuel-saving method may not be as decisive as the preceding capital requirement estimates indicate.
To illustrate this point, we shall assume 2.5 cents per kw-hr as being representative of the price paid by an industrial customer for electricity. By assuming a ten-year sum-of-year- digit depreciated life time for the bottoming cycle generator, a 0.3 cent per kw-hr operating and maintenance cost and a 70 percent duty cycle, we obtain the following
break-even capital costs for on-site power generation with bottoming cycle system:
|
Required after tax (52%) return on investment |
Break-even capital cost for bottoming cycle system |
|
12% |
546 $/kw |
|
15% |
469 $/kw |
We see that the bottoming cycle capital requirement of 462$/kw is comparable with the break-even cost determined from the price of electricity of about 2.5 cents per kw-hr. It follows that for the assumed price of electricity, the user most likely will decide to buy electricity rather than install a bottoming-cycle system. The reason for such a decision is, of course, that the assumed price of electricity does not reflect the true cost of new supplies.
Costs of Fuel Shifting for Space Heating
The demand for fuel for residential and commercial space heating could be shifted from oil and natural gas to either electricity generated from coal or to alternate sources such gas produced from coal.
Table 9–9 lists estimates of capital requirements for three alternate methods of space heating, electric resistance, electric heat pump, and gas from coal, all of which use coal as the primary fuel. The calulations are based on residential heating units requiring 150×106 Btu per year, or 0.07 equivalent barrels of oil per day.
We see from this table that electric heat pumps offer the lowest total fuel consumption of the three cases. Gas from coal gasification on the other hand, affords a significant saving in capital investment over either form of electrical space heating. It should be noted that the investment advantage for the gas from coal
TABLE 9–9
Capital Investment of Alternate Home Heating Methods Using Coal as Primary Fuel
|
|
Home heating method |
||
|
|
Electric resistance |
Electric heat pump |
Gas from coal gasification |
|
Plant efficiency: |
|
|
|
|
|
0.34 |
0.34 |
0.62 |
|
Home furnace yield: |
|
|
|
|
|
1.0 |
1.8 |
0.7 |
|
Barrel per day equivalent coal consumed per equivalent barrel of oil per day of heat supplied to home |
2.94 |
1.63 |
2.30 |
|
Capital investment per equivalent barrel of oil per day of heat supplied to home |
|
|
|
|
Supply planta |
$ 96,100 |
$ 53,400 |
$ 44,400 |
|
Home heating plantb |
7,200 |
28,600 |
14,300 |
|
Total |
$ 103,300 |
$ 81,000 |
$ 58,700 |
|
a Load factor for all plants 0.65. b Based on home heating unit costs of $500, $2,000 add $1,000 per home from baseboard resistance, heat pump, and gas-combustion furnaces, respectively. |
|||
gasification approach will be increased even further when adjustment is made for the high percentage of existing gas home-furnaces which would have to be replaced if either electric heating concept were adopted.
SUMMARY OF DEMAND MODIFICATION ALTERNATIVES
The limiting incremental values of effects of demand modifications established in the preceding sections can be allocated to coal. The results are summarized in Tables 9–10 and 9–11 in million tons of coal per year on the basis of 1 ton of coal =24×106 Btu.
Only a fraction of these effects can be achieved, however, by 1985 partly because some industrial plants may be too small in size to justify a modification, partly because of fuel-pricing policies that do not make changes attractive, and partly because of institutional constraints. For example, a plant may need process steam in amounts which do not justify economically the installation of a topping system, or the price of electricity may be low enough so that the investment for an on-site system cannot be recovered in sufficiently short time. Finally, there may be state or local utility regulations which prohibit the sale of surplus electricity by an industrial plant to a utility.
EFFECTIVENESS OF FUEL UTILIZATION IN A PROCESS
In attempting to evaluate the opportunity for fuel saving in a particular process, we need to know the minimum fuel requirement for the process so that we can compare it with the fuel consumed under current practice and obtain a measure of the effectiveness of that practice. The minimum fuel requirement can be evaluated by means of the thermodynamic concept of
TABLE 9–10
Maximum Potential Shift in Coal Requirements Resulting from Selected Improvements in Electrical Effectiveness at Point of Use. (1 quad=24×106 tons of coal)
|
Demand modification |
Maximum incremental coal consumption (tons/year from 1985 baseline USDI forecast) |
|
On-site generation of by-product electricity in industrial processes |
−333×106 |
|
Re-optimization of Aluminum electrolysis process to lower current density(1) |
−10×106 |
|
Improved performance residential & commercial refrigeration air conditioning equipment |
−75×106 |
|
Relamping of commercial & public buildings to FEA lighting standard |
−54×106 |
|
(1) Aluminum electrolysis, which accounts for about 7.5% of industrial electricity, is shown as an example of improved industrial process effectiveness. In order to determine potential savings for improvements in other electrical-intensive processes, it will be necessary to perform a detailed study of each individual industry. |
|
TABLE 9–11
Maximum Potential Shift in Coal Requirements Resulting from Shifting All Residential and Commercial Space to Methods Based on Coal as Primary Source
|
Demand modification |
Maximum incremental coal consumptiona (tons/year from 1985 baseline USDI forecast) |
|
Shift all space heating to electric resistance |
+1640×106 |
|
Shift all space heating to electric heat pumps |
+896×106 |
|
Shift all space heating to gas from coal gasification |
+ ×106 |
|
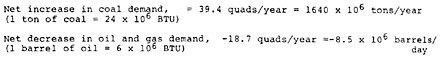
a The corresponding reduction in oil and natural gas consumption is about 9 million barrels of oil equivalent. |
|
available useful work. Readers unfamiliar with the foundations of thermodynamics and the concept of available useful work might consult the article on “Principles of Thermodynamics” in the 1974 Edition of the Encyclopedia Britannica
In a report prepared for the Energy Policy Project of the Ford Foundation (Gyftopoulos et al. 1974) the concept of available useful work was used to evaluate the effectiveness of fuel utilization in five energy-intensive industries. Table 9–12 lists the industries, outputs, specific fuel consumptions, and total fuel consumed in 1968. In addition, the table lists the minimum specific fuel requirements, and minimum total fuel requirements for these industries. It is seen from these data that the average fuel effectiveness for the five industries under consideration is 1.17 ×10¹⁵/9.2×1015=13 percent. The average fuel effectiveness of 13 percent should not be confused with the efficiency value of 70 percent or higher reported in the literature. The latter figure represents the average fraction of the heating value of the fuels that are used in industrial processes.
The large margins that exist between current practives and minimum theoretical requirements indicate the potential which is available for major long-term reductions in fuel consumption through basic process modifications.
TABLE 9–12
1968 Product Output and Fuel Consumption for Selected U.S. Industries
|
Industry |
Industry Output (tons/yr) |
Specific Fuel Consumption (Btu/ton) |
Total Fuel Consumption (Btu/yr) |
Percentage of Industrial Sector Fuel |
Theoretical Minimum Specific Fuel Consumption Based Upon Thermodynamic Availability Analysis (Btu/ton) |
Minimum Total Fuel Requirement (Btu yr.) |
|
Iron and Steel |
131×106 |
26.5×10⁶ |
3.47×10¹⁵ |
15.2 |
6.0×10⁶ |
0.79×10¹⁵ |
|
Petroleum Refining |
590×106 |
4.4×10⁶ |
2.6×10¹⁵ |
11.4 |
0.4×10⁶ |
0.24×10¹⁵ |
|
Paper and Paperboard |
50×106 |
39×106 |
1.95×10¹⁵ |
5.4 |
bGreater than −0.2×10⁶ smaller than +0.1×10⁶ |
0.00 |
|
Primary Aluminum |
3.25×10⁶ |
190×106 |
0.62×10¹⁵ |
2.8 |
25.2×10⁶ |
0.08×10¹⁵ |
|
Cement |
72×106 |
7.9×10⁶ |
0.57×10¹⁵ |
2.5 |
0.8×10⁶ |
0.06×10¹⁵ |
|
|
|
TOTAL |
9.2×10¹⁵ |
38% |
- |
1.17×10¹⁵ |
|
a Includes heating value of waste products (bark and spent pulp liquor). b Negative value means that no fuel is required. |
||||||
LITERATURE CITED
American Gas Association (1974) Gas Supply Review, Gas Supply Committee. Volume 3, Number 2, November.
Dupree, W.G., Jr. and J.A.West (1972) U.S. energy through the year 2000, U.S. Department of the Interior.
Federal Energy Administration, Lighting and thermal operations, energy management action program for commercial, public, industrial buildings—Guidelines. U.S. Government Printing Office, Washington D.C.
Gyftopoulos, E.P., L.J.Lazaridis, and T.F.Widmer (1974) Potential fuel effectiveness in industry, Ballinger Publishing Company, Cambridge, Massachusetts, Report to the Energy Policy Project of the Ford Foundation, November.
Morgan, D.T. and J.P.Davis (1974) High efficiency decentralized electrical power generation utilizing diesel engines coupled with organic working fluid rankine-cycle engines operating on diesel reject heat. Prepared for the National Science Foundation, Washington, D.C. NSF Grant No. GI-40774, November.
SRI (1972) Patterns of energy consumption in the United States, U.S. Government Printing Office, Stock Number 4106–0034, Washington, D.C.


