
Appendix F
Assessment of the Probabilistic Model for Estimating Metal Loading and Effectiveness of Remedial Action
Edmund A. C. Crouch, Ph.D.
Senior Scientist
Cambridge Environmental, Inc.
Cambridge, Massachusetts
The Probabilistic Analysis of Post-Remediation Metal Loading Technical Memorandum (Revision 1) (URS Greiner, Inc. and CH2M Hill 2001a) (PTM) describes its purpose very well:
The probabilistic analysis is a risk management tool that can help quantify the certainty, conditional on available information and its interpretation, that a proposed remedy would meet cleanup goals. (PTM p. 1-1)
The purpose of the probabilistic analysis is to help support informed risk management decision-making. It does so by helping to quantify the certainty that a remedial alternative or a proposed remedy could actually meet cleanup goals…. (PTM, p. 1-3)
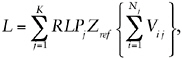
It formulates an approach intended to meet these objectives. The formulation can be readily summarized,1 and this summary is presented first without any comment on its correctness or applicability. It is assumed that dissolved metal loading to the Coeur d’Alene River (e.g., in pounds/day, the
unit used throughout the PTM) at some specific location on the river, can be calculated as follows:
(1.1)
where2
L = (preremedial) metal loading in the Coeur d’Alene River at the specific location examined (pounds/day);
Zref = “loading potential” per unit volume (pounds/day/cubic yard) for the reference source type for the location on the river under examination (averaged over all sources of that type affecting that location);3
RLPj = “relative loading potential” for the location on the river under examination for a contamination source of type j, averaged over the sources of that type that affect the river location under examination (for the reference source type, the RLP is unity);
Vij = volume (cubic yards) of a source of type j with index i that affects the river at the location examined, all such sources being indexed;
K = number of different types of sources that affect the river at the location examined; and
Nj = number of sources of type j that affect the river at the location examined.
The contamination sources are generally volumes of contaminated soil, sediment, and rock, categorized by type. The source types used in the PTM (pp. 2-18 to 2-19), for the upper basin, conceptual site model (CSM) Units 1 and 2, are adits (these are treated specially, by using measured flows and concentrations and deriving an effective volume for them), tailings-impacted floodplain sediments, unimpounded tailings piles, impounded tailings piles at inactive facilities, impounded tailings piles at active facilities, waste rock piles in floodplains, waste rock piles in upland areas, and deeper impacted floodplain sediments (unremediated sources).
The reference source type (with RLP = 1) is taken to be tailings-affected floodplain sediments.
For the lower basin, CSM Unit 3, the source types used are riverbed sediments, banks and levees, wetland sediments, lake sediments, other floodplain sediments, Cataldo/Mission Flats dredge spoils, and a composite of all the source types (unremediated sources).
At some time t after remediation (the time of which defines t = 0), the dissolved metal loading F(t) at the same specific location is written as
(1.2)
where R(t) is a remediation factor at time t.4 R(t) is a moving 1-year time average (it is defined in the PTM, p. B-4, as representing “one-year averages over each water-year”). The immediate effect of remedial action on each contamination source is supposed to be a reduction in the relative loading potential of that source by a “remedial action effectiveness” factor Rij for the source type j and with index i, so that immediately after remediation the remediation factor is given by
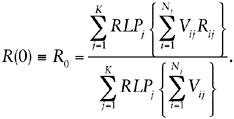
(1.3)
For future times, R(t) is written as
R(t) = R0 exp(–βt),
(1.4)
where the decay rate β is estimated as the ratio of the preremedial “total effective mass” of metal (TEM) available for leaching and the average preremedial rate W at which metal is removed via the river, or as the ratio of the same quantities immediately postremediation5
(1.5)
where
(1.6)
and is 1 year, while the total effective mass of metal (TEM′ preremediation and TEM″ postremediation) available for leaching are assumed to be computable as
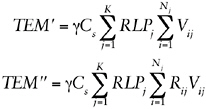
(1.7)
where γ = volumetric unit weight of the reference source type, and Cs = volumetric average metal concentration of the reference source type.
Finally, the “load ratio”, Lr(t), is defined by
(1.8)
where CL, the “loading capacity,” is the product of ambient water-quality criterion (AWQC) and river flow rate Q:
(1.9)
The AWQC is a concentration of the dissolved metal in water and is defined by regulation at a value that is supposed to be protective of fresh-water life. For many metals (and zinc in particular), the AWQC increases with the hardness of the water, and the hardness of the water in the Coeur d’Alene River varies inversely with the flow rate. The AWQC represents the target for most ecological cleanup efforts, in particular for the cleanup of the Coeur d’Alene River, so that a load ratio of unity represents the ultimate cleanup target.
The PTM evaluates estimates only for dissolved zinc, claiming that results for other dissolved metals except lead could be obtained approximately from those of zinc by using suitable scaling factors (PTM, p. 1-8, section 1.4).
The above summary makes no mention of uncertainties in measurement of the various quantities discussed (for many of the quantities), of
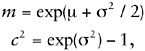
their variability due to their unpredictable fluctuations with time, or of the correlations between such uncertainties or variabilities. The PTM attempts to account probabilistically for the uncertainties and variabilities. It does this analytically by assuming wherever necessary that uncertainty and variability distributions are lognormal and matching means and coefficients of variation (equivalently, standard deviations). That is, uncertain or variable quantities included in equations are assumed to have that uncertainty or variability represented by lognormal distributions, and the mean and coefficient of variation for the quantity on the left-hand side of the equation are obtained as the mean and coefficient of variation of the expression on the right-hand side of the equation (even if, strictly speaking, the combination of uncertainty distributions on the right-hand side of the equation does not result in a lognormal distribution).
DEFICIENCIES OF THE PTM
The PTM suffers from multiple invalidating deficiencies in its formulation and application. The formulation in the PTM goes into considerably more detail (PTM, appendix B) than indicated by the summary given above (which itself contains invalidating deficiencies); however, most of that detail is trivial, in the sense that it is just application to specific cases of the general methodology given in PTM appendix A for combining lognormal distributions. Addition of that detail is unnecessary and substantially reduces the comprehensibility of the PTM. Moreover, there are several instances (described below) where that detail is incorrect either conceptually (through confusion of uncertainty and time variation) or because the equations are incorrect (apparently because of typographical errors in most cases). I did not examine the implementation of the methodology described in the PTM (in the form of the PAT1 and PAT2 spreadsheets;6 PTM, p. 3-1) in sufficient detail to comment on that implementation, because of the deficiencies identified here.
It is claimed that: “The analysis results are estimates: engineering approximations based on interpretation and synthesis of information available at this time” (PTM, p. 1-5).
It is further claimed that: “The estimates are objective within common standards of engineering practice and applied science. They are scientifically sound and technically defensible within the limits of available information and adequately support informed risk management decisions” (PTM, p. 1-5) (the same claims are made in PTM, p. C-1).
Unfortunately, however, simply stating such claims does not make them true; in this case, they are not true. The analysis presented in the PTM lacks any scientific basis. Four reasons for this conclusion are summarized here: the dependence of the entire analysis on an untested hypothesis; the incorrect treatment of time variation; the use of undocumented, un-validated, and nonreproducible values for parameter values; and incorrect handling of certain probabilistic aspects of the analysis.
THE BASIS OF THE ANALYSIS IS AN UNTESTED HYPOTHESIS
The analysis in the PTM is based entirely on an untested hypothesis for which no theoretical or experimental evidence is presented. The PTM is explicit in admitting that its entire basis is a hypothesis; for example:
The relative load reduction is hypothesized proportional on average to the volume remediated for a given source type and alternative-specific remedial action. This hypothesis generalizes the practical approximation that the load reduction from a given source and remedial action is proportional to the volume remediated. (PTM, p. 1-14, italics in original)
It was hypothesized that post-remediation loading reductions for a given source type and remedial action (e.g., removal and placement of impacted sediments into a repository) were proportional, on average, to the volume remediated. (PTM, p. 2-29, italics in original)
But there is no attempt to justify the use of this hypothesis in the context of remedial actions either by reference to any experimental data or by presentation of plausible theoretical ideas. The statement that the hypothesis “generalizes the practical approximation” begs the question, because there is no demonstration of any such practical approximation in the PTM. An attempt is made (PTM section B.2.2, pp. B-20 to B-25) to justify the hypothesis as the “most credible,” but that attempt is irrelevant to the hypothesis stated; it addresses a different problem entirely—namely, the time rate of change of loading (which is addressed separately below). The failure to present any evidence for the hypothesis would not necessarily render the claims of the PTM incorrect if the hypothesis were in fact correct or a reasonable approximation. Some theoretical ideas suggest that it is not correct;7 but the lack of any leaching experiments on any of the materials in
the basin, the lack of concentration measurements in groundwater, and the very limited information on groundwater flow deny the information needed to evaluate the hypothesis or propose any more correct one on which to build a plausible analysis.
THE EVALUATION OF TIME IS INCORRECT
Even if the principal hypothesis used in the PTM was correct and the calculation of the immediate postremediation situation was adequately approximated, the treatment of time variation following remediation is incorrect. This treatment is essentially captured in the summary above by Equations (1.4), (1.5), and (1.7). The PTM claims (PTM, section B.2.2.2, starting at p. B-16) that the decay rate β is the same for all times and all remedial scenarios.
Unfortunately, the analysis leading the PTM to such conclusions is incorrect in two ways. (1) The “relative loading potential” (RLP) introduced by the PTM is defined to account for the rate of leaching of metal from source material; it does not in any way represent the total mass of metal ultimately available for leaching or erosion. Even the original definition of (Equation 1.5) thus does not define a decay rate for the available leachable metal. (2) The PTM analysis that purports to show that there exists a constant decay rate, β, is based on (at least) two incorrect assumptions and is itself incorrect.
The Time Scale for Loading or Concentrations Varies with Remedial Option
The first of these problems is easy to detect. The PTM analysis purports to show that the exponential decay rate for annual average loading or concentration is the same for all remedial actions (including no action). Assuming for arguments sake that the loading and concentration do decrease exponentially, it is obvious that the decay rate cannot be the same for different remedial scenarios. Only one remedial option (chemical fixation) has the potential to substantially change the total amount of metal that ultimately could leach or erode down the Coeur d’Alene River (all other options simply reduce the rate of leaching or erosion). Because the expo-
|
|
last (groundwater flow). If all sources were the same depth, the first three might be considered proportional to source volume, but the fourth would not. However, under different physical conditions these mechanisms would produce loads that differed in their relationship to source volume. Even if the physical conditions were just right to produce loading proportional to source volume, it does not follow that loading reduction is proportional to the reduction in source volume due to remediation, because remedial action may alter the relevant physical conditions. |
nential decay rate is just the ratio of the rate of transport down the river to the total mass ultimately available for leaching, reducing the rate of transport (the aim of the remedial actions) necessarily will decrease the decay rate (unless the only remedy applied is chemical fixation). All the available metal ultimately will leach or erode into the river and be carried downstream; if the rate of leaching and erosion is reduced, the time scale over which leaching or erosion occurs is correspondingly increased.
To explain where the fallacy arises in the PTM analysis, recall that the “relative loading potential” (RLP) is introduced (PTM pp. 2-17 to 2-18) in an attempt to take account of the differences between various source materials in the combination of metal concentration and mass, its relative mobility, and its exposure to leaching or erosion. Conceptually, therefore, the RLP is not proportional to metal mass available for leaching or erosion (that is, conceptually at least, two source types with substantially different average metal masses per unit volume available for leaching or erosion may have identical RLP values, and two source types with substantially different RLP values may have identical average metal masses per unit volume available for leaching or erosion; in practice, as discussed below, it is unclear how the RLP values were derived). For example, the RLP for waste rock piles in upland areas may be very low compared with tailings-affected sediments (the PTM, p. C-6, gives an estimate value of 0.001 to 0.005 for upland waste rock, compared with 1 for the reference source, tailings-affected sediments), but that tells us nothing about the relative mass per unit volume ultimately available for leaching in these two source types.
The preremedial total effective mass (TEM) introduced in the PTM (Equation 1.7 and PTM p. B-15, equation 8) is thus conceptually related to loading, and the same goes for the postremedial total effective mass (TEM), so that in concept it may be adequate to write the loading as proportional to this total effective mass; that is (PTM, p. B-16, equation 1, but see footnote 5)
(1.10)
However, even if the preremediation total effective mass (TEM′) were somehow to represent the total mass available for leaching or erosion (as could happen in principle if the metal in all sources were present at the same concentration, equally mobile, and equally exposed to leaching or erosion), the same would not be true of the postremedial total effective mass (TEM″), because this is conceptually obtained by incorporating the remedial action effectiveness factors Rij. These factors measure the extent to which remedial actions reduce the loading potential—that is, the rate of leaching or erosion; in principle, they have nothing to do with changing the mass that is
available for leaching or erosion. Only one of the potential remedial actions (chemical fixation) is likely to have any substantial effect on the total mass ultimately available for leaching or erosion.
It is therefore incorrect to write (PTM, p. B-16, equation 2)
(1.11)
The right-hand side represents the loss of metal mass down the river, but the left-hand side bears no relation to the rate of change in total metal mass ultimately available for transport down the river. Equation 1.11 therefore is not a mass balance equation, and all the arguments about mass balance in the PTM (e.g., p. B-18) fail for the same reason—that TEM′ and TEM″, despite the name given to them, have nothing to do with the total metal mass available for leaching or erosion. As a consequence of this failure, the PTM fails to appreciate that the time scale for leaching and erosion will change under different remedial options, and the entire evaluation of the future course of concentrations and loadings is completely incorrect (and even for the unremediated case, the “decay rate” obtained is incorrect).
The Timecourse of Loading or Concentration Is Not Exponential
Another error in the PTM analysis occurs in the assumption that the time course of loading or concentration will be exponential either before or after remediation. There is a long argument given (PTM, pp. B-20 to B-25) that purports to demonstrate that relationships of the form
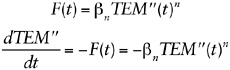
(1.12)
(PTM, p. B-20, equations 12 and 13), with (implicitly) constant n, are sufficiently general to be all that must be examined, and that the value n = 1 is the “most credible” (PTM, p. B-24).8
However, this argument is based on multiple fallacies, among which are the following:
A Belief in the Generality of Equations 1.12
It is stated that “By varying exponent n, the relationship F(t) = βnTEM″(t)n could allow loading to be any hypothetical yet plausible continuous function of total effective mass” (PTM, p. B-20), and then, after allowing the coefficient βn to be essentially an arbitrary function of time,9 “it would tentatively appear that F(t) = βnTEM″(t)n could approximate the net effect of any plausible theory of geochemical dependence between metal mass and loading.” These statements are either trivial (and useless) or meaningless. At time t = 0, the first equation with n ≠ 1 is incorrect by definition of TEM″(0) (see Equation 1.7), because TEM″(0) was explicitly constructed (all its terms were defined) so that the loading (F) was proportional to it. To make any meaningful statements requires definitions that can support some meaningful interpretation, and no such definitions are provided in the PTM; in this sense, alternatively, the PTM argument is trivial (but useless) in that it can mean whatever anybody wishes. Even if the statements were not meaningless or trivial, they would not be correct as used in the arguments, where βn and n are treated as constants. There are many potential leaching behaviors that cannot be represented by such functional forms (e.g., a constant leaching rate for some period followed by a decline that can be modeled as an error function, as might occur for infiltration of groundwater into a waste pile).
The Fallacy of Equating TEM″ to the Mass of Metal Available for Leaching or Erosion
This was already pointed out. The second of Equations 1.12 has no physical meaning; it is not the mass balance equation that the PTM assumes. Although the right-hand side could represent the rate of loss of mass (if the definition of TEM″ were to be suitably modified at arbitrary times to account for n ≠ 1), the left-hand side is not the rate of change of mass available for leaching or erosion.
The Fallacy That “n = 1 Is the Only Non-zero Value of n That Yields Physical Reasonable Results That Are Independent of Arbitrary Changes in Loading History” (PTM, p. B-24)
This obtuse phrase is used to represent the (false) conclusion of the PTM (obtained on p. B-24) that the solution of the second of Equations (which is PTM equation 13 on p. B-20) is multivalued (“for any … arbitrary time periods such that tp1 < tp2 < tp3 < … < tpX … load F(tpX)
depends on the arbitrary time periods tp1 through tpX”, PTM, p. B-24).10 The error in the PTM probably arises from the careless use of notation—the substitution βn = β/TEM″ on p. B-20 followed by βn = F0/TEM″n on p. B-21 apparently without the realization that this makes β a function of F0. As a result, equation [18] (PTM, p. B-21) would more clearly be written as follows:
(1.13)
in which form it is immediately apparent that no such problem arises as imagined in the PTM (p. B-24), and the solution F(t) exists and is single-valued for all finite positive real t and all n (including n = 1 and n = 0 as limiting cases).
In reality, the time course of loading even from a single uniform homogeneous source need not be exponential. For example, consider the average11 load due to infiltration of rainwater through an initially uniform waste pile, in which there is sufficient time for the infiltrating water to reach equilibrium with the waste before exiting at the bottom of the pile. In this situation, there may be a long period when the average load is constant as the infiltrating water removes contaminant from the upper part of the waste pile, exiting the waste pile with a constant concentration equal to the equilibrium concentration. The location of the dividing line between leached and unleached waste will travel downward through the waste pile until it reaches the bottom, when there may be a relatively rapid drop in loading from that waste pile (that in some circumstances can be modeled by an error function). Many other situations can easily be envisioned, and the physical situation for erosion, infiltration, groundwater leaching, and other mechanisms may all be different.
It is then obvious that the time course of loading (in particular to the Coeur d’Alene River) can be extremely complex, as it will be the sum of many components from different sources each (potentially) with a different time behavior. For example, in the unlikely event that all sources do exhibit exponential behavior (but with different decay constants), the overall loading to the river will be a weighted sum of many exponentials with those different decay constants. It is plausible that this weighted sum might behave approximately as a power law with time (e.g., consider the case of
decay afterheat in a nuclear reactor; this is the weighted sum of many exponentials with different decay constants and behaves roughly as a power law, at least over suitably defined intervals), but prediction of such behavior requires evaluation of all the sources separately, and no a priori guess about the behavior is likely to be adequate.
Evaluation of the time dependence of leaching behavior in each source requires some information on leaching behavior of the materials involved and an evaluation of the mechanisms acting on each waste source. None of this information is presented in the PTM, and there is no evidence presented that any such information was considered in the necessary detail.
THE PTM USES UNVALIDATED AND NONREPRODUCIBLE VALUES FOR PARAMETER VALUES
The PTM analysis makes use of quantitative estimates for many input values. The great majority of these estimates do not appear to be based on any empirical evidence (none is presented or cited in the PTM)12 or on extrapolations from empirical evidence (no such extrapolations are presented or cited) or on theoretical analyses13 (again, no such analyses are presented or cited). In particular, this is true for
-
All the relative loading potential (RLPj) estimates (PTM, pp. C-5 to C-9).
-
All the remedial action effectiveness (Rij) estimates (PTM, pp. C-11 to C-14).
There is no semblance of objectivity for these estimates; indeed, in most cases it is impossible to discern their origin. The descriptions of how the estimates were obtained are entirely qualitative; indeed, it is even claimed that the analyses performed were almost entirely qualitative, yet at the end a number somehow appears.
To illustrate, it is claimed in the main text (PTM, p. 2-21) that
RLPs were estimated from interpretation of available information, including consideration of metal concentrations, mobility, and exposure to leaching and erosion, analysis of simple loading models, and professional judgment. The uncertainty in the estimates was handled probabilistically by characterizing the RLP estimates using an expected value and coefficient
of variation and assuming that the uncertainty in estimates followed a lognormal distribution.
However, no data on mobility, exposure to leaching, or erosion are presented or summarized. The reader is given no information on what “simple loading models” were considered or how they were considered. It is not stated whose professional judgment was sought, what was the connection of those professionals with this site, what their professional judgment was based on if not on the preceding information, or what extrapolations from other situations were used by those professionals in obtaining the values presented.
Similarly, in discussing the remedial action effectiveness estimates, the main text (PTM, pp. 2-27 to 2-28) states:
For each alternative, effectiveness estimates were based on an assessment of each remedial action and an engineering interpretation of the range of potential effectiveness, as documented in Appendix C. Estimates for Alternatives 2, 3, and 4 were based on engineering interpretation of the range of potential effectiveness for the typical conceptual designs (TCDs) used in the alternatives, as documented in the FS. These interpretations used qualitative engineering analysis, limited quantitative performance modeling, experience with similar remedial actions, and professional judgment. Professional judgment was used to set context and frame the interpretations, determine what questions to ask, and synthesize information to make the estimates. Experience with similar remedial actions generally considered how well actions have performed in the past, and included considerations inherent in the technology screening documented in FS Section 3. Qualitative engineering analysis was based on knowledge of scientific and engineering principles and construction limitations and used to consider how effective the TCDs are likely to be for the potential range of site-specific conditions. The analyses were qualitative except for HELP analyses used to evaluate potential cover performance in terms of infiltration and percolation. (Ridolfi 2000 as cited in in PTM, p. 4-2)
However, Appendix C, to which the reader is directed, contains no “engineering interpretations,” “performance modeling,” or documentation of any of the other approaches mentioned. There is no documentation of the “contexts” and “evaluations.” There are no references to measurements that document “experience with similar remedial actions,” or even any mention of which such actions are considered similar. There is no information on the HELP analyses that were performed.
Again, the information required to make objective estimates for most of these input values does not exist, primarily because of the lack of any leaching experiments for any materials in the basin and the very limited information on groundwater flow and metal concentrations in groundwater.
The PTM gives no indication of how the RLPj and Rij values were obtained in any way that would allow reproduction or challenge of their values; indeed, it is unclear how any reader could determine a preference for the sets of values given in the PTM over almost any other set of plausible but arbitrary values. It is claimed that (PTM, p. A-31): “Professional judgments and interpretations are documented and quantified, as scientifically and practically appropriate.”
However, the complete lack of documentation on such judgments and interpretations prohibits their evaluation. If expert judgment is to be used in a situation like this, there are documented procedures for debriefing those experts in such a manner that the basis of the final estimates can be tracked and reproduced (e.g., Kaplan 1992). The procedures require the experts to state a basis for extrapolation to the situation in hand and to justify the models and heuristics that should be applied to that basis to make the extrapolation. The justifications for the basis and for the extrapolation methods, and the extrapolation itself, are then documented and the extrapolation is performed by others (e.g., risk assessors who are not the experts). There may be one or more rounds of feedback in which the experts examine the results and modify (for stated and documented reasons) the proposed bases and extrapolations (and, of course, correct any errors in documentation). With such documentation, one could be reasonably confident in knowing where values come from and have a basis to challenge their reliability; without it, the values might as well have come from a (biased) random number generator.
THE PTM HANDLES VARIOUS PROBABILISTIC ASPECTS OF THE ANALYSIS INCORRECTLY
At various points, the PTM confuses the time variation (fluctuations) of some physical quantity (such as loading in the Coeur d’Alene River) with the uncertainty in some physical quantity (such as estimates of the remediation factor). This confusion appears to extend to the most basic level. Specifically (PTM, p. A-2), it is claimed:
Natural variability is the combination of two effects: (1) the practically irreducible uncertainty due to our limited quantitative and predictive knowledge of the fundamental physical mechanisms and interactions underlying the phenomenon of interest, and (2) the fundamentally probabilistic nature of the phenomenon itself. In principle, advancements in fundamental knowledge could reduce the first effect, at a cost, but not the second. From a practical standpoint, natural variability can be considered “intrinsic, fundamental, irreducible” uncertainty, reflecting the inexactitude of available knowledge.
Including item 1 in this list as natural variablity is incorrect; item 1 describes uncertainty, not natural variability. Only item 2 corresponds to natural variability, and nothing involving our knowledge of it will change it.14 In the case of loading or stream flow, for example, the natural variability is represented in the PTM by a probability distribution representing the fluctuations that occur from time to time in load or flow.
The implication is that this distribution would be obtained by accurate measurements made at random times. Improvements in knowledge would certainly allow changes in our ability to predict stream flow or loading at particular times, but no improvement in our knowledge will change this probability distribution. Improvements in measurement also might allow us to estimate the parameters of the stream flow or loading distribution more accurately, but that has no effect on the distribution that is being measured.
The failure to distinguish time variation and uncertainty extends to the metric that the PTM is attempting to evaluate. This metric is never explicitly or precisely defined. It appears to be some measure of the uncertainty distribution for AWQCs to be exceeded. The conflation of time variation and uncertainty in the PTM implies that the PTM attempts to obtain the uncertainty distribution for the ratio of water concentration to AWQC at a random time. Other metrics may be of greater interest to the regulator, however, although there is no discussion of any other metrics. For example, for fishery conservation it may be of more interest to know the uncertainty distribution for the average ratio of water concentration to AWQC during different seasons, or the uncertainty distribution for the expected period during a given season that the ratio of water concentration to AWQC exceeds a given value or for the expected time intervals between such exceedances.
I list below a few instances in which time variability and uncertainty have been confused in such a way as to affect the analysis of the PTM. In this discussion, I interpret the PTM as attempting to evaluate the uncertainty distribution for the ratio of water concentration to AWQC at a random time, because no other interpretation of the PTM appears to be possible.
An Attempt to Draw Conclusions About Distribution Shapes
It is stated that
Because the underlying phenomena leading to lognormality will not be changed by remedial action, it is expected that post-remediation loading
will also be lognormally distributed. An important implication of both pre- and post-remediation loading being lognormal is that the effects of remedial action should also be lognormal (because products and quotients of lognormal distributions are also lognormal…. (PTM, p. 2-10)
However, the claim is a complete nonsequitur and simply incorrect. The lognormality of the distribution representing variability in time of concentrations, stream flows, loadings, or other physical quantities has nothing to do with the shape of the uncertainty distribution for the effects of remedial actions. All the probability distributions for remedial actions presented in the PTM are uncertainty distributions (the PTM is not explicit, but no other interpretation is plausible). If, by some chance, the variability in time is what is contemplated in the PTM for one or more of the distributions given for the remedial actions, then there is no implication. In that case, the remedial actions are presumably consistent with the “underlying phenomena” (whatever those are supposed to be). Moreover, as stated elsewhere (PTM, p. A-14),
In addition, although theoretically, the sum of independent lognormal distributions is not lognormal, it can be demonstrated by simulation that the sum closely approximates a lognormal PDF. Therefore, the sum of independent lognormal distributions can also be approximated as lognormal.
Thus, the analysis is based on approximations anyway; so one might as well admit from the start that it is approximate, the same approximations would apply to the remedial actions, and no such conclusion can be drawn about any distribution for remedial actions.
Erroneously Implying a Correlation
It is concluded that there is some correlation between L and R(t) (PTM pp. B-37 to B-38):
Estimates of the correlation between L and R(t) (as measured by plnL,lnR) were based on professional judgment and interpretation of potential remedial action behavior. Although there is no practical way to quantitatively predict the correlation, it is expected that remedial action will generally be relatively more effective at reducing high loadings (which correlate with high flow conditions) than reducing low loadings (which correlate with low flow conditions) such that L and R(t) will be negatively correlated. The midrange value of plnL,lnR = –0.5 was considered reasonable.
Apart from the total lack of basis for any particular numerical value, as explicitly admitted, the whole concept of this correlation is erroneous. L is
the loading, with a distribution arising from its variability in time, particularly its variability during the year. R(t) is explicitly defined to be a time average over a year (PTM, p. B-4); there can be no correlation on this basis alone.15 More to the point, the distribution associated with R(t) is an uncertainty distribution, with nothing whatever to do with variability in time, so the concept of correlation does not even apply. What has been done in the PTM is to cancel out (by applying a negative correlation) some of the uncertainty in R(t) with the time variability of L! The “correlation” that is described in the cited paragraph is more accurately a claim that there is a functional relationship between the parameters of the distribution representing the time variability of L and the actual value of R(t)—specifically, that the upper end of the distribution of L is modified by the value of R(t). A potential way of modeling such an effect would be to treat the standard deviation of the distribution of L as a function of R(t). In this case, however, there is no basis provided that the claim is accurate and that “remedial action will generally be relatively more effective at reducing high loadings (which correlate with high flow conditions) than reducing low loadings (which correlate with low flow conditions).” Whether this claim is true depends on details about leaching and erosion from each source, details that are not documented or (apparently) even examined in the PTM in reaching its conclusion.
An Attempt to Estimate the Wrong Correlation
The load ratio is defined by Equation 1.8 above (PTM, p. B-53, equation 1); that is,
(1.14)
and the metal loading F(t) is given by Equation 1.2 above (PTM, p. B-4, equation 1); that is,
(1.15)
so that
(1.16)
Both L, the preremedial loading, and CL, the loading capacity, vary with time throughout the year, whereas R(t) is defined to be a yearly average.
Associated with R(t) is an uncertainty distribution but no unpredictable time variability (R(t) varies with time, but smoothly and in a predictable fashion), whereas the distributions associated with both L and CL are due to their (unpredictable) time variation (strictly, there are also uncertainty distributions associated with the parameters of the distributions describing their time variation, because of finite numbers of measurements, but these are ignored here, just as they are ignored in the PTM). There is a very high correlation between measured values for L and CL (the correlation coefficient between their logarithms is approximately 0.95)16 but none between R(t) and L or CL (as discussed for L; the same arguments apply to CL as to L).
The PTM (p. B-53, equations 1, 2, and 3), however, obtains the uncertainty distribution for F(t) at a random time within about a year of t by combining the time-variability distribution for L with the uncertainty distribution for R(t). It then attempts to argue about the correlation between the resulting uncertainty distribution and the time-variability distribution for CL based on the correlation between L and CL. It states (pp. B-53 to B-54):
The future correlation between lnF(t) and lnCL, measured by plnF,lnCL, is expected to be very high. This expectation is based on an almost perfect correlation (p = 1.0) between lnCL and lnQ and a virtually certain high future correlation between lnF(t) and lnQ, just as there has been historically between discharge and loading (which, being a function of discharge, induces correlation). In addition, as further discussed in Section B.3.4.1, and independent statistical analysis of the zinc concentrations, water hardnesses, and discharge data corresponding to that used in developing the TMDL loading capacities for SF271 (EPA 2000) showed a correlation coefficient of 0.95 between the natural logs of zinc loadings (computed as the product of concentration and discharge) and the equivalent loading capacities (computed as the product of the zinc AWQC(H) and discharge). Consistent with this information, a value of plnF,lnCL = 0.9 was used in the analysis.
There is no basis for the selection of the particular value 0.9. It is not possible to state whether it is “consistent with this information” without further examination, but in general it is not consistent with that information. The effect of assuming a high correlation between ln(F(t)) and ln(CL) is to substantially cancel the uncertainty in R(t) with the time variability in CL; but this cancellation is purely fictitious. This error compounds the
previous erroneous cancellation of the uncertainty of R(t) by the time variability of L discussed above.
The effect of these two incorrect cancellations can be large. This may be illustrated by supposing that what is required is the uncertainty distribution for Lr(t) at a random time, so that it is legitimate to (correctly) combine the uncertainty of R(t) with the time variability of the ratio L/CL in Equation 1.16. For dissolved zinc at location SF271 on the Coeur d’Alene, the measured standard deviation of (the time variability of) ln(L) is 0.525, that of ln(CL) is 0.643, and that of the logarithm of their ratio, ln(L/CL), is 0.22517 (obtained from the joint measurements of concentration, hardness, and flow rate; [EPA 2000, for hardness and flow measurements; URS Greiner Inc. and CH2M Hill Inc. 2001b, for dissolved zinc and flow measurements]).18
With these measured standard deviations for ln(L) and ln(CL), Table F-1 shows the correct calculation of the random-time uncertainty for ln(Lr(t)) compared with that obtained by including the two erroneous correlations introduced in the PTM for various values of the standard deviation of ln(R(t)). The error introduced is clearly substantial for any plausible estimates for uncertainty in ln(R(t)).
INCORRECT OR MISLEADING STATEMENTS IN THE PTM
The following is an incomplete sampling of various incorrect or misleading statements and equations in the PTM. Attempting to list all such erroneous statements and equations would be too time-consuming, so the failure to list any statement or equation in this list cannot be considered an endorsement of the correctness of any statement or equation not listed here.
• The term “power series” is used incorrectly throughout Appendix A. Where “power series” is used, the correct term would be something like “power product.” The discussion is not of power series in one or more random variable, but the product of powers of random variables.
• “Minimum statistical assumptions are required” (PTM, p. A-13). No basis is provided for this statement. One can assume anything, but that does not make it correct, or even consistent, or useful.
TABLE F-1 Effect of the Two Erroneous Correlation Calculations Introduced in the PTM
|
Standard deviation of ln(R(t)) |
Standard Deviation of ln(Lr(t)) |
|
|
Correct |
PTM |
|
|
0.0 |
0.225 |
0.285 |
|
0.3 |
0.375 |
0.306 |
|
0.6 |
0.641 |
0.280 |
|
0.9 |
0.928 |
0.347 |
|
1.2 |
1.221 |
0.541 |
|
1.5 |
1.517 |
0.791 |
• “A lognormal PDF is believed to be a maximum entropy PDF for the log of variables where only the expected value and coefficient of variation of the distribution is known or estimated. Maximum entropy estimates give the ‘least prejudiced, or least biased, assignment of probabilities’” (Harr 1987) (PTM, p. A-13, footnote 9, italics in original). No connection is proposed between “minimum statistical assumptions” and “maximum entropy.” Nor is any application to the problem at hand proposed; on what basis, for example, is it supposed that only the expected value and coefficient of variation are known for the log of variables, and how does this connect, for example, with the evaluation of probability to exceed the AWQC?
• “a correlation coefficient of –1.0 implies perfect inverse linear correlation (i.e., X1 and X2 are inversely proportional)” (PTM, p. A-8). This is incorrect; perhaps what was intended is that if the correlation coefficient between logarithms ln(X1) and ln(X2) is –1.0 then X1 and X2 are inversely related (but not necessarily in direct inverse proportions).
• “Unbounded positive values are allowed (which is generally conservative because it tends to overestimate true values)” (PTM, p. A-13). It does not follow that lognormal distributions lead to “generally” conservative estimates, without specifying the universe of discourse. For example, if some variable is (erroneously) assigned a lognormal distribution, and that variable occurs in the denominator of an expression, the result may be an underestimate rather than an overestimate. On the other hand, the inverse of a lognormal distribution is also lognormal, so the preceding example also shows that (erroneously) assigning a lognormal distribution to an expression in the numerator can lead to underestimates—because a lognormal distribution also allows unboundedly small values.
• “Any PDF can be conservatively approximated using a lognormal PDF that envelopes the PDF over the range of interest” (PTM, p. A-13). Again, this statement is meaningless without a definition of “conservatively,” “envelopes,” and “range of interest” at the least. Even with such
definitions, it is likely to be untrue in general. Indeed, it is quite likely that a converse theorem holds—for any lognormal approximation to a given PDF, there exist statistics of that PDF that are not conservatively estimated by the lognormal approximation.
• “Variables CDS and CS are, respectively, the metal (zinc) concentration of the deeper sediments and floodplain sediments having RLP = 1. These sediment concentrations will be positively correlated” (PTM, p. B-47). “Also, because of the way CDS and CS were estimated, they would be positively correlated” (PTM, p. C-9). It is quite plausible that the concentrations of deeper sediments and floodplain sediments are correlated spatially—that is, the concentration would tend to be higher in the deeper sediments beneath floodplain sediments with higher concentrations. Such a spatial correlation is entirely irrelevant, however, for variables CDS and CS, which are defined to be “volumetric average concentrations in the deeper impacted sediments” and “volumetric average concentration in the impacted sediments having an RLP = 1” (PTM, p. B-14). Any spatial correlation is entirely removed by the averaging. What is required is any correlation between the uncertainty distributions for these volumetric averages. No such correlation is induced “because of the way CDS and CS were estimated.” The only documented “estimation methods” are given in section C.2.4, where uncertainty confidence intervals for the values of CDS and CS are supposedly (very loosely) based on observed data in the BHSS and a background estimate based on measurements outside the BHSS. Nothing in the measurements supposedly used or in the described derivation correlates these uncertainty distributions; the fact that the same value is used as the lower uncertainty confidence bound for one and the upper uncertainty confidence bound for the other is the only connection between them, and that has no such effect. The subsequent estimate of a value of 0.5 for the correlation coefficient of this hypothetical, nonexistent correlation is simply incorrect.
• “An estimate of CV[M] = 0.5 was used in the analysis” (PTM, p. B-48). There is no basis given for this estimate. Nor is it clear why it was introduced, except to arbitrarily increase the uncertainty estimate.
• “Since the estimates for L and TEM′ are independent of each other, plnL,lnTEM, was set to zero in the analysis. This lack of correlation in the estimates should not be confused with the positive correlation that must exist in the true values of L and TEM′, and is otherwise inherent in the data used to make the estimates. To the extent there was (positive) correlation between the estimates of L and TEM′, it would decrease both E[β] and CV[β]” (PTM, p. B-48). This statement demonstrates complete confusion, apparently stemming from a misunderstanding of what “correlation” means or perhaps the confusion in this document between measurement uncertainties, variability in time, and functional relationships. There is obviously
no correlation possible between true values of L and TEM′,19 which are single values.
• “The BHSS data do not represent the true values of CDS and CS, which are uncertain” (PTM, p. C-10). True values cannot be uncertain, although they may be unknown, so that we are uncertain about what they are.
• “For example, the correlation coefficient between the natural logs of Q and H is 0.96 for the SFCDR at SF271 … the correlation coefficient between the natural logs of AWQC and Q at SF271 is also 0.96 for the TMDL data set” (PTM, p. B-26). Both these correlation coefficients are –0.96, not +0.96.
• Page 1-1, footnote 1, the conversion factor is actually 0.005394 to 4 significant figures, or 0.00539 to 3 significant figures. The value used should at least be the correct rounding of the exact value.
• Page A-24, equation [2] is incorrect. The correct expression is
(1.17)
and there is no need to introduce the variables Xi′. Indeed, the entire exposition would be greatly clarified by working with statistics of the logarithms of the variables. For example, define Ti = ln(Xi), T = ln(X), and let Xi have mean mi and coefficient of variation ci, Ti have mean μi and standard deviation σi, and similarly for X and T (with no subscripts). Then we have
(1.18)
and similarly for all subscripted variables. Then equations 1 through 3 of PTM (p. A-24) become the considerably simpler equations:
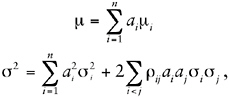
(1.19)
where ρij is the correlation coefficient between Ti and Tj, and it is trivial to move between statistics for variables and their logarithms using Equations 1.18.
• Page B-10, the second equation for Lj/Vj in the middle of the page is incorrect; that is,
(1.20)
and the inequality applies except in certain special cases (which do not apply in general in this application).
• Page B-12 and C-5, the last two entries in equation 4 of p. B-12, and the same equations repeated in section C.2.3 for RLPj are incorrect if any attempt is made to interpret them according to standard conventions. The first and second entries of equation 4 of p. B-12 correspond to the definitions given. It is just possible to interpret the last two entries in equation 4 of p. B-12 and the same equations in section C.2.3 in the correct sense if the phrases “per unit volume of source type j and FP” and “per unit load of source type j and FP” are interpreted as applying separately to the numerators and denominators of the respective equations, contrary to any standard convention; coming on these equations by themselves (without the correct definition) in section C.2.3 is disconcerting.
• Page B-26, “The analysis used the same discharge and H(Q) and AWQC(Q) relationship used in EPA 2000 for the TMDL.” This statement is incorrect, and the approach taken in the PTM is inconsistent with the intent of performing an uncertainty analysis. First, the statement is incorrect because the relationship assumed in EPA (2000) was linear between hardness itself and the logarithm of flow rate, whereas the relationship assumed in the PTM is linear between the logarithm of hardness and the logarithm of flow rate. Second, the approach taken in the PTM is inconsistent, because the PTM analyzed the loading capacities derived for regulatory purposes in EPA (2000). However, those loading capacities already have built into them the results of an uncertainty analysis; the loading capacities are derived as 90th percentiles of an uncertainty distribution.20 That uncertainty analysis should be incorporated in the PTM as part of the overall uncertainty analysis—the PTM should evaluate the original data, not the summary statistics produced by EPA (2000).
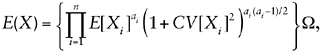
• Pages A-18 to A-19 and B-33 to B-34, the technique used to estimate parameters (mean and standard deviations of the logarithm) of lognormal distributions by regressing order statistics of the logarithms of measurements against the “plotting points” (p. A-18, equation 8, and p. B-34, equation 1 has nothing to recommend it. The “plotting points” used are
only approximations of the expected values of the normal order statistics, so the technique is approximate at best (better approximations of normal order statistics are available (Royston 1993, 1995). The values obtained for mean and standard deviation are almost certainly biased and have unknown statistical properties. On the other hand, simply computing the mean and (sample) standard deviation of the logarithms of measured values gives unbiased estimates with known (and optimal for certain purposes) statistical properties for these parameters. Unless the PTM justifies the methodology used (by demonstrating, for example, superiority in some sense of the estimates obtained), standard (and simpler) approaches should be used.
• Page B-35, equation 6, the right-hand side erroneously uses CV[L] where what is required is CV[C]. The expression for Ω erroneously omits p.
• Page B-35, equation 8, the right-hand side erroneously uses CV[L] where what is required is CV[C].
• Page B-35, footnote 17, the expressions could be somewhat simplified if the trivial identity
(1.21)
were applied. Better yet would be adoption of the suggestion discussed in the comment on p. A-24.
• Page B-36, first equation on page (carried over from equation 10 of p. B-35), the expression for Ω erroneously omits p.
• Page B-37, equation 3, the expression for Ω erroneously omits p.
• Page B-43, equations 6 and 7, in both these equations the denominators have been written incorrectly, because
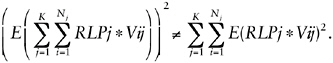
(1.22)
The left side of Equation 1.22 is what is required inside the square root in the denominator of equations 6 and 7, but the right side is what is written.
• Page B-57, “The analysis showed the following principal results: Both the AWQC(H) and the equivalent loading capacities were lognormally distributed with respective r2’s of 0.94 and 0.97.” The list continues with similar statements about ratios of zinc loadings to loading capacities, zinc concentrations, loadings, and hardness. However, the given information is not sufficient to support the conclusion of lognormality for these quantities—some values of r2 would be obtained whether or not any par-
ticular distribution was lognormal. It is quite feasible to test whether a set of samples is consistent with lognormality—for example, by using the Shapiro-Wilk test (Royston 1982, 1993, 1995). Applying this test suggests that it is somewhat unlikely that the measured zinc concentrations (p = 0.002), AWQC(H) (p = 0.014), or hardness (p = 0.018) are lognormal, although zinc loading measurements (p = 0.3) and loading capacity (p = 0.5) are consistent with lognormality.21 It is already pointed out in footnote 17 that the ratio of zinc load to the load capacity is more consistent with normality than lognormality.
• Page B-52 (section B.3.3.3), “For these reasons and because of its general theoretical and practical basis, Eq 1 was considered a valid and reasonable approximation for estimating CV[R(t)] for the lower basin, with further savings of effort.” But there is no theoretical basis whatever for equation 1, because it is purely an empirical approximation found for the upper basin using the specific values for the upper basin.22 Therefore, there is no basis whatever for extending this empirical approximation to the lower basin (with different source types, different mixes of sources, and so forth)—the results obtained there could be substantially different.
REFERENCES
EPA (U.S. Environmental Protection Agency). 2000. Total Maximum Daily Load for Dissolved Cadmium, Dissolved Lead, and Dissolved Zinc in Surface Waters of the Coeur d’Alene River Basin, Appendix I: Hardness Data. EPA 910R01006. U.S. Environmental Protection Agency, Region 10, Seattle, WA and Idaho department of Environmental Quality, Boise ID [online]. Available: http://yosemite.epa.gov/.../ac5dc0447a281f4e882569ed0073521f/b57be085215b66658825693b0076f71c/$FILE/CdAtecha.pdf [accessed July 27, 2005].
Kaplan, S. 1992. “Expert information” versus “expert opinions.” Another approach to the problem of eliciting/combining/using expert knowledge in PRA. Reliab. Eng. Syst. Safe. 35(1):61-72.
Ridolfi (Ridolfi Engineers Inc.). 2000. Containment Cover Evaluation Using the HELP Model, Coeur d’Alene River Basin Feasibility Study. December 2000 (as cited in URS Greiner, Inc., and CH2M Hill 2001a).
Royston, J.P. 1982. Algorithm AS 181: The W test for normality. Appl. Statist. 31(2):176-180.
Royston, P. 1993. A toolkit for testing for non-normality in complete and censored samples. Statistician 42(1):37-43.
Royston, P. 1995. Remark AS R94. A remark on algorithm AS 181: The W-test for normality. Appl. Statist. 44(4):547-551.
URS Greiner, Inc., and CH2M Hill. 2001a. Probabilistic Analysis of Post-Remediation Metal Loading Technical Memorandum (Revision 1). URSG DCN 4162500.06778.05.a. Prepared for U.S. Environmental Protection Agency, Region 10, Seattle, WA, by URS Greiner, Inc., Seattle, WA, and CH2M Hill, Bellevue, WA. September 20, 2001.
URS Greiner, Inc., and CH2M Hill, Inc. 2001b. Final (Revision 2) Remedial Investigation Report for the Coeur d’Alene Basin Remedial Investigation/Feasibility Study, Volume 9, Appendix C. URSG DCN 4162500.6659.05a. Prepared for U.S. Environmental Protection Agency, Region 10, Seattle, WA, by URS Greiner, Inc., Seattle, WA, and CH2M Hill, Bellevue, WA. September 2001.


