
1
Materials as Global Activity: Setting the Scene
Materials science and engineering (MSE) involves the generation and application of knowledge relating the composition, structure, and processing of materials to their properties and uses (see Box 1.1, “What Is Materials Science and Engineering?”). The science aspect focuses on discovering the nature of materials, which in turn leads to theories or descriptions that explain how structure relates to composition, properties, and behavior. The engineering aspect deals with the use of science to develop, prepare, modify, and apply materials to meet specific needs. The connection between the research and development (R&D) and science and engineering can be thought of in the following way: Research is an enabling process for science, and development is an enabling process for engineering.
At the beginning of the 21st century, MSE innovation and progress remain as dynamic as at any time in the history of the field. Over the last half of the 20th century, MSE remained a driver of economic activity in the United States and around the world. It can be thought of as the key building block of most advanced technologies, if not all, and as such it continues to make innumerable contributions to social advancement, human health and development, and the maintenance of national security. MSE contributions have included enhanced global communications systems that enable 21st century connectivity; materials relevant to and/or inspired by biology; and new materials for augmented security and
|
BOX 1.1 What Is Materials Science and Engineering? Where Did MSE Come From? Although materials and processes have fueled technological progress for thousands of years, the field of MSE per se did not exist before the 1960s. It is, therefore, a relatively young discipline in comparison with physics, chemistry, and related engineering fields. MSE became a single discipline through the evolution and coalescence of three materials-specific fields—metallurgy, ceramics, and polymer science. Although many other disciplines—for example, physics, geology, electronics, optics, chemistry, and biology—continue to bear on MSE and have made indispensable contributions to its development as a formal discipline, these three materials-based fields remain at the heart of MSE. In the early days of MSE as an academic discipline and a subject of R&D endeavor, practitioners came mostly from physics, chemistry, engineering, metallurgy, the earth sciences, and mathematics. With the growth of biomaterials, medical practitioners, biologists, biochemists, and biophysicists have joined in. Increasingly, as the field emerged in its own right, MSE practitioners were trained in materials departments established at engineering or physical sciences schools in universities here and abroad. Nevertheless, despite 50 years of developing, maturing, and gaining broad acceptance, agreeing on an all-encompassing definition for MSE as a discipline remains a challenge. The origins and nature of MSE remain varied and interwoven, and any definition of the field must reflect the richness and diversity of all the activity related to “materials.”a What Is a Material? A good place to start defining MSE is to consider what a material is. A simple definition would be that a material is the stuff from which an article, fabric, or structure is made.b This definition, however attractive because of its simplicity, does not reflect the full diversity of the study of materials. Because most articles, fabrics, or structures are considered to be solids, how would the study of liquids and gases fit into such a definition of materials? It would not, yet the study of liquids and gases is of central importance to many areas of MSE, such as materials processing, understanding the structure of many biological systems, investigating colloidal systems, and studying liquid crystals. A more thorough definition might be this: Matter is a “material” when that form of matter has structural, optical, magnetic, or electrical use.c |
|
What Do Materials Scientists and Engineers Do? Further insight into what is meant by MSE can be gained by considering the kinds of things materials scientists study and the materials-related knowledge and skills they need to do so.d
It has been suggested that these activities can be summarized by considering that materials scientists and engineers investigate the function of a material in an existing application and discover applications for it through the characterization of its structure and properties, and through the understanding of its production. The materials tetrahedron (Figure 1.1.1) is often used to illustrate the four aspects of MSE: (1) composition and microstructure, (2) properties, (3) synthesis and processing, and (4) performance. Each is
|
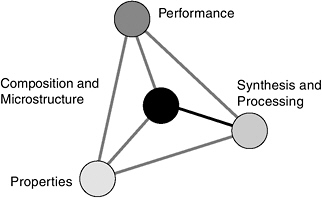
defense systems to protect the nation’s security.1 The quest for greater insight and innovation remains the primary motivation for the continuing evolution of a field that is characteristically inter- and multidisciplinary.
The evolution of MSE has been characterized not only by a broadening of the field to encompass new materials, such as nanomaterials, and new crosscutting themes, such as biomaterials, but also by the globalization of MSE industrial activity and, most recently, MSE R&D. As long as MSE remains vital for U.S. industrial and economic activity and as long as federal support of MSE R&D continues to be
|
mittee that carried out the MSE benchmarking exercise added catalysts to the NSTC list and combined electronic materials and optical-photonic materials research into one category.e Since publication of the benchmarking report, the investigation of nanomaterials has blossomed into a vibrant, crosscutting area of materials research, so for the purposes of this report, the subfield of nanomaterials has been added to the list. MSE at the beginning of the 21st century, therefore, consists of the following subfields:
In summary, MSE involves the generation and application of knowledge that relates the composition, structure, and processing of materials to their properties and uses. |
a priority, the nation will need to understand well the drivers for and consequences of the globalization of MSE R&D.2 The purpose of this report is to consider the issues surrounding this globalization. The report will
-
Consider and identify trends in the evolution of MSE R&D being carried out around the world.
-
Assess the forces that are driving globalization.
-
Draw conclusions about the impact globalization might have on U.S. na
-
tional priorities and, specifically, recommend actions to ensure the nation’s continued access to current materials research.3
The approach of the Committee on Globalization of Materials Research and Development, which is responsible for this report, has been to identify trends in the globalization of MSE R&D based on evidence presented to it during the course of the study and on relevant reports and studies from other sources.
MATERIALS SCIENCE AS A PRIORITY FOR THE UNITED STATES
The critical task of setting policy for the nation’s research endeavors has been the subject of many studies and reports. In 1993, the National Research Council (NRC) issued the report Science, Technology, and the Federal Government: National Goals for a New Era. In that report, the Committee on Science, Engineering, and Public Policy (COSEPUP) suggested that the United States adopt the principle of being among the world leaders in all major fields of science so that it could quickly apply and extend advances in science wherever they occur. In addition, the report recommended that the United States maintain clear leadership in fields that are tied to national objectives, that capture the imagination of society, or that have a multiplicative effect on other scientific advances. These recommendations were reiterated in another NRC report, Allocating Federal Funds for Science and Technology (1995), which said that the United States should “strive for clear leadership in the most promising areas of science and technology and those deemed most important to our national goals.”
In 1999, the National Science and Technology Council (NSTC) stated that advanced materials were the foundation and fabric of manufactured products.4 To support its assertion, NSTC cited the role of advanced materials in, among others, fuel-efficient automobiles, damage-resistant buildings and structures, electronic devices that transmit signals rapidly over long distances, protecting surfaces from
wear and corrosion, and endowing jet engines and airframes with sufficient strength and heat tolerance to permit ever-faster supersonic flight. The NSTC concluded that many leading commercial products and military systems could not exist without advanced materials and that many of the new products critical to the nation’s continued prosperity would come to be only through the development and commercialization of advanced materials.
In its report Experiments in International Benchmarking of U.S. Research Fields (2000),5 COSEPUP asked, How important is it for the United States to lead in MSE? The materials subpanel that wrote the MSE-focused sections of that report noted that there had been an explosion in the understanding and application of MSE since the end of World War II, and that connections had become stronger between the materials field and other fields with emerging technology. The result, the subpanel concluded, was an acceleration in the contributions of materials to social advancement and economic growth.
A 1990 National Academies report, Industrial Preparedness, National Resource and Deterrent to War,6 focused on how U.S. industry could be successful in an increasingly internationalized world. A key section, “Dependence on Overseas Sources,” said
The internationalization of the U.S. economy has caused global redistribution of the means of producing certain items. The United States is less self-sufficient than it was in past decades and is unlikely to be able to return to greater self-sufficiency. Because continual upgrades of technology are fundamental to a healthy domestic industry, federal incentives for technological investment will be more effective in the long run than “Buy American” restrictions.
The reports cited above represent only a small sample of many volumes that have been produced on the importance of materials research to future U.S. economic and national security and how the United States should react to the changing environment in which MSE R&D is taking place. They all point out that MSE research continues to address issues in agriculture, health, information and communication, infrastructure and construction, and transportation. Five areas are of particular interest.
TABLE 1.1 Historical Summary of DOD Materials Processing Science and Technology Funding (millions of current 2005 dollars)
|
Budget Item |
1994 |
1995 |
1996 |
1997 |
|
Basic research |
115.69 |
134.83 |
89.197 |
75.757 |
|
Applied research |
366.77 |
386.99 |
316.38 |
279.18 |
|
Advanced Technology Development |
28.434 |
25.368 |
37.33 |
29.026 |
|
Total budget request |
510.9 |
547.2 |
442.9 |
384 |
|
Congressional add-on |
147.39 |
120.5 |
35.728 |
48.176 |
|
Total appropriated budget |
658.3 |
667.7 |
478.6 |
432.1 |
-
The national defense of the country continues to depend on the ability to provide the most advanced weapons to the military, and the evolving threat to homeland security demands new materials to solve new problems.7
-
MSE research continues to provide solutions to problems in health care with the development of new materials for the delivery of life-saving drugs and new implant technologies.
-
MSE research is producing advanced materials solutions for more efficient energy production and transmission systems.
-
MSE research is providing the latest materials for advanced transportation needs such as more energy-efficient and safer automobiles and advanced aerospace systems.
-
Numerous consumer products benefit from MSE R&D.
Given the multifaceted importance of MSE R&D to the United States, maintaining world leadership in the field remains a critical national priority. This priority status can be evinced by the vibrant MSE R&D programs supported by federal agencies such as the National Science Foundation (NSF), the Department of Energy, the National Aeronautics and Space Administration (NASA), and the Department of Defense (DOD) and by the research programs of the various military services. While data are not available on aggregate federal support for MSE owing
|
1998 |
1999 |
2000 |
2001 |
2002 |
2003 |
2004 |
2005 |
|
101.28 |
85.978 |
86.219 |
111.99 |
96.06 |
113.14 |
102.84 |
83.8 |
|
274.3 |
337.42 |
283.8 |
306.93 |
322.67 |
292.88 |
299.93 |
264 |
|
32.968 |
37.71 |
40.05 |
47.589 |
47.6 |
43.806 |
33.871 |
36.3 |
|
384.8 |
461.1 |
410.1 |
466.5 |
466.3 |
449.8 |
436.6 |
384.1 |
|
38.423 |
70.43 |
79.544 |
100.2 |
80.265 |
114.29 |
153.5 |
168.5 |
|
423.2 |
531.5 |
489.6 |
566.7 |
546.6 |
564.1 |
590.1 |
552.6 |
to the highly diversified, interdisciplinary nature of MSE, some interesting trends can be seen in the recent budget data from NSF and DOD (Table 1.1 and Figures 1.1 and 1.2).
GLOBALIZATION AND R&D
What Is Globalization?
For such an extensively used term as globalization, it is notable that there is no precise and widely agreed definition. It has been suggested that globalization can be thought of as “the integration of free markets, nation states and information technologies to a degree never before witnessed and in a way that is enabling individuals, corporations and countries to reach around the world farther, faster, deeper and cheaper than ever.”8 The deepening integration that is characteristic of globalization is the source of both threats and opportunities. Globalization is a term that has recently taken on cultural, political, and other connotations in addition to the economic connotation. By and large, however, the most common or core sense of globalization remains economic and refers to the rapidly growing share of economic activity that now takes place between people, corporations, and institutions in different countries rather a single country. This growth in cross-border economic activity takes various forms—international trade, foreign direct investment, capital market flows, and so on. Each of these activities is associated with distinct issues, benefits, and risks that call for an assessment and a policy response.
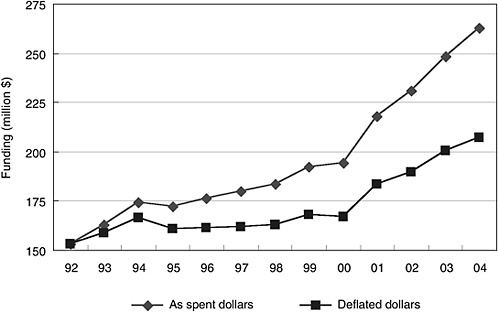
FIGURE 1.1 Funding trend at the NSF Materials Research Division (DMR). NSF/DMR experienced a budget increase in real terms of over 30 percent between 1992 and 2004. In FY2004 DMR’s budget was close to $250 million. In the final FY2005 budget the only element to benefit from an increase was the $174 million for the Major Research Equipment and Facilities Construction account, up from $155 million in FY2004 but well short of the $213 million FY2005 request. These data indicate the generally upward trend in support for materials R&D at one division of NSF. Programs funded by other parts of NSF that might be thought of as being materials research—such as some chemical sciences programs and some engineering and nanotechnology programs—are not included here. Neither do these raw data show the details of R&D support by subdiscipline. Nonetheless the data from NSF/DMR give us insight, albeit limited, into current trends in federal funding of MSE R&D.
Notwithstanding the predom|inantly economic and trade-related features of globalization, in recent years a trend toward globalization of the world’s R&D activities has emerged, driven by the institutions of government and by global industrial activity. The globalization of R&D can take a variety of forms—for example, offshoring industrial R&D activities; foreign direct investment in R&D in the United States and in other countries; and the development of transnational strategic alliances/cooperation, including intergovernmental supported networks of academic and industrial researchers.
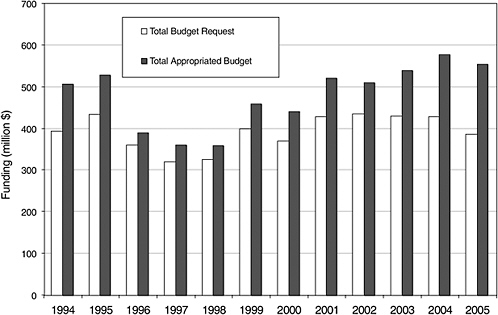
FIGURE 1.2 Historical summary of DOD materials processing science and technology funding (current 2005 dollars). Materials funding, also shown in Table 1.1, has been, on balance, flat in comparison with a decade ago. It is noteworthy that the final budget each year gained from congressional action to add funding—often for targeted projects—to the President’s requested budget. SOURCE: Department of Defense.
What Is the Impact of Government?
The interplay between global corporations, national governments, and transnational organizations is multifaceted and complex. The globalization of industry and the increasing international competition between today’s economies have caused some governments to plan and promote national capacities for the generation, absorption, and commercialization of new knowledge and the promotion of innovation. As R&D continues to become globalized, the policies of individual governments and regional groupings and organizations—such as the European Union (EU)—influence the flow of knowledge. This trend has led to new global centers for R&D emerging around the world in countries that might not have had a track record of large-scale R&D in the field in question.9 Governments are recognizing the need for national and transnational responses to the issues globalization creates. Evidence of this can be found in the expanding importance of the EU’s Framework Program, which now allows for the participation of researchers from outside the EU. In the United States the NSF is looking harder at the international perspectives.10 In November 2004, NSF announced that the University of California, Santa Barbara, had been selected to host the International Center for Materials Research.11 The mission of the center is to promote global
|
9 |
An example of a new center of research can be found in Singapore’s strategic development of biomedical research. Ernst and Young report in Beyond Borders: The Global Biotechnology Report 2003 that the emergence of Singapore as a center for biomedical industrial activity—biomedical manufacturing output there increased by 48 percent in 2002, to US$ 5.5 billion—has been accompanied by a rise in R&D, with the emergence of global corporate R&D by companies such as Eli Lilly and Novartis, along with early-stage R&D by 25 Singapore-based corporations. As part of a case study on incentive programs in other countries, Ireland’s Council for Science, Technology and Innovation (http://www.forfas.ie/publications/pharma_chem03/030526_icsti_pharmachem_statements.pdf) notes that expenditure on R&D in Singapore is deductible in the year in which it is incurred and that enhanced deductions are available for current expenditure on qualifying R&D (for example, double deductions for laboratory, testing, and medical research services). Capital allowances are available, including accelerated depreciation on R&D, computers, and other prescribed (for example, energy-efficient, pollution-reducing, and so on) equipment. The Technopreneurship Fund of over US$ 700 million provides industry-related training and offers participants international experience in key industries. The Singapore biomedical initiative was launched in 2000 with a US$ 750 million fund for investments in world-class biomedical firms undertaking R&D in Singapore. Specialist facilities being funded by the Singapore government include the Biopolis science park, which provides state-of-the-art laboratory facilities for biomedical sciences companies near research institutes and universities. |
|
10 |
See Toward an International Materials Research Network, available at http://www.nsf.gov/pubs/2002/nsf02068/background.htm. |
|
11 |
For more information, see http://www.icmr.ucsb.edu/general.html. |
excellence in MSE through a series of research and educational programs and by providing an international forum for scientists and engineers with common interests in the future of MSE.
The emergence of a global innovation system appears to be intensifying the pressure for intergovernmental efforts aimed at the harmonization of regulatory-regime policy. As an example, at the 2004 ministerial meeting of the Committee for Scientific and Technological Policy12 of the Organisation for Economic Cooperation and Development (OECD)13 the ministers and senior government officials of 30 nations discussed and agreed on a declaration concerning access to research data from publicly funded research. Although the OECD declaration focuses on how to ensure open access to research data, it recognizes that the innovation system is becoming global, that this trend is beneficial, and that the flow of information is critical to supporting this trend. Governments are also restructuring national policies in order to attract R&D activities to their countries, often to underpin a wider effort to attract and maintain foreign direct investment in manufacturing and to build national R&D capacities. Box 1.2, “Building a Knowledge- and Innovation-Based Economy in the World’s Most Globalized Country—Ireland,” describes how Ireland is planning to support innovation in a globalized economy.
What Is the Impact of Industry?
The role of industry in MSE R&D appears critical to any discussion of the impact of globalization on MSE R&D. The irrefutably changing and global face of industry in the 21st century has resulted in the emergence of the global corporation. Indeed, globalization has arguably affected the management structures of many leading global corporations and how those corporations respond to pressure from stockholders to maximize profit. It is becoming commonplace that just as these corporations have manufacturing capacities around the globe, their ownership is often also spread among individuals, corporations, and institutions from
|
12 |
The OECD committee aims at informing the policy debates on the contribution of science and technology to sustainable growth and societal needs in knowledge-based economies and at promoting international cooperation in scientific research. For information on its 2004 ministerial meeting, see http://www.oecd.org/cstp2004min. |
|
13 |
Current members of the OECD are Australia, Austria, Belgium, Canada, Czech Republic, Denmark, Finland, France, Germany, Greece, Hungary, Iceland, Ireland, Italy, Japan, Korea, Luxembourg, Mexico, Netherlands, New Zealand, Norway, Poland, Portugal, Slovak Republic, Spain, Sweden, Switzerland, Turkey, United Kingdom, and United States. |
|
BOX 1.2 Building a Knowledge- and Innovation-Based Economy—Ireland Many countries are formulating national innovation strategies not only in reaction to the increasing globalization of the R&D environment but also to exploit globalization with a view to supporting and developing opportunities for future economic growth based on high-technology industries. One such country is Ireland, which the A.T. Kearney/Foreign Policy Globalization Index ranks as the most globalized country in the world for the third year in a row.a Examining the Irish experience provides an insight into how one country is responding to globalization with a view to mitigating the risks and maximizing the potential. Following two decades of concerted efforts by successive Irish governments to attract high-value investment by global high-technology industries, Ireland now enjoys living standards, as measured by gross domestic product (GDP) and gross national product (GNP) per capita, that exceed the EU average. Ireland’s economy proved resilient through the global downturn in 2001–2003, although it grew more slowly than during the late 1990s. However, in recent years Irish policy makers have realized that future economic development would be strongly influenced by the shift toward services as an important driver of GDP growth and the increasing role of knowledge as a driver of economic development. In July 2003, Ireland’s deputy prime minister, Mary Harney, summarized the challenge: “Put simply, in the past we have been excellent at making products designed by others; in the future we will have to design and innovate our own.” Ireland, in response, is undertaking a number of initiatives to create a new strategic orientation for Irish enterprise based on developing expertise in international markets; building a world-class research and innovation capability to support the development of high-quality, high-value products and services; renewing Ireland’s commitment to education and training to provide the skills base industry will need; maintaining a competitive tax environment to drive economic growth; and providing capable and flexible government that can quickly identify and implement policies required to facilitate change. Ireland has increased significantly its investment in science and technology. Under the implementation of Ireland’s most recent national development plan for 2000–2006, the government is investing 2.54 billion in research, technological development, and innovation. The recently created Science Foundation Ireland (SFI) is investing 646 million be
|
several countries. The 20 U.S. corporations spending the most on R&D (Table 1.2) are all highly globalized. The activities of corporations themselves within the global innovation system are important, and they can act in harmony with, against, or independent of national government policies.
Although no specific data for the international flow of MSE-related R&D funds are available, examining the broader transnational flow of R&D funds can
|
tween 2000 and 2006 in academic researchers and research teams who are “most likely to generate new knowledge, leading edge technologies, and competitive enterprises in biotechnology, and information and communications technology.”b In executing its new R&D program, the Irish government has remained focused on developing a national innovation plan, an effort that has received the attention of the highest government leadership. At the first SFI science summit in September 2004, Ireland’s Prime Minister, Bertie Ahearn, said, “the government’s long-term vision is a thriving knowledge-driven economy built on truly competitive research. To achieve and sustain this goal, we must all work in partnership. That is, the researcher community working with their colleagues in education and industry for the greater good of our economy and our society.” A government report released in August 2004, Building Ireland’s Knowledge Economy, lays out an ambitious vision: Ireland by 2010 will be internationally renowned for the excellence of its research and be at the forefront in generating and using new knowledge for economic and social progress, within an innovation-driven culture. The plan laid out in the report goes beyond setting numerical goals for investment and acknowledges that what is required is no less than a transformation into “a pro-innovation culture” supportive of invention, risk-taking, and entrepreneurship. The strategy focuses on a systematic and continuous approach to encouraging R&D within firms. The government will also support the development of strategic research competencies (technology platforms) based on industry needs and develop seed capital markets for early-stage ventures. The strategy calls for a national plan to increase the performance, productivity, and efficiency of research in the higher education and public sectors, thereby sustaining Ireland’s commitment to building an international reputation for research excellence. The program also aims to make Ireland a very attractive environment for high-quality researchers and research careers and develop the research commercialization expertise necessary to ensure effective and rapid exploitation by enterprise of research in the higher education and public research sectors.
|
provide some insight into the globalizing nature of the R&D environment. In the United States and in all the G-8 countries,14 most of the funding for industrial R&D is provided by industry itself. Caution is needed when considering the data in
TABLE 1.2 Top 20 R&D-Spending U.S. Corporations, 2001
|
Corporation |
R&D Rank |
R&D (million $) |
Description |
||||
|
2001 |
2000 |
1999 |
2001 |
2000 |
1999 |
||
|
Ford Motor Company |
1 |
1 |
1 |
7,400 |
6,800 |
7,100 |
Motor vehicle manufacturing |
|
General Motors |
2 |
2 |
2 |
6,200 |
6,600 |
6,800 |
Motor vehicle manufacturing |
|
Pfizer Inc. |
3 |
4 |
8 |
4,847 |
4,435 |
2,776 |
Pharmaceutical and medicine manufacturing |
|
IBM |
4 |
5 |
4 |
4,620 |
4,336 |
4,464 |
Computer systems design and related services |
|
Microsoft |
5 |
8 |
7 |
4,379 |
3,775 |
2,970 |
Software publishers |
|
Motorola |
6 |
3 |
5 |
4,318 |
4,437 |
3,438 |
Communications equipment manufacturing |
|
Cisco Systems |
7 |
11 |
20 |
3,922 |
2,704 |
1,594 |
Computer and peripheral equipment manufacturing |
|
Intel |
8 |
7 |
6 |
3,796 |
3,897 |
3,111 |
Semiconductor and other electronic component manufacturing |
|
Johnson & Johnson |
9 |
9 |
9 |
3,591 |
2,926 |
2,600 |
Pharmaceutical and medicine manufacturing |
|
Lucent Technologies |
10 |
6 |
3 |
3,520 |
4,018 |
4,510 |
Computer systems design and related services |
|
Hewlett-Packard |
11 |
12 |
10 |
2,635 |
2,646 |
2,440 |
Computer and peripheral equipment manufacturing |
|
Merck |
12 |
13 |
11 |
2,456 |
2,344 |
2,068 |
Pharmaceutical and medicine manufacturing |
|
Bristol Myers Squibb |
13 |
15 |
12 |
2,259 |
1,939 |
1,843 |
Pharmaceutical and medicine manufacturing |
|
Eli Lilly |
14 |
14 |
13 |
2,235 |
2,019 |
1,784 |
Pharmaceutical and medicine manufacturing |
|
Pharmacia |
15 |
10 |
25 |
2,195 |
2,753 |
1,290 |
Pharmaceutical and medicine manufacturing |
|
Sun Microsystems |
16 |
22 |
26 |
2,016 |
1,630 |
1,263 |
Computer and peripheral equipment manufacturing |
|
General Electric |
17 |
17 |
17 |
1,980 |
1,867 |
1,667 |
Engine, turbine, and power transmission equipment manufacturing |
|
Boeing |
18 |
24 |
22 |
1,936 |
1,441 |
1,341 |
Aerospace product and parts manufacturing |
|
Wyeth |
19 |
21 |
14 |
1,870 |
1,688 |
1,740 |
Pharmaceutical and medicine manufacturing |
|
Procter & Gamble |
20 |
16 |
15 |
1,769 |
1,899 |
1,726 |
Soap, cleaning compounds, and toilet preparations manufacturing |
|
SOURCE: NSF, Science and Engineering Indicators (2004). |
|||||||
the paragraphs that follow, because a sizable portion of the R&D cited is likely to be for product development, including design, of products, or for short-range activities such as database generation.
The OECD reports that among its member countries, government financing accounts for a small and declining share of total industrial R&D spending—rang-
ing from as little as 2 percent of industrial R&D performance in Japan to 11 percent in Italy.15 In the United States in 2001, the federal government provided about 9 percent of the R&D funds used by industry, and the majority of that funding was obtained through DOD contracts. In recent years, the United States has attracted large investments by foreign companies that perform R&D in this country (Figure 1.3). This foreign-owned R&D grew at a real average annual rate of 10.8 percent from 1994 to 2000, mostly as a result of mergers and acquisitions, compared with a real average annual rate of 6.9 percent for U.S.-owned R&D overseas.16 Foreign-owned firms conducting R&D in the United States accounted for $26.1 billion (13 percent) of the $199.5 billion in total industrial R&D expenditures in the United States in 2000.17 This share fluctuated between 11 and 13 percent from 1994 to 2000. Seven countries invested $1 billion or more in R&D in the United States in 2000: Germany, the United Kingdom, Switzerland, Japan, Canada, France, and the Netherlands, accounting for about 90 percent of all R&D expenditures in the United States by foreign-owned firms.18
Two-thirds of all R&D performed overseas in 2000 by U.S.-owned companies ($13.2 billion of $19.8 billion) took place in six countries: the United Kingdom, Germany, Canada, Japan, France, and Sweden. At the same time, emerging markets such as Singapore, Israel, Ireland, and China were increasingly attracting R&D activities by subsidiaries of U.S. corporations. In 2000, U.S.-owned R&D expenditures reached $500 million or more in each of these emerging markets, considerably more than in 1994. OECD reports that in the 20 years from 1981 to 2001, the increasing globalization of industrial R&D activities resulted in a concomitant increase in the share of foreign sources of R&D funding in many countries (Figure 1.4). The role of foreign funding in R&D varies from country to country, account-
|
15 |
OECD, Main Science and Technology Indicators (2002). |
|
16 |
NSF, Survey of Industrial Research and Development (2003). Available at http://www.nsf.gov/sbe/srs/indus/start.htm. |
|
17 |
Source: NSF Indicators report. Based on the estimated percentage of U.S. industrial performance undertaken by majority-owned (i.e., 50 percent or more) nonbank U.S. affiliates of foreign companies. Foreign R&D investments in the United States represent industry funding based on foreign ownership regardless of originating source, whereas the foreign totals for other countries represent flows of foreign funds from outside the country to any of its domestic performers. |
|
18 |
In 2000, European-owned subsidiaries accounted for $18.6 billion (71 percent) of foreign-owned R&D in the United States, a share comparable with their 67 percent share in foreign-owned gross product in the United States. The corresponding R&D shares for Canadian- and Asia/Pacific-owned subsidiaries were 14.0 and 10.9 percent, respectively. In particular, R&D activities by U.S. affiliates of foreign companies were dominated by seven investing countries with $1 billion or more in R&D expenditures. |
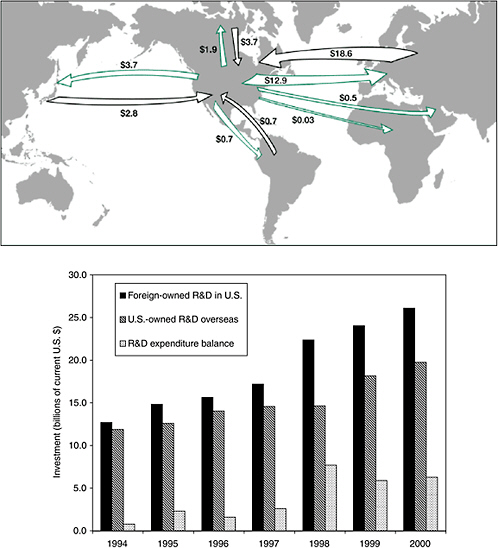
FIGURE 1.3 Foreign-owned R&D in the United States and U.S.-owned R&D overseas. Upper chart shows the flow of R&D investment into and out of the United States and the lower chart shows the trend of investments between 1994 and 2000. The European region accounted for approximately two-thirds ($12.9 billion) of all U.S-owned overseas R&D. The Asia/Pacific region ($3.7 billion, or 18.9 percent) outpaced Canada ($1.9 billion, or 9.5 percent) as a locale for U.S.-owned overseas R&D. SOURCE: NSF, Science and Engineering Indicators (2004), available at http://www.nsf.gov/sbe/srs/seind04/start.htm.
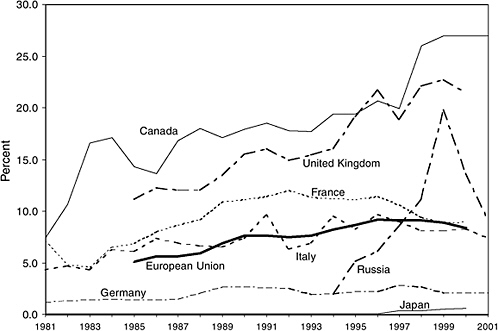
FIGURE 1.4 R&D financed by foreign sources as percentage of total industrial R&D, 1981–2001. Foreign sources of R&D funding increased in many countries between 1981 and 2001. This foreign funding came predominantly from foreign corporations but also from foreign governments and other foreign organizations. SOURCE: OECD, Main Science and Technology Indicators (2002).
ing for as little as 0.4 percent of industrial R&D in Japan to as much as 27 percent in Canada in recent years. Foreign funding as defined by the OECD predominantly came from foreign corporations but also included funding from foreign governments and other foreign organizations.19 According to a recent survey of senior executives, over half the leading companies polled plan to increase their overseas R&D investments over the next 3 years and a further 38 percent will
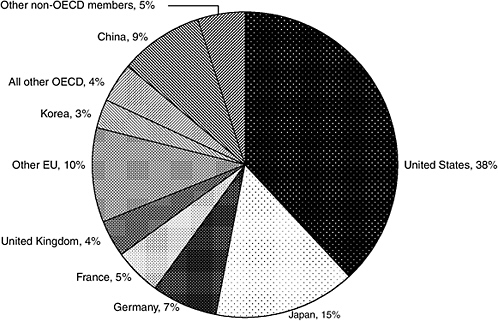
FIGURE 1.5 The United States continues to lead the world in R&D, with 38 percent of world R&D spending in 2002, according to data from the OECD. U.S. industry, government, and other sectors spend more on R&D than the entire EU combined. The U.S. share has declined only slightly from 40 percent during most of the 1990s, but other nations’ shares have changed considerably. China has increased its R&D investments dramatically in recent years and is now the third largest investor in R&D (adjusted for purchasing power), behind only Japan and the United States. South Korea is the only other country that accounted for a substantial share of the OECD total (3.1 percent in 2000, which was higher than the share of either Canada or Italy). In only four other countries (the Netherlands, Australia, Sweden, and Spain) did R&D expenditures exceed 1 percent of the OECD R&D total. SOURCE: OECD, Main Science and Technology Indicators (2004). Data gathered for 2003 or latest year available and calculations based on purchasing power parities.
sustain existing spending levels.20 Although data exist on nondomestic investments of R&D funding flowing into other countries, there are no equivalent data on foreign investments in R&D in this country. However, the importance of foreign investment in U.S. R&D is shown by the fact that approximately 13 percent of
TABLE 1.3 International R&D Expenditures and R&D as a Percentage of GDP, for Selected Countries and for All OECD Countries, 1981–2001
|
|
United States |
Japana |
Germanyb |
France |
United Kingdom |
Italy |
Canada |
Russian Federation |
Total OECD |
|
R&D expenditure (billions of constant 1995 U.S. dollars)c |
|||||||||
|
1981 |
114.5 |
39.7 |
27.8 |
17.4 |
18.2 |
7.7 |
6.0 |
NA |
254.9 |
|
1986 |
157.3 |
55.6 |
33.5 |
21.9 |
20.1 |
10.9 |
8.2 |
NA |
339.6 |
|
1991 |
176.6 |
77.6 |
42.0 |
27.2 |
20.6 |
13.4 |
9.7 |
20.5 |
415.7 |
|
2001 |
252.9 |
NA |
48.6 |
30.7 |
NA |
NA |
16.2 |
10.9 |
NA |
|
R&D as share of GDP (%) |
|||||||||
|
1981 |
2.34 |
2.11 |
2.43 |
1.93 |
2.38 |
0.88 |
1.24 |
NA |
1.95 |
|
1986 |
2.73 |
2.51 |
2.70 |
2.21 |
2.26 |
1.13 |
1.48 |
NA |
2.26 |
|
1996 |
2.55 |
2.77 |
2.26 |
2.30 |
1.88 |
1.01 |
1.69 |
0.90 |
2.13 |
|
2001 |
2.82 |
NA |
2.53 |
2.20 |
NA |
NA |
1.94 |
1.16 |
NA |
|
aData on Japanese R&D in 1996 and later years may not be consistent with data in earlier years because of changes in methodology. bData for 1981–1990 are for West Germany. cConversions of foreign currencies to U.S. dollars are calculated with each country’s GDP implicit price deflator and with OECD purchasing power parity exchange rates. SOURCE: OECD, Main Science and Technology Indicators (2002). |
|||||||||
funds spent on industrial R&D in 2000 is estimated to have come from majority-owned affiliates of foreign firms investing domestically.21
Notwithstanding the globalizing trend, it is interesting to note that, worldwide, R&D performance remains concentrated in only a few industrialized nations. The OECD reports that of the $603 billion in estimated R&D expenditures for the 30 OECD countries in 2000, 85 percent is expended in only 7 countries (Figure 1.5). While in absolute numbers the United States is dominant among R&D spenders, analyzing expenditure as a fraction of economic activity provides an interesting perspective (Table 1.3 and Figure 1.6). OECD reports that between 1995 and 2002 China doubled its R&D spending, from 0.6 percent to 1.2 percent of GDP.22 By comparison, overall R&D spending in OECD countries rose only
|
21 |
The figures used here to approximate foreign involvement are derived from the estimated percentage of U.S. industrial performance undertaken by majority-owned (i.e., 50 percent or more) nonbank U.S. affiliates of foreign companies. The U.S. foreign R&D totals represent industry funding based on foreign ownership regardless of originating source, whereas the foreign totals for other countries represent flows of foreign funds from outside the country to any of its domestic performers. |
|
22 |
OECD, Science, Technology and Industry Outlook (2004). Available at http://www.oecd.org. |
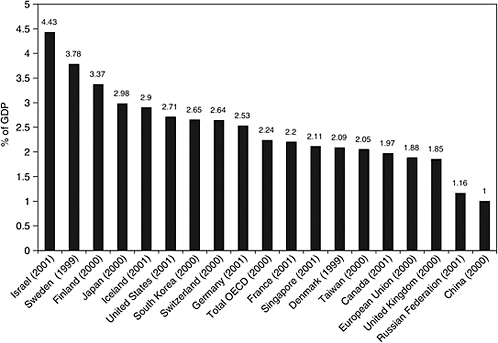
FIGURE 1.6 R&D expenditure as a percentage of GDP. Overall, the United States ranked fifth among OECD countries in terms of reported R&D/GDP ratios and sixth when Israel (not an OECD member country) is included. Israel, devoting 4.4 percent of its GDP to R&D, led all countries, followed by Sweden (3.78 percent), Finland (3.37 percent), Japan (2.98 percent), and Iceland (2.9 percent). SOURCE: OECD, Main Science and Technology Indicators (2002).
moderately in proportional terms, to 2.26 percent of GDP from 2.09 percent in 1995. In 2002 the R&D expenditure of all 25 EU member states stood at 1.93 percent of GDP, an increase from 1.82 percent in 1998. In the United States, R&D performance as a proportion of GDP rose, from 2.40 percent in 1994 to 2.69 percent in 2000, as growth in R&D outpaced the growth of the overall economy. Looking ahead, a number of countries have set long-term targets for increasing R&D spending, with Austria aiming for 2.5 percent of GDP by 2006, Germany 3.0 percent by 2010, and the United Kingdom 2.5 percent by 2014. Canada has set for itself the target of being among the top five OECD countries with respect to investments in R&D, and Korea has committed to doubling its investment between 2003 and 2007.
OECD countries accounted for 97.6 percent of patent applications to the European Patent Office (EPO) in 1999 and for more than 95 percent of patents
granted by the U.S. Patent and Trademark Office (USPTO) in 1998. In 1999, Israel—at 122 patent applications per million population—was the only non-OECD economy whose patent applications at the EPO exceeded the OECD average of 88. In 1998, Taiwan had 223 patents granted at the USPTO per million population. Non-OECD economies accounted for only 1.5 percent, up from 1 percent in 1991.


