
5
Renewable Energy Policies, Markets, and Deployment in China and the United States
By reducing some of the risks perceived by the private sector, leveraging financing, and increasing capital flows for R&D, policy plays a central role in the deployment of renewable energy technologies. Beyond technological challenges are significant hurdles in the marketplace. Renewable projects will require large investments in infrastructure, which the private sector might consider risky, unless they have sufficiently funded, consistent incentives. In the form of incentives, policy can also sustain industry sales until manufacturers achieve cost reductions from learning opportunities and economies of scale. The United States and China have historically taken different approaches to policy making in the energy sector, partly because they have different needs and priorities and partly because they have different systems of government. These factors can make it difficult to comparatively analyze policies, or to find common ground for cooperation on policy-related matters. Nonetheless, given the important role that policy will continue to play in both countries’ efforts to scale up the use of renewable energy, this chapter highlights the strategic approaches that China and the United States are taking,1 and identifies some areas of common interest. It also summarizes potential constraints in the marketplace, and discusses opportunities to strengthen the market infrastructure.
RENEWABLE ENERGY POLICY IN CHINA
The Role of Government
China’s energy policy is developed through a two-step approach. The central government first develops broad policy goals and communicates them every five years in its Five Year Plans. Ministries, agencies, and the National People’s Congress then use the plans to design targeted, specific policies. China’s 10th and 11th Five Year Plans (2000-2005, 2006-2010) were the first to include goals for renewable energy development.
China’s increased focus on renewable energy requires coordinated action from many entities and groups outside the central government and government agencies. In January 2010, the government announced the creation of the National Energy Commission (NEC) to streamline China’s energy operations and coordinate activities by the National Energy Bureau (NEB) and the National Energy Administration (NEA), which tend to overlap with the mandates of other ministries. The NEC will also assume many of the energy-focused activities of the National Development and Reform Commission (NDRC) and the Ministry of Finance. The goals of the NEC are to devise China’s energy strategy, ensure the country’s energy security, and coordinate cooperative programs.
One of China’s main goals in developing renewable energy has been to supply off-grid electricity to more than 2 million rural households that have no access to electricity. Another goal is to address concerns about the long-term environmental impacts of coal-fired electricity generation. China has acknowledged the potential impact of increased greenhouse gas (GHG) emissions on climate, and China has already taken several steps to reduce emissions of regionally important criteria air pollutants, such as particulates, sulfur dioxide, and nitrous oxide (NAE/NRC/CAS/CAE, 2007). Among other things, these reductions have served as a response to civil unrest in recent years to protest energy-related pollution. Even more important, however, China sees renewable energy as a potentially lucrative economic opportunity, particularly in the global market for clean technologies. In 2009, for example, more than 90 percent of photovoltaic (PV) cells produced in China were exported.
General and Targeted Policies
In China’s 11th Five Year Plan, its broad renewable energy policy goal is to “accelerate renewable technology advancement and industrial system development … specifically supporting the technology breakthrough and industrialization of bio-liquid fuel, wind power, biomass power, and solar power.” This goal is supported by a series of suggested measures and incentives, shown in Tables 5-1 and 5-2. Four important policies in defining China’s renewable energy landscape are: Renewable Energy Law of the People’s Republic of China, which outlines policy goals; Medium and Long-Term Development Plan for Renewable Energy
TABLE 5-1 Direct Renewable Energy Policies in China
|
Dates |
Policy |
Details |
|
February 2005 |
The Renewable Energy Law of the People’s Republic of China |
Outlines mid-range policy goals of the government surrounding renewable energy. It provides only general guidance and so does not set prices. The price authorities of the State Council set them. |
|
November 2005 |
Renewable Energy Industry Development Guidance Catalogue |
Sets industrial development targets covering the field of wind, solar, bio, geo, ocean, and hydropower using the top performing projects in each field. |
|
January 2006 |
Interim Measures for Renewable Energy Power Price and Cost-Sharing |
Mandates the purchase of renewable energy over the national grid, either based upon the Government Fixed Price or the Guidance Price of the Government (awarded tariff of the bid winner). Outline pricing policies of electricity from renewable sources:
Biomass feed-in tariff shall be set by the yardstick feed-in tariff for desulpherizing coal-fired units in 2005 plus the subsidy price for biomass, which was raised to 0.35 CNY/kWh in 2008. Biomass projects shall receive the subsidy for 15 years after the beginning of production. |
|
January 2006 |
Management Rules of Renewable Energy Power Generation |
Assigns management bodies to approve, manage, and monitor various categories of renewable projects on a central and provincial level. Mandates detailed responsibilities of the power generating companies and the grid companies to develop renewable energy power generation. |
|
May 2006 |
Interim Measures for Management of Special Fund for Development of Renewable Energy |
Detailed codes for supporting key areas, such as funding, management, and assessment. |
|
August 2007 |
Medium and Long-Term Development Plan for Renewable Energy in China |
Mandates that the share of renewable energy consumption must reach 10 percent by 2010 and 15 percent by 2020. |
|
March 2008 |
The Renewable Energy Development Planning during 11th Five Year Planning Period |
Establishes priorities and targets for renewable energy development during the 11th Five Year Planning Period. |
|
July 2009 |
Feed-in-tariff rates for four categories of onshore wind projects |
Tariffs vary by quality of wind resource area: 0.51 CNY/kWh; 0.54 CNY/kWh; 0.58 CNY/kWh; 0.61 CNY/kWh. |
|
December 2009 |
The Amendment to the 2006 Renewable Energy Law |
Mandates power grid operators to buy all the electricity produced by renewable energy generators within their region. |
TABLE 5-2 Indirect Renewable Energy Policies in China
|
Dates |
Policy |
Details |
|
2006–2010 |
National 11th Five Year Plan for Environmental Protection |
Outlines the national agenda during the 2006–2010 administrative period. The plan bases itself on the 11th Five Year Plan and the Implementation of the Scientific Outlook on Development and Strengthening Environmental Protection. Specific goals include to:
|
|
2000 |
10th Five Year Plan for Energy Conservation and Resources Comprehensive Utilization |
Outlines the national energy resource agenda for the 2000–2005 administrative period with a focus on efficiency, energy conservation, consumption reduction, and comprehensive resource utilization. This includes:
|
|
2006 |
11th Five Year Plan for the Development of the Environmental Protection Industry |
Outlines the national agenda for the 2006–2010 administrative period with a focus on environmental protection. This includes:
|
in China, which establishes thresholds for renewable energy; Interim Measures for Management of Special Fund for Development of Renewable Energy; and Policy and Price of Electricity Generated by Renewable Energy, which describes pricing policies.
Renewables, except for hydropower, are still more expensive than fossil fuels, partly because of long-term subsidies for fossil-fuel power. Pricing policies are, therefore, important to providing incentives for the increased deployment of renewables. One approach consists of feed-in tariffs that force energy utilities to purchase renewable energy at a fixed price and connect it to the grid. Another approach is tendering, a government-run bidding process for contracts that supply renewable energy. Feed-in tariffs have benefited biomass power and solar power; tendering has benefited wind power, although in 2009 tendering was replaced by a feed-in-tariff. As China expands the use of feed-in-tariffs, it may need to consider increasing the quota and rate, to encourage larger scale commercial projects. Feed-in tariffs account for the bulk (~90 percent) of China’s national subsidies for renewable energy development, leaving a comparatively small percentage of national support for R&D and other “upstream” efforts to improve technologies and reduce costs.
Chinese policies address biofuel production, but overall, China’s biomass policy focuses on heat and power generation rather than alternative transportation fuels. Because of concerns about the impact of biofuels on the food supply, in 2006 the government prohibited the production of ethanol from food grains. The production of ethanol from non-food feedstocks (such as cassava, sweet sorghum, Jatropha Curcas, Pistacia Chinensis, Tung, and cottonseed) continues.
Impact and Challenges
Hydroelectric projects dominate the Chinese renewable energy landscape, reflecting the long history of policies promoting electrification regardless of the energy source. The country also has the resources, the know-how to take advantage of them, and a centralized approach to policy making that is well suited to the development of large hydro projects, such as the Three Gorges Dam. The deployment of other renewable energy sources, with the recent exception of wind farms, continues to be an uphill struggle in most areas because of widely available, low-cost, fossil-fuel energy.
One of the most important renewable energy policies in China is the Medium and Long Term Development Plan for Renewable Energy. This policy has a specific goal of increasing the share of clean energy (to include large hydro and nuclear) to 10 percent of primary energy consumption by 2010 and 15 percent by 2020. Achieving or exceeding these targets will likely require China to address some related policy issues that could otherwise impede progress.
Enforcement
China will need to strengthen environmental regulations to address some environmental impacts of renewable energy production, and enhance local capacity to enforce regulations. Although the central government plays the largest role in implementing renewable energy policy, the enforcement of environmental regulations is left to provincial governments. A number of provincial leaders regard enforcement of environmental regulations as a secondary or tertiary concern. Some authorities have even exerted influence over regulatory agencies that have attempted to report inadequate environmental enforcement (Canfa, 2007). Lax enforcement of environmental regulations has several important implications for the renewable energy industry, namely: (1) the price of coal-fired power remains artificially low if pollution controls are bypassed, (2) as manufacturing of renewable energy technologies increases, inefficient and highly polluting processes could serve to undermine confidence in the fledgling industry, and (3) as renewable power plant installations increase in quantity and scale, site-specific environmental impacts, if not properly managed, could undermine support for a further proliferation of these projects.
Grid Integration
The expansion of the electricity grid has not always kept up with the construction of new renewable energy projects. The 2006 Renewable Energy Law stipulates that grid utilities must connect renewable energy developments to the electricity grid, and grid operators are awarded a subsidy based on distance: 0.01 Chinese yuan renminbi (CNY) per kWh within 50 km, 0.02 CNY per kWh for 50 to 100 km, and 0.03 CNY per kWh for distances of more than 100 km.
However, connecting with the grid requires more than just new construction. It requires training grid operators to manage the intermittency of the renewable power supply, which often requires the modernization of grid technology to make the electrical distribution system more predictable and manageable. It also sometimes requires balancing services, which in China’s case frequently means additional coal-fired power (whereas the United States will typically rely on natural gas).
A relatively large portion of China’s wind projects have not been connected to the main electricity grid, particularly in Inner Mongolia and Gansu. There are various reasons for this, including the lack of available transmission interconnections. However, in many cases individual wind farm project development is simply outpacing regional plans for power development and transmission. Projects are also sometimes constructed without the necessary permits and authorization—this can result in either an excess of wind capacity that must routinely be curtailed, or poorly constructed projects that are difficult and expensive to integrate without causing severe disruptions to the grid.
Social Resistance
The construction of hydroelectric projects such as the Three Gorges Dam has caused substantial population displacements in China. Hydroelectric projects have displaced millions of people in the past few decades, and hydropower projects continue to arouse resistance. In 2004, approximately 100,000 farmers staged a sit-in to denounce the building of a 186-meter high dam in Hanyuan in Sichuan Province. Although there have not been such demonstrations against wind farms or other renewables development, this could be a potentially important issue for future projects. Transmission projects, particularly long-distance corridors crossing multiple provinces, are likely to be a part of China’s overall plans to develop large wind and solar bases in remote provinces. Thus, it may be useful to engage all of the affected communities at the outset of transmission planning, in order to identify potential impediments to developing these large projects.
RENEWABLE ENERGY POLICY IN THE UNITED STATES
Role of Government
As noted in Chapter 1, there are many drivers for increasing the deployment of renewable energy in the United States. Chief among these, as reflected in current policy debates, are the desires to substantially reduce GHG emissions from the power and transportation sectors and to identify more sustainable, long-term sources of energy. Within the transportation sector especially, national security concerns are another driver; the United States imports approximately 65 percent of its oil, some of it from politically unstable regions. James Jones, the U.S. National Security Advisor, has described the nation’s reliance on foreign oil as “one of the most important and pressing national security challenges of this century” (Jones, 2008). Finally, job creation is another rationale for increasing the deployment of renewable energy. In policy discussions, the renewable energy sector, and its associated jobs in manufacturing, construction, and operation of facilities, constitute a portion of the so-called “green jobs” sector.
The U.S. Department of Energy (DOE) is critical to energy-related legislation in the United States and to energy-related research and conservation. DOE also supports the development of a variety of energy policies. Recent legislation related to DOE activities include the Energy Policy Act of 2005 and the Energy Independence and Security Act of 2007, which was the last comprehensive energy bill passed in the United States. As of July 2010, comprehensive federal legislation on energy was still pending in the House of Representatives (H.R. 2454 American Clean Energy and Security Act) and the Senate (American Clean Energy Leadership Act).
The Environmental Protection Agency (EPA) is responsible for developing U.S. environmental regulations. Although EPA is not a cabinet agency, it is respon-
sible for enforcing compliance with the Clean Air Acts and has devised a number of energy efficiency programs, such as Energy Star, as well as fuel-economy standards. In addition, in December 2009, EPA issued an Endangerment Finding, a prerequisite to finalizing proposed standards for greenhouse gas emissions. A major impact of this finding would be restrictions on the availability, and increases in the prices of, fossil fuels, especially coal. Thus, the finding would have a major impact on the development of renewable energy in the United States.
State governments encourage the adoption of renewable energy through the implementation of state programs and Renewable Portfolio Standards (RPS). In 2007, California, for example, instituted the California Solar Initiative, which initially offered a cash incentive of $2.50 (decreasing over time) per watt of PV modules installed. States have often been referred to as “laboratories” for policy experimentation, and this has been the case for renewable energy policies since the early 2000s (NAE/NRC/CAS/CAE, 2007). As of July 2010, 29 states and the District of Columbia have an RPS, while an additional 7 states have set portfolio goals. Comprehensive information on state-level incentives is available through the Database of State Incentives for Renewables & Efficiency (DSIRE, www.dsireusa.org).
General and Targeted Policies
Renewable energy policy in the United States is shaped at the federal, state, and local levels. The key policy tools at the federal level include the Federal Production Tax Credit (PTC), the Investment Tax Credit (ITC), and the Modified Accelerated Cost-Recovery System (MACRS). These policies have provided economic incentives and subsidies that have made the final production price of renewable energy more cost competitive with traditional fossil fuels.
Newer federal proposals may impact the U.S. renewable energy sector in the future. These include the federal RPS, carbon-pricing legislation, and regulations for electricity transmission and distribution. Combined with established fuel subsidies, the federal Renewable Fuel Standard (RFS) could be particularly effective at making alternative transportation fuels more cost competitive. Palmer and Burtraw (2005) have found that a federal-level RPS would be more cost-effective in promoting renewables than a PTC or a carbon cap-and-trade policy. Critics of a federal RPS point out that it favors renewables over other sources, notably nuclear and coal with carbon capture and sequestration (CCS), that could also deliver low-carbon electricity.
A state’s RPS can be more stringent than a federal renewable energy mandate. This is significant because a state with a large consumer market that adopts relatively stringent environmental regulations can influence the enactment of those regulations on a national level. For example, a relatively stringent CAFE (fuel economy) regulation in California is a strong incentive for auto manufacturers to adopt the standard for all U.S. vehicles in order to gain access to the large California market.
On February 13, 2009, the U.S. Congress passed the American Recovery and Reinvestment Act (ARRA), commonly referred to as the U.S. stimulus package. ARRA includes economy-wide funding but does have some specific provisions that support renewable deployment. New federal funding was made available through:
-
cash grants in lieu of investment tax credits under a program administered by the U.S. Department of Treasury
-
loan guarantees underwritten by the U.S. Department of Energy
Approximately $43 billion of ARRA funds were dedicated to “clean energy” projects, and $36.7 billion of this is being administered by DOE. Of that sum, $4.5 billion is to be spent on smart grid applications, $4 billion for loan guarantees, $2.3 billion in manufacturing tax credits, and $2.5 billion for research, development, and demonstration within DOE’s Office of Energy Efficiency and Renewable Energy.
The RPS, the most often used state-level policy to encourage renewable energy development, is complemented by tax credits and other incentives. However, some states have not mandated RPS because of scarce renewable energy resources, opposition to the federal expansion of electricity transmission, and interstate competition. Some states, notably California, have also implemented feed-in-tariffs, and a national feed-in-tariff continues to be a subject of debate but has, to date, not been formally proposed in Congress.
Green-power marketing (i.e., marketing and selling power from renewable sources to end-users) is one factor to consider when introducing a policy that targets renewables. These voluntary purchases of power represented about 0.6 percent of all electricity sales in 2008 (Bird et al., 2009). It is still unclear whether introducing new renewable energy policy will stimulate new markets for renewables or simply recapture the already present interest in this voluntary market.
Impact and Challenges
Tables 5-3 and 5-4 list policies that directly and indirectly impact renewable energy production and consumption in the United States. Figures 5-1 and 5-2 illustrate the different levels of federal incentives for energy development from 1950 to 2006. These figures demonstrate that the fossil-fuel sector (particularly oil) has historically benefitted from a range of subsidies and other government incentives. Incumbent technologies in these sectors continue to be dependent on federal incentives, with an emphasis on tax policy and regulation. Figure 5-3 illustrates the impacts of the federal production tax credit (PTC), a key driver in the U.S. renewable energy sector—it has cycled on and off, thus making it difficult to plan for large-scale projects.
TABLE 5-3 Direct Renewable Energy Policies in the United States
|
Dates |
Policy |
Level |
Sector |
Form |
About |
|
1997–present |
Renewable Portfolio Standard (RPS) |
States and territories (44) |
Electricity |
Command-and-control (with trading) |
The standard varies significantly depending on the state (typically 10 to 30 percent) and the type of renewable energy source. Adding all the RPSs for the different states shows that 60GW of renewables will be placed online over the next decades. |
|
1994–present |
Production Tax Credit |
Primarily federal |
Electricity |
Financial incentives |
Mandates 2.1 cent tax credit per KWh of electricity generated in the first 10 years of new renewables projects. |
|
1986–present |
Modified Accelerated Cost-Recovery System (MACRS) |
Federal |
Electricity |
Financial incentives |
By allowing a wide variety of renewable electricity assets to be declared as depreciating rapidly, this system indirectly reduces the tax burden on entities building renewable energy capacity. In some cases this can be very significant. Prior to MACRS (from 1975–1983), a similar system, the Accelerated Cost Recovery System (ACRS), was in place. |
|
2005–present |
Investment Tax Credit (ITC) |
Federal |
Electricity |
Financial incentives |
This mandates a 30 percent tax credit for solar power, fuel cells, and small wind <100 kW, and 10 percent for geothermal, micro turbines, and combined heat and power. Note that the American Reinvestment and Recovery Act of 2009 allowed all PTC eligible renewable sources to receive the ITC in-lieu of the PTC. |
|
2005–present |
Renewable Fuel Standard (RFS) |
Primarily Federal |
Transport |
Command-and-control (with trading) |
The 2007 Energy Independence and Security Act mandated a substantial increase in the use of biofuels over the level established by the Energy Act of 2005. The Energy Act of 1992 gave DOE the authority to require alternative fuels, but only in certain federal fleets. |
|
1997–present |
Public benefit funds |
States |
Electricity |
Financial incentives |
Several states tax electricity and use a portion of the tax revenues to fund a wide variety of projects and subsidies for renewable power. |
|
Dates |
Policy |
Level |
Sector |
Form |
About |
|
1978–present |
Tax credits, grants, rebates, low-interest loans |
Federal, states (49) |
Primarily electricity |
Financial incentives |
Every U.S. state except Arkansas provides some form of financial assistance to renewable energy, although the nature and extent of this assistance varies considerably. Tax exemptions are a common theme. |
|
Varies |
State goals |
States (5) |
Primarily electricity |
Goal setting |
Five states that have not established binding renewable energy targets have established nonbinding goals instead. |
|
2009 |
25 percent renewable energy by 2025 |
Federal |
All |
Goal |
President Obama has called for the United States to meet 25 percent of its energy needs with renewable energy by 2025. |
|
2009 |
Doubling renewable energy in 3 years |
Federal |
All |
Goal |
President Obama has called for the United States to double its production of renewable energy in 3 years. |
|
1978–present |
Renewable fuel subsidies |
Federal |
Transport |
Financial incentives |
Federal subsidies for renewable fuels have gone through various permutations since the Energy Tax Act of 1978. The current level is 45 cents per gallon for corn ethanol, 65 cents per gallon for cellulosic ethanol, and $1 per gallon for biodiesel. |
TABLE 5-4 Indirect Renewable Energy Policies in the United States
|
Dates |
Policy |
Level |
Sector |
Form |
About |
|
1980–present |
Subsidies for alternative fuels |
Primarily federal |
Transport |
Financial incentives |
Typically collect a small surcharge on electricity sales to use for subsidizing renewable in other ways. As of 2004, more than $300 million invested annually. |
|
200–present |
Green power purchasing |
States (mandatory in 7) |
Electricity |
Financial incentives |
Protocol by which consumers can pay a surcharge on their electricity prices to “buy” renewable power. Obvious difficulty is that utility cannot choose which electrons go to which consumers; raises questions of additionality. |
|
2009–present |
GHG controls |
States/Regional (RGGI, WCI, MGGRA) |
All |
Command-and-control (with trading) |
Any emissions trading or carbon tax legislation would likely lead to a substantial and sustained competitive advantage for renewable power sources. If emission-trading legislation passes, one key question would be the allocation of emission permits. Depending on their distribution, renewable power could be heavily affected. |
|
1975–present |
CAFÉ standards |
Federal, State (1) |
Transport |
Command-and-control (with trading) |
CAFE fuel efficiency standards do not fully apply to alternative fuels, thereby encouraging adoption of alternative fuels, including renewable fuels. |
|
Many states in 1996 |
Net metering |
States (39 as of 2004) |
Electricity |
Protocol setting |
Allows end-users with installed power sources to sell excess power to the grid. Particularly useful to renewable power sources because of near-zero marginal cost of generation and inability to switch off. Other sources can be used as well. |
|
1970s to present |
R&D funding |
Primarily federal |
All |
Research |
Wide variety of research funding, such as $2.5 billion for research in the stimulus package to energy efficiency and renewable energy. |
|
Varies |
State goals |
States (5) |
All |
Goal setting |
Five states that do not have renewable portfolio standards have renewable portfolio goals. |
|
Source: North Carolina Solar Center and U.S. Department of Energy Office of Energy Efficiency and Renewable Energy, Database of State Incentives for Renewables & Efficiency (accessed June 2009 at http://dsireusa.org/). |
|||||
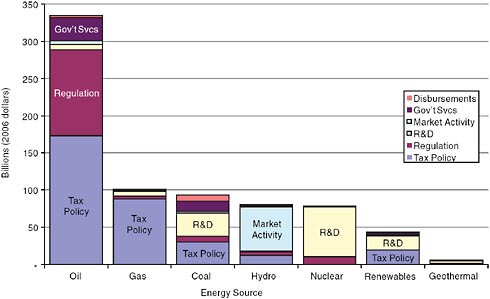
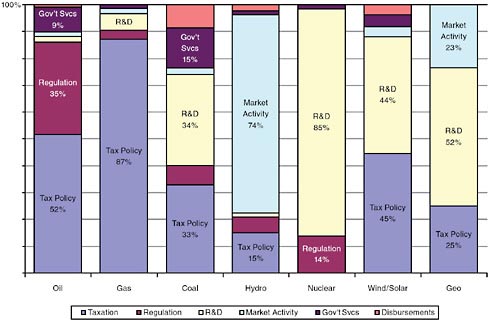
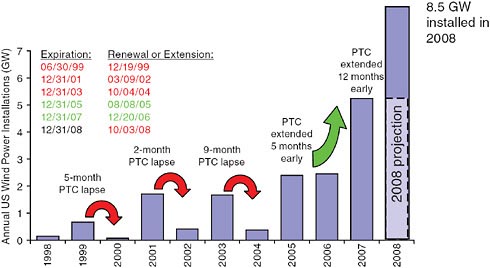
FIGURE 5-3 Fluctuations in wind power deployment and correlation with PTC. Adapted from Wiser, 2008.
The price of renewable energy depends on a variety of factors, such as resource strength, transmission costs, grid-integration costs, and policy (Brown and Busche, 2008). Historically, public policy and incentives have not been sufficient to support widespread deployment. Some project developers have tried “subsidy stacking”—pooling multiple sources of public funding to finance projects to overcome the high cost of infrastructure for renewables. Unless new policies are enacted, EIA (2010a) projects that renewable energy will remain a relatively small share of overall energy capacity in 2035. However, even with short-term price increases in recent years due to high demand and some material shortages of renewables, prices have declined overall and have met overall price projections from previous analyses.
COMPARISON OF ENERGY POLICIES
Although both China and the United States have implemented policies to promote the expansion of renewable energy in their respective markets, their general approaches to policy making differ dramatically. Table 5-5 presents a side-by-side timeline of major renewable energy policy events in each country.
If the United States has developed a “carrot on a stick” approach to ease the entry of renewables into its energy market, China has opted for simply “using the stick” by mandating both the production and consumption of renewable energy. The central government also uses feed-in tariffs (similar to those in Germany) and dictates prices to electric grid operators, who are required, by law, to connect renewable energy sites to the provincial and national electricity grids. In contrast,
TABLE 5-5 Timeline of Events in U.S. and Chinese Renewable Energy Policy
|
Year |
Developments in the U.S. Renewables Policy |
Developments in China’s Renewables Policy |
|
1978 |
Public Utilities Regulatory Policy Act enacted, which requires public utilities to purchase power from qualifying renewable facilities. Energy Tax Act provides personal income tax credits and business tax credits for renewables. |
|
|
1980 |
Federal R&D for renewable energy peaks at $1.3 billion ($3 billion in 2004 dollars). Windfall Profits Tax Act gives tax credits for alternative fuels production and alcohol fuel blending. |
|
|
1983 |
|
Suggestions to Reinforce the Development of Rural Energy. |
|
1992 |
California delays property tax credits for solar thermal (also known as concentrating solar) power, which causes investment to stop. |
China Agenda 21 Release of 10 Strategies on China’s Environment and Development |
|
1994 |
Federal production tax credit (PTC) for renewable electricity takes effect as part of the Energy Policy Act of 1992. |
Brightness Program and Ride the Wind Program, formulated by the State Planning Commission, now the National Development and Reform Commission. |
|
1995 |
|
State Science and Technology Commission (now the National Development and Reform Commission) Blue Paper No. 4: China Energy Technology Policy |
|
|
|
Outline on New and Renewable Energy Development in China, State Planning Commission, State Economic and Trade Commission (SETC) (Now incorporated by Ministry of Commerce) |
|
|
|
Electric Power Law |
|
|
|
New and Renewable Energy Development Projects in Priority (1996-2010) China, by SSTC, State Power Corporation, and SETC |
|
Year |
Developments in the U.S. Renewables Policy |
Developments in China’s Renewables Policy |
|
1996 |
Net metering laws started to take effect in many states. |
Guidelines for the Ninth Five-Year Plan and 2010: Long-Term Objectives on Economic and Social Development of China State Energy Technology Policy Ninth Five-Year Plan and 2010 Plan of Energy Conservation and New Energy Development by the State Power Corporation |
|
|
|
Ninth Five-Year Plan of Industrialization of New and Renewable Energy by SETC |
|
1997 |
States begin to establish policies for renewable portfolio standards (RPS) and public benefits funds (PBF) as part of state electricity restructuring. |
Circular of the Communication and Energy Department of SPC on Issuing the Provisional Regulations on the Management of New Energy Capital Construction Project Energy Saving Law |
|
1998 |
|
Incentive Policies for Renewable Energy Technology Localization by State Development and Planning Commission (Now the National Development and Reform Commission (NDRC) and Ministry of Science & Technology (MOST) |
|
1999 |
|
Circular of MOST and SDPC on Further Supporting the Development of Renewable Energy |
|
2000 |
Federal production tax credit (PTC) expired in 1999 is not renewed until later this year, causing the wind industry to suffer a major downturn in 2000. Note that the PTC also expired in 2002 and 2004, both times causing a major slowdown in capacity additions. |
10th Five-Year Plan for Energy Conservation and Resources Comprehensive Utilization |
|
2001 |
Some states begin to mandate that utilities offer green power products to their customers. |
10th Five-Year Plan for New and Renewable Energy Commercialization Development by SETC Adjustment of Value-Added Tax for Some Resource Comprehensive Utilization Products by Ministry of Finance (MOF) and State Tax Administration |
|
|
|
Electricity Facility Construction in Non-Electrification Townships in Western Provinces of China or Township Electrification Program by SDPC and MOF |
|
Year |
Developments in the U.S. Renewables Policy |
Developments in China’s Renewables Policy |
|
|
|
Renewable Energy Promotion Law Rural Energy Development Plan to 2020 for Western Areas |
|
2004 |
Five new states enact RPSs in a single year, bringing the total to 18 states plus Washington, DC; PBFs were operating in 15 states |
|
|
2005 |
Energy Policy Act extends the PTC for wind and biomass for 2 years and provides additional tax credits for other renewable including solar, geothermal, and ocean energy. |
|
|
2006 |
|
Management Rules of Renewable Energy Power Generation Interim Measures for Renewable Energy Power Price and Cost-Sharing Interim Measures for Management of Special Fund for Development of Renewable Energy National 11th Five-Year Plan for Environmental Protection 10th Five-Year Plan for the Development of the Environmental Protection Industry |
|
2007 |
Energy Independence and Security Act of 2007 provided support for accelerating research and development on solar, geothermal, advanced hydropower, and electricity storage. |
Medium and Long-Term Development Plan for Renewable Energy in China |
|
2008 |
27 states and the District of Columbia have enacted RPSs and another 6 states have adopted goals for renewable electricity. Emergency Economic Stabilization Act extends the PTC for one year and the investment tax credit for residential and commercial solar through 2016. |
The Renewable Energy Development Planning during 11th Five Year Planning Period. |
|
2009 |
American Recovery and Reinvestment Act extends the PTC for wind through 2012 and the PTC for municipal solid waste, biopower, geothermal, hydrokinetic, and some hydropower through 2013. It also provides funding for research and updating the electricity grid. |
Mandates power grid operators to buy all the electricity produced by renewable energy generators under their region. Feed-in-tariff established for onshore wind power projects, replacing public bidding process. |
the United States tends to favor market-based policies (e.g., PTC) to provide incentives for renewable energy use. Even U.S. quotas, like the RFS and state RPS, rely increasingly on market mechanisms to reduce the cost of compliance.
In the United States, job creation is a recurrent theme in the rationale for legislation in the United States (e.g., H.R. 6049, The Renewable Energy and Job Creation Act of 2008). China also considers renewable energy production a means of creating jobs, which numbered 1.12 million in the renewable energy sector in 2008 (CREIA, 2009). However, China also considers renewables development a means of economic and technological development. This sounds like a subtle distinction, but because of the nature of China’s centralized planning approach to growing its economy, this means that the renewables sector is featured prominently in discussions of national investments in R&D, manufacturing capabilities, and overseas markets.
Both countries express concerns about the environmental impact of fossil-fuel combustion. China has focused its efforts on reducing emissions of particulates, sodium oxide, and nitrogen oxide. According to the Mid-Term and Long-Term Renewable Energy Development Plan, “The “2020 goal [of renewable energy production] is equivalent to an annual emissions reduction of 8 million tons of sulfur dioxide, 3 million tons of nitrogen oxide, 4 million tons of smoke and dust, 1.2 billion tons of carbon dioxide.” The United States is also concerned about nitrous and sulfur oxides emissions, as well as GHG emissions. In November 2009, the White House proposed a goal to reduce GHG emissions by 83 percent by 2050.
Renewable energy has given China an opportunity to provide much needed electrical generating capacity in rural areas that are not connected to the grid. This situation mirrors the historical experience in rural communities of the United States. Since 1936, the U.S. Department of Agriculture has made direct loans and provided loan guarantees for electrification of rural areas, including guaranteed loans for renewable energy projects. In addition, biomass-based renewables can boost agriculture-based economies in the impoverished central and western provinces of China. In the United States, there is growing interest in using biomass to co-fire coal power plants, or in some cases, convert coal combustion facilities to biomass-based combustion facilities.
China and the United States have different attitudes toward the place of biofuels in their energy policies. The United States considers the development of biofuels relatively more important than China does because of concerns about energy security and transportation fuels. Ethanol, which constitutes more than 90 percent of the biofuel produced in the United States, is also a primary additive used to reformulate gasoline in order to meet oxygenate requirements under the Clean Air Act. China shares some of these concerns, particularly in light of the rapid increase in personal vehicle use, and has implemented pilot projects mandating ethanol blends in certain regions of the country. However, China’s energy policy does not place nearly as much emphasis on biofuels as U.S. policy. One of the main drivers for biofuel production in China is the development of the rural economy.
POTENTIAL CONSTRAINTS ON DEPLOYMENT
Materials
A scarcity of key raw materials necessary to renewable energy technologies can keep manufacturing prices high. The wind energy sector, for example, is experiencing competition-driven shortages for some key materials. Table 5-6 lists the projected material requirements for the United States to meet a goal of producing 20 percent of its electricity from wind energy by 2030, which will require installing at least 7,000 turbines per year for 13 years beginning in 2017 (DOE, 2008a). Thus, trade issues and export/import controls can be a factor in accelerating or hindering the rapid deployment of wind power electricity and other renewables.
Rare-earth elements, one type of material in short supply, are used in the permanent magnets of wind turbines. These same materials are in great demand for an array of electronic devices. China currently accounts for almost 97 percent of the world’s production of rare-earth elements. Although the United States also has some, mining operations for these compounds ceased a decade ago because of high production costs. With recent increases in market prices, however, the United States may soon re-initiate operations.
China could satisfy its requirements for steel and copper for wind turbine production but will have to improve its smelting processes to improve the quality of those materials. The composite materials necessary for manufacturing wind turbine blades include epoxy resin, glass fiber, adhesives, and foam core. Epoxy resin and glass fiber can be produced in China, but adhesives and foam core must be imported.
As PV production scales up, shortages of semiconductor materials can become an impediment. A shortage of silicon for PV production can also be a problem but is relatively easy to solve. Silicon in raw form is widespread throughout the world. The bottleneck is created by the shortage of purification plants, rather than the shortage of silicon itself. In fact, China’s rapid investment (since 2005) in silicon purification contributed partly to recent decreases in the price of silicon-based PV panels, though the country now faces a problem of overcapacity, relative to global demand. Feedstocks for thin-film PV, particularly tellurium for cadmium telluride panels and indium for copper, indium, gallium, and selenide cells, could potentially be limiting factors if production of thin films scales up quickly. Obtaining sufficient quantities of these metals, although relatively abundant in nature, may require additional investments in extraction, refining, and recovery (i.e., recycling products containing the metals) (Fthenakis, 2009).
Workforce
The lack of skilled workers can limit the large-scale manufacturing and deployment of renewable electricity systems. For example, the wind power sector needs workers with a variety of particular skills and expertise (Tables 5-7 and 5-8). The
TABLE 5-6 Projected Material Requirements for 20 Percent Wind Energy Scenario.
TABLE 5-7 Types of Skills Required for Increased Deployment of Wind Energy.
|
Segment |
Description |
Details |
|
Construction, repair, opereation, and maintenance |
Building the wind farm, regular inspection and repair activities |
Technical staff for O&M and repairing the wind turbines Electrical and civil engineers to coordinate the building work Health and safety experts Specialists in the transport of heavy goods Technical staff for activities in cranes, fitters, nacelles, etc. Other support staff |
|
Independent power producers, utilities |
Operation of the wind farm and sale of the electricity produced |
Electrical, environmental, and civil engineers for the management of the plant Technical staff for the O&M of the plants Health and safety experts Financiers, salespersons, marketing people to sell the electricity |
|
Consultancies, legal entities, engineering, R&D centers |
Diverse specialized activities linked to the wind energy business |
Programmers and meteorologists for analyzing wind regimes and output forecasts Engineers specialized in aerodynamics, computational fluid dynamics and other R&D areas Environmental engineers Energy policy experts Experts in social surveys, training, and communication Financiers and economists Lawyers in environmental matters Marketing staff, event organizers |
|
Manufacturers |
Wind turbine producers, including sub-component and assembly factories |
Highly qualified chemical, electrical, mechanical, and material engineers dealing with R&D issues, product design, management and quality control of production process Semi-skilled and non-skilled workers for production chains Health and safety experts Technical staff for O&M and repairing turbines Other support staff (admin., sales managers, marketing, others) |
|
Developers |
Managing all the tasks related to the development of wind farms (planning, permits, construction, etc.) |
Project managers (engineers, economists) to coordinate the process Environmental engineers and other specialists to analyze the environmental impacts of the wind farms Programmers and meteorologists for wind energy forecasts and prediction models Lawyers and economists to deal with the legal and financial aspects of project development Other support staff (admin., sales managers, marketing, others) |
|
Source: EWEA, 2009. |
||
TABLE 5-8 Direct Employment by Type for the Wind Energy Sector
|
Direct Employment by Type |
|
|
Manufacturers |
37% |
|
Component manufacturers |
22% |
|
IPP/Utility |
9% |
|
Developers |
16% |
|
Installation/Repair/Operations |
11% |
|
Consultancy |
3% |
|
R&D/University |
1% |
|
Financial/Insurance |
0.3% |
|
Others |
1% |
|
Source: EWEA, 2009. |
|
number of jobs directly or indirectly related to the wind energy sector in the United States increased from 50,000 in 2007 to 85,000 in 2008 and remained steady in 2009. About a quarter of these jobs are in manufacturing and 12 percent are in construction; the rest (the vast majority) are in others jobs that support the industry, such as accountants, engineers, computer analysts, clerks, factory workers, truck drivers, mechanics, and so on (AWEA, 2009). Some of these workers may not even realize that they owe their livelihoods to renewable energy.
Table 5-9 shows a breakdown of private employment and revenues related to renewable energy industries in the United States in 2007. More than 95 percent of jobs and 90 percent of revenues in that year were in private industry and more than half of the jobs in government were in research and development (R&D) at national laboratories. Table 5-10 shows the number and types of jobs created by the renewable energy sector in 2007.
TABLE 5-9 The Renewable Energy Industrya in the United States, 2007
TABLE 5-10 Renewable Energy Jobs Generated in the United States in 2007, by Selected Occupations
|
Industry Type |
Jobs |
Industry Type |
Jobs |
|
Agricultural Equipment Operators |
4,260 |
Industrial Production Managers |
760 |
|
Biochemists and Biophysicists |
1,580 |
Inspectors, Testers, and Sorters |
2,400 |
|
Bookkeeping and Accounting Clerks |
8,228 |
Janitors and Cleaners |
3,610 |
|
Business Operations Specialists |
3,390 |
Machinists |
1,820 |
|
Carpenters |
780 |
Mechanical Engineers |
1,950 |
|
Chemical Technicians |
1,880 |
Payroll and Time keeping Clerks |
1,160 |
|
Civil Engineers |
3,080 |
Plumbers, Pipefitters, and Steamfitters |
4,670 |
|
Computer and IT Managers |
1,210 |
Purchasing Agents |
1,280 |
|
Computer Programmers |
2,660 |
Sales Representatives |
4,140 |
|
Computer Software Engineers |
3,260 |
Security Guards |
1,310 |
|
Database Administrators |
560 |
Sheet Metal Workers |
1,600 |
|
Electrical and Electronic Equipment Assemblers |
840 |
Shipping and Receiving Clerks |
2,210 |
|
Electricians |
6,330 |
Surveyors |
690 |
|
Engineering Managers |
1,350 |
Tax Preparers |
580 |
|
Environmental Engineers |
630 |
Tool and Die Makers |
620 |
|
Environmental Science Technicians |
1,690 |
Training and Development Specialists |
650 |
|
Employment, Recruitment, and Placement Specialists |
600 |
Truck Drivers |
9,500 |
|
Forest and Conservation Workers |
1,440 |
|
|
|
HVAC Mechanics and Installers |
2,130 |
|
|
|
Industrial Engineers |
1,340 |
|
|
|
Source: ASES, 2009. |
|||
The European Wind Energy Association (EWEA) estimates that approximately 15.1 construction jobs are needed for every MW of wind capacity, and 0.4 jobs per MW are needed for maintenance (EWEA, 2009). Ensuring the availability of a skilled workforce of that size will require a training infrastructure that targets every component of the industry’s value chain (Weissman, 2009). Establishing certification and accreditation levels might help in creating a framework for training. Certification indicates that an individual meets competency standards for a predefined task; existing certification programs for the solar PV industry could serve as a template for certification programs in the wind energy industry. Accreditation denotes that an institution is capable of teaching students at a level that meets predetermined standards. As part of the 2009 American Recovery and Reinvestment Act, the U.S. Department of Labor provided training grants totaling $100 million to several states, to train workers in energy efficiency and renewable energy industries.
As the renewable energy industry scales up, it will be increasingly dependent upon a network of support services that are not necessarily compatible with the existing energy services sector. In the United States, firms offering these support services have proliferated rapidly, whereas in China they have been much slower to develop. For both countries, a mature renewables industry will rely on these ancillary services, which include energy audits, project design, and risk management.
Market and Financial Risks
Market risks reflect the uncertainty of finding a sufficiently large market for a new product and the difficulty of acquiring market share because of lower priced competition. Misplaced incentives or unfavorable fiscal policies, statutes, or regulations can cause long-term demand to fall short of expectations. Financial risks are a measure of the likelihood that an investment will not yield sufficient returns. A higher risk translates into more expensive access to capital and higher expected rates of return. These risks vary depending on how an industry is structured and may be particularly high under certain structures. Fragmented industries (e.g., much of the renewable energy industry) are characterized by a lack of standardization, and a high dependence on specialized markets. Industries characterized by monopolies (e.g., utilities in the electricity sector) tend to aggressively defend incumbent technologies and are slow to innovate.
Widespread deployment of renewables will require significant capital, which cannot be provided by the public sector alone. However, governmental presence is still very important, particularly in the early stages of deployment, because it could reduce market and financing risk and effectively leverage investments from the private sector. Some financing may come from venture capital firms (firms that invest in start-up companies hoping for large future returns). However, most venture capital firms have three- to seven-year investment timeframes, which is a small window for large-scale deployment projects.
Besides industry-specific market and financing risks, the health of the overall economy is an important factor in the cost and availability of capital. The global financial crisis of 2007–2008 caused a drop in total investments in the clean energy sector, although the situation had improved by early 2009, partly as a result of stimulus plans (REN 21, 2009). The United States and China each committed roughly $67 billion in stimulus funds to support “sustainable”2 energy (UNEP/SEFI/NEF, 2009), although China outpaced the United States nearly 2 to 1 in terms of actual investments made in 2009, $34.6 billion to $18.6 billion (Pew Charitable Trusts, 2010).
High Costs
The cost of some renewable technologies might go down as increased deployment leads to economies of scale and efficiencies from learning. Experience curves, which model the relationship between cumulative deployment and cost, can help in determining investment requirements. Figure 5-4 illustrates the historical decrease in cost of wind turbine systems as cumulative installed capacity increased. Figure 5-5 shows experience curves for a variety of renewable energy technologies as well as natural gas combined-cycle and pulverized-coal technologies. As the latter figure illustrates, prices do not fall uniformly with experience; in some cases they rise as a result of market forces.
Using experience curves to estimate future costs should be done with some caution. First, in the short-term at least, experience curves do not reflect the effects of increased costs for raw materials. Second, a change in policy can create a sharp rise in demand for certain materials, which can lead to an increase in production
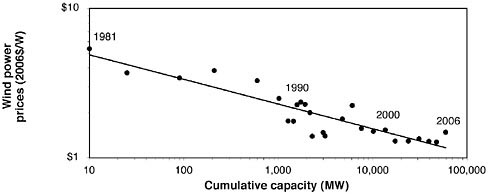
FIGURE 5-4 Experience curve for capital costs of wind turbines (1981–2006). Source: Nemet, 2009. Reprinted with permission from Elsevier.
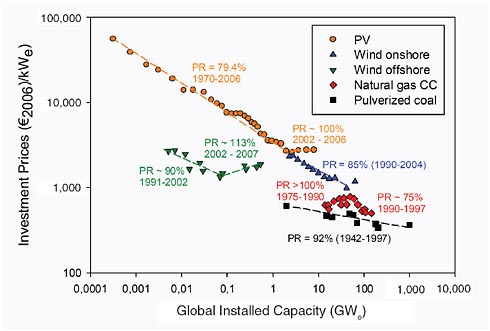
FIGURE 5-5 Comparison of experience curves for various energy supply technologies. Source: Junginger et al., 2008. Reprinted with permission.
costs. Finally, outsourcing to low-wage regions can translate into a decrease in production costs that does not signify improvements attributable to learning.
From a consumer’s point of view, price can be a relative measure. Whether or not a renewable energy technology is considered expensive depends on the availability of a less costly alternative that can serve a similar function. Accurate predictions of the future cost of fossil-fueled electricity are therefore important considerations when forecasting the deployment of renewables. Although previous U.S. studies have done well predicting the cost of renewables, they consistently overestimated the retail price of fossil-fueled electricity, which led to inaccurate predictions for the penetration of renewable electricity (Bezdek and Wendling, 2003; McVeigh et al., 2000).
Other Constraints
Competition for construction management and equipment could delay deployment; these limitations could include a lack of tools for siting renewable energy technologies (e.g., meteorological equipment) and a lack of construction equipment (e.g., tall cranes). As renewable power installations increase in number, such competition will likely become more acute.
Incomplete and imperfect information about new renewable technologies and their performance can also be a barrier to deployment. Trustworthy information is
limited today because stakeholders, constituents, supply chain providers, and user communities have not yet coalesced into a mature market, with standardized parts, tools, and performance metrics. This uncertainty engenders a technical risk (that an innovative technology will not perform to specifications), which can translate into an increase in financing costs.
FINANCING AN EXPANDED MARKET FOR RENEWABLES
Renewable technologies offer performance attributes that, at least at the outset, are not valued by a majority of existing customers. As disruptive technologies, renewables have largely been able to enter the electricity market because of direct and indirect subsidies driven by specific mandates (e.g., a state RPS), even though traditional electricity sources outperform non-hydropower renewables in terms of cost and availability. Figure 5-6 shows the growth of renewable energy sources in the United States and China from 1980 to 2009. Despite that growth, however, questions about long-term viability remain, particularly as both countries approach a material share of renewables in their power generation portfolios.
Public funds would be the most effective way to leverage private investment, but because of the nature of the electricity market, public funds will also
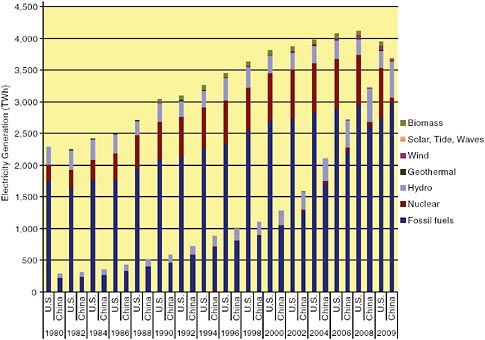
FIGURE 5-6 Power generation by source in the U.S. and China, 1980–2009. Sources: CEC, 2010; EIA, 2010b,d.
be needed to finance projects in the early stages of commercialization. Whereas consumer products can follow the traditional road map to commercialization, the homogeneity of electricity will make it difficult to market renewable energy to premium-paying early adopters. Electricity is the same whether it is generated from low-carbon renewable sources or coal-fired power plants. Renewable energy certificates (RECs) have been the preferred tool to overcome this limitation. RECs represent the “unbundled” attributes of electricity generated from renewable resources, and these attributes are then sold or traded independently of the electricity (Holt and Bird, 2005). RECs are now widely used to comply with a state’s RPS, as part of a green power marketing strategy for retail consumers, and as a source of additional revenue to support renewable energy projects (Holt and Wiser, 2007).
Arguably, tax equity has been the most powerful recent driver in renewables development in the United States, through production and investment tax credits, which help project developers access financing. In addition, the renewable energy sector can benefit from the direct infusion of public funds for newly commercialized projects (Murphy and Edwards, 2003). Government support can be used to establish or expand existing public finance mechanisms (PFMs) (UNEP, 2008), which, although they vary in structure and focus, all attempt to mobilize commercial financing and build commercially sustainable markets for renewable energy projects. Table 5-11 lists some of the most common PFMs currently used in the renewable energy and energy efficiency sectors and summarizes the barriers and market segments they address. Most have been used in a variety of countries and some have track records that justify replication and scaling up.
NEAR-TERM PRIORITIES TO SUPPORT DEPLOYMENT
Beyond addressing environmental challenges, a sustainable market for renewable energy offers opportunities for economic development and job growth. In addition to a solid market infrastructure, widespread deployment of renewables will require (1) deploying adequate grid technology to optimize the operating characteristics and variable output of renewable sources, and (2) developing and adopting international standards to reduce market risks.
Grid Integration
An effective electrical distribution system must supply uninterrupted power to demand centers that vary in scale and location. This system must balance a portfolio of energy resources that have unique performance characteristics. As renewable energy assumes a larger share of the generation portfolio, the task of balancing resources will become increasingly complex. However, at present, non-hydro renewables account for less than 2 percent of electricity generation in China and the United States, and experience in the United States and Europe suggests that grid operators have been able to accommodate upwards of 20 percent of
generation coming from non-hydro renewables without requiring storage (NAS/NAE/NRC, 2010a).
When evaluating the cost of integrating new technologies into the transmission and distribution infrastructure, the cost of expanding the current grid must be taken into account. In the case of the United States, if the transmission portion of the grid were simply expanded, the estimated cost would be $188 billion (2010 dollars). If the grid were modernized in a separate initiative, this would cost an estimated $112 billion. However, if expansion and modernization were done concurrently, the cost would still be $188 billion for expansion but would be only $54 billion for modernization (a savings of $58 billion). If, in addition, the distribution system were expanded and modernized concurrently, the estimated cost savings would be $209 billion (2010 dollars) (NAS/NAE/NRC, 2009a).
The deployment of renewable energy will create a need for more ancillary services, new storage technologies, and access to other dispatchable resources (e.g., natural gas) to maintain overall system reliability. These services, technologies, and resources are all components of a modernized grid (also discussed in Chapter 6). In general, a modern electrical grid has the following characteristics (NETL, 2007):
-
It gives customers and utilities demand-management capability. The grid provides information to customers that enables them to participate in demand-response programs.
-
It delivers high-quality power. The system provides power that meets industry standards. Hydropower and natural gas-fired generation, resources that ramp up fairly quickly, can compensate for the variability of wind and solar. It would be difficult to do this with nuclear or coal-fired generation.
-
It has the capability of integrating distributed generation. The overall system integrates different types of distributed-generation and storage devices to complement large generating plants.
A number of insights have emerged from the increasing integration of wind power into existing power systems (VTT, 2008). These include:
-
Larger balancing areas allow utilities to aggregate wind plants, decreasing the variability of output. On a short time scale, this translates into a smaller reserve requirement.
-
Optimizing existing transmission capacity, which sometimes requires upgrading or extending existing transmission, brings benefits to large-scale wind farms and provides improved system balancing services.
-
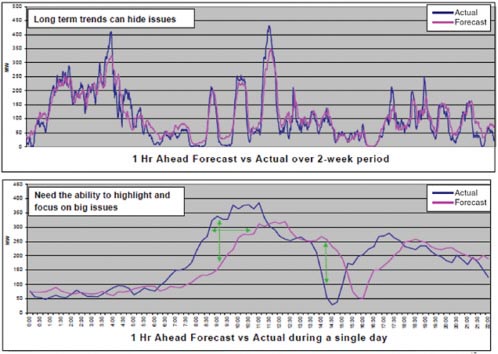
Integrating wind generation information (see Figure 5-7) with both real-time and updated forecasts (hourly and day ahead) will help reduce errors associated with forecasting and scheduling. Well-functioning hour-ahead and day-ahead markets can cost-effectively provide the balancing energy required of variable-output wind power plants.
TABLE 5-11 Common PFMs Used in the Renewable Energy and Energy Efficiency Sector
|
|
Mechanism |
Description |
Barriers |
Financial Markets |
Sectors |
|
Debt |
Credit line for senior debt |
Credit line provided to commercial fianncial institutions (CFIs) for on-lending to projects in the form of senior debt |
CFIs lack funds and have high interest rates |
Underdeveloped financial markets with lack of liquidity, and high costs for borrowing |
Large-scale renewable energy (RE) and energy efficiency (EE); wholesale loans for energy access markets |
|
Credit line for subordinated debt |
Credit line to CFIs for on-lending to projects with subordinated repayment obligations |
Debt-Equity gap, whereby project sponsors lack sufficient equity to secure senior debt |
Lack of liquidity in both equity and debt markets |
Medium- and small-scale |
|
|
Guarantee |
Shares project credit (i.e., loan) risks with CFIs |
High credit risks, particularly perceived risks |
Existence of guarantee institutions and experience with credit enhancing |
Large-scale RE and EE and energy access markets |
|
|
Project loan facility |
Debt providing by development finance institutions (DFIs) directly to projects |
CFIs unable to address the sector |
Strong political environment to enforce contracts and enable laws for special purpose entity |
Large- and medium-scale EE and RE |
|
|
Equity |
Private equity fund |
Equity investments in companies or projects |
Lack of risk capital; restrictive debt-to-equity ratio |
Highly developed capital markets to allow equity investors to exist from investee |
Large-scale grid-connected RE; energy companies |
|
Venture capital fund |
Equity investments in technology companies |
Lack of risk capital for new technology development |
Developed capital markets to allow eventual exits |
Any new technology |
|
|
Mechanism |
Description |
Barriers |
Financial Markets |
Sectors |
|
Carbon |
Carbon finance |
Monetization of future cash flows from the advanced sale of carbon credits to finance project |
Lack of project development capital; lack of cash flow for additional security; uncertain delivery of carbon credits |
Availability of underlying financing for projects. Adequate institutional capacity to host clean development mechanism/joint implementation (CDM/JI) projects and to enforce contracts |
Large-scale RE and EE; program of activities such as in energy access markets |
|
Carbon transaction in post-2012 credits |
Contracting for the purchase of carbon credits to be delivered after 2012 |
Lack of regulatory framework and short-term compliance driver buyers |
Availability of underlying financing. Adequate institutional capacity to host clean development mechanism/joint implementation project and enforce contracts |
Any GHG emissions reduction project |
|
|
Innovative Grants |
Project development grants |
Grants “loaned” without interest or repayment until projects are financially viable |
Poorly capitalized developers; costly and time consuming development process |
Can be needed in any financing market context |
Any sector |
|
Loan softening programs |
Grants to help CFIs begin lending their own capital to end-users initially on concessional terms |
Lack of FI interest in lending to new sectors; limited knowledge of market demand |
Competitive local lending markets |
Medium- and small-scale EE and RE |
|
|
Inducement prizes |
“Ex-ante prizes” to stimulate technology development. Unproven in climate sector |
High and risky technology development costs and spillover effects |
Sufficient financing availability to deploy winning technologies |
Any technology sector |
|
|
Source: UNEP, 2008. |
|||||
Finally, new transmission will be required to link remote areas rich in resources. Although this is recognized as an impediment to developing some renewable energy sources, progress is under way in parts of the United States (such as the Tehachapi region in southern California) to build transmission that will serve primarily renewables. China has favored high-voltage (750 kV and above) transmission for its new lines and has begun building transmission that would be primarily served by large renewable power bases in the west and northwest regions, e.g., Gansu province’s construction of high-voltage lines for PV and wind. More efficient lines, cost sharing for interconnections, and advances in system flexibility, including storage, should help to mitigate concerns over new transmission costs.
The financing of new transmission facilities will also require large amounts of public and private capital. Which entity bears the responsibility for financing transmission facilities varies from region to region in the United States and is governed by tariffs filed at the Federal Energy Regulatory Commission (FERC). In some regions of the U.S., generation developers bear the full (or a large portion) of the financing responsibility for transmission network upgrades. In other regions generation developers are required to provide the upfront financing for network facilities and are refunded such costs after reaching commercial operation. In some cases, the load serving utilities have the discretion to upfront finance the cost of network facilities on behalf of the generation developers. Regardless of “who pays” upfront for the required transmission facilities, ultimately these network upgrade costs are capitalized into the utilities’ rate bases and are reflected in transmission rates.
The EPAct of 2005 included the ability for FERC to grant certain incentives to promote the development and construction of new transmission infrastructure. These incentives, which can raise the rate of return on such investment to regulated utilities, and among other things, provide cost recovery to utilities if a transmission project must be abandoned for reasons outside of the control of the utility, have played an important role in the development and financing of high-profile transmission projects geared toward the interconnection of renewable resources, such as Southern California Edison’s Tehachapi Renewable Transmission Project (a $2.1 billion investment to access 4500 MW of wind, solar, and other resources).
The allocation of financing responsibility can become even more complex in the case of long-distance transmission lines that cross state boundaries and control area boundaries. Thus, the “who benefits” from such facilities, in addition to the “who pays” concerns discussed previously, continue to cloud the outlook for such inter-state/inter-region transmission facilities. In 2010, FERC launched a Notice of Proposed Rulemaking to address regional Transmission Planning and Cost Allocation issues and seek solutions to these issues.
Industrial Research and International Standards
For both countries, the deployment of renewable energy technologies depends, at least partly, on the implementation of industry standards for manufacturing, installation, and operation. Investors may be reluctant to invest in renewable energy projects because of uncertainties about the performance of renewable energy sources. Deployment could, therefore, be easier if technical standards for product performance, manufacturing quality control, and standard grid interconnection have been developed and adopted (IEA, 2010e). Because of the absence of standards for transmission infrastructure, the electricity market remains fragmented. This has created significant barriers to the deployment of renewable electricity technologies.
In the Energy Independence and Security Act of 2007, the National Institute of Standards and Technology (NIST) was assigned to “coordinate development of a framework that includes protocols and model standards for information management to achieve interoperability of smart grid devices and systems.” NIST has devised a two-pronged approach: (1) working groups to study various aspects of standards in grid integration, including transmission and distribution, building the grid, business, and policy; and (2) a cybersecurity coordination task group to examine issues related to data privacy.
FINDINGS
China’s top-down, government-mandated approach to energy policy has led to aggressive development of the renewable energy industry. Although China will continue to use coal as its primary energy source for the foreseeable future, it is evident that its renewable energy policies have stimulated the creation of a strong manufacturing sector for renewable energy, and more recently, a domestic market for deployment.
Both the national and some provincial governments in China and some state governments in the United States have established goals and mandates for the share of electrical generation from renewables. However, the targets and implementation mechanisms differ. Chinese policy is characterized by “outcome-based goals” set at the national level, e.g., specific national targets for share of renewables in generation portfolio, or share of domestically manufactured equipment in renewable power systems. This approach, augmented by subsidies, has been successful in driving substantial new Chinese manufacturing capacity in recent years. U.S. renewable policy is characterized by a greater focus on advancing specific technologies at the national level with market outcomes encouraged at the state level. This approach has been successful in driving technology development but has been less successful in supporting the buildout of manufacturing capacity.
The most prominent national policy approach for renewable energy development in both China and the United States has been price support. In the United
States, the level of renewable energy investment has fallen when subsidies have been suspended, demonstrating the importance of price stability in an emerging renewable energy market, both for technology development and manufacturing capacity. U.S. subsidies, primarily tax breaks for producers and consumers, have been effective in driving specific technology development. China has been more effective at capturing a higher market share of renewable energy-associated manufacturing, particularly in the solar PV market and increasingly in the wind energy sector, at least partly because of general incentives for manufacturers (e.g., low-cost loans) and government-set pricing for renewable power generation.
Development of renewables has suffered in the United States and China because the costs of externalities, particularly the impact of GHG emissions, are not reflected in current energy prices. Both countries set subsidy values specific to particular resources (wind, solar, etc.). Subsidy values generally are driven more by specific policy goals and objectives and remain difficult to justify by real costs of production from competing supply resources. Both countries might benefit from reorienting their policies and incentives to electricity markets (as opposed to individual technologies) and the utilities operating in these markets. Examples include: promoting time-of-use rates to better match retail prices with generation costs, encouraging advanced metering to enable more demand response, and facilitating or streamlining transmission operation and expansion.
Government energy policies can have a critical impact on clean energy development, and legacy energy policy, regulations, and subsidies are key drivers in determining the success of clean energy initiatives and the achievement of green energy goals. The historical legacy of U.S. energy subsidies—and the legacy in most developed and developing economies (a pattern that continues)—often places clean energy at an economic disadvantage in the marketplace.
The design of outcome-based incentives will be critical for overcoming the barriers to renewable energy and promoting more rapid, sustainable clean energy development—in both the United States and China. To maximize the effectiveness of financial incentives, they should be designed to work with other policies to address market barriers. In addition, each jurisdiction should design financial incentives to complement national and regional incentives and mandates. Finally, incentives should be provided with enough time to support planning, capital formation, and construction.
In recent years, the United States and China have taken steps to include a larger share of renewable energy sources in their overall electricity generation portfolios. However, both countries face a number of challenges that warrant the attention of policy makers: the difficulty of introducing new technologies in a competitive market; finding adequate financing for long-term development; conducting market-enabling research that is understandable to various stakeholders; and developing government initiatives to share the risk of innovations in production and market transformation.
Other challenges include constraints on large-scale manufacturing and installation capacity, the lack of a trained workforce, the difficulty of integrating variable-output resources into the existing electricity infrastructure and market, stiff competition in price and performance with conventional power sources, and issues related to business risk and cost. China faces one very significant additional hurdle. It must create a robust supply channel for bringing renewable energy technologies to market.
The current focus in China, and to a lesser extent in the United States, appears to be on the installation of large blocks of power production plants. Widening the focus to include distributed generation, on both the community and customer levels, would have positive impacts on the electricity distribution system in both countries. With technological improvements and the rising costs of fossil fuels and nuclear power, renewables may soon be able to match the cost performance of traditional power generation sources, either in the wholesale power market or on the customer side of the meter.
Consistent and supportive policies would help the developing industry in both countries, but over the long-term renewable power developers will need to focus on becoming cost-competitive with fossil fuels. Innovative financing mechanisms for renewable projects could help them overcome the challenge of being capital-intensive (compared to conventional fossil-fuel generation). Project developers could begin placing value on the risk reduction attributes of renewable energy sources, notably the uncertainties of fossil-fuel prices and the threat of emissions regulation, when evaluating investments in new power generation. Both countries would benefit from implementing renewable-energy-based power pricing mechanisms so that costs and benefits of new technologies are shared by all market participants. They could explore market mechanisms, such as Renewable Energy Credits, that would enable consumers to participate in the renewable power market and develop market mechanisms to enable all market participants to share in the costs and benefits of grid interconnections.
Operating experience will become a valuable tool—utility and grid operators in both countries have much to gain from sharing their experiences in integrating and managing larger shares of renewable power generation. Costs can come down as market participants gain experience with a new technology. Feedback to other market participants such as the technology manufacturers, installers, and regulators can be critical for reducing costs. Both countries could benefit from programs to capture performance data from renewable energy technologies operating in the field and the distribution of the data throughout the supply chain. China’s renewable power market could experience a more rapid evolution by establishing more formal and informal mechanisms to capture this organizational learning. Additionally, as the global industry grows, the United States and China can exhibit leadership by cooperating on establishing or supporting technical standards for the various generation technologies.
RECOMMENDATIONS
-
The United States should consider conducting a multiagency strategic assessment of U.S. renewable energy manufacturing capabilities, in alignment with U.S. innovation activities, to determine where additional capacities should be promoted. Financial support should be considered to expand the manufacturing base for existing and near-term deployment needs through the research and demonstration of process improvements and efficiencies and the establishment of mechanisms to share the risk of private-sector investment in building new manufacturing capacity. In addition, targeted public/private risk-sharing programs should be considered to move technologies from concept through to manufacturing.
-
Cognizant organizations in China and the United States, including government agencies, international standards organizations, and professional societies should collaborate on developing technical standards and certification mechanisms for renewable energy technologies for: (1) product performance and manufacturing quality control and (2) standard grid interconnection for both distributed, customer-sited resources and whole, central station resources.
-
China should establish national facilities with capabilities to test performance and safety characteristics of complete renewable power systems and their subcomponents. Examples include testing PV systems to Underwriters Laboratories (UL) standards or evaluating the Power Curve from a small wind turbine.
-
The United States and China should increase cooperation among researchers and grid operators to improve wind forecasting. Improved meteorological data and forecasting will provide more and better data on expected power output from existing wind power plants and assist with their integration into the grid.


