
APPENDIX A
PRESS RELEASE ANNOUNCING FUEL ECONOMY STUDY
December 26, 1990
FOR GENERAL RELEASE
National Research Council
COMMISSION ON ENGINEERING AND TECHNICAL SYSTEMS ENERGY ENGINEERING BOARD
AN EVALUATION OF THE POTENTIAL AND PROSPECTS FOR IMPROVING THE FUEL ECONOMY OF NEW AUTOMOBILES AND LIGHT TRUCKS IN THE UNITED STATES
INTRODUCTION
The purpose of this study is to estimate fuel economy levels that could practically be achieved in new automobiles and light trucks (up to 8500 lbs. gross vehicle weight rating) produced for the United States market in the next decade.
The study has been requested by the National Highway Traffic Safety Administration to ascertain the potential and prospects to improve the fuel economy of new vehicles, while meeting existing and pending environmental and safety standards for the vehicles.
The study will be conducted in two phases. The work under Phase 1 is to be completed by June 30, 1991 and that under Phase 2 by March 31, 1992.
OBJECTIVES
Phase 1 of the study is expected to provide, on a "best judgment" basis, estimates by size class of vehicles (e.g., full-sized, mid-sized, compact, and sub-compact passenger cars, and large and small light trucks) produced by automotive corporations with major
assembly facilities in the United States and Canada of fuel economy practically achievable in the next decade, taking into consideration, as appropriate, provisions of the Clean Air Act Amendments of 1990, the state of the art in the applications of technologies relevant to achieving higher fuel economy and improving safety, and the viability of the domestic automotive industry in the U.S. market. Phase 1 work is also expected to result in the identification of principal barriers in the United States that appear to constrain the rates at which technologies enhancing fuel economy can be introduced and sustained in the marketplace.
Phase 2 of the study will analyze alternative measures to overcome the principal barriers to the technologies considered in Phase 1.
PROPOSED EFFORT
A committee will be appointed by the National Research Council to carry out this study. People with requisite qualifications will be sought for membership on the study committee with expertise in areas such as the following: internal combustion engines, fuels and lubricants, drive trains, automotive structures and materials, emission control systems, vehicle design, manufacturing of cars and light trucks, safety, financial practices and markets relevant to the automotive industry, federal and state regulations under which the automotive industry functions, consumer behavior, and automotive industry/U.S. economy interactions. A committee slate will be sought that is balanced with regard to the science and technology type of credentials and those from other disciplinary areas such as finance, economics, regulations, and behavioral sciences.
In Phase 1, the Committee will rely primarily on mechanisms such as the following to expeditiously obtain information pertinent to the study:
-
The Committee will invite structured presentations, to be delivered at committee meetings and in a workshop forum, from domestic and foreign automobile manufacturers and their suppliers; from representatives of qualified organizations closely involved with but functioning outside of the automotive industry per se; from the National Highway Traffic Safety Administration and its contractors and subcontractors as appropriate; and from other relevant parties (individuals, firms and other entities in the private sector, and government agencies).
-
The Committee will avail itself of the data and analytical resources of the National Highway Traffic Safety Administration that would be relevant to the study including, as appropriate, the resources of the National Highway Traffic Safety Administration's contractors and subcontractors who specialize in studies of the automotive industry and markets. The National Highway Traffic Safety Administration will facilitate the Committee's use of these resources.
-
The Committee will commission expert written reviews of selected topics from the extant literature, for example, trade-offs in automotive design of weight versus safety; dynamics of automotive industry changes since the Arab Oil Embargo of 1973; myths and realities in consumers preferences for automobiles; and so forth.
On the strength of what the Committee ascertains from the foregoing processes, the following tasks will be addressed:
PHASE 1
Task 1
The Committee will evaluate technologies in conventionally powered cars and light trucks that could, in the time frame of the next decade, contribute to improved fuel economy of new vehicles. Examples of technologies that might be presented to the Committee include the following: front-wheel drive; reductions in aerodynamic drag; 4-and 5-speed automatic transmissions; torque converter lockup; electronic and computer controls; continuously variable transmissions; 6-speed manual transmissions; high efficiency accessories; electric power steering; engine improvements (e.g., from components design, controls, materials); 2-cycle engines; diesel engines; improved lubricants; energy storage; reductions in rolling resistance and other driveline losses; weight reductions; reductions in horsepower-to-weight ratios.
In its evaluation, the Committee will consider factors such as the following:
-
The magnitude of fuel economy improvements that can be expected from the technologies, singly or in combinations.
-
The time at which the technologies could be introduced and the rates at which they might penetrate the U.S. market, given existing industrial capabilities in the United States and limitations (e.g., technical, financial, regulatory, organizational, and marketing limitations) to deploying improved or new capabilities in the next decade.
-
Likely effects in the United States of the technologies on initial and life-cycle costs of vehicles and vehicle safety, taking account of the effects on fuel economy of the interaction between and among technologies.
For the purposes of evaluation, the Committee will consider defining a baseline with vehicle size, size mix, equipment and performance consistent with the 1990 model year new cars and light trucks sold in the United States. Measures of fuel economy will be based on the EPA Test Cycle, and assumptions regarding future automotive fuel prices may be based on projections made by the Department of Energy and other sources of such projections available in the public domain.
Task 2
The Committee will identify and describe the principal barriers to the introduction in the United States of the technologies underlying the improvements in the fuel economy of new vehicles.
In performing this task, the committee will use information presented by the automobile manufacturers, by the National Highway Traffic Safety Administration, and by others. Such information is expected to cover topics such as the following: manufacturers' capital and operating costs in aggregate; research and development plans and costs, technology development and manufacturing lead times; tooling, assembly lines, plants and facilities conversion; employment; engineering resources; suppliers' capabilities to meet changes; principal federal and state regulations on environment and safety affecting vehicle design and operation, including new safety standards (e.g., automatic restraints, side and head impact protection, roof crush resistance), Clean Air Act Amendments of 1990, California Air Quality issues, phase-out of chlorofluorocarbons (CFCs); availability and use of alternative fuels; marketability of new vehicles; initial and life-cycle costs of vehicle ownership; competitiveness issues; best-in-the-world vehicles (on the road); prototypes in testing.
It is anticipated that, in the conduct of Tasks 1 and 2, a workshop will be held as described earlier. Proceedings of the workshop will be published promptly on a stand-alone basis.
Task 3
The Committee will prepare estimates by vehicle size class of the fuel economy gains that can be practically achieved in the United States in the next decade. As appropriate, the Committee will condition its estimates in terms of sensitivities expected to selected external factors. Examples of such factors (which may also require assumptions and judgments by the Committee) include the state of the U.S. economy at the end of the decade; world oil prices and availabilities; current product plans of automobile manufacturers; heightened public concerns for safety; and so forth.
The Committee will also prepare estimates, by vehicle size class, of the average incremental first cost per vehicle to the consumer attributable to higher fuel economy (relative to estimates of average life-cycle costs of vehicle ownership and operation), and the incremental annual cost, in aggregate, to the automotive industry in producing higher fuel economy vehicles.
The Committee will not, however, address the formulation of new corporate average fuel economy (CAFE) standards using its estimates of practically achievable fuel economy improvements in new vehicles nor will it, in Phase 1, address other public policy measures to achieve greater fuel economy in new vehicles.
Task 4
The Committee will prepare a Phase 1 report setting forth its findings, the rationale therefor, and the description of the barriers identified in this Phase. A manuscript of this report (after it has been subjected to the National Research Council review process) will be delivered by the National Research Council to the National Highway Traffic Safety Administration by June 30, 1991.
PHASE 2
Task 5
As presently envisioned in Phase 2, the Committee will analyze in greater detail the principal barriers to the market introduction and adoption of the most important technologies considered in Phase 1 and present alternative approaches to overcoming these barriers. The Committee will also consider addressing technologies such as electric and hybrid vehicles that were not considered in Phase 1. In any event, a more specific definition of Phase 2 requirements will be made in conjunction with the National Highway Traffic Safety Administration on the basis of information generated in Phase 1.
Task 6
The Committee will prepare a Phase 2 report setting forth its findings and conclusions. A manuscript of this report (after it has been subjected to the National Research Council review process) will be delivered by the National Research Council to the National Highway Traffic Safety Administration by March 31, 1992.
ANTICIPATED RESULTS
The study will result in two reports, one at the end of each phase, and a published proceedings of a workshop, which will be held in Phase 1.
Committee Agenda:
-
In consultation with NHTSA subsequent to the committee's first meeting, May 13-15, 1991, the date for completing Phase 1 of the study was extended beyond June 30, 1991.
-
The committee held a workshop as part of its second meeting, July 8-12, 1991. The proceedings of the workshop could not, however, be published as originally planned because of time and resource constraints.
-
The schedule for Phase 2 of the study has not yet been determined.
APPENDIX B
PROVEN AUTOMOTIVE TECHNOLOGIES: FUEL ECONOMY AND PRICE IMPLICATIONS
This appendix (1) describes how each proven fuel economy technology works and the aspects of vehicle energy use it affects, (2) examines and compares literature estimates of the improvements in fuel economy that may be achievable for each alternative technology compared with a baseline technology, and (3) examines literature estimates of the retail price equivalent (RPE) of using each alternative technology. The appendix then develops the data bases that underlie the technology-penetration, or shopping cart, projections of fuel economy in Chapter 7.
DATA SOURCES FOR THE SHOPPING CART PROJECTIONS
To implement the shopping cart approach, one must have data on the costs, fuel economy contribution, and market penetration for the technologies of interest. All are difficult to acquire. In practice, costs proved to be more difficult for the committee to estimate than potential fuel economy improvement, because the underlying bases for the costs are less well defined and hitherto not well analyzed. Also, information on costs is proprietary in nature so the open literature is very sparse.
The committee obtained data on the market shares of the technologies in MY 1990 from Energy and Environmental Analysis, Inc. (EEA, personal communication, October 2, 1991) and from SRI International (1991). The EEA provided the committee with estimates of the market shares for the various technologies by size class and by import versus domestic manufacture, for passenger cars and light trucks. The SRI report provided estimates for all passenger cars manufactured by members of the Motor Vehicle Manufacturers Association (MVMA), that is, Chrysler, Ford, General Motors, and Honda of America.1 The committee compared the two sources by computing the sales-weighted average market shares for domestic cars based on EEA's
data and comparing them with the market shares reported for domestic manufacturers in the SRI report. By and large, the estimates are in good agreement. Differences (e.g., market shares of 4-valve engines) seem to arise from the inclusion of Honda's U.S. production in the SRI data and its exclusion from EEA's domestic estimates (Honda's U.S. production is considered imported for corporate average fuel economy [CAFE] purposes).
The percentage improvement in fuel economy that can be ascribed to a given technology continues to be debated among scientists and engineers. While there has been agreement on some technologies, the committee found contention about others. Most of the arguments have to do with the definitions of technologies—the same name is often given to quite different versions of a generic technology in different sources. Some differences have to do with the details of how a technology is implemented. Most engine technologies considered, for example, can be optimized for performance or fuel economy. When optimized for performance, they do not yield as great a fuel economy benefit.
The automotive industry and the U.S. Department of Energy (DOE), together with EEA, a DOE contractor, have spent a considerable amount of time and effort attempting to resolve the debate over fuel economy potential. In meetings over nearly two years, engineers and experts from the domestic manufacturers and DOE have scrutinized definitions, assumptions, and estimation methods. This process produced revisions of several estimates and a narrowing of differences, but not complete agreement. Estimates made by nearly all the major automobile manufacturers have been compiled by Ford Motor Company (1991). Estimates for particular sets of technologies have also been developed by Berger et al. (1990) and by SRI (1991). The committee considered all these sources, which are compiled in Table B-1. It elected to base its shopping cart projections on two sets of estimates—those developed by EEA (1991a) under the sponsorship of DOE and those developed by SRI (1991) under the sponsorship of the MVMA. The SRI estimates, developed to serve as a consensus from the domestic industry, are generally similar, but not identical to the estimates provided by Ford. The EEA and SRI reports are the only sources that provide technology-specific information on both percentage fuel economy improvements and costs. The cost estimates are summarized in Table B-2.
ENGINE TECHNOLOGIES
Under the category of engine technologies in Table B-1 are included those technologies that address the thermodynamic efficiency of combustion, internal engine friction, and pumping losses, as well as energy used by essential engine accessories, such as oil pumps and alternators, and nonessential accessories, such as air-conditioners and power steering.
TABLE B–1 Estimates of Fuel Economy Improvement Potential of Various Technologies (percent)
|
TECHNOLOGY |
BASELINE |
EEA |
SRI |
BSA |
FORD |
GM |
CHRYSLER |
TOYOTA |
HONDA |
NISSAN |
MITSUBISHI |
|
ENGINE TECHNOLOGIES |
|||||||||||
|
GENERAL |
|||||||||||
|
Roller cam followers |
Flat followers |
2.0 |
1.7 |
0.3 |
3.0 |
1.5 |
2.4 |
0.8 |
1.0 |
1.4 |
1.3 |
|
Friction reduction, -10% |
Base 1987 |
2.0 |
2.0 |
|
2.0 |
1.0 |
0.5 |
0.8 |
1.0 |
1.4 |
|
|
Accessory improvement |
Conventional |
0.5 |
0.7 |
|
0.7 |
0.0 |
1.4 |
0.5 |
|
0.2 |
0.8 |
|
Deceleration fuel restriction |
None |
1.0 |
1.0 |
|
1.0 |
|
|
|
|
|
|
|
Compression ratio, +.5 |
9:1 (EEA 4-V only) |
2.0 |
|
1.5 |
1.0 |
|
1.3 |
|
|
1.0 |
|
|
FUEL SYSTEMS |
|||||||||||
|
Throttle-body fuel injection |
Carburetor |
3.0 |
2.6 |
3.0 |
3.0 |
2.5 |
3.4 |
0.8 |
1.0 |
3.3 |
|
|
Multipoint fuel injection |
Carburetor |
5.0 [b] |
4.6 |
3.1 |
6.0 |
4.0 |
4.9 |
2.5 |
3.5 |
4.3 |
|
|
VALVE TRAIN |
|||||||||||
|
Overhead camshaft |
Overhead valve |
3.0 |
2.5 |
1.2 |
3.5 |
1.5 |
2.0 |
|
0.8 |
2.0 |
|
|
4 valves per cylinder |
2 valves |
5.0 |
3.0 |
2.1 |
3.5 |
3.0 |
3.5 |
4.5 |
2.0 |
3.4 |
|
|
Variable valve timing |
Fixed timing |
6.0 |
2.6 |
|
3.0 |
2.0 |
1.5 |
2.0 |
2.5 [c] |
2.7 |
|
|
REDUCED NUMBER OF CYLINDERS |
|||||||||||
|
4-cylinder |
6-cylinder |
3.0 |
0.0 |
1.2 |
-3.0 |
0.0 |
0.0 |
0.0 |
0.0 |
0.0 |
|
|
6-cylinder |
8-cylinder |
3.0 |
1.0 |
-0.9 |
0.0 |
0.0 |
0.0 |
0.0 |
0.0 |
0.0 |
|
|
TRANSMISSION TECHNOLOGIES |
|||||||||||
|
Torque converter lock-up |
Open converter |
3.0 |
2.0 |
2.8 |
2.0 |
3.0 |
3.0 |
2.5 |
3.0 |
3.2 |
|
|
Electric transmission control |
Hydraulic |
0.5 |
0.5 |
0.5 |
0.5 |
0.0 |
0.5 |
0.5 |
0.5 |
0.6 |
|
|
4-speed Automatic |
3-speed auto |
4.5 |
2.8 |
2.9 |
3.0 |
4.0 |
2.0 |
2.3 |
1.8 |
3.0 |
|
|
5-speed Automatic |
3-speed auto |
7.0 |
3.3 |
|
5.0 |
4.5 |
3.0 |
3.5 |
3.3 |
4.0 |
|
|
Continuously variable transmission |
3-speed auto |
8.0 |
4.8 |
|
5.5 |
4.5 |
3.0 |
|
3.8 |
5.5 |
|
|
5-speed Manual [d] |
3-speed auto |
8.0 |
4.8 |
0.0 |
5.5 |
0.0 |
0.0 |
0.0 |
0.0 |
0.0 |
|
|
ROLLING RESISTANCE, AERODYNAMICS, AND WEIGHT |
|||||||||||
|
Front wheel drive |
Rear wheel drive |
10.0 |
0.5 |
0.8 |
1.0 |
0.0 |
|
|
1.1 |
3.0 |
|
|
Aerodynamics |
Base |
2.3 |
2.4 |
2.7 |
2.0 |
3.1 |
2.0 |
2.0 |
1.5 |
1.2 |
1.7 |
|
Weight reduction, -10% |
Base |
6.6 |
5.0 |
9.1 |
5.5 |
8.0 |
5.0 |
5.5 |
5.0 |
6.0 |
|
|
Electric power steering |
Conventional |
1.0 |
1.4 |
|
1.5 |
0.5 |
1.0 |
1.0 |
1.0 |
1.0 |
|
|
Advanced tires, -10% |
Base |
1.0 |
1.0 |
0.6 |
1.0 |
0.5 |
0.5 |
|
|
1.0 |
1.0 |
|
Advanced lubricants |
Conventional |
0.5 |
0.3 |
|
0.2 |
|
|
0.5 |
0.5 |
|
|
|
[a] Fuel economy benefit for EEA incorporated into 4-valve engine. [b] Apportioned to account for incorporation of limited deceleration fuel restriction in multipoint fuel injection. [c] A savings as large as 12.5 percent can be inferred from discussion in Chapter 2 or Appendix C. [d] Fuel economy benefit assumed same as that of CVT over 3-speed automatic transmission. Source: Committee adaptation of summary of presentations to the committee, July 1991, prepared by A. Gilmour (Ford, 1991). Baseline technologies are arbitrary and have been changed from some original sources to put all estimates on a comparable basis. |
|||||||||||
TABLE B–2 Costs of Fuel Economy Improvement Technologies
|
|
|
Data Source and Engine Type |
|
||||
|
|
EEA (1988 $) |
SRI (1990 $) |
|||||
|
TECHNOLOGY |
BASELINE |
4 Cyl |
6 Cyl |
8 Cyl |
4 Cyl |
6 Cyl |
8 Cyl |
|
ENGINE TECHNOLOGIES |
|||||||
|
GENERAL |
|||||||
|
Roller cam followers |
Flat followers |
16 |
24 |
32 |
65 |
65 |
65 |
|
Friction reduction, -10% |
Base 1987 |
30 |
40 |
50 |
60 |
60 |
60 |
|
Accessory improvement |
Conventional |
12 |
12 |
12 |
200 |
200 |
200 |
|
Deceleration fuel restriction |
None |
|
|
|
5 |
5 |
5 |
|
Compression ratio, +.5 |
9:1 (EEA 4-V only) |
|
|
|
1 |
1 |
1 |
|
FUEL SYSTEMS |
|||||||
|
Throttle-body fuel injection |
Carburetor |
42 |
70 |
70 |
65 |
65 |
65 |
|
Multipoint fuel injection |
Carburetor |
90 |
134 |
150 |
215 |
215 |
215 |
|
VALVE TRAIN |
|||||||
|
Overhead camshaft |
Overhead valve |
110 |
160 |
200 |
400 |
400 |
400 |
|
4 valves per cylinder |
2 valves |
140 |
180 |
225 |
400 |
400 |
400 |
|
Variable valve timing |
Fixed timing |
140 |
200 |
267 |
100 |
100 |
100 |
|
REDUCED NUMBER OF CYLINDERS [a] |
|||||||
|
4-cylinder |
6-cylinder |
0 |
(300) |
(550) |
0 |
(300) |
(550) |
|
6-cylinder |
8-cylinder |
300 |
0 |
(250) |
300 |
0 |
(250) |
|
TRANSMISSION TECHNOLOGIES |
|||||||
|
Torque converter lock-up |
Open converter |
50 |
50 |
50 |
56 |
56 |
56 |
|
Electric transmission control |
Hydraulic |
24 |
24 |
24 |
122 |
122 |
122 |
|
4-speed Automatic |
3-speed auto |
225 |
225 |
225 |
230 |
230 |
230 |
|
5-speed Automatic |
3-speed auto |
325 |
325 |
325 |
530 |
530 |
530 |
|
Continuously variable transmission |
3-speed auto |
325 |
325 |
325 |
640 |
640 |
640 |
|
5-speed Manual [d] |
3-speed auto |
|
|||||
|
ROLLING RESISTANCE, AERODYNAMICS, AND WEIGHT |
|||||||
|
Front wheel drive |
Rear wheel drive |
240 |
240 |
240 |
26 |
26 |
26 |
|
Aerodynamics |
Base |
40 |
40 |
40 |
60 |
60 |
60 |
|
Weight reduction, -10% |
Base |
—varies [b] — |
470 |
470 |
470 |
||
|
Electric power steering [c] |
Conventional |
45 |
45 |
45 |
61 |
61 |
61 |
|
Advanced tires, -10% |
Base |
18 |
18 |
18 |
20 |
20 |
20 |
|
Advanced lubricants |
Conventional |
2 |
3 |
3 |
3 |
3 |
3 |
|
[a] Reduced number of cylinders keeping engine displacement constant. Numbers in EEA columns are based on SRI. [b] Based on cost of $0.50 per pound saved (EEA, 1991a) multiplied by 10 percent of average weight of all cars in the size class. [c] Committee estimate based on price of electric power steering for Honda Civic in Japan. Source: Committee estimates based on adaptation of data from EEA (1991b), SRI (1991), and other sources. |
|||||||
General
This subcategory of engine technologies includes those specifically addressing friction reduction and thermodynamic efficiency, as well as certain ones that do not fit under the other subcategories—fuel systems, valve trains, and number of cylinders.
Roller Cam Followers
In conventional engines, intake and exhaust valves are operated by a camshaft whose lobes are in sliding contact with a cam follower. This is a large source of friction in a conventional engine, accounting for up to one-fourth of all engine friction (Ledbetter and Ross, 1990). Roller cam followers incorporate hardened steel roller bearings that reduce this source of friction. They are estimated to increase fuel economy by about 2 percent. Domestic manufacturers tend to give higher estimates than foreign manufacturers, as shown in Table B-1, and they currently make much greater use of roller cam followers, which are already in widespread use in car and light-truck engines of all sizes.
EEA (1991b) estimates that the RPE of roller cams is $4 per cylinder, or $16 for a 4-cylinder engine to $32 for an 8-cylinder. SRI (1991) reports a much higher RPE, $65, as an average for all cars.2
Friction Reduction
About 20 percent of engine power is lost to friction (Office of Technology Assessment [OTA], 1991). The primary sources of friction at moderate engine speeds, in order of importance, are the pistons and rings, valve train, crankshaft, and oil pump (EEA, 1991a). Engine friction has been gradually reduced over several decades. According to SRI, redesign of pistons and rings and modification of bearings throughout the engine could produce an overall 10 percent reduction in engine friction, yielding a fuel economy gain of 1.5 to 2.0 percent. EEA and Ledbetter and Ross (1990) concur with the high end of this range (2.0 percent) for the fuel economy effect of low-tension piston rings, closer machining tolerances for pistons, cylinders and bearing surfaces, and use of lightweight pistons.3 The latter sources point out that the use of lightweight valves and ceramic pistons, titanium valve springs, lightweight composite connecting rods, and two rather than three piston rings, together with oil-pump and crankshaft modifications, could reduce engine friction by another 10 percent, for another 2 percent fuel economy benefit. SRI considers lightweight valve trains separately and estimates a fuel economy improvement of 0.5 percent for that change alone.
Overall, then, a fuel economy improvement of 2 percent for each 10 percent reduction in engine friction, up to a maximum friction reduction of 20 percent, seems to be a reasonable estimate. Although the amount of friction reduction achievable and its impact on fuel economy may vary by engine, there are no inherent limitations on the use of friction-reducing technology in the engine.
The RPE estimates for a 10 percent reduction in internal engine friction are about $50 per car. SRI (1991) puts the RPE at $60, and EEA (1991b) puts the RPE at $30 for a 4-cylinder, $40 for a 6-cylinder, and $50 for an 8-cylinder engine.
Accessory Improvements
Accessories either perform essential engine-supporting functions (e.g., the water pump, oil pump, cooling fan, and alternator) or provide optional services for the driver and occupants (the power-steering pump and air-conditioning compressor). They can account for perhaps 15 percent of vehicle energy requirements (EEA, 1991a). Accessories typically require about the same amount of energy regardless of vehicle size, so they have a somewhat greater proportional impact on the fuel economy of smaller cars. The energy requirements of accessories do not typically increase in direct proportion to engine speed, yet traditional accessory drive mechanisms are geared so that their speed does increase with the engine speed, which results in a poor match between energy inputs and requirements.
Fuel economy can be improved by increasing the efficiency of the accessory system or by better matching its operation to requirements. A great deal of improvement has already been achieved in this area over the past decade. For example, before 1980, most cooling fans were driven by a drive belt operating from the crankshaft. The faster the engine speed, the faster the fan turned. However, at highway speeds the fan is not usually needed, so the energy used to run the fan was wasted. Today, front-wheel drive vehicles are equipped with thermostatically operated electric fans that turn on only when needed.
More generally, accessories driven by a single-speed drive use excessive energy at high engine speeds (SRI, 1991). Variable-speed drives can reduce this waste, but so far the cost and complexity of variable-speed drive systems have not been justified by the 0.5 to 1.0 percent efficiency improvement they can achieve (EEA, 1991a; SRI, 1991). EEA asserts, however, that incremental improvements in drive systems, optimization of fan and pump blade shapes, and reduced heat rejection from the engine can combine to raise fuel economy.
Estimates of the costs of accessory improvements differ, depending on which specific improvements are included. EEA (1991b) estimates an RPE of $12 for an 0.5 percent improvement, excluding use of variable-speed drives and electric power steering. SRI (1991) estimates that the RPE of two-speed accessory drive will be $200. The high and uncertain costs of these technologies support the committee's view that variable-speed drives are not proven technology.
Deceleration Fuel Restriction
Since the momentum of the vehicle actually drives the engine during deceleration, it is possible to restrict the fuel input sharply with no effect on operation. In the extreme, shutting off all fuel flow would require restarting the engine to restore power. This is the version considered by SRI (1991). EEA (1991a) combines a partial
reduction in fuel flow that does not shut off the engine with multipoint fuel injection. Both SRI and EEA conclude that fuel restriction during deceleration can increase fuel economy by about 1 percent. There are no technical limits on the applicability of this technology. SRI (1991) puts its RPE at $5; EEA (1991b) bundles it with multipoint fuel-injection technology, discussed below.
Compression Ratio Increase
All else remaining equal, an engine with a higher compression ratio converts a greater proportion of fuel energy into useful work and a lesser proportion to waste heat; that is, the engine has a higher thermal efficiency. Small changes in engine design to ameliorate the increased tendency to knock (modification of the cylinder heads, electronic engine controls, and addition of knock sensors) can lead to a 5 to 6 percent increase in compression ratio (typically from about 9.0:1 to 9.5:1) with an accompanying 1.3 to 2.0 percent increase in fuel economy (SRI, 1991) and without requiring use of higher octane fuel. Higher compression ratios are generally associated with greater production of oxides of nitrogen (NOx). Such modifications could be made to essentially all gasoline-powered vehicles, although they are most suitable for vehicles that do not already use high compression ratios. The RPE of a compression-ratio increase is estimated by SRI to be very small—on the order of $1—assuming no additional hardware or controls are needed.
Fuel Systems (Throttle-Body And Multipoint Fuel Injection)
In 1975, 95 percent of all passenger cars and 99.9 percent of all light trucks sold in the United States used carburetors. By the 1991 model year the situation was completely reversed: 99.7 percent of all cars and 98.1 percent of all light trucks were equipped with fuel injection (Heavenrich et al., 1991).
Fuel injection has several advantages over carburetion. Because the flow restriction of the carburetor is eliminated and there is no need to preheat the air/fuel mixture, torque and maximum horsepower are increased (Newton et al., 1989). In addition, fuel injection controlled by modern computer-based electronics can better match fuel supply to engine operating conditions, thereby improving drivability, emissions control, and fuel economy. Compared with carburetion, fuel injection leads to a modest reduction in pumping losses in getting air/fuel mixture into the combustion chamber and to a slight reduction in the relative importance of engine friction because power per unit of displacement is increased. Fuel injection is a clear example of a technology that offers significant benefits beyond increased fuel economy.
There are two general types of fuel-injection systems. Throttle-body (or single-point) fuel injection uses one or two injectors to inject fuel upstream of the throttle valve at essentially the same place as from a carburetor. Multipoint fuel injection (MFI) locates an injector immediately upstream of each inlet valve, which enables better control of the air/fuel mixture to each cylinder. Throttle-body injection (TBI) is simpler and cheaper than multipoint injection.
EEA (1991a) estimates the combined fuel economy improvement of TBI at 3 percent, and SRI (1991) suggests a 2.6 percent improvement. Three percent seems a good consensus estimate, as suggested by Table B-1.
According to EEA (1991a), MFI produces an additional 1.2 to 1.5 percent improvement in fuel economy over TBI. SRI (1991) gives a slightly higher estimate of 1.5 to 2.0 percent. MFI allows greater control of fuel flow during deceleration, and it is required for effective deceleration fuel shutoff. EEA includes this effect under MFI, and SRI reports it separately under ''Deceleration Fuel Off." EEA points out that MFI also allows the use of a tuned intake manifold to optimize airflow and that the unheated charge is denser than a preheated charge would be, which increases volumetric efficiency. As a result, EEA points out that an optimized drivetrain would adjust the rear-axle ratio for the slight increase in torque with MFI, which would produce another gain in fuel economy of approximately 0.5 percent. In sum, SRI and most manufacturers suggest a 1.5 to 2 percent gain for MFI over TBI, whereas EEA indicates a 2 percent gain, with an additional 1.0 percent available through deceleration fuel restriction. Thus, the total improvement over a carbureted system is about 5 percent without deceleration fuel shutoff, and about 6 percent with.
Both TBI and MFI systems are applicable to all passenger cars and light trucks with spark-ignition engine. Because of the multiple advantages of the MFI system, it is likely to replace TBI systems by 1995 or shortly after (SRI, 1991).
Cost estimates for TBI systems are in close agreement. EEA (1991b) estimates the RPE at $42 for one-injector and $70 for two-injector systems, while SRI (1991) indicates $65 without specifying the number of injectors (presumably one). These sources do not agree, however, on the RPE of MFI. EEA's estimates range from $48 for a 4-cylinder engine to $80 for 8-cylinders, and SRI reports $215 without specifying engine size.
Valve Train Technologies
Valve train improvements can improve engine efficiency in three areas: (1) pumping losses, (2) engine friction, and (3) thermodynamic efficiency.
Overhead Camshaft
Locating the camshaft above the cylinder heads to operate the valves directly allows several improvements in engine design. Inertial forces in the valve train are reduced because some parts of the traditional arrangement are eliminated. Having fewer moving parts also reduces friction and improves high-speed operation by allowing the valves to be opened and closed more rapidly. Similarly, the total valve-opening time can be reduced, which improves low-speed torque and fuel economy. Finally, some overhead cam (OHC) designs allow increased flexibility in valve location and, therefore, improved shape of the combustion chambers.
All of the above factors allow greater power output for a given engine size. Overhead-valve engines of older design achieved power outputs of about 40 BHP/liter
(brake horsepower per liter of displacement), and modern versions achieve 45 BHP/liter. In comparison, modern OHC engines produce 50 to 55 BHP/liter.
At equal power output, OHC engines achieve better fuel economy than overhead-valve engines, although the exact difference depends strongly on the related changes and design choices that are made. SRI (1991) suggests gains in the range of 1.1 to 2.5 percent without design changes; the General Motors, Ford, and Chrysler estimates are 1.5, 2.0, and 3.5 percent, respectively (see Table B-1). EEA (1991a) reports a 1.0 percent efficiency gain at constant displacement, a 3.0 to 3.8 percent efficiency gain due to a reduction in displacement to achieve constant peak power, and a 1.1 to 1.3 percent loss in efficiency due to a change in axle ratio to compensate for changes in the shape of the torque curve—all of which results in an overall gain of 2.9 to 3.5 percent in fuel economy. There are no limits to the applicability of OHC engines.
The cost penalty of an OHC engine depends primarily on the complexity of the camshaft drive system. There is little inherent reason for an OHC engine to cost more since it has fewer moving parts and does not require any exotic technologies. EEA (1991b) suggests an RPE of $110 for a 4-cylinder engine, $160 for a 6-cylinder, and $200 for 8-cylinders. SRI (1991) reports an average RPE of $400 per engine. The committee believes that both of these estimates may be too high, especially for 4-cylinder engines.
Four Valves per Cylinder
Conventional engines use two valves per cylinder, one each for intake and exhaust. As engine speed increases, the aerodynamic resistance to pumping air in and exhaust out of the cylinder increases. By doubling the number of intake and exhaust valves per cylinder, pumping losses are reduced and useful power output is increased, especially at high engine speeds. Still greater improvements can be achieved by using variable valve timing and lift control to take advantage of the 4-valve configuration (see below). In many cases, the inlet passage to each valve is controlled separately, which further improves the operation of the engine over wide ranges of speed and load.
In addition to enhancing the flow of gases in the engine, the 4-valve design also allows the spark plug to be positioned closer to the center of the combustion chamber, which decreases the distance the flame must travel to complete combustion. In addition, using two streams of incoming gas can help to achieve more complete mixing of air and fuel, further increasing combustion efficiency (Newton et al., 1989). The Honda VTEC-E engine uses this central placement to create optimal conditions for "lean" combustion (see below). Central placement of the spark plug not only promotes more rapid combustion, but also allows the ignition timing to be retarded, thereby decreasing the dwell time of hot gases in the combustion chamber and reducing the formation of NOx (Newton et al., 1989).
Four-valve engines typically produce 10 percent higher torque and 20 percent greater peak horsepower than OHC engines of 2-valve design (EEA, 1991a; Ledbetter and Ross, 1990). SRI suggests a fuel economy gain of 0.8 to 1.3 percent from use of 4-valves, which permits reduction of the engine displacement while maintaining output
power. This estimate apparently ignores the opportunities for more rapid combustion due to a more central location of the spark plug. EEA claims that the spark plug location and improved airflow together allow an increase in compression ratio of about 10 percent (typically to 10:1) without increased octane requirements. EEA breaks down the fuel economy changes resulting from replacing a conventional engine with a 4-valve engine as follows:
|
10 percent decrease in displacement |
+3.8% |
|
5 percent axle ratio increase |
-1.1% |
|
Increase in thermal efficiency |
+2.5% |
|
Increase in valvetrain friction |
-0.5% |
|
Reduced pumping losses |
+0.5% |
|
NET FUEL ECONOMY CHANGE |
+5.2% |
SRI and auto manufacturers suggest that the applicability of 4-valve engines will be limited by their relatively low torque at low engine speeds. Poor low-speed torque would make such engines less suitable for large cars and light trucks. It would also limit their acceptance by consumers who value the acceleration and "feel" of vehicles with high torque at low speed. Fortunately, variable valve timing and lift control have the potential to restore the low-end torque of 4-valve engines and make their torque curves resemble those of 2-valve engines of equal power (see below). In its analysis, the committee assumed that the two technologies are used in combination, so it sees no limits on the use of 4-valve technology in the future.
Four-valve systems are more complex than 2-valve systems and, therefore, are significantly more costly. SRI (1991) suggests that the RPE of a 4-valve single overhead cam (SOHC) engine would be $400 more than a 2-valve SOHC and that a 4-valve dual overhead cam (DOHC) engine would be priced at $650 more than a 2-valve SOHC. EEA (1991b) indicates lower prices: $140 for a 4-cylinder, $180 for a 6-cylinder, and $225 for an 8-cylinder engine.
Variable Valve Timing and Lift Control
Conventional engines use fixed valve timing and lift at all engine speeds. At light loads, closing the intake valve earlier would reduce pumping losses (EEA, 1991a). If valves are opened further and for a longer time at higher speeds, the engine can "breathe" more easily, which produces higher horsepower.
A variety of approaches can be taken to variable valve timing. Honda's lean-burn VTEC-E engine is an example of a 4-valve, variable valve control engine optimized for fuel economy.4 The VTEC-E achieves 15 percent higher torque at 2,000 rpm, and generally higher torque across the range of low rpm, than an equivalent Honda non-VTEC, 4-valve engine (EEA, 1991a; Honda Motor Company, 1991). At
|
4 |
The California version of the VTEC-E uses enhanced exhaust gas recirculation rather than excess air. See Appendix C for a description of lean-burn technology. |
low rpm, one of the two intake valves in each cylinder remains nearly closed, which creates a swirling motion in the combustion chamber that allows a rich air/fuel mixture to be maintained in a vortex near the centrally located spark plug, while the total air/fuel charge remains very lean. (The nominally closed intake valve remains slightly open to prevent accumulation of liquid fuel in the port.) This feature, which is made possible by variable valve control, allows smooth operation under lean-burn conditions at low rpm. In a presentation to the Technology Subgroup of the committee, at its meeting on September 5-6, 1991 in Detroit, Michigan (see Appendix F), Honda asserted that these features produce a 10 to 15 percent gain in fuel economy and that variable valve control alone without lean-burn operation yields a 7 to 8 percent fuel economy benefit.
Honda's estimate of the VTEC-E's fuel economy apparently does not take account of reoptimization of the drivetrain to take advantage of the higher low-rpm torque that variable valve control makes possible. The difference in fuel economy between the VTEC-E (in the 1992 Civic VX) and a non-VTEC 16-valve engine (in the 1992 Civic DX) is 32.3 percent for the lean-burn version and 22.2 percent for the California version without lean burn. Thus, the lean-burn feature may lead to a 10 percent increase in fuel economy benefit.
The Honda Civic VXs use other fuel-saving features, including a 5 percent reduction in weight compared with the DX, reduced tire rolling resistance, reduced aerodynamic drag (about 3 percent), and changes in axle and gear ratios to take advantage of the VTEC's better torque curve (American Honda Motor Company, 1991; Duleep, 1991). These changes (except the axle and gear changes) taken together may account for about 6 percent of the 32.3 percent and 22.2 percent improvements (about 3 percent for weight reduction, 0.7 percent for the drag reduction, perhaps 0.5 percent each for improved lubricants and reduced accessory loads, and 1 to 2 percent for the improved tires). These estimates suggest a gain of 16 percent for variable valve control and the changes in axle and gear ratios it permits. Other modifications of which the committee is not aware may reduce the benefit attributable to variable valve control and associated drivetrain optimization, but probably not by more than a few percentage points.
Honda's VTEC-E demonstrates that a combination of 4-valve per cylinder technology and valve control can produce a fuel-efficient engine with good torque at low engine speed. As a result, the committee see no limitations, other than those due to cost, on the application of 4-valve engines or variable valve timing and lift control.
Variable valve timing applied to an OHC engine would have an RPE of $100 on average, according to manufacturers' estimates reported by SRI (1991). EEA's (1991b) estimates are considerably higher: $140 for a 4-cylinder, $200 for a 6-cylinder, and $267 for an 8-cylinder engine.
Number of Cylinders
During the past decade and a half, the power output of automotive engines per unit of displacement has increased substantially, which suggests the possibility of
continued engine downsizing.5 At equal displacement and peak horsepower, an engine with fewer cylinders has fewer moving parts and a lower ratio of cylinder surface area to volume. The first factor tends to reduce engine friction, and reducing the surface-to-volume ratio tends to improve the thermal efficiency of the engine, although the larger displacement cylinder has an increased tendency to knock. Also, 4-cylinder engines are typically about 40 to 50 pounds lighter than 6-cylinder ones producing the same power (EEA, 1991a).
The auto manufacturers assert that reducing the number of cylinders raises both idle rpm and the speed at which the engine begins to "lug" (SRI, 1991). In a 4-cylinder engine, there are only two power pulses per revolution so no power is being delivered by a piston to the crankshaft about one-sixth of the time (Newton et al., 1989). The low frequency and high amplitude of these power pulses significantly increase the vibration levels of a 4- compared with a 6-cylinder engine and to a lesser extent, of a 6- compared with an 8-cylinder engine. Idle speed can be increased to overcome vibration at idle, but that consumes additional fuel, thus reducing fuel economy. To ensure smooth operation in low-speed driving, gear ratios and lockup speeds must be changed in going from a 6- to a 4-cylinder engine, which generally results in lower fuel economy under otherwise similar conditions.
There is no argument that engines with fewer cylinders experience the above problems, but there is considerable disagreement about whether they offer net fuel economy benefits after modification to produce acceptable vibration. EEA (1991a) estimates that replacing a V-6 engine with an in-line 4-cylinder (I-4) engine of equivalent displacement could reduce friction by 15 percent, resulting in a 3 percent fuel economy benefit. EEA also suggests a 1.6 to 3.0 percent fuel economy gain in moving from a V-8 to a V-6. SRI (1991) reports a 1 percent gain for the switch from V-8 to V-6 and no gain for changing from a V-6 to an I-4, because of the other design changes that are required to hold consumer satisfaction constant. Ford (1991) indicates that the changes necessary to keep consumers equally satisfied in moving from 6 to 4 cylinders would actually produce a fuel economy loss of 3.0 percent.
Whether reducing the number of cylinders is a valid fuel economy option is important for two other reasons. First, engines with fewer cylinders are cheaper to make. SRI suggests a savings of $250 in going from a V-8 to a V-6 engine, and a savings of $300 in converting from a V-6 to a 4-cylinder. Second, several other fuel economy technologies described below also increase an engine's output per unit of displacement, which allows a reduction in engine size for the same power. Reducing displacement generally reduces vibration, which, in turn, allows a reduction in the number of cylinders and produces synergistic fuel economy and cost benefits.
The committee generally assumed that it is practical to decrease the cylinder count by two in future vehicles. That is, six cylinders can be replaced by four, and eight
cylinders by six. The committee further assumes that (1) cylinder count is not reduced for existing 4-cylinder vehicles; (2) changes in cylinder count are in combination with other technological changes that increase peak horsepower per unit of displacement (overhead cam, four valves per cylinder) and preserve low-rpm torque (variable valve timing and life control); and (3) improvements in engine mountings and other areas can reduce the impact on vibration and noise of using engines with fewer cylinders, but some increases in noise, vibration, and harshness are probably unavoidable. The true consumer costs of such changes, therefore, are understated by their RPEs.
Transmission Technologies
Automotive transmissions are a means for varying the ratio of engine speed to vehicle speed, thus allowing the engine to operate somewhere in the optimum speed range and the automobile to operate over a wider range of speeds than would be feasible if the engine were connected directly to the drive wheels.
Transmissions affect fuel economy in two fundamental ways. First, energy is lost to friction within the transmission itself. Second, the wider the ratio range of the gears in the transmission and the more carefully controlled the transmission shift point, the more the engine can be kept in its most fuel-efficient operating regime over a wide range of operating speeds and loads without sacrificing performance. Both aspects can be manipulated to affect fuel economy.
Torque Converter Lockup
The torque converter of an automatic transmission transfers drive power from the engine to the transmission gears; that is, it serves the same purpose as the clutch in a manual transmission except that it also has torque multiplication capabilities. Both slippage and torque multiplication are present when the vehicle is starting from stop or changing gears to allow the synchronization of engine and gears. However, slippage during cruising wastes energy (Ledbetter and Ross, 1990). A torque converter with lockup eliminates slippage when the vehicle is cruising, which makes the converter 100 percent efficient under these conditions. Lockup may be applied to the top gear only, or to lower gears as well.
If engine and transmission speeds are not perfectly matched when the converter locks, a shock is transmitted to the drivetrain that the driver may be able to feel. In addition, the transmission of engine vibration to passengers increases. This has apparently caused some consumer dissatisfaction in the past, particularly in small 4-cylinder vehicles. Improved transmission controls and reduced vibration in 4-cylinder engines should ameliorate these problems and thereby make the lockup feature broadly applicable to cars and light trucks.
There is general agreement that the lockup torque converter increases fuel economy by about 2 to 3 percent. EEA (1991b) and SRI (1991) agree that it adds just over $50 to the price of a vehicle.
Electronic Transmission Controls
Control of automatic transmissions, which is conventionally executed hydraulically, can be improved by using more precise electronic control of gear shifting, with the result that the transmission will operate in the optimum gear a greater proportion of the time. Estimates of the fuel economy benefits of electronic transmission controls in the early 1980s suggested benefits on the order of 3 to 5 percent (EEA, 1991a). Since then, hydraulic systems have been optimized to produce maximum fuel economy over the EPA test cycle. As a result, SRI and EEA agree on a potential additional increase in fuel economy of only 0.5 percent. Others contend that a 1.5 percent increase is possible, perhaps by sacrificing some smoothness of operation for optimum shifting (Ledbetter and Ross, 1990). This technology is widely applicable to cars and trucks. Price estimates differ by a factor of five. EEA (1991b) suggests $24 and SRI (1991) $122.
4-Speed and 5-Speed Automatic Transmissions
In comparison with standard 3-speed automatic transmissions, the additional gear ratios provided by 4- and 5-speed automatics allow the engine to operate closer to its most fuel-efficient regime more of the time. EEA (1991b) claims a fuel economy benefit of 4.5 percent for 4-speed versus 3-speed automatic transmissions. Estimates provided by Chrysler, Ford, and General Motors are 2, 3, and 4 percent, respectively; and SRI suggests that 2.8 percent is achievable (see Table B-1).
For 5-speed versus 4-speed automatic transmissions, SRI (1991) estimates fuel savings of 0.5 percent and EEA (1991a) estimates 2.5 percent. EEA cites a published study by Nissan and unpublished results of tests by Mercedes Benz and Ford that suggest improvements in the range of 2 to 3 percent for 5-speed versus 4-speed transmissions.
Adding gear ratios tends to increase the size, weight, and cost of the transmission, however. Accommodating a 5-speed automatic transmission in minicompact and subcompact cars would be very difficult. Thus, in this analysis, the committee limited minicompact and subcompact cars and light trucks to 4-speed automatics (or continuously variable transmissions, see below), and projected only limited use of 5-speed automatics in the compact class.
As noted, the increased complexity of automatic transmissions with additional gear ratios adds to their cost. SRI (1991) suggests a price increase of $230 in moving from a 3-speed to a 4-speed automatic, and an additional $300 to add a fifth gear. EEA (1991b) is in close agreement about the incremental cost of a 4-speed transmission ($225), but it suggests that a fifth gear would add only $100 to the price.
Continuously Variable Transmissions
The continuously variable transmission (CVT) is based on an entirely different mechanism for connecting the engine and drive wheels in variable ratios. Instead of a set of intermeshing gears of different diameters, one design now in production uses
a continuous, flexible drive belt that engages two variable-diameter pulleys, one connected to the engine and one to the output. Sliding the sheaves of the pulleys together or apart to change their diameters changes the ratio of the rpm of the engine to the rpm of the drive wheels.
Within limits, the CVT offers an infinite number of gear ratios. In addition to allowing operation of the engine at its most efficient point regardless of changes in load and vehicle speed, the jerk-free shifting of gear ratios and absence of shock loading on the drivetrain hold out the possibility of reduced wear and a smoother ride (Newton et al., 1989).
Although there are several CVT designs, only Subaru offers one for sale in the United States. Major obstacles to widespread use of CVTs include the difficulty of control and the inability of existing designs to transmit high torque levels. Microprocessors and electronic controls promise to solve control problems (and also open up the possibility of regenerative breaking; Newton et al., 1989) and increase the fuel-savings potential of CVTs (SRI, 1991).
Newton et al. (1989) suggest that an optimized CVT could increase the fuel efficiency of vehicles engaged in stop-start operation by as much as 22 percent. Estimates for gains using proven technology in passenger cars are much lower. EEA (1991a) suggests that current CVTs can do no better than 5-speed manual transmissions; that is, about a 3.5 percent gain over 4-speed automatics (thus, 8 percent over a 3-speed automatic). Ford and Nissan data suggest 2.5 percent is possible, and General Motors and Chrysler estimate 0.5 and 1.0 percent, respectively, in comparison with 4-speed automatics. SRI (1991) reports that 1 to 2 percent is now possible and that gains in electronic controls are likely to increase the benefit.
EEA (1991b) estimates a price increase for a CVT of $100 per car above a 4-speed automatic and $325 above a 3-speed, and SRI (1991) estimates that a CVT would be priced at $410 more than a 4-speed automatic with torque converter lock-up, which implies an increase of over $600 over a conventional 3-speed automatic.
5-Speed Manual Transmission
Essentially all 4-speed manual transmissions have already been replaced by 5-speed manual transmissions. The theoretical benefit of a greater number of gears is the same as for the 5- versus 4-speed automatic transmission. The manual transmission has the additional advantage over an automatic of lower friction and thus greater efficiency. About a 1 percent fuel economy gain over a 5-speed automatic (or 8 percent over a 3-speed automatic without lock-up) is reasonable. The committee does not have price estimates for 5-speed manual transmissions, although the price is surely less than for 3-speed automatics, perhaps $150 less. However, due to limits on consumer acceptance of manual transmissions, the committee does not foresee major shifts from automatic to manual transmissions in the future.
ROLLING RESISTANCE, AERODYNAMICS, WEIGHT, PERFORMANCE
All of the above technologies are related primarily to the efficiency with which the drivetrain converts energy in the fuel into useful work. Fuel economy can also be increased by decreasing the amount of work necessary to propel the vehicle that is, by reducing energy needed to overcome inertia (weight), aerodynamic drag, and rolling resistance. A variety of technologies help in this regard.
Front-Wheel Drive
Compared with traditional rear-wheel drive, front-wheel drive (FWD) connects the engine to the drive wheels through shorter drive connections, requires a more complex front axle and steering system, moves more of the vehicle weight to the front wheels, and facilitates more efficient use of the interior space of the vehicle.
Despite the very widespread use of FWD and the large amount of accumulated experience, the literature offers quite different estimates of its impact on fuel economy and its cost. The differences seem to arise from different definitions of what is included in this technology. The primary benefit of FWD is that it makes it possible to reduce vehicle weight while preserving interior volume. FWD incorporates the driveshaft, rear axle, and differential in a single unit, which saves about 100 pounds. The FWD transaxle is typically a little more efficient than a rear-wheel-drive driveshaft and differential. SRI (1991) suggests an efficiency gain of 0.3 to 0.5 percent, and EEA (1991a) suggests 1.5 percent.
The majority of the fuel economy benefit of FWD comes from redesigning the vehicle to reduce exterior dimensions, which is facilitated by the transverse engine mounting and the absence of a driveshaft tunnel. During the late 1970s and early 1980s, vehicles were extensively downsized through repackaging associated with FWD and through conversion to unibody construction, without significant reduction in interior volume. A nearly complete transformation from rear- to front-wheel drive was achieved at that time. If one compares the average weight per interior volume for different size classes of vehicles currently being sold, the FWD vehicles have 10 to 19 percent lower ratios of weight to interior volume (EEA, 1991a). Weight reductions of this magnitude would increase fuel economy by 6.6 to 12.5 percent. At the midpoint of this range, the resulting fuel economy improvement for FWD, including efficiency improvement and all weight effects, should therefore be between 10 and 11 percent.
The RPE of FWD drive conversion has been estimated at $240 by EEA (1991b) and at $25 or more by SRI (1991). The SRI estimate does not include the costs of repackaging and major weight reduction, however.
Aerodynamics
Aerodynamic drag is a force opposing the motion of a vehicle that results from the resistance of the ambient air to the movement of the vehicle through it. Quantitatively, drag is proportional to the product of the frontal cross-sectional area of a vehicle, the square of its velocity, and its coefficient of drag (CD). Thus, energy lost in overcoming
aerodynamic drag is related to the CD, which is a function of the shape of the vehicle and the many details of its surfaces.
Reducing cross-sectional area usually reduces the interior size of a vehicle and is thus of limited value in reducing drag. Driving slower reduces drag force, which is a considerable part of the motivation for the 55-mph speed limit. However, changing actual road speeds is not a consideration in EPA's Federal Test Procedure (FTP), so the committee focused on reducing in the drag coefficient as the only available means of reducing drag.
Complete data on drag coefficients for current automobiles are not available. EEA (1991b) has estimated that the average CD for 1988 model year vehicles was in the range of 0.37 to 0.38. Numerous makes and models are available with drag coefficients in the range of 0.30 to 0.33, and the best available models have drag coefficients below 0.30. Therefore, 10 and even 20 percent reductions in CD are entirely feasible. Although drag coefficients for light trucks are not likely to go as low as those of passenger cars, the committee sees no reason that a 10 percent CD reduction for trucks is not equally feasible.
Over the EPA FTP, fuel economy varies with drag (and hence the CD) with an elasticity of 0.2. That is, a 10 percent reduction in CD will produce a 2.3 percent increase in miles per gallon (OTA, 1991), and SRI (1991) cites 2.4 percent.
If reductions in the drag coefficient are timed to coincide with the periodic redesign of vehicles, the extra cost should be small. However, as drag is reduced by more than 10 percent, significant costs must be incurred for such changes as flush windows and improved fit of body parts. Reducing CD below 0.29 may require using a covered underbody, which would have a significant impact on price (EEA, 1991a). EEA (1991b) estimates $32 for the first 10 percent reduction and $48 for the second. SRI (1991) indicates that the first 10 percent reduction will cost more — about $60.
Weight Reduction
Lighter vehicles require less energy to overcome inertial forces (acceleration, hill climbing, and turning).6 Over the EPA test cycle, fuel economy is sensitive to simple weight reduction, with an elasticity of 0.5 (SRI, 1991). That is, a 10 percent weight reduction yields a 5 percent fuel economy increase. Holding performance constant, reduced vehicle weight allows reduced engine power and size, which adds to the fuel economy benefit of direct weight reduction. EEA (1991b) suggests an elasticity of 0.66 for the combined effect (this elasticity is smaller than would be suggested by the independent effects of a 10 percent reduction in weight and a 10 percent reduction in displacement).
Materials substitution and downsizing of components could yield a 10 percent weight reduction in the post-1995 time period, according to SRI. EEA cites work by the Department of Transportation indicating that increased use of high-strength, lowalloy steel, plastics, aluminum, and graphite-fiber-reinforced plastics could reduce vehicle weights by up to 30 percent. A weight reduction of 10 percent during the time frame of this study seems quite feasible and should be applicable to all light-duty vehicle types.
The cost of materials substitution will depend on the details of what materials are substituted where and on the associated changes in part and component designs. SRI (1991) provides estimates of RPEs for weight reductions of 1, 5, and 10 percent over 1995 model year vehicles weighing 3,000 pounds. The RPEs respectively are $50, $120, and $470, for roughly 30-, 150-, and 300 pound reductions in weight. (The price estimate for the 5 percent weight reduction does not appear to be consistent with the other two since it implies costs of under $1 per pound of weight removed. This difference could reflect a different strategy.) EEA (1991a) cites price estimates of $0 to $0.20 per pound of weight removed using glass-fiber-reinforced plastic body panels, and $0.40 per pound for use of aluminum. These estimates would put the price of a 10 percent weight reduction at less than $150.
Electric Power Steering
Electric power steering is one of many types of accessories. It is treated separately here because of its apparently higher cost and uncertainty about its stage of development. Commonly used hydraulic power-steering pumps use a significant fraction of engine power, particularly at low speeds. Replacing them with an electric motor can produce fuel economy gains of 1 percent or more. EEA suggests that the size and power requirements of motors for electric power steering may preclude its application in large vehicles (EEA, 1991a). SRI estimates that the RPE of electric power steering will be $60 or more.
Advanced Tires, Rolling Resistance
Rolling resistance arises primarily from the generation and dissipation of heat due to the periodic flexing of the tires as they bear the weight of the vehicle and provide driving, braking, and cornering forces while rotating. During ordinary driving, only a very small part of tire rolling resistance is due to slippage between the tire and the road and to aerodynamic drag. On the EPA urban driving test cycle, tire rolling resistance consumes about one-fourth to one-third of the energy delivered to the wheels (Ledbetter and Ross, 1990; MacCready, 1989). EEA (1991a) estimates that a 10 percent reduction in tire rolling resistance produces a 2 percent fuel economy benefit over the EPA test cycle. There seems to be good agreement between EEA and SRI (1991) that tire rolling resistance can be reduced by about 10 percent over the next decade or so. The result should be a 2 percent gain in fuel economy, but customer-driven trends toward high-performance tire designs may eliminate half of this gain according to EEA.
The price of reducing rolling resistance is expected to be modest, on the order of $20 per car according to EEA (1991b) and SRI (1991). There should be no limits to applicability of improved tires. However, some trade-offs with wet traction are expected.
Reductions in Performance
In recent years, typical passenger-car and light-truck performance levels have risen substantially. This is true whether performance is measured in acceleration time or horsepower-to-weight ratios (Heavenrich et al., 1991). Since 1987, 0 to 60 mph times have dropped 11 percent for passenger cars and light trucks. Horsepower-to-weight ratios rose by as much as 16 percent and 17 percent for various classes of cars and light trucks, respectively, over the same period. Had performance levels remained constant since 1987, the committee estimates that, on the assumption that a 1 percent reduction in engine performance (horsepower/weight ratio) is associated with a 0.38 percent increase in fuel economy (see Chapter 7), fleet-average fuel economy would now be about 2 mpg higher.
Reducing performance by reducing engine size yields a significant fuel economy benefit, but at the direct cost of performance if engine technology is unchanged. A 10 percent reduction in engine size can increase fuel economy by 3 to 4 percent. There should be no direct price increase associated with performance reduction; in fact, it should reduce cost. However, to the extent that consumers prefer higher performance levels, consumer satisfaction would be reduced.
REFERENCES
American Honda Motor Company, Inc. 1991. Statement of American Honda Motor Co., Inc., on Automotive Technologies for Fuel Economy before the Subcommittee on Environment, House Science, Space, and Technology Committee, October 2, 1991. Washington, D.C.
Berger, J.O., M.H. Smith, and R.W. Andrews. 1990. A system for estimating fuel economy potential due to technology improvements. Paper presented at the workshop of the Committee on Fuel Economy of Automobiles and Light Trucks, Irvine, Calif., July 8-12. University of Michigan, Ann Arbor.
Duleep, K.G. 1991. Honda's new Civic VTEC-E model. Memorandum for Oak Ridge National Laboratory and U.S. Department of Energy, August 14. Energy and Environmental Analysis, Inc., Arlington, Va.
Energy and Environmental Analysis, Inc. 1991a. Documentation of Attributes of Technologies to Improve Automotive Fuel Economy. Prepared for Martin Marietta, Energy Systems, Oak Ridge, Tenn. Arlington, Va.
Energy and Environmental Analysis, Inc. 1991b. Fuel economy technology benefits. Presented to the Technology Subgroup, Committee on Fuel Economy of Automobiles and Light Trucks, Detroit, Mich., July 31.
Ford Motor Company. 1991. Technology benefit/methodology. Attachment 1 of letter of August 14, from Alan D. Gilmour to Richard A. Meserve, chairman of the Committee on Fuel Economy of Automobiles and Light Trucks: table entitled Comparison of Optimum Technology Fuel Economy Percent Benefits Provided to NAS.
Heavenrich, R.M., J.D. Murrell, and K.H. Hellman, 1991. Light-duty Automotive Technology and Fuel Economy Trends Through 1991. Control Technology and Applications Branch, EPA/AA/CTAB/91-02. Ann Arbor, Mich.: U.S. Environmental Protection Agency.
Honda Motor Company, Ltd. 1991. Fuel economy estimate for NAS panel. Presented to the Technology Subgroup, Committee on Fuel Economy of Automobiles and Light Trucks, Detroit, Mich., July 31.
Ledbetter, M. and M. Ross, 1990. Supply curves of conserved energy for automobiles. Proceedings of the 25th Intersociety Energy Conservation Engineering Conference. New York: American Institute of Chemical Engineers .
Newton, K., W. Steeds, and T.K. Garrett. 1989. The Motor Vehicle. 11th ed. London: Butterworths.
Office of Technology Assessment (OTA), U.S. Congress. 1991. Improving Automobile Fuel Economy: New Standards, New Approaches. Washington, D.C.: U.S. Government Printing Office.
SRI International. 1991. Potential for Improved Fuel Economy in Passenger Cars and Light Trucks. Prepared for the Motor Vehicle Manufacturers Association. Menlo Park, Calif.
APPENDIX C
EMERGING ENGINE TECHNOLOGIES AND CONCEPT AND PROTOTYPE VEHICLES
EMERGING ENGINE TECHNOLOGIES
Lean-Burn Engine
Internal combustion engines burn a mixture of fuel and air; the air is the source of oxygen needed to engage in the chemical reaction with the fuel known as combustion, or burning. In standard engines, the ratio of air to fuel is set at or very near that which ensures that there is sufficient oxygen in the mixture to burn all of the fuel, yet not an excess amount of air.
A lean-burn engine is designed and operated so that some excess air over and above that needed for complete combustion is introduced into the combustion chambers. The term lean burn is also sometimes used to describe an engine in which exhaust gases, rather than excess air, are used to dilute the air/fuel mixture. In a lean-burn engine, the air/fuel mixture may be homogeneous (well mixed) or stratified (the fuel is concentrated in only a portion of the mixture). The diesel engine uses stratified lean combustion, and the Honda VTEC-E engine (discussed below) uses a small degree of stratification.
Assuming that the rate and completeness of combustion can be maintained, fuel economy increases with the addition of excess air to the air/fuel mixture (Lichty, 1967). However, wide-open-throttle (WOT) power decreases because not as much fuel is burned. Because of its potential for increased fuel economy, the homogeneous, lean-burn approach was investigated extensively in the 1960s and early 1970s as an alternative emissions-control approach to the three-way catalyst, which requires use of a stoichiometric air/fuel ratio (A/F) of approximately 14.6, when gasoline is the fuel, which yields lower fuel economy. However, at that time, the lean-burn engine could not meet emissions and drivability requirements and its development was discontinued. Its current revival is due to its acknowledged fuel economy advantage, combined with the availability of electronic fuel injection, which makes possible the use of lean-burn conditions in selected portions of the driving cycle.
If the air/fuel mixture is homogeneous and excess air is added beyond that required for complete combustion, production of oxides of nitrogen (NOx) increases up to a maximum and then begins to decrease. However, if recirculated exhaust gas
(usually referred to as exhaust gas recirculation, or EGR), rather than air, is used as the diluent, NOx continually decreases. The explanation is beyond the scope of this report, but it involves the effect of excess oxygen, flame temperatures, and nonequilibrium effects in the decomposition of NOx.
Figure C-1 shows the relationship of fuel consumption to NOx emissions for various combinations of excess air and EGR in the air/fuel mixture. The starting point for the discussion is a stoichiometric air/fuel mixture without EGR (the highest point on the upper curve, where EGR = 0% and A/F = 14.6). As excess air is added (moving to the right from the starting point), NOx production increases, reaching a maximum at an A/F = 17.0. Further addition of air beyond A/F = 17.0 (moving to the left on the lower curve) leads to a continuous decrease in NOx. However, when EGR rather than air is added to a mixture (moving to the left from the starting point), NOx decreases continuously up to 20 percent EGR.
Figure C-1 also illustrates the relationship between fuel consumption and mixture composition, with excess air and with EGR. Again, moving to the right from the starting point (EGR = 0% and A/F = 14.6), adding excess air continuously decreases fuel consumption until an A/F of approximately 20 is reached, after which fuel consumption increases. The explanation for this pattern is also complicated. It involves reduction in the burning rate with increased dilution, reduction in engine pumping losses, and heat transfer. The same but weaker trend—decrease, then a slight increase—is observed for fuel consumption as EGR increases.
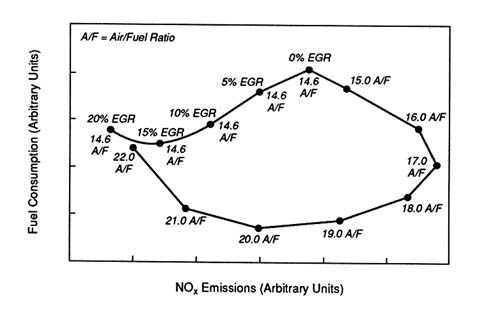
FIGURE C-1 Relationship of fuel consumption to production of oxides of nitrogen (NOx) in a lean-burn engine at various air to fuel ratios (A/F) with and without exhaust gas recirculation (EGR).
SOURCE: Adapted from Ford Motor Company (1991).
When excess air is used, the conventional three-way catalyst is not effective in reducing NOx, although it does serve as an oxidizing catalyst for the unburned hydrocarbon (HC) and carbon monoxide (CO) in the lean-burn operating regime if the exhaust temperature is sufficiently high. A three-way catalyst is effective in reducing NOx when EGR is added to a stoichiometric mixture. However, WOT power decreases as either excess air or EGR is added to the air/fuel mixture in an engine since less fuel is burned. Consequently, stoichiometric or richer (excess fuel) air/fuel ratios without EGR are often used at WOT. And, when either excess air or EGR is added, the burn rate decreases and combustion instability increases, so that HC and CO emissions may become excessive.
The Honda VTEC-E engine gives some clues as to the fuel economy potential of lean-burn engines, although determining how much of its performance is due to the lean-burn feature and how much is due to other changes from the standard engine is difficult. It should be noted that the California VTEC-E version uses EGR to dilute a stoichiometric air/fuel mixture, but the VTEC-E for the other 49 states uses excess air as the diluent. As a consequence, the 49-state version has a 44 percent fuel economy increase while the California version has a 34 percent increase.
The Honda Civic VE with VTEC-E engine differs from the standard Honda Civic not only in the use of lean-burn technology but also in use of variable valve timing; an overall 5 percent weight reduction; improved aerodynamics; reduced rolling resistance through the use of special tires, bearings, and seals; reduced accessory load through the use of a ''smart" alternator; reduced engine friction; and a higher rear-axle ratio made possible by the increased torque of the variable-valve-timing system. Because all of these changes can increase fuel economy, it is unclear how much of the fuel economy enhancement of the Civic with VTEC-E over the standard model arises from the engine itself.
Duleep (1991) attributes the 10 percentage point difference in fuel economy improvement between the California and 49-state versions to use of the lean-burn feature in the 49-state model. In Figure C-1, the difference between the minimum fuel consumption using EGR and that using excess air is about 7 to 8 percent. However, since lean-burn conditions are used for only a fraction of the operating regime of engine load and speed, the 10 percent allocation seems generous.
There is a limit to the fuel economy increase obtainable using homogeneous lean burn. Further, HC and CO, as well as NOx, can be a problem with lean burn. Thus, unless a lean NOx catalyst is developed or the NO x emission standard is eased, lean-burn engines will probably be limited to small vehicles or even be excluded from the market completely if emission standards are further tightened.
Diesel Engine
The diesel engine, which is a specific type of lean-burn engine, has been used successfully for decades in large trucks and other heavy applications. Diesels have also been used in a variety of passenger automobiles and light trucks over the past two decades, but their costs, performance, and emissions characteristics keep them off the
committee's list of proven technologies. As a consequence of the long experience with them and their promise for the future, they are the subject of continuing development and are considered here as an emerging technology.
Diesels differ significantly from spark-ignition engines. They use much higher compression ratios; they compress air rather than an air/fuel mixture; fuel is injected late in the compression stroke, allowing little time for the introduction, distribution, and mixing of the fuel and air in the combustion chamber; they do not throttle for load control; they employ stratified-charge combustion and lean mixtures; they benefit from turbocharging or supercharging; and they require a fuel quite different from gasoline that will ignite easily when injected into the highly compressed air.
The fuel economy and emissions characteristics of the diesel differ from those of the spark-ignition engine. The diesel's fuel economy is significantly higher, primarily because of its higher compression ratio, its use of turbocharging or supercharging, and its ability to use very lean air/fuel mixtures.1 Highly supercharged engines, such as those used in heavy-duty trucks, compress the inlet air to a pressure sufficiently high that it is advantageous to cool the air before it enters the cylinder, which increases the density and the mass of air in the cylinder, a further advantage for fuel economy and for emissions control. The low inlet air temperature resulting from cooling reduces the amount of NOx in the exhaust.
Diesel engines can be divided into two broad categories based on the design of the combustion chamber. The "divided-chamber" diesel has a flow restriction in its combustion chamber, which is divided into two parts. Fuel is introduced into only one section of the chamber, and the combustion-induced flow between the two parts of the chamber provides fuel-air mixing in an extremely short time (a few milliseconds).
The chamber of the "open-chamber" diesel is not divided and depends on the shape of the combustion chamber, the air motion in the chamber induced during intake and compression, and high fuel-injection pressures to accomplish distribution and mixing of the fuel and air. "Direct-injection" diesel engines, which are almost universally used in heavy-duty trucks, are some 12 to 15 percent more efficient than divided-chamber diesel engines. Because they exhibit quieter combustion and greater rpm flexibility, almost all diesels used in passenger cars are of divided-chamber design.
Unless a diesel engine is supercharged, its horsepower per unit of displacement is considerably lower than that of a spark-ignition engine. Since diesel engines generally operate at a lower maximum rpm and the mixing time for the fuel and air is short, it is not possible to utilize all of the oxygen without unacceptable engine emissions. Consequently, for comparable acceleration performance, a diesel engine that is not supercharged must be considerably heavier than a spark-ignition engine.
Pollutants emitted from the diesel include solid particulates, as well as the NOx, CO, and HC emitted from spark-ignition engines. Because of the lean air/fuel ratio and low exhaust temperature, a conventional three-way exhaust catalyst cannot be used. Further, for the diesel there is a trade-off between particulates and NOx—particulates can be lowered, but at the expense of increased NOx. Thus, it is doubtful whether the diesel engine can meet future emissions requirements, except possibly Tier I standards. Development of a lean NOx catalyst would help meet future emissions standards, but such a catalyst would have to meet different requirements from the lean NOx catalyst needed for lean-burn gasoline engines.
Two-Stroke Engine
Two-stroke engines use an air pump other than the engine's pistons and cylinders to accomplish the four tasks of compression, expansion, intake, and exhaust in two strokes (one revolution of the crankshaft). In contrast, the four-stroke engine requires four strokes (two revolutions) to accomplish the same four tasks.
The most common two-stroke engines are the simple ones used in chain saws and outboard motors. In such engines, openings (called ports) in the cylinder walls serve as valves, and the bottom sides of the pistons, along with the crankcase, serve as a pump to force the fresh air/fuel charge into, and the exhaust charge out of, the cylinder. It is not practical to use a crankcase both as a lubricating oil reservoir and as part of a pump due to entrainment of oil by the air flowing through the crankcase. Consequently, in this configuration, the crankcase is not used as an oil reservoir as it is in four-stroke engines. Instead, a small amount of lubricating oil is added to the fuel or continuously introduced mechanically, and rolling element bearings are used on the crankshaft rather than the sleeve bearings used in four-stoke engines. This configuration gave the two-stroke engine its reputation for light weight, low friction, and high power output. However, the emissions and fuel consumption of this simple configuration are completely unacceptable for modern automotive use. 2
In the two-stroke engine, exhaust and air or air/fuel intake are accomplished late in the expansion stroke and early in the compression stroke, respectively, by blowing the compressed air or mixture into the cylinder through the intake opening, or port. Ideally, all of the products of combustion (and none of the incoming gases) would be blown out the open exhaust port, leaving primarily fresh gases in the cylinder. However, in practice, a significant portion of the compressed input mixture escapes through the exhaust port and a significant portion of the exhaust gases remains in the cylinder. If the incoming gases contain fresh fuel, the exhaust will contain unburned fuel and the HC content of the exhaust will be high because of the "bypassed" mixture. Offsetting this effect is the fact that the products of combustion that remain in the cylinder with the air/fuel mixture serve as an internal EGR that tends to reduce NOx emissions.
Control of load in the two-stroke engine is achieved by throttling the flow of either the intake or exhaust (which effectively increases internal EGR), by retarding the spark, or by charge stratification as in the diesel engine. All of these load-control techniques have their problems, however. Too much EGR can lead to large cycle-to-cycle variations, spark retard increases fuel consumption, and stratification can increase HC emissions.
The potential benefits from automotive applications of two-stroke technology are reduced engine weight, size, and cost. Each cylinder undergoes a power stroke every revolution, which increases both output power and operating smoothness. If the vehicle is optimized around a lighter, more powerful two-stroke engine, there is a potential for improved fuel economy. Current indications are that the fuel economy of two-stroke engines equals the "best in class" of four-stroke engines for the same vehicle weight.
Current development effort on the two-stroke engine is concentrated on introducing the fuel into the cylinder at a time when no bypassing can occur. This approach would reduce HC emissions and fuel consumption, but it minimizes the time available for mixing the fuel and air.3
Significant problems related to mechanical components and exhaust emissions must be overcome before the two-stroke engine can be a serious competitor to the four-stroke engine. A power stroke every revolution is desirable from a smoothness and power standpoint, but it increases the heat load on the pistons since there is less time for them to be cooled by the cool incoming air/fuel mixture. Thus, piston temperature and engine durability have been continuing problems. Combustion stability, especially at idle and at road loads, can also be a problem. NOx emissions are minimized by the high internal EGR, but HCs and particulate emissions can be a problem. Emissions control, especially to meet California's standards, has not been achieved. Addressing these problems will increase engine weight, cost, and complexity. Thus, the outcome of the current intense developments efforts on two-stroke engines is not clear.
CONCEPT AND PROTOTYPE VEHICLES
A recent concept car of considerable interest is the "efficient personal, experimental" (EP-X) prototype car by Honda. This car, which reportedly gets 100 miles per gallon (mpg) (Levin, 1991), was unveiled at the 1991 Tokyo Motor Show. It seats two passengers in tandem, has an all-aluminum body and a total weight of about 1,400 pounds, and is reportedly powered by a one-liter, lean-burn engine.
Another recent concept car is the Volkswagen Chico (Automotive News, 1991). The Chico is a 1,727-pound hybrid mini hatchback with a top speed of 75 mph, a range of 250 miles, and a clutchless 5-speed manual transmission. According to Automotive News, it seats "two adults comfortably, and two small children in the back," meets the pending 1994 side-crash standards, has a latent heat system that stores heat from hot engine coolant for several days for fast warm-up, and "is a hand built concept car [for which] production is not even under discussion." Volkswagen also showed "its diesel-electric Golf featuring both fully automatic drive changeover and engine shutoff/restart and a Jetta electric vehicle using sodium sulfur batteries" (Automotive News, 1991:4).
Bleviss (1988) distinguishes between "High Fuel Economy Production Vehicles" and "High Fuel Economy Prototype Vehicles". Her table for the latter is reproduced here as Table C-1. The distinction between the two categories is important. For example, Amann states, "None of the diesel concept cars have, to my knowledge, demonstrated compliance with upcoming U.S. emission standards. Nor am I aware that any has passed U.S. safety regulations." 4 Presumably all production vehicles, as contrasted with concept cars, have met applicable regulations. Further, as noted by MacCready (1991:2), "Turning a satisfactory new-technology demonstrator into a mass-produced, distributed, and widely applied vehicle takes a long time and a major investment."
Production vehicles, by definition, have met the crucial test of customer acceptance. For the Volvo LCP 2000, Bleviss reports that the "prototype is complete, adaptable to production" (see Table C-1, "Development Status"). However, according to Amann, Volvo has said, "We have found that from a performance point of view, a 5-speed manual gear box is not quite compatible with a high power diesel engine. The alternative would be a 6-7 speed manual gear box which, no doubt, would feel uncomfortable to the average driver … Test drives with the experimental vehicles have clearly shown that the vibrations and noise of the 3-cylinder diesel engine are unacceptable at engine speeds below 1200-1500."5 Thus, it is not clear that the Volvo LCP 2000 is in fact "adaptable to production" in its current concept form.
Table C-1 reveals several factors common to high fuel economy prototype vehicles. First, most use diesel engines. The lowest horsepower listed in Table C-1 is 27 and the highest is 88. In contrast, the average horsepower of the 1990 subcompact class was 115. The prototypes are light in weight and most of them make extensive use of aluminum, plastic, and other light materials. The lightest has a curb weight of 1,040 pounds and the heaviest weighs 1,880 pounds. Lovins argues that, with extensive use of composites and plastics, curb weights of 1,000 to 1,400 pounds could be achieved at
|
4 |
C.A. Amann, presentation at the workshop of the Committee on Fuel Economy of Automobiles and Light Trucks, Irvine, Calif., July 8-12 (see Appendix F). |
|
5 |
Amann, quoting Volvo, Society of Automotive Engineers (SAE) paper 850570; see note 4. |
TABLE C-1 High Fuel Economy Prototype Vehicles
|
Company |
Model |
Number of Passengers |
Aerodynamic Drag Coefficient |
Curb Weight (1b) |
Maximum Power (hp) |
Fuel Economy (mpg)* |
Innovative Features |
Development Status |
|
General Motors |
TPC (gasoline) |
2 |
.31 |
1040 |
38 |
61 city 74 hwy |
Aluminum body and engine |
Prototype complete, no production plans |
|
British Leyland |
ECV-3 (gasoline) |
4-5 |
.24-.25 |
1460 |
72 |
41 city 52 hwy |
High use of aluminum and plastics |
Prototype complete |
|
Volkswagen |
Auto 2000 (diesel) |
4-5 |
.25 |
1716 |
53 |
63 city 71 hwy |
DI with plastic and aluminum parts, fly-wheel stop-start |
Prototype complete |
|
Volkswagen |
VW-E80 (diesel) |
4 |
.35 |
1540 |
51 |
74 city 99 hwy |
Modified DI 3-cyl. Polo, flywheel stop-start, supercharger |
Prototype complete |
|
Volvo |
LCP 2000 (diesel) |
2-4 |
.25-.28 |
1555 |
52, 88 |
63 city 81 hwy |
Hi magnesitum use; 2 DI engines developed, 1 heat insulated |
Prototype complete, adaptable to production |
|
Renault |
EVE+ (diesel) |
4-5 |
.225 |
1880 |
50 |
63 city 81 hwy |
Supercharged DI with stop-start |
Prototype complete |
|
Renault |
VESTA2 (gasoline) |
2-4 |
.186 |
1047 |
27 |
78 city 107 hwy |
High use of light material |
Program completed |
|
Peugeot |
VERA+ (diesel) |
4-5 |
.22 |
1740 |
50 |
55 city 87 hwy |
DI engine, high use of light materials |
Ongoing development |
|
Peugeot |
ECO 2000 (gasoline) |
4 |
.21 |
990 |
28 |
70 city 77 hwy |
2-cylinder engine, high use of light material |
Ongoing development |
|
Ford |
----- (diesel) |
4-5 |
.40 |
1875 |
40 |
57 city 92 hwy |
Di engine |
Research |
|
Toyota |
AXV (diesel) |
4-5 |
.26 |
1430-target |
56 |
89 city 110 hwy |
Weight is 15% plastic, 6% aluminum, has CVT & DI engine |
Ongoing development |
|
Source: Bleviss, THE NEW OIL CRISIS AND FUEL ECONOMY TECHNOLGIES (Quorum Books, New York, an imprint of Greenwood Publishing Group, Inc., 1988), p. 102. Copyright (c) 1988 by Deborah L. Bleviss. Reprinted with permission. |
||||||||
no marginal cost using large, complex assemblies molded as units and snapped together.6 In contrast, the average curb weight of the subcompact class in the 1990 fleet was 2,520 pounds.
In comparing production with prototype vehicles, it may be instructive to compare the prototypes with the most fuel-efficient 1990 model. The best-in-class, 1990 subcompact car was the General Motors Geo Metro XFI, which weighs 1,750 pounds, uses a 49-hp engine with a manual 5-speed transmission, and achieves a combined city/highway fuel economy of 65.4 mpg. The weight, horsepower, and fuel economy of the Geo are compatible with and in the direction of the values shown in Table C-1. However, it would not be realistic to argue that a car of this size and weight would meet current expectations of the majority of the driving public.
In summary, the constraints imposed on concept vehicles are different from those that must be met by production vehicles. Further, it is not clear that the large weight reductions achieved in prototype vehicles are economically viable, and their effect on safety has not been established. Also, even if acceptable material costs and safety could be achieved, the interior volume of these prototype vehicles is well below that of the current fleet average. This raises questions of customer acceptance, particularly in light of today's low gasoline prices. Such cars, however, might succeed in niche markets, especially in high-density urban areas.
REFERENCES
Automotive Engineering. 1991. Two-stroke engine technology. 99(7):11-14.
Automotive News. 1991. Chico shows VW answers on clean air. September 9:4,43.
Bleviss, D.L. 1988. The New Oil Crisis and Fuel Economy Technologies . Westport, Conn.: Quorum Books.
Duleep, K.G. 1991. Honda's new Civic VTEC-E model. Memorandum for Oak Ridge National Laboratory and the U.S. Department of Energy, August 14. Energy and Environmental Analysis, Inc., Arlington, Va.
Ford Motor Company. 1991. Overview of NAS Technology Subgroup/Ford Meetings. Presented to the Technology Subgroup, Committee on Fuel Economy of Automobiles and Light Trucks, Dearborn, Mich., September 6.
Levin, D.P. 1991. Honda ready to show a car that gets 100 miles a gallon. New York Times October 17.
Lichty, L.C. 1967. Combustion Engine Processes. New York: McGraw-Hill.
MacCready, P.B. 1991. Further than you might think/electric and hybrid vehicles. Paper presented at Conference on Transportation and Global Climate Changes and Long-Term Options, Asilomar, Calif., August 26.
Appendix D
Vehicle Size and Occupant Safety: Private Versus Societal Risks in Two-Car Collisions
Numerous empirical studies show that the occupants of a larger car are much safer in a two-car collision than those in smaller cars, all else being equal. It may seem obvious that downsizing (i.e., replacing large cars with smaller cars) would, therefore, make all occupants less safe. This appendix uses a simplified model of occupant fatality risk to show that, under certain conditions, this view may not be correct.
To minimize his or her own fatality risk in multicar collisions, it is in the best interests of the individual to buy the largest, heaviest car available. In so doing, however, the individual imposes an extra risk on the drivers of smaller cars with whom he or she may collide. One person's gain (in reduced risk) causes everyone else's risk to increase. Thus, in two-car crashes, the obvious private safety benefit of larger cars is not an obvious benefit from the societal perspective. From the societal perspective the question is, What is the net effect of downsizing? In the committee's view, available research does not provide an entirely adequate answer, in part because available studies do not address the full range of issues from the societal viewpoint, and in part because the net effect depends on precisely how size and weight changes occur.
In principle, downsizing part of the fleet could increase, decrease, or leave total fatalities unchanged in two-car crashes. The total fatality risk from two-car collisions in a fleet consisting entirely of large cars is clearly lower than one consisting entirely of small ones. The question that is more to the point, however, is how the total fatality risk changes as the fleet size mix moves away from the current composition. To examine this question, the committee constructed a simplified model of the dependence of total fleet fatality risk on the size composition of the fleet. The model is based on a simplified fleet mix of small, medium, and large cars and on relative risk factors for two-car collisions that are broadly consistent with those found in the literature, but that are also greatly simplified. To illustrate the relationship of downsizing to societal fatality risks, the committee calculated the hypothetical impacts of several changes in fleet mix on total fatalities in two-car collisions. In the calculations, an assumed 5,000
annual occupant fatalities in two-car collisions was used as the baseline for estimating changes in fatalities.1 The model takes into account only fatalities in two-car collisions. Omitted are single-car accidents, collisions involving three or more vehicles, collisions between cars and trucks, and pedestrian and cyclist fatalities. No account is taken of nonfatal injuries or property damage. Consequently, these analyses are relevant for about 11 percent of all motor vehicle fatalities.
The relative fatality risks to the occupants of small, medium, and large cars in two-car collisions that were incorporated in the model are shown in the matrix in Table D-1. The occupant of a large car hit by a small car is given an arbitrary relative risk index of 1. The relative risk index is proportional to the probability of an occupant fatality in the "hit" car, given that it is involved in a collision with a "hit-by" car. At the other extreme, the occupant of a small car hit by a large car is assumed to be 36 times as likely to die. Note that occupants in small-car to small-car collisions have a relative risk factor of 9, more than twice that of the occupants in large-car to large-car collisions.
In the model it is assumed that the frequency of collisions between vehicles of different sizes is proportional to the product of the fractions of the vehicle fleet made up of each size vehicle. For example, if small cars make up one-third of the fleet and large cars make up one-fourth of the fleet, the probability of a collision between a small and large car is one-third times one-fourth equals one-twelfth. An index of total fatality risk for the fleet is obtained by multiplying the relative frequencies of crashes of each type by their corresponding relative risk factors and summing all the products. Numbers along the diagonal of the resulting matrix must be multiplied by 2 to account for the occupants of both cars in each crash.
Table D-2 shows the matrix of relative collision frequencies, and Table D-3 shows the matrix of components of the fleet fatality risk index for the base fleet, which is assumed to consist of one-third each of small, medium, and large cars—roughly the distribution of all cars on the road today. The fleet fatality index is computed to be 12.22. The impact of changing the fleet mix is then estimated by assuming that the base size distribution and fleet fatality index of 12.22 corresponds to 5,000 fatalities.
Table D-4 shows the effects on fatality risk and total fatalities of different fleet mixes. For example, in the first variation it is assumed that all large cars are downsized to medium cars and the proportion of small cars remains at one-third. This produces a fleet fatality index of 12.00, yielding a 1.8 percent decrease compared with the base case, which corresponds to a reduction of 90 fatalities. In this case, making the fleet smaller, on average, leads to a reduction in total fatalities in two-car collisions. The key to this particular reduction in fatalities is that replacing all large cars with medium ones reduces the risk that the large cars previously imposed on the small and
|
1 |
In 1990 there were 13,406 passenger-car occupant fatalities in two-vehicle collisions (see Chapter 3). However, in most instances the other vehicle was a light truck or heavy truck. The actual number of occupant fatalities in two-car collisions was approximately 4,900. |
TABLE D-1 Simplified Illustration of Hypothetical Relative Fatality Risks in Two-Car Collisions
|
|
''Hit By" Car Size |
||
|
"Hit" Car Size |
Small |
Medium |
Large |
|
Small |
9 |
18 |
36 |
|
Medium |
3 |
6 |
12 |
|
Large |
1 |
2 |
4 |
TABLE D-2 Hypothetical Relative Collision Frequencies, Base Fleet
|
|
"Hit By" Car Size (Fleet Mix) |
||
|
"Hit" Car Size (Fleet Mix) |
Small (1/3) |
Medium (1/3) |
Large (1/3) |
|
Small (1/3) |
1/9 |
1/9 |
1/9 |
|
Medium (1/3) |
1/9 |
1/9 |
1/9 |
|
Large (1/3) |
1/9 |
1/9 |
1/9 |
TABLE D-3 Base Fleet Fatality Indices
|
|
"Hit By" Car Size |
||
|
"Hit" Car Size |
Small |
Medium |
Large |
|
Small |
2 |
2 |
4 |
|
Medium |
3/9 |
12/9 |
12/9 |
|
Large |
1/9 |
2/9 |
8/9 |
|
Total Fatality Index = 12.22 |
|||
TABLE D-4 Fatality Consequences of Changes in Fleet Size Mix (Hypothetical Illustration Based on Two-Car Collisions Only)
|
|
Fleet Composition |
Fleet Fatality |
Change in Fatalities |
|||
|
Fleet Name |
Small |
Medium |
Large |
Index |
Percent |
Numbera |
|
Base Case |
1/3 |
1/3 |
1/3 |
12.22 |
-- |
-- |
|
Small Fleet 1 |
1/3 |
2/3 |
0 |
12.00 |
-1.82 |
-90 |
|
Small Fleet 2 |
2/5 |
1/2 |
1/10 |
12.34 |
+0.96 |
+50 |
|
Small Fleet 3 |
1/2 |
1/2 |
0 |
12.75 |
+4.32 |
+215 |
|
Small Fleet 4 |
1/4 |
3/4 |
0 |
11.81 |
-3.35 |
-170 |
|
Small Fleet 5 |
3/4 |
1/4 |
0 |
14.81 |
+21.2 |
+1,060 |
|
Small Fleet 6 |
2/3 |
2/9 |
1/9 |
14.89 |
+21.8 |
+1,090 |
|
Very Large Fleet |
1/9 |
2/9 |
2/3 |
9.70 |
-20.6 |
-1,030 |
|
All Small |
1 |
0 |
0 |
18.00 |
+47.3 |
+2,315 |
|
All Medium |
0 |
1 |
0 |
12.00 |
-1.82 |
-90 |
|
All Large |
0 |
0 |
1 |
8.00 |
-34.5 |
-1,725 |
|
a Based on an assumed 5,000 occupant deaths in two-car collisions. |
||||||
medium-sized ones by more than the increased risk that is newly borne by the former occupants of large cars who are now in medium-sized ones.
A different, smaller fleet (Small Fleet 2) might feature 40 percent small cars, 50 percent medium, and 10 percent large ones. In this case, the total fleet fatality index increases by about 1 percent, to 12,34, and total fatalities grow by the same percentage, or by 48 deaths.
A number of cases in Table D-4 illustrate that reasonably large changes in fleet mix are associated with changes in fatalities in two-car collisions of plus or minus 5 percent or less (consider Small Fleets 1 through 4). On the other hand, radically smaller fleets yield, according to the model, substantial fatality increases (consider Small Fleets 5 and 6 and the All Small Fleet). Similarly, much larger fleets yield sharp fatality reductions (consider the Very Large and All Large fleets).
This simplified model calculation illustrates two key points in two-car collisions only. First, the changes in societal fatality risks in two-car collisions from downsizing are relatively small compared with the changes in individual private risks, once both winners and losers are considered. Second, the net effect of downsizing is likely to increase total fatality risks in two-car collisions, but the effect could be positive, negative, or negligible depending on the precise relative risk relationships and the way in which downsizing occurs.
This simplified analysis has not included collisions with trucks, single-vehicle accidents, or rollovers, in which downsizing is likely to be a liability, nor collisions with cyclists and pedestrians, in which size reduction could be a benefit. Because substantial numbers of fatalities occur in these categories, including them could significantly affect the estimates of the impact of downsizing on total fatalities.
Because of the complexities of the dependence of the total motor vehicle fatality risk on the fleet size mix, the committee urges further examination of these relationships from the societal perspective using real-world data. These analyses should consider all collision types and the full range of crash severity, and they should include a more thorough examination of potential changes in the vehicle fleet mix.
APPENDIX E
SHOPPING CART PROJECTION METHOD: AN ILLUSTRATION FOR SUBCOMPACT CARS
This appendix illustrates the development of the curves of cost versus fuel economy improvement for new vehicles in various size classes used in the shopping cart projection method of Chapter 7.
For each of the technologies considered for improving the fuel economy of new cars in the subcompact size class, Table E-1 shows the committee's estimates of the percentage improvement in fuel economy (column 1) and the associated cost (retail price equivalent, or RPE; column 2) based on the work of Energy and Environmental Analysis, Inc. (EEA, 1990a,b). Columns 3 and 4 of the table show, respectively, EEA's estimates of the current (MY 1990) market penetration of each of the technologies in the subcompact class (EEA, personal communication, October 2, 1991) and the maximum market penetration estimated by the committee. The difference between the two numbers yields the change in market penetration for each technology (column 5).
Column 6 of Table E-1 shows the average percentage improvement in fuel economy arising from increased use of each technology in subcompact cars, calculated as the product of columns 1 and 5. Column 7 shows the average cost of increased use of each technology in subcompact cars, calculated as the product of columns 2 and 5.
Table E-2 displays the technologies from Table E-1, rank ordered by decreasing cost-effectiveness. The effectiveness of each technology is calculated by multiplying the market-share weighted average percentage gain in fuel economy for the technology (column 6, Table E-1) by the base average fuel economy for the subcompact car class of 31.4 mpg. The cost of each technology shown in Table E-2 is carried over from column 7 of Table E-1.
The cumulative cost (RPE) and fuel economy for any ordered subset of the technologies are then developed by summing over the costs and fuel economy increments of the rank-ordered technologies, as shown in the two right-hand columns
Table E-1 Technologies for Improving the Fuel Economy of Subcompact Cars (based on EEA data)
|
|
Fuel Economy Increase |
Market Penetration (%) |
Change in Market Penetration |
Fuel Economy Increase x Change in Market Penetration |
Cost x Change in Market Penetration |
||
|
Technology |
[a] (%) |
(1988$) |
1990 [c] |
Maximum |
(%) |
(%) |
[d] (1990 $) |
|
|
(1) |
(2) |
(3) |
(4) |
(5) |
(6) |
(7) |
|
Engine Technologies |
|||||||
|
General |
|||||||
|
Roller cam followers |
2.0 |
16 |
29.2 |
100.0 |
70.8 |
1.416 |
12.46 |
|
Friction reduction, -10% |
2.0 |
30 |
12.3 |
100.0 |
87.7 |
1.754 |
28.80 |
|
Accessory improvement |
0.5 |
12 |
0.0 |
100.0 |
100.0 |
.500 |
13.01 |
|
Deceleration fuel restriction |
1.0 |
0 |
58.0 |
100.0 |
42.0 |
.420 |
0.00 |
|
Compression ratio, +.5 |
0.0 |
0 |
0.0 |
100.0 |
100.0 |
.000 |
0.00 |
|
Fuel Systems |
|||||||
|
Throttle-body fuel injection |
3.0 |
43 |
34.8 |
0.0 |
-34.8 |
-1.044 |
(16.15) |
|
Multipoint fuel injection |
5.0 |
91 |
58.0 |
100.0 |
42.0 |
2.100 |
41.56 |
|
Value Train |
|||||||
|
Overhead camshaft |
3.0 |
111 |
43.7 |
97.1 |
53.4 |
1.602 |
64.52 |
|
4 valves per cylinder |
5.0 |
141 |
36.3 |
97.1 |
60.8 |
3.040 |
93.04 |
|
Variable valve timing |
6.0 |
142 |
0.0 |
97.1 |
97.1 |
5.826 |
149.20 |
|
Number of Cylinders [e] |
|||||||
|
4-cylinder redesign |
17.0 |
240 |
0.0 |
2.9 |
2.9 |
.493 |
7.55 |
|
6-cylinder redesign |
17.0 |
442 |
0.0 |
0.0 |
0.0 |
.000 |
0.00 |
|
Transmission Technologies |
|||||||
|
Torque converter lockup |
3.0 |
50 |
45.5 |
66.7 |
21.2 |
.635 |
11.47 |
|
Electric transmission control |
0.5 |
24 |
0.0 |
66.7 |
66.7 |
.333 |
17.35 |
|
4-speed automatic |
4.5 |
225 |
16.8 |
0.0 |
-16.8 |
-.756 |
(40.96) |
|
5-speed automatic |
7.0 |
325 |
0.0 |
0.0 |
0.0 |
.000 |
0.00 |
|
Continuously variable transmission |
8.0 |
325 |
0.0 |
66.7 |
66.7 |
5.333 |
234.89 |
|
5-speed manual |
8.0 |
0 |
42.5 |
33.3 |
-9.2 |
-.733 |
0.00 |
|
Rolling Resistance, Aerodynamics, and Weight |
|||||||
|
Front-wheel drive |
10.0 |
240 |
94.1 |
100.0 |
5.9 |
.590 |
15.35 |
|
Aerodynamics |
2.3 |
40 |
18.3 |
100.0 |
81.7 |
1.879 |
35.43 |
|
Weight reduction, -10% |
6.6 |
138 |
0.0 |
100.0 |
100.0 |
6.600 |
149.33 |
|
Electric power steering |
1.0 |
45 |
0.0 |
100.0 |
100.0 |
1.000 |
48.78 |
|
Advanced tires, -10% |
1.0 |
18 |
0.0 |
100.0 |
100.0 |
1.000 |
19.51 |
|
Advanced lubricants |
0.5 |
2 |
0.0 |
100.0 |
100.0 |
.500 |
2.18 |
|
[a] Committee's adaptation of EEA estimates. See Appendix B. [b] Weighted average cost based on 1990 distribution of engine sizes in the class before engine downsizing. [c] Source: EEA, personal communication, October 2, 1991. [d] Costs inflated to 1990 dollars by multiplying 1988 dollars by 1.084. [e] Redesigned engines incorporate overhead camshaft, variable valve timing, and four valves per cylinder; the number of cylinders is reduced by two and the displacement is constant. |
|||||||
Table E-2 Illustrative Calculation of Fuel Economy Improvements and Incremental Costs for Subcompact Cars Using the Shopping Cart Method and Data in Table E-1
|
|
|
|
|
Cumulative |
|
|
|
Market-Share Weighted Changes |
CostEffectiveness (mpg/$) |
Retail Price |
Fuel |
|
|
Technology |
Effectiveness (mpg) |
Cost ($) |
Equivalent (1990 $) |
Economy (mpg) |
|
|
Base |
-- |
-- |
-- |
0.00 |
30.46 |
|
Deceleration fuel restriction |
0.132 |
0 |
--- [a] |
0.00 |
30.59 |
|
Advanced lubricants |
0.157 |
2.18 |
0.0720 |
2.18 |
30.75 |
|
Roller cam followers |
0.445 |
12.46 |
0.0357 |
14.64 |
31.19 |
|
Engine redesign |
0.155 |
7.55 |
0.0205 |
22.19 |
31.35 |
|
Friction reduction |
0.551 |
28.80 |
0.0191 |
50.99 |
31.90 |
|
Aerodynamics |
0.590 |
35.43 |
0.0167 |
86.41 |
32.49 |
|
Advanced tires |
0.314 |
19.51 |
0.0161 |
105.93 |
32.80 |
|
Weight reduction |
2.072 |
149.33 |
0.0139 |
255.26 |
34.87 |
|
Fuel system |
0.332 |
25.41 |
0.0131 |
280.67 |
35.21 |
|
Variable valve timing |
1.829 |
149.20 |
0.0123 |
429.87 |
37.03 |
|
Front-wheel drive |
0.185 |
15.35 |
0.0121 |
445.22 |
37.22 |
|
Accessories |
0.157 |
13.01 |
0.0121 |
458.23 |
37.38 |
|
4 valves per cylinder |
0.955 |
93.04 |
0.0103 |
551.27 |
38.33 |
|
Valve system |
0.503 |
64.52 |
0.0078 |
615.79 |
38.83 |
|
Transmissions |
1.511 |
222.73 |
0.0069 |
838.52 |
40.35 |
|
Electric power steering |
0.314 |
48.78 |
0.0064 |
887.30 |
40.66 |
|
[a] Since cost is zero, cost-effectiveness is very large. NOTE: Technologies are listed in order of decreasing cost-effectiveness. Base fuel economy (31.4 mpg for MY 1990) is adjusted downward by 3 percent to account for safety and Tier I emissions standards. Calculations based on committee's adaptation of fuel economy, cost, and market—share data from EEA (1991a,b, personal communication, October 2, 1991). |
|||||
of Table E-2. The increments of fuel economy are added to the MY 1990 base value, which has been reduced by 3 percent to account for safety and Tier I emissions standards. To illustrate, a cumulative average fuel economy of 31.19 mpg corresponds to the incorporation of three technologies (deceleration fuel restriction, advanced lubricants, and roller cam followers) at a cumulative average cost of $14.64 per vehicle. The highest level of fuel economy achieved using this set of technologies is 40.7 mpg, achievable at a cumulative RPE of $887.30.
Figure E-1 shows the relationship of fuel economy to RPE for the subcompact car size class, taking account of the technologies appropriate to that size class from Table E-2. It is the same as "Case B" in Figure 7-4 of Chapter 7.
Tables E-3 and E-4 are similar to those described above, except that the fuel economy gains and associated costs are based on those estimated by SRI (1991). The MY 1990 market-share estimates are those of EEA (personal communication, October 2, 1991). Figure E-2 is the curve shown as "Case A" in Figure 7-4 of Chapter 7.
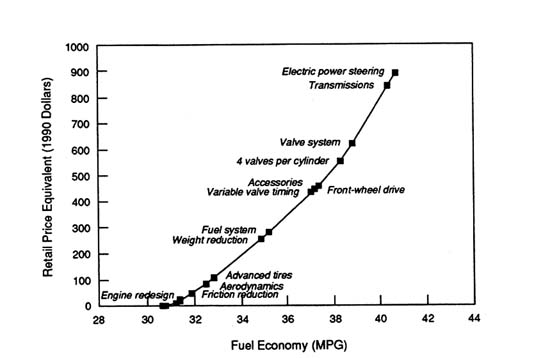

Table E-3 Technologies for Improving the Fuel Economy of Subcompact Cars (based on SRI data)
|
|
Fuel Economy Increase [a] |
Market Penetration (%) |
Change in Market Penetration |
Fuel Economy Increase × Change in Market Penetration |
Cost × Change in Market Penetration |
||
|
Technology |
(%) |
(1990$) |
1990 [c] |
Maximum |
(%) |
(%) |
($) |
|
|
(1) |
(2) |
(3) |
(4) |
(5) |
(6) |
(7) |
|
Engine Technologies |
|||||||
|
General |
|||||||
|
Roller cam followers |
1.7 |
65 |
29.2 |
100.0 |
70.8 |
1.168 |
48.02 |
|
Friction reduction, -10% |
2.0 |
60 |
12.3 |
100.0 |
87.7 |
1.754 |
52.62 |
|
Accessory improvement |
0.7 |
200 |
0.0 |
100.0 |
100.0 |
.700 |
200.00 |
|
Deceleration fuel restriction |
1.0 |
5 |
58.0 |
100.0 |
42.0 |
.420 |
2.10 |
|
Compression ratio, +.5 |
2.0 |
1 |
0.0 |
100.0 |
100.0 |
2.000 |
1.00 |
|
Fuel Systems |
|||||||
|
Throttle-body fuel injection |
2.8 |
65 |
34.8 |
0.0 |
-34.8 |
-.905 |
(22.62) |
|
Multipoint fuel injection |
4.6 |
215 |
58.0 |
100.0 |
42.0 |
1.932 |
90.30 |
|
Valve Train |
|||||||
|
Overhead camshaft |
2.5 |
400 |
43.7 |
97.1 |
53.4 |
1.335 |
213.60 |
|
4 valves per cylinder |
3.0 |
400 |
36.3 |
97.1 |
60.8 |
1.824 |
243.20 |
|
Variable valve timing |
2.6 |
100 |
0.0 |
97.1 |
97.1 |
2.525 |
97.10 |
|
Number of Cylinders [d] |
|||||||
|
4-cylinder redesign |
8.1 |
600 |
0.0 |
2.9 |
2.9 |
.235 |
17.40 |
|
6-cylinder redesign |
9.1 |
650 |
0.0 |
0.0 |
0.0 |
.000 |
0.00 |
|
Transmission Technologies |
|||||||
|
Torque converter lockup |
2.0 |
56 |
45.5 |
66.7 |
21.2 |
.423 |
11.85 |
|
Electric transmission control |
0.5 |
122 |
0.0 |
66.7 |
66.7 |
.333 |
81.33 |
|
4-speed automatic |
2.8 |
230 |
16.8 |
0.0 |
-16.8 |
-.470 |
(38.64) |
|
5-speed automatic |
3.3 |
530 |
0.0 |
0.0 |
0.0 |
.000 |
0.00 |
|
Continuously variable transmission |
4.8 |
640 |
0.0 |
66.7 |
66.7 |
3.200 |
426.67 |
|
5-speed manual |
4.8 |
0 |
42.5 |
33.3 |
-9.2 |
-.440 |
0.00 |
|
Rolling Resistance, Aerodynamics, and Weight |
|||||||
|
Front-wheel drive |
0.5 |
26 |
94.1 |
100.0 |
5.9 |
.029 |
1.53 |
|
Aerodynamics |
2.4 |
60 |
18.3 |
100.0 |
81.7 |
1.961 |
49.02 |
|
Weight reduction, -10% |
5.0 |
470 |
0.0 |
100.0 |
100.0 |
5.000 |
61.00 |
|
Electric power steering |
1.4 |
61 |
0.0 |
100.0 |
100.0 |
1.400 |
20.00 |
|
Advanced tires, -10% |
1.0 |
20 |
0.0 |
100.0 |
100.0 |
1.000 |
3.00 |
|
Advanced lubricants |
0.3 |
3 |
0.0 |
100.0 |
100.0 |
.300 |
2.18 |
|
[a] Committee's adaptation of SRI estimates. See Appendix B. [b] Weighted average cost based on 1990 distribution of engine sizes in the class before engine downsizing. [c] Source: EEA, personal communication, October 2, 1991. [d] Redesigned engines incorporate overhead camshaft, variable valve timing, and four valves per cylinder; the number of cylinders is reduced by two and the displacement is constant. |
|||||||
Table E-4 Illustrative Calculation of Fuel Economy Improvements and Incremental Costs for Subcompact Cars Using the Shopping Cart Method and Data in Table E–3
REFERENCES
Energy and Environmental Analysis (EEA), Inc. 1991a. Fuel economy technology benefits. Presented to the Technology Subgroup, Committee on Fuel Economy of Automobiles and Light Trucks, Detroit, Mich., July 31, 1991.
Energy and Environmental Analysis (EEA), Inc. 1991b. Documentation of Attributes of Technologies to Improve Automotive Fuel Economy. Prepared for Martin Marietta, Energy Systems, Oak Ridge, Tenn. Arlington, Va.
SRI International. 1991. Potential for Improved Fuel Economy in Passenger Cars and Light Trucks. Prepared for Motor Vehicle Manufacturers Association. Menlo Park, Calif.
APPENDIX F
COMMITTEE MEETINGS AND ACTIVITIES
|
1. |
Committee Meeting, May 13-15, 1991, Washington, D.C. |
|
|
Welcome Frank Press, President, National Academy of Sciences |
|
|
Briefing Book on the United States Motor Vehicle Industry and Market (Version 1) Robert Shelton, National Highway Traffic Safety Administration John P. O'Donnell, Department of Transportation |
|
|
Motor Vehicle Fuel Economy: A NHTSA Perspective Jerry R. Curry, Administrator, National Highway Traffic Safety Administration |
|
|
Rationale for Senate Bill S.279 and Expectations for the NAS Study Senator Richard H. Bryan, Chairman, Subcommittee on Consumer, Committee on Commerce, Science and Transportation |
|
|
The Automotive Industry: A Retrospective Look (1975-1991) Deborah Gordon, Union of Concerned Scientists |
|
|
Increasing Fuel Economy: How Far Can We Go? Thomas H. Hanna, President and Chief Executive Officer, Motor Vehicle Manufacturers Association Robert C. Stempel, Chairman and Chief Executive Officer, General Motors Corporation Robert A. Lutz, President, Chrysler Corporation Allan D. Gilmour, President, Automotive Group, Ford Motor Company |
|
|
Gregory J. Dana, Vice President and Technical Director, Association of International Auto Manufacturers Tokuta Inoue, Director, Toyota Motor Corporation and Director, Higashi-Fuji Research Center E. Amito, Senior Vice President, American Honda Motor Company Toni Harrington, Manager, Government/Industrial Relations, American Honda Motor Company Karl-Heinz Ziwica, General Manager, Environmental Engineering, B.M.W. of North America, Inc. |
|
|
Motor Vehicle Efficiency and Greenhouse Warming: Policy Implications Rob Coppock, NAS Committee on Science, Engineering and Public Policy |
|
|
Informing the Debate on Fuel Economy: The Needs of Congress Congressman Philip R. Sharp, Chairman, Subcommittee on Power and Energy, Committee on Energy and Commerce |
|
|
View of Labor on Improvements to Automotive Fuel Economy Steve Beckman, International Economist, United Automobile Workers |
|
|
Automotive Fuel Economy Studies at OTA: An Overview Steve Plotkin, Office of Technology Assessment |
|
|
Methodology Underlying EEA's Fuel Economy Projections: An Overview K. G. Duleep, Director of Engineering, Energy and Environmental Analysis, Inc. |
|
|
U.S. Safety Regulations for New Cars and Light Trucks Donald Bischoff, Associate Administrator for Plans and Policy, National Highway Traffic Safety Administration Barry Felrice, Associate Administrator for Rulemaking, National Highway Traffic Safety Administration |
|
|
Automotive Fuel Economy & Safety Stephen Oesch, General Counsel, Insurance Institute for Highway Safety Clarence Ditlow, Executive Director, Center for Auto Safety |
|
|
Future Emission Requirements Karl Hellman, Environmental Protection Agency |
|
2. |
Workshop and Committee Meeting, July 8-13, 1991, Irvine, California |
|
|
AUTOMOTIVE TECHNOLOGY |
|
|
Conventional Engines: Charles Amann, Consultant Erwin Nill, Mercedes-Benz Corporation Leopold Mikulic, Mercedes-Benz Corporation Masatami Takimoto, Toyota Motor Corporation |
|
|
Advanced Engines: Kim Schlunke, Orbital Engine Company Karl-Heinz Neuman, Volkswagen of America |
|
|
Drive Trains and Other Subsystems: |
|
|
Variable Control Systems for Increasing Engine Efficiency Throughout the Full Power Range Charles Mendler, Energy Conservation Coalition The Impact of CFCs on Mobile Air Conditioning Systems Kurt D. Hollasch, General Motors Corporation |
|
|
Fuels and Lubricants: Lubricants and Engine Friction Reduction David Hoult, Massachusetts Institute of Technology Trends in Fuel Composition and Impact on Fuel Economy and Emissions Joe Colucci, General Motors Corporation Materials Considerations in Vehicle Design and Operation: David Parker, Aluminum Association David Schlendorf, ALCOA Ronald McClure, ALCOA Alan Seeds, Alcan Aluminum Corporation Randy Suess, Dow Chemical Company Peter Peterson, U.S. Steel Corporation |
|
|
CONCEPT CARS AND PROTOTYPES |
|
|
Advanced Light Vehicle Concepts Amory Lovins, Rocky Mountain Institute |
|
|
Prototypes and ''Best in the World Cars": Overview and Lessons Learned Deborah Bleviss, International Institute for Energy Conservation |
|
|
THE CAR AS A SYSTEM: FUEL ECONOMY POTENTIAL AND PROSPECTS Allan D. Gilmour, Ford Motor Company Katsumi Suzuki, Toyota Motor Corporation Masatami Takimoto, Toyota Motor Corporation Ronald R. Boltz, Chrysler Corporation Takefumi Hosaka, Honda R & D Co., Ltd., Tochigi Center Ronald H. Haas, General Motors Corporation Yoichiro Kaneuchi, Nissan Motor Company, Ltd., of Japan Yoshiaki Danno, Mitsubishi Motors Corporation |
|
|
Economic Effects of Tightening CAFE Standards Michael J. Boskin, Chairman, Council of Economic Advisers, (by Video TeleConference) |
|
|
FUEL ECONOMY AND COST PROJECTION METHODOLOGIES |
|
|
An Engineering Assessment of Fuel Economy Opportunities Marc Ross, University of Michigan |
|
|
A System for Estimating Fuel Economy Potential Due to Technology Improvements Richard Andrews, University of Michigan James Berger, Purdue University Murray Smith, University of Canterbury |
|
|
Fuel Economy Projections to Year 2010 K. G. Duleep, Energy and Environmental Analysis, Inc. |
|
|
Technology Improvement Incremental Cost Analysis Henry Allessio, Easton Consultants, Inc. |
|
|
SAFETY |
|
|
Safety vs. Fuel Economy: A Trade-off B. J. Campbell, University of North Carolina |
|
|
Vehicle Downsizing versus Vehicle Downweighting: Implications for Safety Charles Kahane and Terry Klein, National Highway Traffic Safety Administration |
|
|
Potential Improvements in Occupant Packaging to Offset Vehicle Weight Reduction Donald Friedman, Liability Research, Inc. |
|
|
An Econometric Model of Fuel Economy and Passenger Vehicle Highway Fatalities J. Daniel Khazzoom, San Jose State University |
|
|
How to Save Fuel and Reduce Injuries in Automobiles Leon Robertson, Nanlee, Inc. |
|
|
Public Policy and the Automotive Safety Issue Benjamin Kelley, Institute for Injury Reduction (presented by Craig McClellan, McClellan & Associates) |
|
|
A Rational Approach to the Safety Debate Phil Haseltine, American Coalition for Traffic Safety |
|
|
CLEAN AIR ACT AMENDMENTS: WHAT EFFECT ON FUEL ECONOMY? |
|
|
Automotive Industry Perspective: Kelly Brown, Ford Motor Company Gregory Dana, Association of International Automobile Manufacturers Richard Penna, Toyota Motor Corporation |
|
|
ECONOMIC AND REGULATORY CONSIDERATIONS IN IMPROVING FUEL ECONOMY |
|
|
Review of Regulatory Options at the Federal and State Levels Ralph Cavanagh, Natural Resources Defense Council |
|
|
Regulations and Market Forces Gary R. Fauth, Charles River Associates |
|
|
Fuel Economy: A Customer's Viewpoint Robert Leone, Boston University |
|
|
Cost-Effectiveness of Increased Fuel Economy John DeCicco, American Council for an Energy-Efficient Economy |
|
|
CONSUMER BEHAVIOR AND DEMAND FOR CARS |
|
|
Behavioral Studies and Consumer Demand Willet Kempton, Princeton University |
|
|
Consumer Behavior and New Car Purchase Steve Barnett, Nissan North America |
|
|
Survey Studies and Consumer Demand Dave Power, J. D. Power, Inc. |
|
|
CAFE and Consumer Behavior Geroge Borst, Toyota Motors Sales U.S.A., Inc. |
|
|
BARRIERS TO INTRODUCTION OF HIGH FUEL ECONOMY VEHICLES IN THE U. S. MARKET |
|
|
Automotive Industry Perspective Ken Kohrs, Ford Motor Company |
|
|
Potential for Improving Fuel Economy of Passenger Cars and Light Trucks Norman Stoller, SRI International |
|
|
Should Consumer Preferences for Comfort, Safety and Performance in a Low Energy Cost World be Considered a Barrier? Fred Smith, Competitive Enterprise Institute |
|
|
Resources, Motivation, and Lead Time Tom Feaheny, Consultant |
|
|
A Concept to Improve the Fuel Economy of the Nation's Motor Vehicles Patrick Raher, Mercedes-Benz Corporation |
|
|
LIGHT TRUCK AND VAN POLICY |
|
|
Basis for Current Regulations on Fuel Economy and Safety of Light Trucks and Vans Orron Kee, National Highway Traffic Safety Administration |
|
|
Current Purchase and Use Patterns of Light Trucks and Vans William Bostic, U.S. Department of Commerce |
|
|
Unique Fuel Economy Considerations for Light Trucks and Vans vis-a-vis |
|
|
Passenger Cars James Englehart, Ford Motor Company Yoichiro Kaneuchi, Nissan Motor Company, Ltd., of Japan |
|
|
LATE PAPER |
|
|
Parallels Between U.S. and Australian Automotive Fuel Economy Problems Peter Anyon, Australian Federal Government |
|
|
WRAP UP Thomas H. Hanna, Motor Vehicle Manufacturers Association Gregory J. Dana, Association of International Auto Manufacturers Ralph Cavanagh, National Resources Defense Council |
|
3. |
Technology Subgroup Meeting, July 31, 1991, Detroit, Michigan Norman Stoller, SRI International Phil Amos, SRI International Larry K. Ranek, SRI International Pamela J. Olson, SRI International Marcel Halberstat, Motor Vehicle Manufacturers Association Thomas H. Hanna, Motor Vehicle Manufacturers Association K. G. Duleep, Director of Engineering, Energy and Environmental Analysis, Inc. |
|
4. |
Safety Subgroup Meeting, August 21-22, 1991, Washington, D.C. Leonard Evans, General Motors Corporation Ernest Grush, Ford Motor Company Brian O'Neil, Insurance Institute for Highway Safety B. J. Campbell, University of North Carolina Clarence Ditlow, Center for Auto Safety Mark Edwards, National Highway Traffic Safety Administration Charles Kahane, National Highway Traffic Safety Administration Terry Klein, National Highway Traffic Safety Adminay Traffic Safety Administration Terry Klein, National Highway Traffic Safety Administration Robert Shelton, National Highway Traffic Safety Administration |
|
5. |
Committee Meeting, August 23-25, 1991, Cambridge, Massachusetts No presentations were made at this meeting. |
|
6. |
Technology Subgroup Meeting, September 5-6, 1991, Detroit Michigan Chrysler Corporation Robert Lutz Gordon Allardyce Beverly Bunting Van Bussmann Francois Castaing Arnold DeJong Thomas Gage Peter Gilezan James Rickert Richard Schaum Robert Sexton Al Slechter |
|
|
Ford Motor Company Allan Gilmour Dan Ahrns Chris Aliapoulis Bob Bacigalupi Dick Baker Peter Beardmore Chinu Bhavsar Kelly Brown Jim Endress Haren Gandhi Ed Hagenlocker Bob Himes Mike Jordan Thomas Kenney Ken Kohrs David Kulp John LaFond Pete Pestillo Helen Petrauskas Jeff Pharris Norm Postma Bill Quinlan Bob Rankin Bob Roethler Al Simko General Motors Corporation Robert Stempel Jack Armstrong Lewis Dale Harry Foster Nicholas Gallopoulos Ronald Haas Livonia Plant Donald Runkle Leon Skudlarek Thomas Stephens Gerald Stofflet Tom Young Honda E. Amito Toni Harrington Takefumi Hosaka H. Kano Atsushi Totsune |
|
7. |
Impacts Subgroup Meeting, September 16, 1991, Washington, D.C. Charles River Associates David Montgomery Chrysler Corporation Van Bussmann Tom Gage Al Slechter Ford Motor Company Allan D. Gilmour Kelly Brown Bobbi Koehler-Gaunt Michael Jordan Peter Pestillo Helen Petrauskas Susan Shackson Greg Smith Martin Zimmerman General Motors Corporation Lewis Dale Michael DiGiovanni George Eads Harry Foster Stephen O'Toole Gerald Stofflet |
|
8. |
Technology Subgroup Meeting September 18, 1991, Washington, D.C. |
|
|
Conventional and Advanced Automotive Fuel Economy Technology: Future Potential and Prospects Gary Rogers, FEV, Inc. |
|
|
Post 2001 Technology Options: Power Trains, Aerodynamics, Electric Vehicles, Hybrids and CAFE Alternatives Paul McCready, Aerovironment, Inc. |
|
|
Roundtable discussion on Conventional Technology, Advanced Technology and CAFE Standards John DeCicco, American Council for an Energy-Efficient Economy Charles Mendler, Energy Conservation Coalition Marika Tatsutami, Natural Resources Defense Council |
|
9. |
Committee Meeting, September 19-21, 1991, Washington, D.C. Raymond Wassel, Board on Environmental Studies and Toxicology, National Research Council |
|
10. |
Committee Meeting, October 14-16, 1991, Washington, D.C. No presentations were made at this meeting. |
|
11. |
Meeting of the Subgroups on Emissions and Environment, October 24, 1991, Washington, D.C. Toyota Motor Corporation Saburo Inui Tadao Mitsuta Ryuzo Oshita Richard Penna Mitsubishi Yoshiaki Dann Steve Sinkez General Motors Jack Benson Lewis Dale Samuel Leonard Stephen O'Toole Gerald Stofflet Richard Taylor Robert Wiltse Ford Motor Company Kelly Brown Richard Baker Haren Gandhi Helen Petrauskas Volkswagen of America Leonard Kata Karl Heinz-Neumann Mercedes-Benz Corporation Klaus Drexl William Kurtz Patrick Raher |
|
|
Environmental Protection Agency Karl Helman |
|
12. |
Meeting of the Subgroup on Standards and Regulations, November 4, 1991, Washington, D.C. Toyota Motor Corporation Charles Ing Saburo Inui Tetsushi Itoh Richard Penna Kazuko Sherman Junzo Shimizu Katsumi Suzuki General Motors Corporation George Eads William Ball Harry Foster James Johnston Gerald Stofflet Honda E. Amito Toni Harrington Ford Motor Company Kelly Brown Allan Gilmour Susan Sheckson Martin Zimmerman Chrysler Corporation Ronald Boltz Van Bussmann Thomas Gage Robert Liberatore Natural Resources Defense Council Ralph Cavanagh |
|
13. |
Committee Meeting, November 11-13, 1991, Washington, D.C. No presentations were made at this meeting. |
APPENDIX G
BIOGRAPHICAL SKETCHES OF COMMITTEE MEMBERS
Committee on Fuel Economy of Automobiles and Light Trucks
Energy Engineering Board National Research Council
Richard A. Meserve (chairman) is a partner in the law firm Covington & Burling of Washington, D.C. His educational background includes a J.D. from Harvard University and a Ph.D. in applied physics from Stanford University. He served as legal counsel to the President's Science Adviser for the period 1977-1981. He is now chairman of the National Research Council's (NRC) Panel on Cooperation with the USSR on Reactor Safety and previously chaired the Committee to Provide Interim Oversight of the Department of Energy's Nuclear Weapons Complex. He is a member of the NRC Committee on Scientific Responsibility and the Conduct of Science.
Gary L. Casey is former director, Advanced Technology, at Allied-Signal, Inc., Troy, Michigan, and has managed a variety of R & D functions involving brake, suspension, and engine control systems. He has also served as director of engineering at Mercury Marine, which manufactures marine propulsion systems. He is a mechanical engineer by training, has over 20 years of experience in automotive R & D, and is an adjunct professor at Wayne State University.
W. Robert Epperly is president of Epperly Associates, Inc., a consulting firm in New Canaan, Connecticut. He was previously chief executive officer of Fuel Tech N.V., a company engaged in development and commercialization of combustion technology to improve efficiency and reduce emissions. Earlier, he was at Exxon Research and Engineering Company, where he ended 29 years of service as general manager, Corporate Research. He served on the NRC's Committee on Synthetic Fuels Facilities Safety and chaired its Committee on Cooperative Fossil Energy Research. He holds an M.S. in chemical engineering from Virginia Polytechnic Institute.
Theodore H. Geballe is a professor of applied physics and material sciences at the Department of Applied Physics, Stanford University. Past service at Stanford includes chairman, Department of Applied Physics, and chairman, Center for Materials Research. Previously, he served as head, Department of Low Temperature and Solid State Physics in the Physical Research Laboratory, Bell Telephone Laboratories, Murray Hill, New Jersey. He is a member of the National Academy of Sciences, the American Academy of Arts, and a fellow of the American Physical Society.
David L. Greene is a senior research staff member at Oak Ridge National Laboratory, Tennessee. His work has focused on national policy issues related to transportation energy use, efficiency, and alternative fuels. He is chairman of the section on Environmental Concerns of the NRC's Transportation Research Board and recent chairman of the Committee on Conservation and Transportation Demand. He has a Ph.D. from Johns Hopkins University.
John H. Johnson is presidential professor and chairman, Department of Mechanical Engineering and Engineering Mechanics at Michigan Technological University, Houghton. His research work includes combustion studies, hybrid engines, tribology, emissions, and air pollution. He has served on committees of the National Academy of Sciences, Office of Technology Assessment of the U.S. Congress, and National Aeronautics and Space Administration. He holds a Ph.D. in mechanical engineering from the University of Wisconsin.
Maryann Keller is managing director and automotive analyst with the brokerage firm of Furman Selz Incorporated, New York. Her work for the past 20 years has focused on the automotive industry. Her previous positions were with the investment advisory firms of Vilas-Fischer Associates, Inc., Paine Webber Mitchell Hutchins, and Kidder, Peabody & Company, Inc. She was a participant in the Massachusetts Institute of Technology's four-year study of the automotive industry, currently serves on the Committee to Assess Advanced Vehicle and Highway Technologies of the NRC's Transportation Research Board, and is president of the Society of Automotive Analysts. She holds an M.B.A. from the City University of New York.
Charles D. Kolstad is associate professor, Institute for Environmental Studies and Department of Economics, University of Illinois, Urbana, and a member of the NRC's Energy Engineering Board. He has also been on the faculty of the Massachusetts Institute of Technology and the staff of the Los Alamos National Laboratory. For over 15 years he has been involved in research on energy and environmental economics and is the author of over 80 scholarly articles, books, chapters, and reports. He holds a Ph.D. from Stanford University.
Leroy H. Lindgren is vice president, Manufacturing Planning Systems, Rath & Strong, Inc., Lexington, Massachusetts, a consulting firm that specializes in manufacturing operations, production planning, facilities design, and costing. He also served there as director of technical services and vice president of policy and planning and has extensive experience with the U.S. automotive industry. He was a member of the National Academy of Sciences' Committee on Motor Vehicles and served as a consultant to the Department of Transportation, Department of Energy, and the
Environmental Protection Agency. He holds a B.S. in mechanical engineering from the Illinois Institute of Technology and has served as adjunct associate professor at Boston University.
G. Murray Mackay is head of the Accident Research Unit, Automotive Engineering Center, University of Birmingham, England, where he has been a reader in traffic safety. His research interests include vehicle design and collision performance, epidemiology of transport accidents, traffic engineering, and the biomechanics of injury. He is fellow of the Institution of Mechanical Engineers and has served as director and president of the American Association for Automotive Medicine. He holds a Ph.D. and D.Sc. from the University of Birmingham.
M. Eugene Merchant is senior consultant at the Institute for Advanced Manufacturing Sciences, Cincinnati, Ohio. Previously, he was director, Advanced Manufacturing Research at Metcut Research Associates, Inc., and principal scientist for manufacturing research at Cincinnati Milacron Inc. He is a member of the National Academy of Engineering and has served on the NRC's National Materials Advisory Board and Manufacturing Studies Board. He is past president of the Society of Manufacturing Engineers, the International Institution for Production Engineering Research, American Society of Lubrication Engineers, and the Federation of Materials Societies. He holds a D.Sc. from the University of Cincinnati, where he has been an adjunct professor of Mechanical Engineering.
David L. Morrison is technical director, Energy, Resource and Environmental Systems Division, The MITRE Corporation, McLean, Virginia. He was previously president of the IIT Research Institute and director of Program Development and Management, Battelle Memorial Institute. He is a member of the NRC's Energy Engineering Board, has served on the NRC's National Materials Advisory Board, and most recently was chairman of the Committee on Alternative Energy R&D Strategies, whose work resulted in the publication Confronting Climate Change: Strategies for Energy, Research, and Development (1990). He holds a Ph.D. in chemistry from the Carnegie Institute of Technology.
Phillip S. Myers is emeritus distinguished research professor, and former chairman, Department Mechanical Engineering, University of Wisconsin, Madison. He is a member of the National Academy of Engineering and fellow of the American Society of Mechanical Engineers and was the 1969 National President of the Society of Automotive Engineers. He was a member of the NRC's Committee on Production Technologies for Liquid Transportation Fuels, whose work resulted in the publication Fuels to Drive Our Future (1990). His research interests are in internal combustion engines, combustion processes, and fuels. He holds a Ph.D. from the University of Wisconsin.
Daniel Roos is professor of Civil Engineering, and director of the Center for Technology, Policy, and Industrial Development, Massachusetts Institute of Technology, Cambridge. He is also the director of the International Motor Vehicle Program at MIT, whose reports include The Machine That Changed the World (1990) and The Future of the Automobile (1986). He has also been director of MIT's Center for
Transportation Studies. He has served as chairman of the Paratransit Committee of the NRC's Transportation Research Board and is chairman of the Committee to Assess Advanced Vehicle and Highway Technologies. He holds a Ph.D. in Civil Engineering from MIT.
Patricia F. Waller is director of the University of Michigan Transportation Research Institute, Ann Arbor. Previously, she was research professor, School of Public Health, University of North Carolina, and director of the university's Injury Prevention Research Center. She also served as associate director for driver studies of the university's Highway Safety Research Center. She chairs the NRC's Transportation Research Board Council on Intergroup Resources and is a member of their Research Technology and Coordinating Committee for the Federal Highway Administration and committees on Planning and Administration of Transportation Safety; Motor Vehicle Size and Weight; and Alcohol, Other Drugs and Transportation. She is a psychologist and holds a Ph.D. from the University of North Carolina.
Joseph D. Walter is director, Central Research, at Bridgestone-Firestone, Inc., Akron, Ohio. He is an expert in polymers and composites and has 20 years of experience in tire design and rolling friction. He is editor and/or author of book and articles on the mechanics of pneumatic tires and has done advanced design work on composite wheels for automobiles. He is a member of the Accreditation Board for Engineering and Technology. He holds a Ph.D. in engineering from Virginia Polytechnic Institute and an M.B.A. in finance from the University of Akron.


