
9
Meteorology
Mark D. Powell, Environmental Research Laboratories/Hurricane Research Division, National Oceanic and Atmospheric Administration, Miami, Florida
OVERVIEW
After passing through the Caribbean, Hurricane Hugo weakened considerably from a category 4 storm on the Saffir-Simpson scale to category 2, with maximum sustained surface winds estimated at 90 knots (103 mph) just north of Puerto Rico. Hugo continued to move northwest under the influence of a cutoff low-pressure feature near the Florida panhandle and the Atlantic subtropical ridge. The hurricane slowly strengthened to category 3 [110 knots (126 mph)] during its approach to the U.S. mainland and then accelerated and intensified rapidly to category 4 status only 10 hours before landfall, with maximum sustained surface winds estimated at 117 knots (135 mph. Based on minimum central pressure at landfall, Hugo was the tenth most intense hurricane to strike the United States this century and the most intense landfalling storm since Camille (second most intense this century) struck the Gulf Coast in 1969.
Surface-wind measurements were not available at the location of the storm where NOAA reconnaissance aircraft had measured peak winds before landfall. Maximum measured winds at landfall were a 1-min average of 76 knots (87 mph) at the Charleston Customs House and a peak 1-sec gust of 119 knots (137 mph) at the North Charleston Navy Yard. A reconstruction of the surface windfield at landfall suggests that the maximum sustained surface winds over land were 105 knots (121 mph) in the Bull Bay region, about 25 mi northeast of Charleston. Hugo maintained a rapid northward motion after landfall and was able to sustain enough of its circulation to cause extensive damage well beyond Charlotte, North Carolina, about 204 mi inland.
STORM TRACK
The track of Hurricane Hugo, based on positions obtained from a variety of land, air, and space-based observing platforms, is shown in Figure 9-1. On September 19, at 1400 EDT, Hugo had weakened considerably from its passage over northeastern Puerto Rico (see Part 1 of this report: Puerto Rico and the U.S. Virgin Islands) to a minimum sea-level central pressure (MSLP) of 966 mb, with maximum sustained (1-min average) surface winds (Vmss) estimated at 90 knots (103 mph). Hugo's motion was influenced by a combination of two major synoptic flow features.
As indicated in Figure 9-2, a cutoff low (col) located over the Florida panhandle and the subtropical Atlantic ridge (str) centered near Bermuda provided a deep layer of southeasterly flow, which influenced the motion of the storm. An approaching midlatitude trough (mlt), located over the Rockies in Figure 9-2, subsequently affected the acceleration of Hugo, 24 hours later. A more detailed track of the wind center of Hugo, along with surface-wind-data source locations, is presented in Figure 9-3.
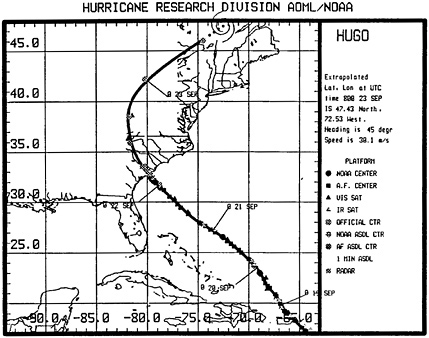
FIGURE 9-1 Hurricane Hugo storm track from 2400 UTC on September 18 to 2400 UTC on September 22, 1989. Storm center fixes from various observational platforms were fitted by splines to determine a smooth track. Source: NOAA/HRD, 1989.
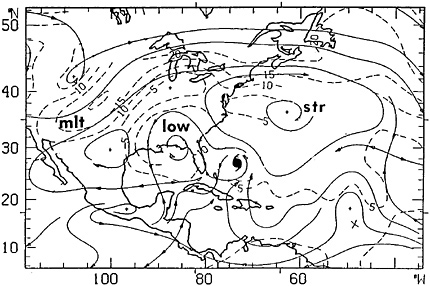
FIGURE 9-2 Deep-layer mean-flow analysis for 2400 UTC on September 20 showing three major synoptic scale features that influenced Hugo 's storm track. Source: Aberson and DeMaria, 1990.
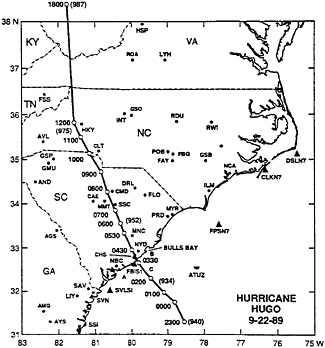
FIGURE 9-3 Detailed track of Hugo's wind center. Surface observation sites are indicated by NWS, FAA, or NDBC call letters. Offshore locations A, B, C refer to airborne Doppler-radar wind profiles in Figure 9-8. Source: NOAA/HRD, 1989.
MOTION AND TRACK FORECAST PERFORMANCE
By 2000 EDT on September 20, Hugo's MSLP deepened to 950 mb, with the maximum sustained surface wind velocity (Vmss) estimated at 100 knots (115 mph). Forecasts based on data collected at this time were crucial for determining which sections of the U.S. mainland were to be put under a hurricane warning (landfall imminent within 24 hours) and therefore which communities needed to be evacuated. The NHC endeavors to issue warnings with sufficient daylight time to allow preparations to be completed before tropical storm conditions arrive. The range of track-forecast-guidance products available to the forecasters from data collected at this time is shown in Figure 9-4 from Aberson and DeMaria (personal communication, 1990). For further discussion of forecast products in Hugo, see Sheets, 1990. Normally, these products are available to the forecaster within 5 hours of the synoptic time, 0100 EDT, September 21 in this case. As seen in Figure 9-4, the guidance models did not forecast the acceleration of the storm. The majority of the guidance predicted landfall within 36 hours (12 UTC, September 22). Actual landfall occurred in the Charleston area within 23 hours, at 2400 EDT on September 21. To allow for a range of forecast possibilities and provide sufficient preparation time, warnings were required by the morning of September 21. The official forecast was influenced primarily by the NHC 83 (now NHC 90) model, which usually outperforms all other guidance.
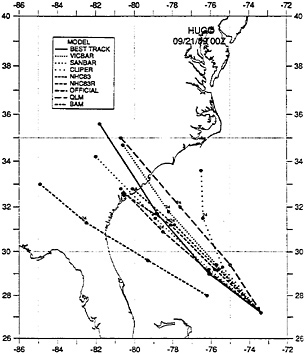
FIGURE 9-4 Dispersion of forecast tracks based on the initial position at 2400 UTC on September 20, 1989, showing 12-, 24-, and 36-hour forecast positions. Source: NOAA/HRD.
At 0600 EDT on September 21, NHC allowed for the possibility of an unforeseen acceleration and issued a hurricane warning from Fernandina Beach, Fla., to Cape Lookout, North Carolina In retrospect, the forecast of landfall point was extremely accurate, with an error of only 37 mi. The forecast of the time of landfall came late by NHC standards, but fortunately warnings were in place early enough to account for possible forecast error. Over the history of Hugo, the best performing operational guidance models at 24 h were SANBAR (102 km, 63-mi error) and NHC 83 (113 km, 70 mi), which were slightly better than the official forecast (120 km, 75 mi).
Forecast of the hurricane track after landfall is also very important, since decaying hurricanes represent a significant flooding threat and may still have wind gusts, over hurricane force after the storm has been downgraded to a tropical storm. The marine advisories convey track and intensity forecasts to public officials and the media. Marine advisories issued at 1500 and 1800 EDT on September 21 contained postlandfall track forecasts that positioned Hugo about 35 mi west of Raleigh, North Carolina, by 0800 EDT on September 22; in fact, Hugo passed 115 mi to the west of Raleigh.
After landfall, track forecasting benefits from a more dense network of upper-air observing sites, but because of cost, manpower, and logistical limitations, these observations are made only twice a day (at 0800 and 2000 EDT). In most midlatitude synoptic forecast situations, two-per-day upper-air observations are adequate. However, in forecasting mesoscale systems such as Hurricane Hugo embedded within rapidly changing synoptic flow fields, this time resolution may not be adequate to identify changes in the synoptic flow that can influence storm motion. However, because of the low spatial density of observations over the open oceans, increasing the frequency of upper-air observations would not necessarily solve this problem. In Hugo, the feature that ultimately contributed most to the motion of the storm toward land was the westward extension of the mid-Atlantic subtropical ridge (see Figure 9-2). Proper resolution of the ridge even at one analysis time would require numerous aircraft soundings extending 1,500 km offshore from 20 N to 45 N latitude. Such observations would be valuable but costly. Future improvements in track forecasting will rely heavily on improvements in data assimilation and analysis. Research in these areas should be supported.
Forecasting is further complicated by difficulty in prescribing accurate initial position and storm-motion information required as input to numerical forecast models. Without reconnaissance observations over land, forecasters must rely on surface observations, satellite images, and radar to determine storm-center positions. Decaying hurricanes have poorly defined cloud and precipitation structures that increase the uncertainty of position estimates by satellite or radar. Surface observations do not have sufficient space and time resolution to regularly determine accurate center positions.
Based on the most recent upper-air observations collected at 2200 EDT on September 21, NHC revised the forecast track to show Hugo moving farther inland. The 2400 EDT marine advisory forecasted the storm to be 48 mi south-southwest of
Charlotte, North Carolina, by 0800 EDT. Hugo actually passed 62 mi to the northwest of the city. Unfortunately, the revised forecast was still slow, and the late revision gave disaster-preparedness officials in Charlotte little time to prepare. As discussed below, a fast-moving storm like Hugo can still be dangerous even 200 mi inland. Emergency-response officials in inland communities should take necessary precautions when they are within the error margin of a postlandfall hurricane-track forecast. For example, the 10-year average error for official forecasts made 24 hours in advance is 125 mi (Lawrence, 1989). Any cities within this radius from the 24-hour forecast point should make preparations for a decaying hurricane or tropical storm.
Presently, research is being conducted on hurricane motion and track prediction at several institutions. An experimental model developed at NOAA's Hurricane Research Division (HRD), VICBAR (DeMaria and Aberson, 1990), was tested at NHC in a nonoperational mode. It performed well in the 12- to 36-hour range throughout the 1989 Atlantic hurricane season and had a 35-mi landfall location error on the northeast side of Charleston. The VICBAR model shows much promise; its operational implementation should be considered.
INTENSITY PREDICTION
While much is being learned about motion and track prediction that should lead to improved forecasts in the future, little is known about prediction of intensity changes, especially rapid intensification. In the 6-hour period from 1400 to 2000 EDT on September 21, Hurricane Hugo intensified rapidly, with the MSLP deepening from 944 (category 3) to 935 mb (category 4) just before landfall. As shown in Figure 9-5, the 24-hour forecast of Vmss in the marine advisories indicated little change in strength. The 24-hour forecast of intensity is especially important for emergency-preparedness officials; a more intense storm can produce a larger area of storm surge inundation, therefore requiring greater preparations and evacuation of people from a larger area.
Three theories on storm intensification are discussed below. The first involves nteraction of the hurricane vortex with midlatitude, synoptic-scale circulation features through eddy fluxes of angular momentum and heat (Molinari and Vollaro, 1989). This theory would require Hugo to interact with the cutoff low and an approaching trough, as shown in Figure 9-2. A second theory links intensification to the environmental wind shear (Gray, 1968; Aberson and DeMaria, 1990). The relationship between shear and intensity for Hugo is shown in Figure 9-6 (from Aberson and DeMaria, 1990), which indicates that intensification occurs when the environmental shear is weak.
A third possibility for the intensification of Hugo prior to landfall concerns the effect of the Gulf Stream. A satellite analysis of sea-surface temperatures (SST) after the passage of Hugo and the boundaries of the Gulf Stream prior to the hurricane is shown in Figure 9-7. Note the cold SST field to the right of Hugo's track. This is a common feature in regions with a shallow oceanic thermocline. As indicated by
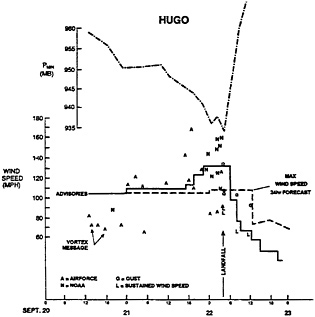
FIGURE 9-5 Time (UTC) series of minimum central sea-level pressure (PMIN), maximum flightlevel wind speeds reported by NOAA (N) or AF (A) aircraft, maximum sustained surface wind estimates, and the 24-hour forecast. Source: NOAA/HRD.
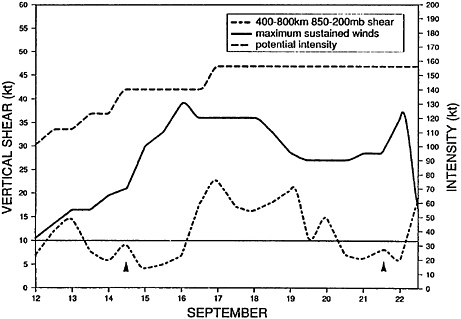
FIGURE 9-6 Time series of 850-200 mb level wind shear evaluated from 400-800 km away from Hugo and intensity as measured by estimated maximum sustained surface-wind speed. Source: NOAA/HRD.
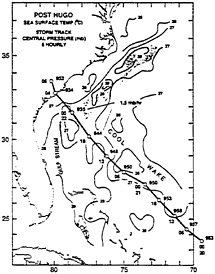
FIGURE 9-7 Post-Hugo sea-surface temperature analysis produced by NOAA Ocean Products Center with pre-Hugo Gulf Stream boundries. Six hourly storm-track positions are plotted along with minimum central sea-level pressure. Source: NOAA/HRD.
Black (1983), stress-forced turbulent mixing and upwelling bring the colder thermocline water closer to the surface and cool the SST field. This cold water has a negative effect on intensification: hurricanes require warm water to sustain heat and moisture budgets that drive the storm. As Hugo passed over the Gulf Stream, intensification could proceed more rapidly, since relatively warm, deep-thermocline water existed there, eliminating storm-induced cooling. The deepening of Hugo prior to landfall was probably a combination of the above three, and perhaps other unknown effects. Further research on hurricane intensification and its prediction is warranted and should be supported.
WIND MEASUREMENTS BY RECONNAISSANCE AIRCRAFT
Prior to and during landfall, NHC relies on reconnaissance aircraft to report observations of the location, strength, and intensity of the storm. These data are transmitted to NHC in real time in the form of “vortex messages,” which also supply the maximum wind speed observed during a particular transit through the storm. These values help to form the basis for the Vmss mentioned in the public advisories. NOAA, and some USAF reconnaissance aircraft, are capable of sending high-resolution wind and thermodynamic data via aircraft-satellite data links (ASDL), which provide NHC with high-quality data at typical reconnaissance altitudes of .5 to 9.5 km.
The winds observed by these aircraft are measured by inertial navigation systems (INS) and are highly reliable. Unfortunately, some of the USAF aircraft flying in Hugo were not equipped with these systems (called the Improved
Weather-Reconnaissance System or IWRS) and supplied relatively poor-quality wind data throughout the 1989 Atlantic hurricane season. These platforms computed winds that are low relative to INS-measured winds (Sheets, 1990). This problem should be solved by completing the IWRS upgrade as soon as possible.
Occasional rawindsonde information over land, multiaircraft research experiments, and recent airborne Doppler-radar data collected over water by HRD suggest that the maximum wind level is variable but is usually found between 500 and 2,000 m. An example of such a profile over land is shown in the 2000 EDT (September 21) rawindsonde launch from Charleston, labeled CHS in Figure 9-8, when Hugo was only 106 mi offshore. In this case, very strong wind shear is indicated from the surface to the maximum wind level of 2 km.
Airborne Doppler wind profiles have a different shape over the water (a,b in Figure 9-8 and Figure 9-3), where lower surface friction decreases the wind shear in the lower 2 km. The profile would also show less shear over both land and water, in the vicinity of rainbands (e.g., in the eyewall, c in Figure 9-8 and Figure 9-3), where convective scale (1-10 km) updrafts and downdrafts greatly influence the wind profile and horizontal windfields.
Because of safety restrictions, it is often necessary to fly reconnaissance aircraft at levels higher than where the maximum winds might be found. The NOAA aircraft flying through Hugo prior to landfall was at 3.6 km, where the winds typically are decreasing with height due to the warm-core nature of the storm. Hence, the problem in warning the public of wind severity is compounded by the fact that the winds may be stronger below the aircraft. The solution to this problem is to sense the
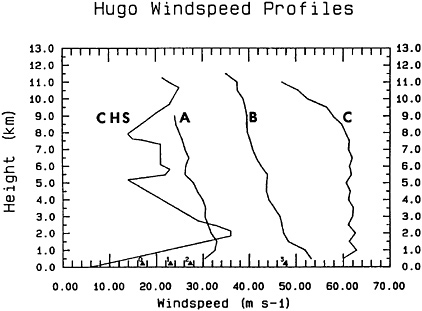
FIGURE 9-8 Vertical profile of wind speed from the surface through 5 km for the 2400 UTC, September 21, rawindsonde launch at Charleston, South Carolina, (CHS) and airborne Dopplerradar profiles. Filled triangles are 2-min mean winds. Source: NOAA/HRD.
surface wind remotely. This capability now exists in the Stepped-Frequency Microwave Radiometer (SFMR) developed by Professor Cal Swift of the University of Massachusetts (Black and Swift, 1989; Tanner et al., 1988). The prototype SFMR has performed well in extensive tests by HRD over the past several hurricane seasons on NOAA aircraft. In the future, the SFMR measurements will be sent to NHC in real time via ASDL. The 44th Interdepartmental Hurricane Conference (Carnahan, 1990) has recommended that NOAA and USAF investigate means to procure SFMRs for the reconnaissance aircraft. Funding of these instruments should be supported.
ESTIMATION OF SURFACE WINDS USED IN PRELANDFALL ADVISORIES
Until we reach the point where surface-wind speed can be routinely measured by reconnaissance aircraft, we must estimate the Vmss based on aircraft measurements above the surface. Powell and Black (1990) compared NOAA aircraft wind, VFL, with surface-wind measurements, VB (8.5-min average at 10-m level), from NOAA data buoys in hurricanes in the Atlantic and Gulf of Mexico. They found that the ratio VB/VFL over the open ocean varied from .6 to .8 (with a .15 standard deviation), depending on boundary layer stability and aircraft height. Typical gusts (4-sec average) measured by the buoys are 30 percent higher than VB with a 30 percent standard deviation. Hence, a VB of 68 knots (78 mph) would likely contain a peak gust of 88 knots (101 mph).
In the public advisories issued prior to landfall, as seen in Figure 9-5, NHC allowed for frictional reduction of the wind, and estimation of the surface wind from a pressure-wind relationship (Sheets 1990), resulting in a surface-wind estimate of 117 knots (135 mph), 84 percent of the maximum flight-level value of 140 knots (161 mph). Based on the information available to NHC forecasters, and considering that the level of maximum winds was probably located below the aircraft between 500 and 2,000 m, the public advisories adequately warned the public of the maximum sustained winds to be expected on the coast. (Validation of the wind warning is discussed below.)
At present, the mention of gust-wind speeds is given in the marine advisories. The gusts used in the marine advisories in Hugo were only 20 percent higher than the Vmss. Since it is the short-time-period (2 to 4-sec) wind gust that is responsible for much of the damage in a hurricane, an estimate of the peak surface gusts expected should be made in advisories issued after landfall. The estimate should consider typical gusts (usually caused by turbulence) and extreme gusts (produced by downdrafts or downbursts from rainbands). Implementation of gusts in the advisories could be attained by applying gust factors (the ratio of peak gust to the mean wind over a specified averaging time period) to the V mss, measured by the SFMR or estimated from the peak flight-level wind. Suggested gust factors are 1.3 over water and up to 1.5 over land, with factors as high as 2.0 inland in the eyewall for several hours after landfall.
LANDFALL OF HURRICANE HUGO
Radar Structure and Track
The evolution of the precipitation field at landfall (2400 EDT September 21) as determined by the NOAA NWS radar at Charleston is given in Figure 9-9 from data collected by HRD's “Hurricane Chase” team. Although there is some ground clutter contamination in Charleston, it is clear that the eyewall (a ring of intense rainfall surrounding the eye that contains the highest winds) affected an area about 100 km wide, with some indication that the eye decreased in diameter from 55 km to 45 km after landfall, while the thickness of the eyewall increased. This was probably caused by enhanced frictional inflow over land, which allowed precipitation particles to be advected closer to the storm center. The total eyewall dimension remained about 100 km throughout the time period in Figure 9-9. Storm total rainfall from Beaufort to Charleston ranged between 6 and 8 inches, dropping off to 2 inches near Myrtle Beach. Storm rainfall caused no serious flooding problems, although a subsequent rainfall episode (not associated with Hugo) hampered recovery efforts and damaged building contents after the storm.
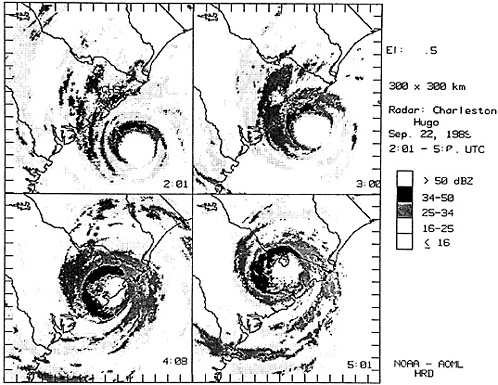
FIGURE 9-9 Sequence of digitized radar reflectivity (dBZ) sweeps from the Charleston NWS radar during Hugo's landfall. Source: NOAA/HRD.
Wind Asymmetries
As observed in past storms (for example, Hurricane Alicia [Powell, 1987]), the windfield of Hugo was very asymmetric. Contributions to this asymmetry were the strong subtropical Atlantic anticyclone (Figure 9-2), the storm's high speed of 23 knots (26 mph), convective rainbands, and the land-sea asymmetry produced by topography and coastline orientation. Simple models based on translation and solid-body rotation cannot accurately reproduce these asymmetries. More complicated models (e.g., Shapiro, 1983) exist, but have not been applied to landfall situations. Further research is needed to construct realistic atmospheric boundary-layer models capable of reproducing hurricane surface-windfields at landfall. Case studies of past and future storms are required to validate such models. These models could be implemented to assess hurricane risk of wind damage for various categories of storms.
Storm Surge
The effects of storm surge associated with Hugo are detailed elsewhere in this report (see Chapter 6 and Chapter 11). Disaster-preparedness officials use atlases of the maximum envelope of high water (MEOW) for various storm intensities and approach categories determined by runs of the SLOSH model at NHC. At present, near-real-time forecasts of maximum storm surge are incorporated in the public advisories based on model runs encompassing a variety of possible landfall locations and storm intensities to account for forecast uncertainty (Sheets, 1990). Hindcast performance of the SLOSH model for Hugo (Figure 9-10) was excellent (Jarvinen, 1990, personal communication). It should be noted that the SLOSH model is sensitive to input parameters, especially radius of maximum winds (Rmax). The landfall point and Rmax used in Figure 9-10 were preliminary estimates. Analyses below indicate that Rmax was larger than that used in Figure 9-10. The accuracy of the SLOSH analysis indicates that the computed curve values were very close to the preliminary observed values, with the exception of the underestimated values on the North Carolina coast.
The SLOSH model is capable of computing realistic storm surges, provided that the input parameters are accurate. Further research is required in order to specify better the outer-windfield forcing responsible for underforecasted surges in the North Carolina coastal area.
Local Statements and Data Acquisition
Public advisories issued by NHC contain information on the peak surges expected relative to the storm center. The local NWS office issues statements with more detailed flooding and wind information, provided that communications are not
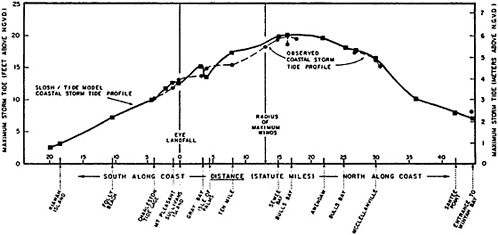
FIGURE 9-10 Comparison of SLOSH model hindcasted storm-surge heights versus preliminary observations of the coastal storm-tide profile. Source: NOAA/HRD.
lost. Unfortunately, the Charleston NWS office was hampered by power losses and equipment damage that put employees in danger and interrupted collection and transmission of important information. Coastal NWS stations require key changes to ensure uninterrupted service during severe weather episodes, including: more storm-resistant construction of NWS facilities, more rugged remote tide and wind instrumentation, and improved emergency power and communication capabilities.
SURFACE WINDFIELD AT LANDFALL
It is very important that detailed postanalysis be conducted to document the landfalls of major hurricanes such as Hugo. Provided the affected area is not too rural, surface meteorological observations may be collected from a variety of NWS, Department of Defense (DOD), FAA, NOAA Data-Buoy Office (NDBO) and private sources. Such analyses serve four major functions: (1) they help to verify meteorological information given in warnings issued to the public; (2) they help to define wind-design criteria for structures and establish levels of risk for insurance and other purposes; (3) they allow meteorologists to study the physical processes through which hurricanes weaken after landfall; and (4) they allow investigation of the association of mesoscale precipitation and circulation features (e.g., convective cells within rainbands) with damage patterns.
It is unknown exactly what were the actual maximum sustained surface winds in Hugo because no surface-wind measurements were made in the region where reconnaissance aircraft had measured peak wind speeds just prior to landfall. NHC advisories estimated Vmss winds of 117 knots (135 mph), but the highest Vmss actually
measured was 76 knots (87 mph) at the NWS automatic station located at the Charleston Customs House (CUS in Figure 9-3). The peak (1-sec) gust of 119 knots (137 mph) was measured at the North Charleston Navy Yard (NYD in Figure 9-3). These observations are readily understood when examined in the context of a two-dimensional surface wind field, as described below.
Flight-Level Windfield Prior to Landfall
Analysis of the NOAA aircraft wind measurements (60-sec means) at the 3.6-km level from 2200 to 0400 UTC (1800 to 2400 EDT on September 21) in a storm-relative coordinate system is shown in Figure 9-11, with the coastline superimposed for the time of landfall. This analysis method has been used to study windfields in past hurricanes that made landfall (Powell, 1982, 1987), but now incorporates an objective state-of-the-art analysis algorithm designed by Lord and Ooyama at HRD (Lord and Franklin, 1987; Ooyama, 1987). Note that the maximum winds observed by the aircraft were in the eyewall above the Bull Bay area about 25 mi northeast of Charleston. Within the 117-knot (34-mph) contour are maximum winds of 139 knots (160 mph), which were not resolved by the analysis. Strong winds exceeding 68 knots (78 mph) extend far to the north and east of the center, but weaken rapidly with radial distance on the south and west sides. Although stronger winds may have been observed at a lower level (e.g., Figure 9-8), these winds are indicative of the windfield above the friction layer.
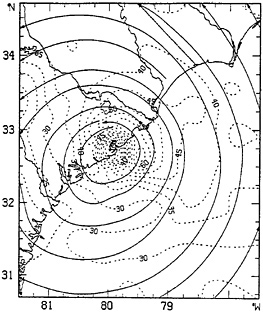
FIGURE 9-11 Streamline and isotach objective analysis of NOAA aircraftwinds measured at 3.6 km from 2200 UTC (1800 UTC) September 21 to 0400 UTC (2400 EDT) in a storm-relative coordinate system. Wind speeds are in m/sec. Source: NOAA/HRD.
Surface Data Processing
Distribution of surface observation sites relative to the storm track is evident from Figure 9-3. Note the lack of sites in the region where the aircraft had measured maximum winds between the Charleston Navy Yard (NYD) and Myrtle Beach (MYR). Lack of data in this region prevented observation of the region of maximum winds located in the southwest end of Bull Bay. This area experienced the eyewall of the hurricane as shown in the radar display at 2400 EDT on September 21 in Figure 9-9. Ideally, analysis of surface data requires that the observations be collected in a standard, consistent manner. Unfortunately, the anemometers shown in Figure 9-3 had heights ranging from 4 to 44 m with different upwind terrain exposures, had averaging times ranging from 1 to 10 min, and used different types of instruments.
The most serious problem faced in attempting to standardize the observations regards averaging times. In the United States, the NWS standard for averaging time is to report the sustained (or 1-min average) wind, while the standard wind-speed averaging time recommended by the WMO of the United Nations is 10 min. As shown by the anemometer trace from Charleston (Figure 9-12), a 1-min observation does not give a very stable estimate of the wind speed compared with a 10-min value. The 10-min observation has also been shown to give a much better estimate of synoptic and larger mesoscale wind features that must be resolved for forecast improvements (Pierson, 1983). In this age of replacing manual observations with the Automated Surface Observing System (ASOS), a change to the 10-min standard
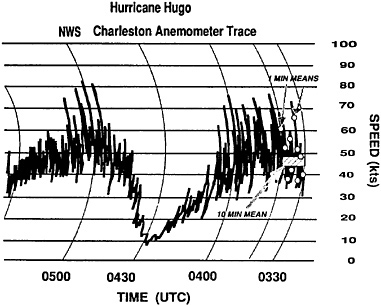
FIGURE 9-12 Anemometer trace from the Charleston NWS office indicating difference between two 1-min averages and relative stability of 10-min average. Speeds are in knots. Source: NOAA/HRD.
should be implemented. The WMO standard should be adopted within the NWS's current Modernization and Associated Restructuring (MAR) plan.
Since methods for standardizing various averaging times (e.g., Durst, 1960) require the maximum 1-min wind observed in a longer (e.g., 10-min or 1-hour) period, and there is no guarantee that the available 1-min wind data fit this requirement, no attempt at conversion has been made in the following analysis. In the cases where an anemometer trace was available, a 10- or 15-min average was estimated visually. The scale of wind features resolved by the measurements is a function of wind speed and averaging time and can be interpreted as the length of a sampling volume of air, as presented in Figure 9-13 from Powell (1990). As shown in Figure 9-13, the scales of wind features resolved in the Hugo measurements ranged from 1 to 40 km. Objective analysis (discussed below) of these input data filters the observations to a windfield that is representative of the mesoscale with 40 km wavelength resolution.
Nonstandard anemometer heights were also a problem. The WMO recommends an anemometer height of 10 m, but most NWS sites use heights of 6 m. Fortunately, mean winds can be adjusted to 10 m provided the terrain roughness upwind of the anemometer can be estimated. A neutral stability log-law reduction was used to adjust all land anemometers to 10 m. Over water, an air-sea interaction boundary layer model (Liu et al., 1979) was used to adjust NDBO Coastal Marine Automatic Network (CMAN) stations to 10 m.
In order to fill in the data-sparse areas at landfall, the aircraft-measured data were adjusted to the 10-m level based on comparisons of flight-level observations with surface measurements in Hurricane Hugo and in past landfalling
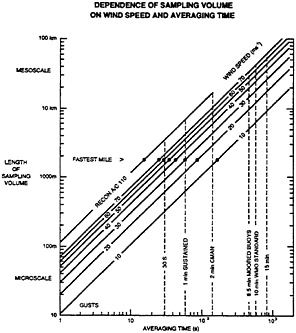
FIGURE 9-13 Sampling volume length as a function of wind speed and averaging time. Source: NOAA/HRD.
Hurricanes—Frederic (1979) and Alicia (1983). In Hugo, these comparisons were made in a storm-relative coordinate system and constrained to <10-km radial and <2-hour time separations, with <5-km and <1-hour separation in the vicinity of the eyewall. Most land measurements were near 45 percent of flight-level winds, with some indication of higher percentages (60 percent) near the eyewall. A reduction of 60 percent was adopted, since this value compared well with ratios observed in Frederic (Powell, 1982) and Alicia (Powell, 1987). Wind direction backing of 45 degrees was used to allow for greater frictional inflow near the surface.
Overwater comparisons with the 3 CMAN stations and one ship indicated that the relationship between surface and flight-level wind was stability-dependent, with ratios of 90 to 100 percent over warm water off Savannah, Ga., on the weak side of the storm, and only 66 percent over cooler water at Frying Pan Shoals, offshore from Myrtle Beach, on the strong side of the storm. Since aircraft flight level was too high to apply properly a boundary-layer model adjustment to the winds, a value of 76 percent was employed, based on a 10-year database of comparisons of NDBO buoys with aircraft overflights in hurricanes at all reconnaissance altitudes (Powell and Black, 1990). Backing of 25 degrees was used to account for surface inflow over the water. Aircraft-adjusted data were given a weighting of 75 percent, and surface-observation weighting was 100 percent; hence, if an aircraft observation was located near a surface measurement, the surface value would be given most consideration.
Without the CMAN sites, it would have been impossible to determine the windfield just offshore with any accuracy. NDBO has an unmatched record in deploying reliable, state-of-the-art automatic weather stations. Their observations have been invaluable for marine forecasting and for studying oceanic windfields in hurricanes. Expansion of the CMAN network (and adding a 10-min mean wind calculation to their output) is an optimal way to ensure documentation of future hurricanes in remote rural areas.
Surface-Windfield Analysis at 0400 UTC
Separate objective analyses were made for overland and overwater exposures and then merged at the coastline for the landfall time of 2400 EDT September 21, resulting in the streamline and isotach analysis of Figure 9-14. The scale of the objective analysis spatial filter (40-km wavelength) results in a surface analysis that is representative of a “snapshot ” of the mesoscale (~15-min wind-speed average) flow field in the hurricane, resolving significant wind maxima associated with the eyewall and rainbands. The low pass filter smoothes out wind features caused by exposure and sampling differences and turbulent and convective scale fluctuations that are of too small a scale to be adequately resolved by the observations.
An important feature in the analysis is the discontinuity at the coastline where strong overwater winds abruptly weaken over land. In reality, this discontinuity is a transition zone where a new internal boundary layer formed as the flow adjusts to a new underlying surface. The width of this transition zone may be 1 km or more,
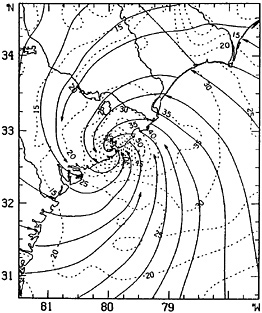
FIGURE 9-14 Formulated like Figure 9-11, but the surface winds are measured by oceanic, land-based, and adjusted aircraft platforms for 0400 UTC (2400 EDT). Source: NOAA/HRD.
depending on the type of terrain. A 77-knot (89-mph) isotach was found offshore of Bull Bay. Unresolved by the analysis filter, but within this isotach, is the best estimate of Hugo's maximum sustained wind. A wind speed of 105 knots (121 mph) at a radial distance of 24 mi from the wind center is estimated based on an adjustment of 76 percent of the peak flight-level wind, as suggested by past comparison of aircraft and 8.5-min average buoy winds. These winds would have been experienced at the coast before decreasing inland to 68 to 77 knots (78 to 89 mph) over a short distance, 1 to 5 km from where the surge flooding extended.
Validation of Public Advisories
Inland from the coast, hurricane-force winds were not evident on the left side of the eyewall but were found on the front (prior to analysis time), rear (after analysis time), and right to a maximum distance of 46 mi from the center. At the coast and over water, hurricane-force winds are indicated 83 mi to the right and rear, but not evident to the left of the center. Public advisories at this time suggested that sustained hurricane-force winds extended 140 mi east of the center and up to 50 mi to the west. Based on these analyses, it would appear that a substantial portion of the warned coastline did not receive hurricane-force winds, although transient winds of hurricane force could have occurred. Before landfall this is unavoidable due to forecast and intensity uncertainty. Average forecast errors at 12 to 24 hours for Hugo were 38 and 75 mi, respectively, and the warning must account for possible last-minute track and intensity changes. It should also be kept in mind that NHC did not
have access to all of the data used to create the analysis shown here. Much of the data did not become available until after the storm. Some initial reports forwarded to NHC by the ham radio network proved to be inaccurate based on observed damage. In addition, standard hourly observations do not have adequate time resolution to resolve the windfield of a fast-moving hurricane. The ability to call up more frequent or continuous observations would be very desirable. Automatic stations should be designed to satisfy this requirement.
The onset of tropical-storm-force winds is the determining factor for the completion of preparedness activities. Based on actual reported surface measurements, tropical-storm-force winds did not occur at Charleston (CUS) (1-min average) until 2120 EDT, when the storm was 76 mi offshore. In comparison, the CMAN stations, taking 2-min average measurements at 10-m levels began observing winds greater than 34 knots (39 mph) at 2000 EDT at Folly Island, South Carolina, (FBIS1, 110 mi from the center), at 1900 EDT offshore of Savannah, Ga., (SVLS1, 159 mi from the center), and at 1510 EDT at Frying Pan Shoals (FPSN7, 193 mi from the center). Again, these distances are less than the extent of tropical-storm-force winds reported in the marine advisories issued at 1800 EDT (250 mi) and are indicative of uncertainties in the forecast track and intensity.
Solutions for the Problem of Sparse Wind Observations
It is clear that higher-resolution measurements are required to resolve the windfield of a hurricane, particularly in rural areas such as Bull Bay. Many suggestions have been made for solving this problem. Most suggest setting up an array of quickly deployable anemometers shortly before landfall. However, the logistical problems involved in this type of effort are immense. Such instrumentation would have to be properly exposed at a reasonable height and guyed for stability. Installation of a wind observing site is no trivial matter. Anything that is easy to deploy is also easy to destroy. Setting up instrumentation safely and properly would require highly trained personnel to begin 24 to 48 hours before projected landfall in order to establish positions along a large enough portion of the coastline to account for possible forecast errors.
Since the mean landfall-point error at 24 hours is approximately 56 mi, a portion of the coast twice this distance would have to be instrumented at a spacing of 9 to 12 mi in order to resolve the region of maximum winds. Hence, 12 sites would be required along with several installation teams. The cost of instrumentation alone would be over $100,000. The equipment would have to be centrally situated and trucked in to the investigation area. Trained installation teams would have to be flown in from outside, arrange transportation, and rendezvous with the equipment when it arrives. As anyone on a disaster team can attest, this is difficult enough without instrumentation after the storm. Timely access to coastal locations would have to be gained at a time when NWS and other public officials are concerned with making emergency preparations. These concerns make it highly unlikely that any
local officials with public service responsibilities would be able to site the instruments. Such a program could probably succeed, but would require at least 5 years and several hundred thousand dollars to measure one hurricane properly. A better alternative would support selected universities along the coast with meteorology and/or civil engineering programs to develop plans to site one or more self-built instruments in a local hurricane episode. Local universities could preselect sites and acquire permissions and clearances to deploy equipment before the event, thereby avoiding many of the logistical problems and costs involved in using outside teams. This was successfully performed by the engineering department at the University of Florida in Hurricanes Frederic and David in 1979.
As stated earlier, the best way to ensure resolving the maximum wind in a landfalling hurricane is to expand the existing CMAN network. NDBC is a world leader in coastal automatic station deployment; their expertise should be employed to expand the network in the coastal Atlantic and Gulf of Mexico from the present separation distance of about 31 to 47 mi down to 15 mi. In addition, as a part of the NWS MAR, numerous ASOSs will be introduced during the 1990s. The ASOS network should have the capability to make continuous-running 10-min means that could be interrogated hourly under normal conditions or at a 10-min frequency in severe weather events. Provision for recording the peak gust and peak 1- and 10-min means associated with that gust over the hour would be desired for climate and design purposes.
Another method, which may be available for investigating hurricanes on the Gulf Coast, would be participation of the NOAA National Severe Storms Laboratory (NSSL) mobile laboratories (Rust et al., 1990). Located in Norman, Oklahoma, these well-equipped vans are capable of making surface observations and launching balloons with sondes that can send back information on the vertical profiles of wind speed, temperature, and humidity through loran tracking. In 1988, HRD assisted in deploying a van to Texas for documentation of outer rainbands in Hurricane Gilbert.
It should be pointed out that the NEXRAD planned by the NWS will be able to provide important information in remote areas near the levels of maximum winds, 0.5 to 2.0 km, but will not provide surface wind measurements because of limitations in beam geometry. Research is needed to clarify NEXRAD applications for estimating surface windfields in hurricanes.
POSTLANDFALL WINDFIELDS
Hugo maintained enough of its circulation to do considerable wind damage well inland. The following analyses depict the windfields associated with Hugo's passage (Figure 9-3) of Columbia, South Carolina, (CAE) at 0300 EDT and Charlotte, North Carolina, (CLT) at 0600 EDT.
Windfield at 0300 EDT (Hugo near Columbia, South Carolina)
The 0300 EDT sweep from the Charleston radar places Hugo's center between Columbia (CAE) and Shaw Air Force Base (SSC), with Shaw in the region of intense reflectivity on the northeast side of the eyewall (see Figure 9-15). Analysis of the available overland and overwater surface data for 0300 EDT (Figure 9-16) indicates that Hugo was just below hurricane strength, with maximum (mesoscale) winds near 58 knots (67 mph) in the northern part of the eyewall. An outer secondary wind maximum of >39 knots (>45 mph) is found associated with an outer rainband 90 mi to the northeast of the center. A time series of radar reflectivity (proportional to rainfall intensity), 10-min means, and peak gusts within each 10-min period for Shaw AFB (Figure 9-17) illustrates the effect of convective rainband features on the windfield. Wind maxima appear in the northeast eyewall at 0230 EDT, the southeast eyewall at 0320 EDT, and several outer rainbands afterwards in accordance with Figure 9-15. Surface inflow increased in all but the southwest quadrants as the MSLP increased to an estimated 952 mb, a rapid increase of 19 mb in 3 hours.
Advisories issued at 0200 EDT warned of hurricane-force winds near the center and Vmss of 87 knots (100 mph), with tropical-storm-force winds extending 100 mi from the center. At 0400 EDT, advisories indicated Vmss of 70 knots (80 mph), with the extent of tropical-storm-force winds unchanged over land. According to the
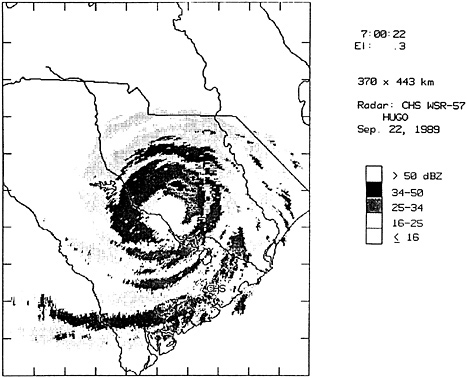
FIGURE 9-15 Sequence of digitized radar reflectivity (dBZ) sweeps at 0700 UTC (0300 EDT), when Hugo was in the vicinity of Shaw AFB. Source: NOAA/HRD.
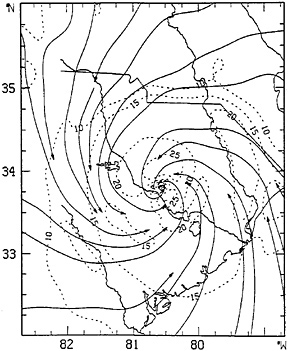
FIGURE 9-16 Streamline and isotach objective analysis of surface winds measured over land for 0700 UTC (0300 EDT). Source: NOAA/HRD.
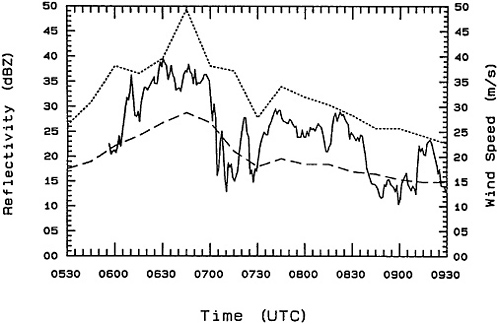
FIGURE 9-17 Time series of radar reflectivity from the Charleston NWS radar (dotted line), peak gusts (solid line), and 15-min mean winds (dashed line) recorded by the Shaw AFB anemometer trace from 0530 to 0930 UTC (0130 to 0530 EDT) September 22. Source: NOAA/HRD.
analysis, the Vmss from the advisory is reasonable, considering the possibility that SSC might have experienced transient 1-min values of hurricane force as the eyewall passed over Shaw. The extent of tropical-storm-force winds over land in the analysis was identical to that in the advisories.
Windfield at 0600 EDT (Hugo near Charlotte, North Carolina)
By 0600 EDT Hugo was still on a north-northwest track to near Charlotte (CLT), North Carolina Unfortunately, the eyewall of Hugo could no longer be detected by the NWS radars at Charleston, South Carolina, or Wilmington, North Carolina Analysis of hourly 1-min-mean data for 0600 EDT (Figure 9-18) indicates that Hugo maintained a narrow, crescent-shaped region of 39 to 47 knots (45 to 54 mph) winds on the north side of the storm center and a secondary wind maximum 105 mi to the southeast. Although the Charlotte anemometer showed an isolated 1-min peak wind of 52 knots (60 mph) simultaneous with the peak gust of 76 knots (87 mph) at 0520 EDT, the trace indicates cup anemometer overspeeding may have caused an inaccurate 1-min mean. The 10-min mean centered at this time is only 36.5 knots (42 mph). Compared with 0300 EDT, inflow increased on the front (north) side of the storm and decreased on the southwest and south sides. The observed increases in inflow on the north side and decreases on the south and southwest sides from 0000 to 0600 EDT are consistent with decreases in the strength of Hugo's circulation as
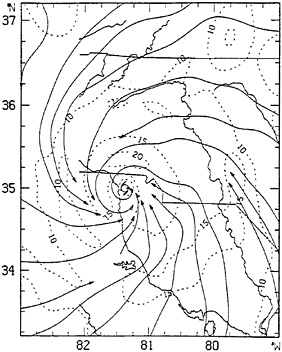
FIGURE 9-18 Streamline and isotach objective analysis when Hugo was in the vicinity of Charlotte, North Carolina, 1000 UTC (0600 EDT). Source: NOAA/HRD.
the MSLP increased to 970 mb, and the acceleration of Hugo's forward speed from 23 to 27 knots (26 to 31 mph). Hugo was downgraded to a tropical storm in the 0600 EDT advisory, which reported Vmss of 61 knots (70 mph). Hugo's MSLP rate of increase, ~6 mb/h, was less than that of Hurricanes Hazel (1954, 11 mb/h) and Camille (1969, 8 mb/h), but three times as large as the average filling rate of landfalling hurricanes (2 mb/h) described by Malkin (1959).
GUST ENVELOPE AND FUJITA'S DAMAGE-DIRECTION ANALYSIS
Based on postanalyses of the available mean-wind observations, the NHC public advisories provided an accurate portrayal of Hugo's sustained winds after landfall. However, the public may not have been prepared for the threat of wind gusts. As previously mentioned, surface gust estimates are included in the marine advisories. No mention of possible or actual gust values was made in the public advisories until 95 knots (109 mph) was recorded by SSC shortly before 0300 EDT and reported in the 0400 EDT advisory. Based on digitized wind traces studied by Dr. Richard Marshall (personal communication, 1990), gust factors (the ratio of peak gust to 10-min mean) for inland locations in Hugo were typically 1.5, except in locations that experienced convective rainband features, where the gust factor could approach 2.0. This was the case at the Charlotte NWS station, where the gust factor exceeded 2.0 from 0530 to 0610 EDT during passage of the eyewall remnants.
The envelope of maximum peak gusts experienced by the observing sites (Figure 9-19) during Hugo shows the drop-off with distance inland from 125 knots (144 mph) at the middle of Bull Bay to 70 knots (80 mph) at Hickory, North Carolina As the storm decays after landfall, some mention of possible gusts should be included in the public advisories, to warn the public of the potential threat, even though sustained winds of less than hurricane force are being experienced.
Included in Figure 9-19 are directions of “first” damage (the debris closest to the surface) determined by Fujita (1990) in an extensive aerial survey of damage patterns. These patterns indicated areas where swaths of extreme winds contributed substantial damage in small areas aligned with the wind. Fujita has done considerable analysis of these regions in Hugo and past hurricanes and believes that they were due to “downbursts.” Downbursts are caused by strong downdrafts spreading out at the ground from convective cells in rainbands. Fujita found no hard evidence of tornadoes in his analysis. NEXRAD will have some capability for distinguishing downbursts and tornadoes in real time as long as the rainbands are within 9 to 93 mi of the radar. By overlaying the wind analyses on the track at various times and noting the locations where damage and wind directions coincide, the time and portion of the storm that caused the greatest damage can be discerned. Nearly all the damage directions were associated with the eyewall wind maximum.
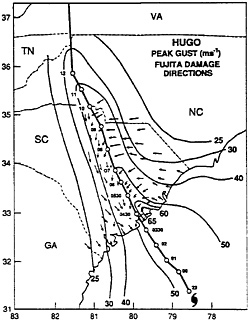
FIGURE 9-19 Envelope of peak gusts relative to the track of Hugo's wind center. Superimposed are damage vector directions as determined by aerial surveys conducted by Fujita (1990).
FINDINGS AND RECOMMENDATIONS
Forecast Tools
The current state of the art in hurricane track and intensity prediction is such that significant coastal and inland regions must initiate storm preparations 36 to 40 hours prior to forecasted landfall. Although landfall-location forecast errors were only 37 mi, the 24-hour forecast timing of landfall was slow by about 6 hours. Hugo's acceleration was not detected until landfall, which created problems for warning inland communities and implementing emergency procedures. Further research is needed to develop intensity-prediction skills and improved track forecasts. Research directed toward improvements in synoptic data assimilation and analysis techniques will eventually improve track forecasting.
Recommendation 1. The VICBAR model should be operationally tested and evaluated for long-term use. Effects of environmental wind shear, synoptic-scale momentum transfer, and air-sea interaction on hurricane intensity deserve further research attention. Further research on atmospheric boundary-layer modeling of realistic hurricane windfields is required to improve warning procedures, storm-surge modeling, and risk assessment.
Recommendation 2. Instrumentation on reconnaissance aircraft must be improved. Timely completion of the IWRS update to USAF aircraft is urged.
Implementation of the SFMR instrument for remote measurement of surface wind on future reconnaissance aircraft should be supported.
Wind Measurement
Observations of surface winds in landfalling hurricanes are required to improve warning and forecast capabilities, study the physical processes associated with hurricane decay, and develop design criteria. At landfall, based on methods outlined above, Hugo's maximum sustained surface winds were confined to a small, crescent-shaped region in the north to northeast portion of the eyewall. These winds reached 105 knots (121 mph) in the coastal area of Bull Bay, 25 mi northeast of Charleston, South Carolina, with gusts to 128 knots (147 mph). Adjacent to the coastline, winds decreased considerably because of frictional effects within 3 mi of the coast. Three hours after landfall, Hugo's maximum sustained surface winds decreased to below hurricane force (i.e., less than 58 knots [67 mph]) in the vicinity of Columbia and Sumter, South Carolina, with peak gusts of 95 knots (109 mph). Hugo reached the Charlotte, North Carolina, area with tropical-storm-force winds (47 knots [54 mph]), and gusts to 76 knots (87 mph) 6 hours after landfall.
Recommendation 3. All automatic surface observation stations should employ standardized methods in accordance with WMO provisions (10-min average at 10-m elevation in open exposure along with peak gusts recorded over the averaging period) and be capable of operating in a more frequent mode (i.e., every 10 or 20 min in rapidly changing weather situations, with backup power support.) For post-storm analysis, climatology, risk, and design applications, maximum gusts should be recorded hourly. Average wind speeds should be determined for 1- and 10-min periods. NWS should coordinate a program in which universities with meteorology and/or engineering departments in near-coastal areas develop automatic measurement/recording packages for local hurricane episode deployment.
Recommendation 4. The NSSL mobile balloon launch and observing labs should be used to investigate landfalling hurricanes in the western Gulf of Mexico. This would improve the knowledge of the vertical profile of the horizontal wind.
Recommendation 5. Research on the development of NEXRAD algorithms for assessment of near-surface hurricane windfields should be supported.
Recommendation 6. Coastal NWS facilities require more storm-resistant construction and dependable emergency power capabilities to ensure the safety of employees and uninterrupted service during hurricanes.
Recommendation 7. The SLOSH model, used to prepare storm-surge evacuation procedures, was found to verify accurately when run in hindcast mode and compared
with preliminary storm-surge height observations within 45 mi of the landfall point. Further research is necessary to improve the SLOSH wind model at greater distances from the center, where SLOSH underestimated surge heights.
Recommendation 8. Convene a conference with regional universities and relevant federal agencies to study how to establish a flexible network of observation stations capable of supporting the NWS data infrastructure.
Overland Tracking
Hurricanes take time to decay; a fast-moving storm like Hugo can still be dangerous even 200 miles inland. Despite the decay of Hugo 's mean circulation, surface-gust speeds over land were 50 percent greater than the sustained speeds in most portions of the storm and up to 100 percent greater in the northeast portion of the eyewall. These gusts contributed to much of the inland damage.
Recommendation 9. Emergency response officials in inland communities should take necessary precautions when they are within the error margin of a postlandfall hurricane track forecast.
Recommendation 10. Further attention should be given to potential gust speeds subsequent to landfall in order to improve warning for inland communities.
REFERENCES
Aberson, S., and M. DeMaria. 1990. Verification of VICBAR track forecasts for Hurricane Hugo. In Minutes of the 44th Interdepartmental Hurricane Conference, January 9-12, 1990. Rockville, Maryland: Office of Federal Coordination for Meteorological Services and Supporting Research.
Black, P. G. 1983. Ocean Temperature Changes Induced by Tropical Cyclones. Ph.D. dissertation Pennsylvania State University. (UMI 300 N Zeeb Road, Ann Arbor, Michigan, 48106.)
Black, P. G., and C. L. Swift. 1984. Airborne stepped frequency microwave radiometer measurements of rainfall rate and surface wind speed in hurricanes. Pp. 433-438 in 22nd Conference on Radar Meteorology held September 10-13, 1984 in Zurich, Switzerland. Boston, Massachusetts: American Meteorological Society.
Carnahan, R. L. 1990. In Minutes of the 44th Interdepartmental Hurricane Conference, January 9-12, 1990. Rockville, Maryland: Office of Federal Coordination for Meteorological Services and Supporting Research.
Case, B and M. Mayfield. 1990. Atlantic hurricane season of 1989. Monthly Weather Review 118: 1165-1177.
DeMaria, M., and S. Aberson. 1990. Verification of a nested hurricane track forecast model (VICBAR) for the 1989 Atlantic hurricane season. In Minutes of the 44th Interdepartmental Hurricane Conference, January 9-12, 1990. Rockville, Maryland : Office of Federal Coordination for Meteorological Services and Supporting Research.
Durst, C. S. 1960. Wind speeds over short periods of time. Meteorological Magazine 89: 181-186.
Fujita, T. 1990. Hurricane Hugo: Results of an aerial damage survey in the Carolinas In Minutes of the 44th Interdepartmental Hurricane Conference, January 9-12, 1990. Rockville, Maryland: Office of Federal Coordination for Meteorological Services and Supporting Research.
Gray, W. M. 1968. Global view of the origin of tropical disturbances and storms. Monthly Weather Review 96: 55-73.
Liu, W. T., K. B. Katsaros, and J. A. Businger. 1979. Bulk parameterization of air-sea exchanges of heat and water vapor, including the molecular constraints at the interface. Journal of Atmospheric Science 36: 1722-1735.
Lord, S., and J. L. Franklin. 1987. The environment of Hurricane Debby (1982). Part I: Winds. Monthly Weather Review 115: 2760-2780.
Malkin, W. 1959. Filling and Intensity Changes in Hurricanes Over Land. NHRL Report No. 34, U.S. Department of Commerce, 18 pp. (National Oceanic and Atmospheric Administration/Hurricane Research Division, 4301 Rickenbacker Causeway, Miami, Florida 33149). Miami, Florida: NOAA/Hurricane Research Division.
Molinari, J., and D. Vollaro. 1989. External influences on hurricane intensity. Part I: Outflow layer eddy angular momentum fluxes. Journal of Atmospheric Science 46: 1093-1105.
Ooyama, K. V. 1987. Scale-controlled objective analysis. Monthly Weather Review 115: 2479-2506.
Pierson, W. J. 1983. The measurement of the synoptic scale wind over the ocean. Journal of Geophysical Research 88: 1683-1708.
Powell, M. D. 1982. The transition of the Hurricane Frederic boundary layer windfield from the open Gulf of Mexico to landfall. Monthly Weather Review 110: 1912-1932.
Powell, M. D. 1987. Changes in the low-level kinematic and thermodynamic structure of Hurricane Alicia (1983) at landfall. Monthly Weather Review 115: 75-99.
Powell, M. D., and P. G. Black. 1990. The relationship of hurricane reconnaissance flight-level wind measurements to winds measured by NOAA's oceanic platforms. Journal of Wind Engineering and Industrial Aerodynamics 36: 381-392.
Powell, M. D., P. P. Dodge, and M. L. Black. 1990. The landfall of Hurricane Hugo in the Carolinas: Surface wind distribution Weather Forecasting 6: 379-399.
Rust, W. D., D. W. Burgess, R. A. Maddox, L. C. Showell, T. C. Marshall, and D. K. Lauritsen. 1990. Testing a mobile version of a cross chain loran atmospheric (M-CLASS) sounding system. Bulletin of the American Meteorological Society 71: 173-180.
Shapiro, L. J. 1983. The asymmetric boundary layer flow under a translating hurricane. Journal of Atmospheric Science 40: 1984-1998.
Sheets, R. C. 1990. The National Hurricane Center: Past, present, and future. Weather Forecast5: 182-232.


