
1
Meteorology
Joseph H. Golden, Oceanic and Atmospheric Research, National Oceanic and Atmospheric Administration, Washington, D.C.
INTRODUCTION
Hurricane Hugo had its origins as a strong tropical disturbance that moved off the African coast on September 9, 1989. The disturbance was accompanied by an area of intense thunderstorms that was visible on satellite imagery. The National Hurricane Center (NHC) track for Hugo began on September 10, when a tropical depression formed to the southeast of the Cape Verde Islands (Figure 1-1). Hugo moved westward at a fast clip, 18 knots, across the eastern Atlantic, intensifying to a tropical storm on September 11 and full hurricane on September 13 (see Figure 1-2, satellite photograph, when Hugo was about 1,100 nautical miles east of the Leeward Islands).
Hurricane Hugo therefore belongs to a class of major hurricanes that has been termed Cape Verde storms. These storms usually originate from strong African wave disturbances that intensify as they move off the West African coast and produce a tropical depression (in rare cases, tropical storm) as they pass close to the Cape Verde Islands. This early intensification and vortex development climatologically favors further intensification, as the storm traverses a long stretch of very warm tropical Atlantic waters at low latitudes, thus reducing chances of weakening or early recurvature, because of interactions with midlatitude westerlies. Other notable Cape Verde hurricanes of this century that have affected Puerto Rico and the Virgin Islands include the famous West Indian or San Felipe hurricane, 1928; the San Ciprian storm, 1932; the Santa Clara storm, 1956; Hurricane Donna, 1960; and Hurricanes Frederic and David, 1979. Tracks of the first three Cape Verde hurricanes are shown in Figure 1-3. The 1928 San Felipe hurricane, which traversed Puerto Rico from the east-southeast, produced a record high rainfall of 25-30 inches and record low barometric pressure reading of 27.5 inches (931 millibars [mb]) at Guayama, and registered peak wind speed gusts of 139 knots (160 mph). Additional details on this hurricane are given by Fassig (1928). That same hurricane reintensified after moving off the northwest coast of Puerto Rico and struck the
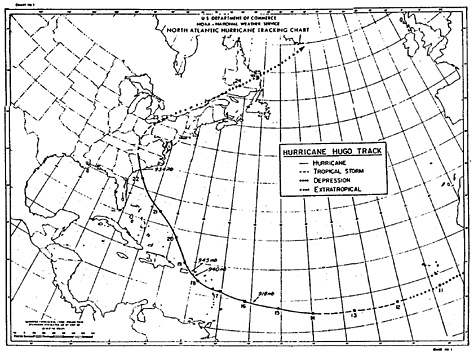
FIGURE 1-1 Final smoothed “official” track of Hurricane HUGO, Sept. 10-25, 1989.
southeast Florida coast as a category 4 storm on the Saffir-Simpson scale (Hebert et al., 1984). According to Hebert and Taylor (1988), the San Felipe hurricane was also the second deadliest to affect the United States during this century, killing 1,836 people in Florida's Lake Okeechobee area ( Table 1-1). Goodman (1989) did a statistical analysis of these and other tropical storms that affected Puerto Rico during 1886-1988. He concluded (well before Hugo occurred) that there was at least a 50 percent probability of a tropical cyclone would either hit or come close to Puerto Rico during the 1989 season. Other meteorological aspects of Hurricane Hugo, in the context of the 1989 Atlantic hurricane season as a whole, are discussed by Case (1990.)
During the night of September 14, 1989, Hurricane Hugo slowed its forward speed and turned more toward the west-northwest. This was in response to a weakening of the high-pressure ridge to the north of the storm. As sometimes noted by hurricane forecasters, when a hurricane slows its forward motion in a favorable tropical air/ocean environment, it becomes stronger, as Hugo appeared to do on September 14 and 15. A visible NOAA-GOES (Geostationary Operational Environmental Satellite) satellite photo of Hugo on September 14 shows the storm 's well-developed eye (Figure 1-4).
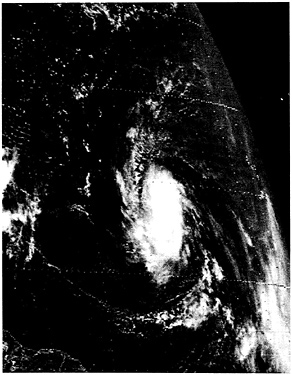
FIGURE 1-2 Satellite photograph when Hugo was about 1,100 nautical miles east of the Leeward Islands. Courtesy of NOAA/NESDIS.
AIRCRAFT RECONNAISSANCE
When the first NOAA reconnaissance aircraft was able to reach Hugo at midday on September 15, the central pressure in the eye was 27.11 inches (918 mb), and sustained wind speeds of 165 knots (190 mph) were measured at 1,500 ft altitude. These data indicated that Hugo had intensified to a rare category 5 status on the Saffir-Simpson scale (Hebert et al., 1984). Figure 1-5 shows an enlarged visible GOES satellite image of Hugo near the time of the NOAA aircraft penetration. Before the NOAA aircraft could reach Hugo, satellite observations had been estimating the storm to be approximately 30 mb higher with slower gusts than were eventually measured by the aircraft. This discrepancy is typical when observing storms in the mid Atlantic where less accurate satellites hand off measurement responsibility to aircraft, which refine data until the storm is in range of larger ground-based radar. It should be noted that the minimum pressure determined at this time ties the Atlantic record of Hurricane Gloria when it was north of Puerto Rico in 1985. Figure 1-6a and Figure 1-6b show the radar plan position indicator (PPI) reflectivity pattern measured by the NOAA WP3D aircraft with its 5-cm fuselage radar and a northwest-southeast radar cross section through the hurricane's eye obtained with the 3-cm tail radar, respectively (see Dodge et al., 1990). These remarkable photographs show that
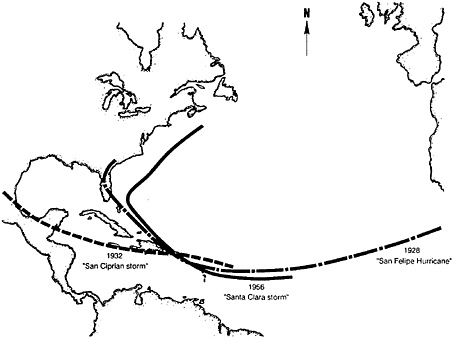
FIGURE 1-3 Tracks of three notable Cape Verde hurricanes that impacted Puerto Rico and the Virgin Islands.
the eyewall sloped outward slightly with height, and had higher reflectivities reaching greater heights (14 km) in the northwestern sector than in the southeastern portion of the wall cloud. Most unusual was the location of the highest reflectivities (in excess of 50 dBz) in the southwest quadrant of the eyewall. Close to the time of Figure 1-6, one of the NOAA WP3D aircraft penetrated the eyewall at 1,500 ft (unfortunately, near the reflectivity maximum in the southwestern quadrant of the wall cloud in Figure 1-6). The radial plots of 30-sec average tangential winds and surface pressure inferred by the aircraft are shown in Figure 1-7. Note that the pressure drops most rapidly inward through the inner rainbands and especially the wall cloud of Hugo, to a minimum of 27.11 inches (918 mb) in the eye itself. Correspondingly, the extreme pressure gradients in the same core region are associated with windspeed maxima, at flight altitude, of about 162 and 178 mph (73 and 80 m/s), through the southwest and northeast portions of the wall cloud, respectively. During this flight penetration, the NOAA aircraft experienced extreme turbulence and windshear, lost one of its four engines (which caught fire), and dropped from 1,500 down to 800 ft before recovering flight control and circling inside Hugo's eye. The aircraft was able to return safely to land at the nearest airport on Barbados. Subsequent inspection revealed no structural damage, and F. Marks and
Table 1-1. The Most Intense U.S. Hurricanes of This Century (at Time of Landfall)
|
Hurricane |
Year |
Category |
Millibars |
Inches |
|
1. Florida (Keys) |
1935 |
5 |
892 |
26.35 |
|
2. CAMILLE (Louisiana/Mississippi) |
1969 |
5 |
909 |
26.84 |
|
3. Florida (Keys/South Texas) |
1919 |
4 |
927 |
27.37 |
|
4. Florida (Lake Okeechobee) |
1928 |
4 |
929 |
27.43 |
|
5. DONNA (Florida/Eastern United States) |
1960 |
4 |
930 |
27.46 |
|
6. Texas (Galveston) |
1900 |
4 |
931 |
27.49 |
|
7. Louisiana (Grand Isle) |
1909 |
4 |
931 |
27.49 |
|
8. Louisiana (New Orleans) |
1915 |
4 |
931 |
27.49 |
|
9. CARLA (Texas) |
1961 |
4 |
931 |
27.49 |
|
10. Florida (Miami) |
1926 |
4 |
935 |
27.61 |
|
11. HAZEL (South Carolina/North Carolina) |
1954 |
4a |
938 |
27.70 |
|
12. Southeast Florida/Louisiana/Mississippi |
1947 |
4 |
940 |
27.76 |
|
13. North Texas |
1932 |
4 |
941 |
27.79 |
|
14. AUDREY (Louisiana/Texas) |
1957 |
4b |
945 |
27.91 |
|
15. Texas (Galveston) |
1915 |
4b |
945 |
27.91 |
|
16. CELIA (South Texas) |
1970 |
3 |
945 |
27.90 |
|
17. ALLEN (South Texas) |
1980 |
3c |
945 |
27.91 |
|
18. New England |
1938 |
3a |
946 |
27.91 |
|
19. FREDERIC (Alabama/Mississippi) |
1979 |
3 |
946 |
27.94 |
|
20. Northeast United States |
1944 |
3a |
947 |
27.94 |
|
21. South Carolina/North Carolina |
1906 |
3 |
947 |
27.97 |
|
22. BETSY (Florida/Louisiana) |
1965 |
3 |
948 |
27.97 |
|
23. Southeast and Northwest Florida |
1929 |
3 |
948 |
27.99 |
|
24. Southeast Florida |
1933 |
3 |
948 |
27.99 |
|
25. South Texas |
1916 |
3 |
948 |
27.99 |
|
26. Mississippi/Alabama |
1916 |
3 |
948 |
27.99 |
|
27. South Texas |
1933 |
3 |
949 |
28.02 |
|
28. BEULAH (S. Texas) |
1967 |
3 |
950 |
28.05 |
|
29. HILDA (Louisiana) |
1964 |
3 |
950 |
28.05 |
|
30. GRACIE (South Carolina) |
1959 |
3 |
950 |
28.05 |
|
31. Texas (Central) |
1942 |
3 |
950 |
28.05 |
|
32. Southeast Florida |
1945 |
3 |
951 |
28.08 |
|
33. Florida (Tampa Bay) |
1921 |
3 |
952 |
28.11 |
|
34. CARMEN (Louisiana) |
1974 |
3 |
952 |
28.11 |
|
35. EDNA (New England) |
1954 |
3a |
954 |
28.17 |
|
36. Southeast Florida |
1949 |
3 |
954 |
28.17 |
|
37. ELOISE (Northwest Florida) |
1975 |
3 |
955 |
28.20 |
|
38. KING (Southeast Florida) |
1950 |
3 |
955 |
28.20 |
|
a Moving more than 30 miles per hour. b Classified category 4 because of extreme tides. c Reached Category 5 intensity three times along its path through the Caribbean and Gulf of Mexico. The lowest pressure reported was 899 mb (26.55 in.) at 1742Z 8-7-80 off the northeastern tip of the Yucatan Peninsula. Source: Hebert and Taylor, 1988. |
||||
FIGURE 1-4 Visible NOAA-GOES satellite photograph of Hugo on September 14, 1989, showing a well-developed eye. Courtesy of NOAA/NESDIS.
others at NOAA/HRD/AOML in Miami are researching the data taken during this and other flights into Hugo; these data include Doppler wind measurements made in the rainbands of Hugo with the NOAA P-3 tail radar. (See also Marks and Houze, 1984, for Doppler analyses made on Hurricane Debby.)
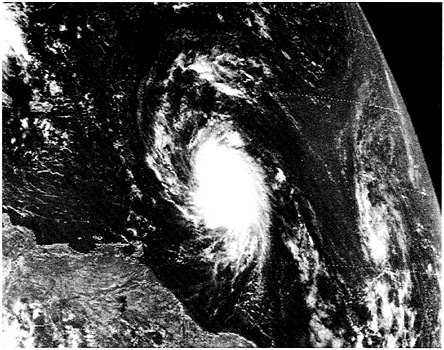
FIGURE 1-5 An enlarged visible GOES satellite image of Hugo near the time of NOAA aircraft penetration. Courtesy of NOAA/NESDIS.
MESOSCALE VARIATIONS IN STORM AND STRUCTURE
The well-developed eye of Hugo approached the Lesser Antilles during the afternoon of September 16. A profound striated structure in the cirrus outflow clouds emanating from the hurricane's northern portion is illustrated in the visible satellite photograph of Figure 1-8. A time-series plot of aircraft-measured surface central pressures and eye diameters estimated from aircraft radars is shown in Figure 1-9. Note that the time history of surface pressure in the eye begins near the time of the record-equalling measurements on the afternoon of September 15—core pressures rose appreciably during the following 24-hour period. An unusual feature is that the peak winds measured by aircraft during the same period remained nearly constant at about 122 knots (140 mph). Some of the problems in relating aircraft reconnaissance winds, usually measured at 10,000 ft, to surface winds measured by anemometers in hurricanes have been addressed by Powell (1980), Black et al. (1988), and Powell and Black (1990). Eye diameters fluctuated during this same period until midday on September 16, when USAF reconnaissance aircraft reported a double, concentric eyewall structure. (The significance of the double eyewall structure for intense hurricanes was noted by Willoughby et al., 1984, for a class of hurricanes, and by Golden in a report on Hurricane Alicia [National Research Council, 1983.] See Savage et al., 1984.) The outer eyewall diameter of Hugo
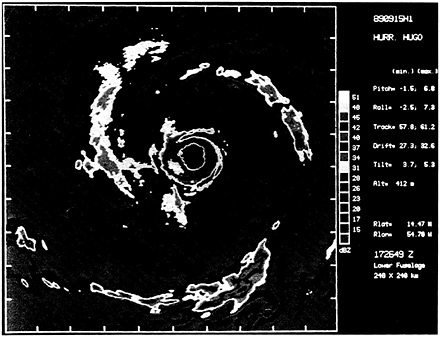
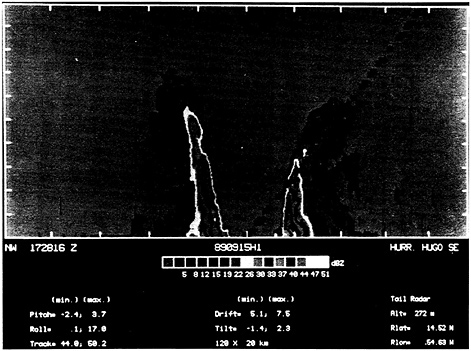
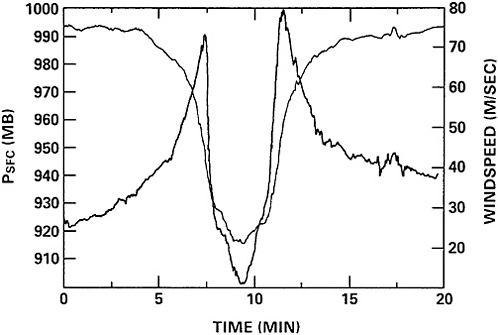
FIGURE 1-7 The aircraft-measured radial plots of 30 sec average tangential winds and surface pressure. Courtesy of NOAA/HRD.
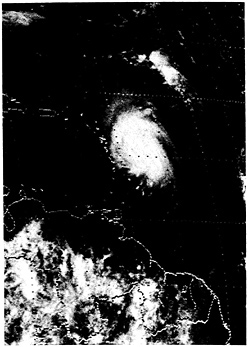
FIGURE 1-8 A remarkable striated structure in the cirrus outflow clouds emanating from the hurricane's northern portion in this visible satellite photograph. Courtesy of NOAA/NESDIS.
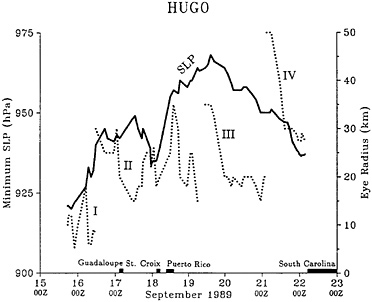
FIGURE 1-9 A time-series plot of aircraft-measured surface central pressures and eye diameters estimated from aircraft radar. Courtesy of NOAA/HRD.
measured about 30 km across; the inner eyewall was approximately 18 km across. An unusual feature of the hurricane as it passed through the Lesser Antilles and the Virgin Islands from midday on September 16 through the morning of September 19, when it was northwest of Puerto Rico, was the large fluctuations of the eye's diameter (from 30 to 70 km across; see Figure 1-9). A time history of eye surface pressures and peak sustained winds at 10,000 ft measured by NOAA and USAF reconnaissance aircraft from September 11-19, 1989, is given in Figure 1-10. In general, there is a lag in the customary wind-pressure relationship.
IMPACTS ON THE ISLANDS
During the late hours of September 16, the eye of Hurricane Hugo passed over the island of Guadeloupe (see Figure 1-1) near 16.4°N, 61.8°W. The capital city, Pointe-a-Pitre, reported a final weather observation of heavy showers and thunderstorms with north-northwest winds of 29 knots (33 mph), gusting to 84 knots (97 mph). At the same time, the island of St. Maarten reported northeast winds of 13 to 15 knots (15 to 7 mph), and St. Kitts reported north winds of 21 knots (24 mph) gusting to 33 knots (38 mph). Reports after Hugo's passage over Guadeloupe revealed that about half of the capital was destroyed, including the airport, and that there were 11 fatalities (Table 1-2). Hugo continued moving west-northwestward into the Caribbean Sea as a category 4 hurricane with sustained winds of 122 knots (140 mph) (as measured by reconnaissance aircraft). Besides Guadeloupe, the smaller
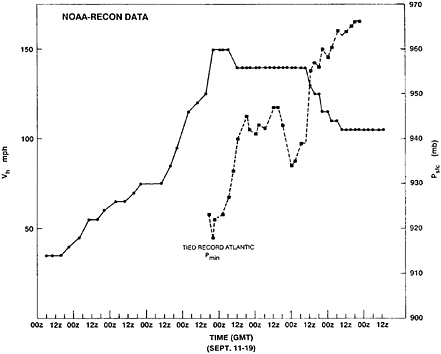
FIGURE 1-10 A time-history of eye surface pressures and peak sustained winds at 10,000 ft measured by NOAA and U.S. Air Force reconnaissance aircraft from September 11-19, 1989.
island of Montserrat to the northwest suffered severe damage and 10 people were killed.
The storm slowed its forward motion to 8 knots (9 mph) during the day of September 17 and deepened about 15 mb (flight-level maximum winds from reconnaissance aircraft fluctuated from 95 to 145 knots [109 to 167 mph] during the same period). By the evening of September 17, both satellite and aircraft eye fixes indicated that Hugo was turning more toward the northwest, thus increasing the threat to the British Virgin Islands and the U.S. Virgin Islands, specifically St. Croix and St. Thomas, as well as to the northeast coast of Puerto Rico. A base map of key
TABLE 1-2 Estimated Number of Deaths Associated with Hugo.
|
South Carolina |
13 |
Antigua and Barbuda |
1 |
|
North Carolina |
1 |
Guadeloupe |
11 |
|
Virginia |
6 |
Montserrat |
10 |
|
New York |
1 |
St. Kitts and Nevis |
1 |
|
Puerto Rico |
2 |
U.S. Virgin Islands |
3 |
|
TOTAL |
49 |
islands and city locations cited in the text is given in Figure 1-11a and Figure 1-11b. A GOES satellite view of Hugo on the afternoon of September 17 is given in Figure 1-12.
St. Croix clearly experienced an unusually prolonged battering of hurricane force and much greater winds from late evening on September 17 into the morning of September 18. It was noted in the 2100 Atlantic Standard Time (AST) advisory from the NHC that St. Croix reported sustained winds of 74 knots (85 mph) and gusts to 84 knots (97 mph), with St. Thomas reporting gusts to 78 knots (90 mph) during the preceding hour. Both islands further reported wind gusts of 88 knots (100 mph) during the following hour. However, Federal Aviation Administration (FAA) facilities were shut down at this time and it was not possible to confirm these reported speeds during the poststorm investigation. Figure 1-13 shows a mesoscale analysis of Hugo's track through the U.S. Virgin Islands and eastern Puerto Rico, derived from San Juan's NWS radar film and NHC's official fixes. Note that by early afternoon on September 17, in response to subtle, poorly observed, large-scale changes in Hugo's environment (noted above), the storm took a more northwesterly course at 10 knots (12 mph). The impact of the hurricane 's environment on its present and future motion and density of observations on that scale were considered by Chan et al. (1980) and Peak et al. (1986). The eye slowed and executed a trochoidal loop near Frederiksted, St. Croix, at approximately 0200 AST on September 18 (Figure 1-13) before slowly curving west-northwestward.
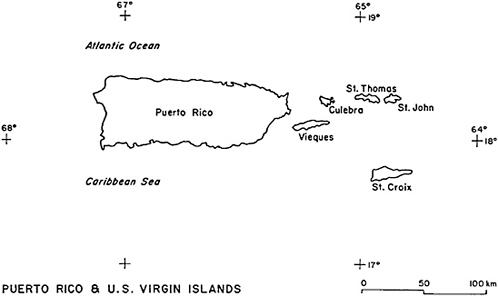
FIGURE 1-11a Base map of key islands.
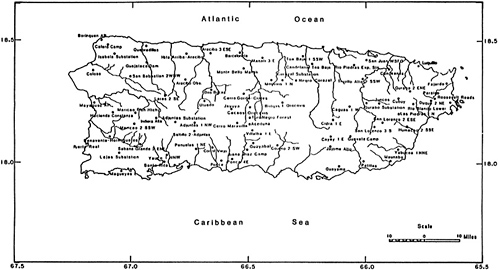
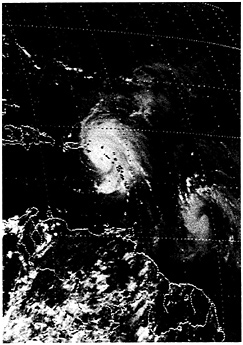
FIGURE 1-12 A GOES satellite view of Hugo on the afternoon of September 17, 1989. Courtesy of NOAA/NESDIS.
The eye also underwent some dramatic structural changes as it approached St. Croix. These are documented in Figure 1-14a, Figure 1-14b, Figure 1-14c, Figure 1-14d, Figure 1-14e, Figure 1-14f, Figure 1-14g and Figure 1-14h, a sequence of photographs from the NWS 10-cm radar at San Juan. Note the contractions and expansions of the eye and the position of the northern eyewall over St. Croix for several hours on the morning of September 18.
Strong winds resumed over St. Croix after eye passage around 0400 AST on September 18. A composite analysis derived from airborne 5-cm radar data and flight-level (700 mb) winds on the NOAA P-3 aircraft, as Hugo was approaching St. Croix on the afternoon of September 17, is shown in Figure 1-15. Note the well-defined circular wall cloud with the stronger reflectivities in the northwest and northeast quadrants, and a swath of 135 knots (155 mph) maximum wind speed around the northeast and east quadrants in Figure 1-15. All surface observations from St. Croix and St. Thomas airports ceased before midafternoon on September 18, in order to secure FAA facilities before the arrival of damaging winds.
After pummeling the U.S. Virgin Islands for several hours Hurricane Hugo slowly looped into Vieques Sound between the islands of Culebra and Vieques during the predawn hours of September 18 (Figure 1-11, Figure 1-12 and Figure 1-13). Note especially the two well-defined trochoidal loops in Hugo's track on Figure 1-13. Similar hurricane track motions were documented for Hurricane Alicia of 1983 prior to its
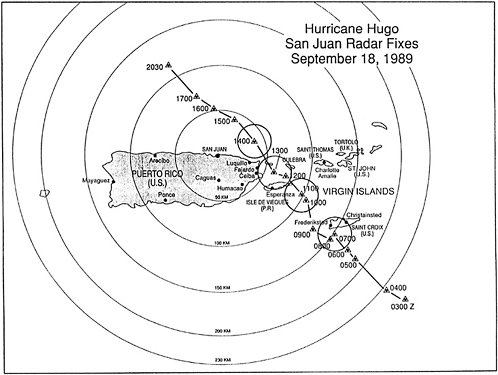
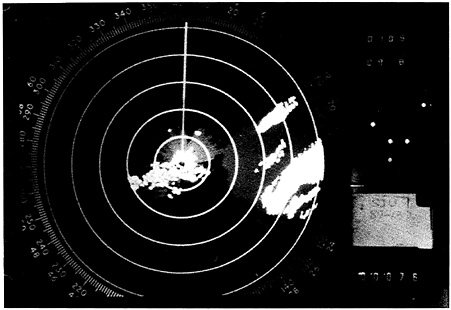
FIGURE 1-14a First in a sequence of photographs from the NWS 10-cm radar at San Juan, 2109 AST September 17. Note the contractions and expansions of the eye and the position of the northern eyewall over St. Croix for several hours on September 17-18. All images were recorded approximately 150 km from the San Juan radar. Photographs courtesy of NOAA/NESDIS.
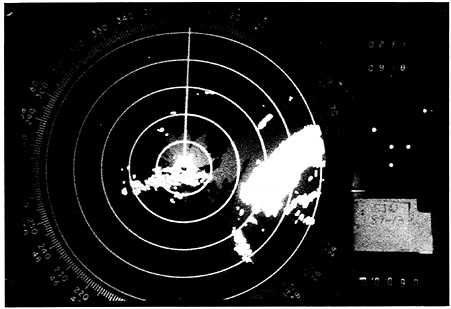
FIGURE 1-14b Second photograph in the sequence, 2233 AST September 17.

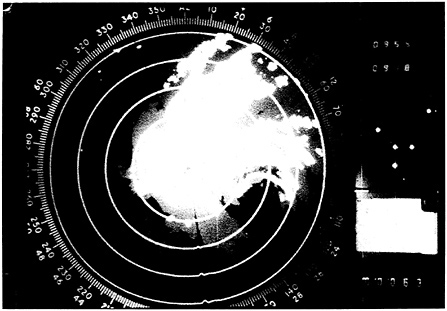
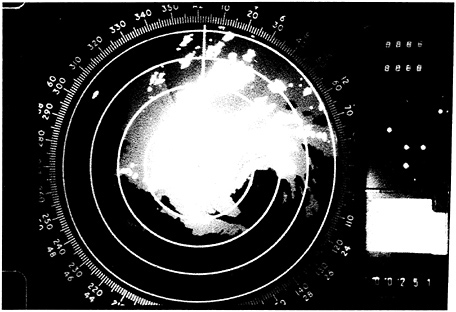
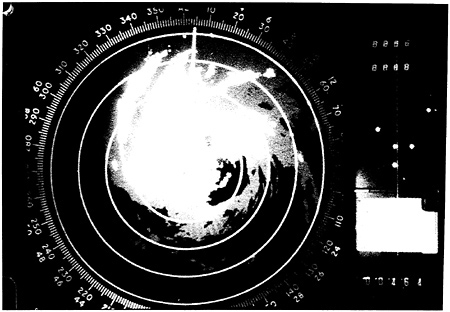
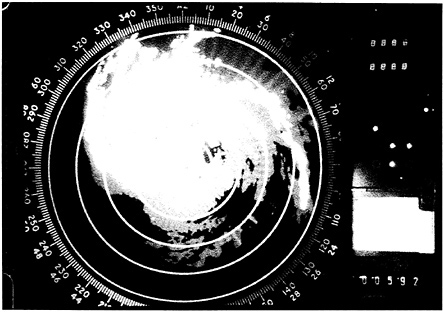
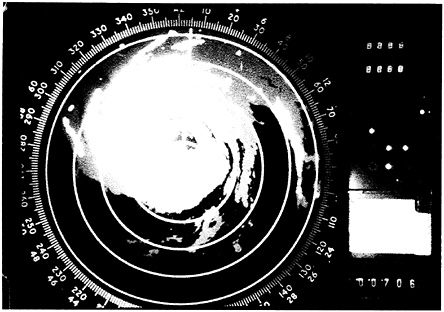
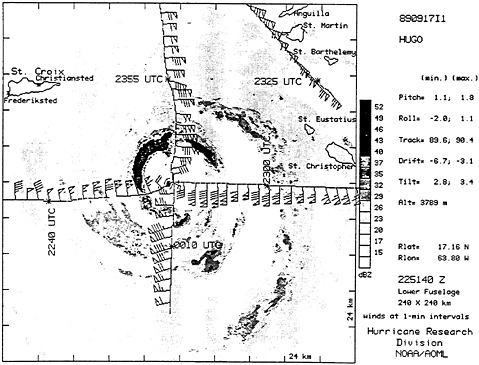
FIGURE 1-15 A composite analysis derived from airborne 5-cm radar data and flight-level (700 mb) winds on the NOAA P-3 aircraft, as Hugo was approaching St. Croix on September 17. Courtesy of NOAA.
destructive landfall on Galveston Island, Texas, (Savage et al., 1984) and for Hurricane Carla of 1961.
After crossing the extreme eastern portion of Vieques at approximately 0730 AST on September 18 Hugo's eye moved slowly west and north over the northeastern portion of Puerto Rico between 0800 and 0900 AST. Satellite data and San Juan radar (Figure 1-14) indicate that the west wall of the eye moved over land near the towns of Ceiba (Roosevelt Roads Naval Air Station), Fajardo, and Luquillo (Figure 1-10, Figure 1-11 and Figure 1-12), while the east side of the eye remained over water. It was during the last few hours of Hugo's approach to Puerto Rico that Culebra probably experienced the worst wind effects, with the southeasterly flow (associated with the most dangerous northeast quadrant) channeled through the hills on both sides of the Ensenada Honda Harbor (Figure 1-16). Hugo's ill-defined eye moved north-northwest after hitting the northeast coast of Puerto Rico (Figure 1-13), and by noon on September 19 was over open water north of San Juan with maximum sustained winds of 109 knots (125 mph) and minimum sea-level central pressure (MSLP) of 957 mb. The storm's radar structure, as documented by the 5-cm belly radar from the NOAA WP3D aircraft, is shown in Figure 1-17a and Figure 1-17b. Note that the southeastern half of the storm is nearly devoid of rainbands. Compare this radar structure with rainfall maps given in Chapter 2.
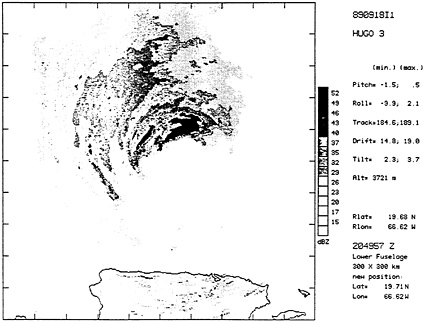
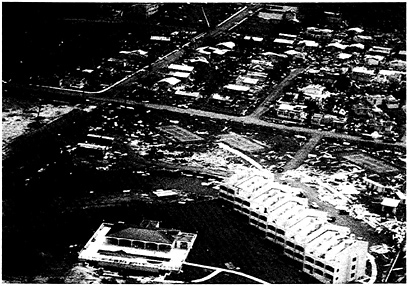
FIGURE 1-16 The most dangerous northeast quadrant of Hugo's eyewall. Courtesy of NOAA/NESDIS.
UNIQUE DATA
A storm chaser was able to position himself in a multistory condominium in Luquillo and produced a remarkable videotape of the approach and passage of Hugo's eye directly over head. The videotape documents damaging wind and rain effects on nearby structures during major rainband and eyewall passages in Hugo, as well as the chaotic state of the adjacent sea surface. He used a digital barometer to measure a lowest pressure (956 mb). San Juan, which remained outside the eye, recorded a minimum pressure of 970.3 mb. The radar sequence in Figure 1-14 supports the pressure data indications that Hugo was filling as it crossed the northeast coast of Puerto Rico. However, it must be emphasized that the western eyewall passed just to the east of metropolitan San Juan, probably affecting Loiza and Pinones (Figure 1-11, Figure 1-12 and Figure 1-13); moreover, this geometry is entirely consistent with the large gradations of damage and surge effects (especially overwash) documented by the team from Catano eastward.
SURFACE-WIND-SPEED OBSERVATIONS
The team found that a poor set of recorded meteorological surface data, especially for wind speed and direction, existed for the area over Puerto Rico and
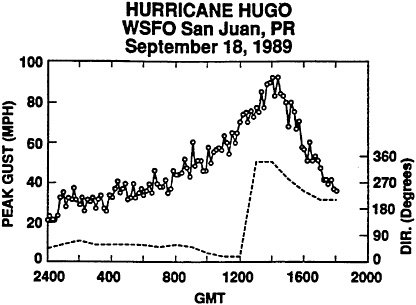
FIGURE 1-17a Time-plot of measured peak gust windspeeds during Hurricane Hugo's strongest period at NWS San Juan, Puerto Rico. Courtesy of R. D. Marshall.
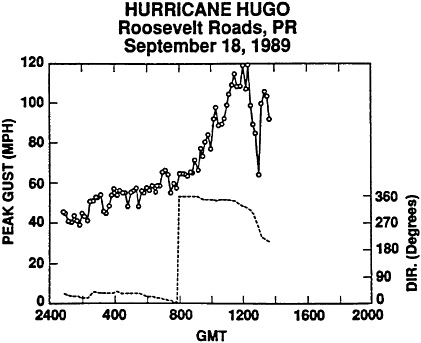
FIGURE 1-17b Time-plot of measured peak gust windspeeds during Hurricane Hugo's strongest period at Roosevelt Roads NAS, Puerto Rico. Courtesy of R. D. Marshall.
the U.S. Virgin Islands in Hugo's path. As noted in other recent National Research Council hurricane study team reports (e.g., Savage et al., 1984, Hurricane Alicia), many anemometers were in place, but most were either damaged or destroyed by Hugo's winds, or lacked either recording equipment or backup power or both. Only two Standard Stripchart records of wind speed were immediately available, one from the WSFO at San Juan Munoz Airport and the other from Roosevelt Roads Naval Air Station. Both sites are on Puerto Rico (Figure 1-11). A time history of peak wind gusts for these sites is shown in Figure 1-17a and Figure 1-17b, respectively. Recall that San Juan Airport probably experienced the fringes of Hugo's western eyewall between 1300 and 1400 GMT, while Roosevelt Roads Naval Air Station experienced the eye itself about 1-1/2 to 2 hours earlier.
The WSFO at San Juan recorded peak gusts of 80 knots (92 mph) between 1350 and 1415 GMT, and the maximum sustained wind speed was 67 knots (77 mph). Adjustment for the 6.1-m height of the F420 C anemometer would increase the plotted wind speed in Figure 1-17a by about 7 percent. Similarly, the anemometer site at Roosevelt Roads Naval Station is well exposed, and height of the propeller/vane anemometer is 7 m. The time history of recorded peak gusts, unadjusted for anemometer height in Figure 1-17b, shows that peak gusts of 104 knots (120 mph) occurred between 1150 and 1220 GMT. This site experienced a brief passage of the hurricane 's eye at 1250 GMT (dip in wind speeds). Maximum sustained wind speeds were about 85 knots (98 mph). An unofficial estimate of winds gusting to 150 knots (173 mph) in the harbor at Culebra was made by a mariner who rode out the storm on his sailboat and videotaped his anemometer.
Another unique data set has recently come to light. A small network of six anemometers installed by the FAA at San Juan Airport survived Hugo's passage. The Low-Level Wind Shear Alert System (LLWAS) has been installed at a number of airports across the United States and its territories to warn pilots of dangerous wind shears and downbursts. Preliminary records of wind data were recorded during most of Hugo from four of six LLWAS sensors on San Juan Airport. One of the sensors measured a peak gust of 43 knots (49 mph). These data, combined with a more complete record from NWS San Juan Airport, should provide a unique microscale (few km domain) analysis of surface-wind distribution near the western eyewall passage of Hurricane Hugo during its temporary filling stage.
FORECAST PERFORMANCE
The team confirmed the overall accuracy and timeliness of most of the official bulletins and advisories issued by NHC and Hurricane Local Statements by NWS San Juan during Hurricane Hugo's approach and passage through the eastern Caribbean. This is especially true considering the paucity of hourly surface and twice-daily upper-air reporting stations in the area—there are fewer regularly reporting upper sites on the eastern Caribbean islands today than there were 20 years ago. The warning lead times for the various islands are shown in Figure 1-18, and clearly indicate that most
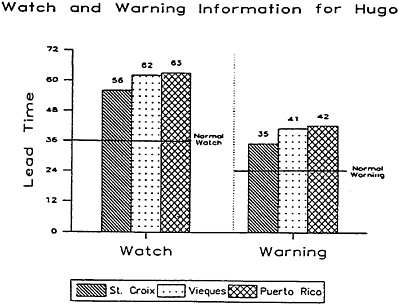
FIGURE 1-18 Histogram of warning-lead times from official NWS advisories for Hurricane Hugo in Puerto Rico and the U.S. Virgin Islands. Courtesy of D. Wernly, NWS/OM.
sites had at least 1 to 2 days' warning of Hugo's approach. These lead times were significantly better than is often possible for a hurricane approaching landfall along the U.S. mainland coast.
The hurricane forecasters at NOAA's NHC in Miami produced an official forecast track, updated at 6-hour intervals, throughout the hurricane's life cycle. Figure 1-19 shows the final smoothed verifying track for Hurricane Hugo (derived from all NOAA and USAF reconnaissance aircraft fixes and satellite eye positions—bold line) and the official forecasted tracks. The official forecast track is produced by the hurricane forecaster after he or she subjectively assesses the outputs from a dozen or so numerical models and guidance products. Ward (1990) has assessed the performance of the models on Hugo by the NHC. Table 1-3 shows the mean errors for six of the models routinely used by NHC. With only a few exceptions, the recently revised statistical/dynamical model (NHC83) developed by Neumann and his colleagues at NHC consistently outperformed all other models, even the more sophisticated dynamical ones, such as SANBAR (barotropic), BAM (beta-advection model), and the QLM (quasi-Lagrangian model). The left bias in most of the model predictions is well documented, as shown in Figure 1-20. This shows the vector corrections that must be applied to the NHC83 forecast tracks. The interested reader is referred to Ward's (1990) article for more details on the models. This outcome may have more to do with the state of the observational database in the Caribbean and techniques used to initialize the models than with any inherent scientific deficiencies in the models themselves.
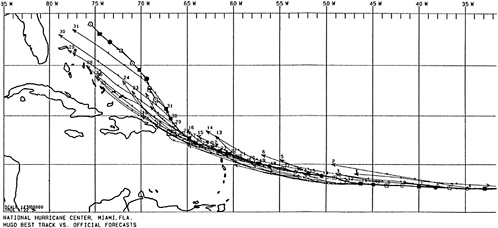
TABLE 1-3 Hurricane Hugo Track Errors (in nautical miles)
|
HRS |
12 HRS |
24 HRS |
36 HRS |
48 HRS |
|
Official (NHC) 154 |
33 |
65 |
98 |
122 |
|
(No. of Cases) (33) |
(43) |
(41) |
(39) |
(37) |
|
CLIPER 216 |
37 |
73 |
119 |
161 |
|
33 |
(41) |
(39) |
(37) |
(33) |
|
QLM 268 |
81 |
90 |
119 |
172 |
|
14 |
(19) |
(18) |
(17) |
(16) |
|
SANBAR 302 |
28 |
55 |
92 |
141 |
|
11 |
(15) |
(15) |
(14) |
(13) |
|
NHC83 178 |
38 |
61 |
88 |
106 |
Note that as Hugo approached the Leeward Islands and entered the eastern Caribbean, there was a persistent left bias in the official NHC forecasts for the hurricane's future track in that region. This led to initial forecasts for Hugo's landfall on the south coast of Puerto Rico, which were not corrected until the night of September 17. Nevertheless, both the MIC at the San Juan WSFO and the forecasters at NHC were aware of this bias, so that the inhabitants of the U.S. Virgin Islands had sufficient time to make all necessary preparations. Most importantly, there was an early decision, based on updated NHC advisories with rising hurricane strike probabilities, to evacuate the populace of San Juan and send them to shelters. It must be emphasized that current hurricane track forecasting models and techniques available to NHC cannot forecast mesoscale changes or oscillations in hurricane tracks as depicted for Hugo in Figure 1-11. Moreover, there are currently no forecast models for predicting the intensity changes for Hugo implied by the eye-pressure changes shown in Figure 1-7, Figure 1-8, Figure 1-9 and
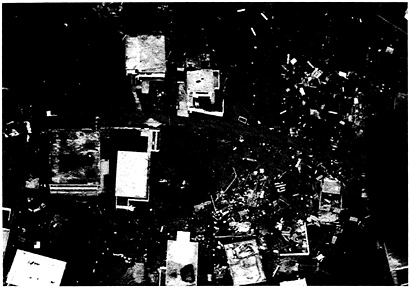
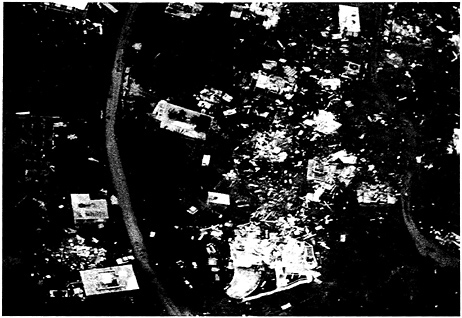
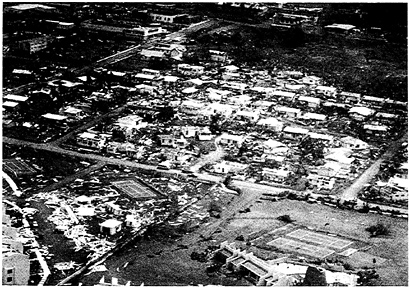
In its aerial damage survey over the U.S. Virgin Islands, the team found several locations where the debris patterns strongly suggested the production of destructive microbursts (Fujita, 1985). The photographs in Figure 1-21a, Figure 1-21b, Figure 1-21c and Figure 1-21d, taken by the low-flying aircraft over St. Croix and Vieques, show extremely localized destruction,
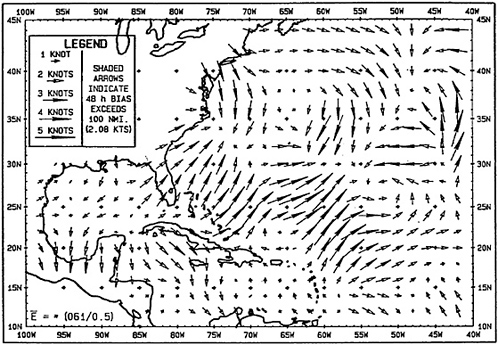
FIGURE 1-20 Correction vectors applied to NHC 48-hour forecasts over southwestern Atlantic and Caribbean Sea from 1970 to 1988 in order to achieve zero forecast bias.
which would confirm the occurrence of microbursts. The most distinctive features of microbursts are the narrow confines and divergent nature of the debris trails from destroyed structures. Fujita (1978) found that much of the severe damage to structures in Corpus Christi, Texas, from Hurricane Celia of 1971 was due, surprisingly, to the formation of intense microbursts in the western eyewall and a few major rainbands as the storm made landfall. The team found no evidence of any tornadoes from either the aerial or the ground damage surveys it performed on Puerto Rico and the U.S. Virgin Islands. In any case, it is likely that the general wind damage caused by the hurricane itself and those more concentrated areas damaged by microbursts would tend to obscure any separate tornado damage tracks.
REFERENCES
Baynton, H. W. 1978. Radar design for determining the strength of tropical cyclones in the Bay of Bengal, 1976. Monthly Weather Review 105(11): 1458-1461.
Black, P. G., R. L. Elsberry, L. K. Shay, R. P. Partridge, and J. D. Hawkins. 1988. Atmospheric boundary layer and oceanic mixed-layer observations in Hurricane Josephine obtained from air-deployed drifting buoys and research aircraft. Journal of Atmospheric and Oceanic Technology 5(6): 683-695.
Carbone, R. E., and F. D. Marks, Jr. 1989. Velocity track display (VTD): A real-time application for airborne Doppler radar data in hurricanes. Pp. 11-12 in 18th Conference on Hurricanes and Tropical Meteorology Held in San Diego, California, May 16-19, 1989. Boston, Massachusetts: American Meteorological Society.
Case, R. 1990. Hurricane-strong storms out of Africa. Weatherwise 43(1): 23-29.
Chan, J. C. L., W. M. Gray, and S. Q. Kidder. 1980. Forecasting tropical cyclone turning motion from surrounding wind and temperature fields. Monthly Weather Review 108: 778-792.
Dodge, P. P., J. S. Griffin, F. D. Marks, Jr., and R. W. Burpee. 1990. Interactive analysis of NOAA P-3 aircraft data support of operational hurricane forecasting. Pp. 245-247 in Preprints, Sixth International American Meteorological Society Conference on Interactive Informational and Procedural Systems for Meteorology, Oceanography, and Hydrology, Boston, Massachusetts. Boston, Massachusetts: American Meteorological Society.
Fassig. 1928. San Felipe—The hurricane of September 13, 1928, at San Juan, P.R. Monthly Weather Review 56(9): 350-352.
Fujita, T. T. 1978. Manual of Downburst Identification for Project NIMROD. SMRP Research Paper 156. Department of Geophysical Sciences, University of Chicago. Chicago, Illinois: University of Chicago Press.
Fujita, T. T. 1985. The Downburst, Microburst, and Macroburst. The University of Chicago. Chicago, Illinois: University of Chicago Press.
Goodman, R. R. 1989. An Historical Look at Tropical Cyclone Paths in Relation to Puerto Rico and the Virgin Islands. Technical Note, National Weather Service Southern Region Headquarters, Ft. Worth, Texas.
Hebert, P. J., and G. Taylor. 1988. The Deadliest, Costliest, Most Intense U.S. Hurricanes of this Century (and Other Frequently Requested Hurricane Facts). National Oceanic & Atmospheric Administration Technical Memorandum, NWS NHC 18. Miami, Florida: National Hurricane Center.
Hebert, P. J., and G. Taylor, and R. A. Case. 1984. Hurricane Experience Levels of Coastal County Populations—Texas to Maine. National Oceanic & Atmospheric Administration Technical Memorandum, NWS NHC 24. Miami, Florida: National Hurricane Center.
Jarvinen, B. R., and M. B. Lawrence. 1985. An evaluation of the SLOSH storm-surge model. Bulletin of the American Meteorological Society 66(11): 1408-1411.
Lawrence, M. B., and B. M. Mayfield. 1977. Satellite observations of trochoidal motion during Hurricane Belle, 1976. Monthly Weather Review 105(11): 1458-1461.
Marks, F. D., Jr., and R. A. Houze, Jr. 1984. Airborne Doppler radar observations in Hurricane Debby. Bulletin of the American Meteorological Society 65(6): 569-582.
Marshall, R. D. 1990. Performance of structures in Hurricane Hugo. Pp. 434-444 in Proceedings, 22nd Joint Meeting, U.S. Japan Cooperative Program on Natural Resources, Panel on Wind and Seismic Effects, May 15-18, 1990, Gaithersburg, Maryland. Gaithersburg, Maryland: National Institute of Standards and Technology.
Peak, J. E., W. E. Wilson, R. L. Elsberry, and J. C.-L. Chan. 1986. Forecasting tropical cyclone motion using empirical orthogonal function representations of the environmental wind fields. Monthly Weather Review 114: 2466-2477.
Powell, M. D. 1980. Evaluations of diagnostic marine boundary-layer models applied to hurricanes. Monthly Weather Review 108: 757-765.
Powell, M. D. and P. G. Black. 1990. The relationship of hurricane reconnaissance flight-level wind measurements to winds measured by NOAA's oceanic platforms. Journal of Wind Engineering and Industrial Aerodynamics 36: 381-392.
Ward, J. H. 1990. A review of NMC numerical forecast guidance for Hurricane Hugo. Weather and Forecasting, American Meteorological Society 5: 416-432.


