
4
SBIR Awards
This chapter provides a summary analysis of application and award patterns for the National Aeronautics and Space Administration (NASA) Small Business Innovation Research (SBIR) program for fiscal years (FY) 2005-2014. It addresses Phase I and Phase II awards and breaks out patterns by state and by company. The chapter annex provides a more detailed presentation of the data in tables and figures, several of which are included in the chapter body.
The analyses in this chapter are based on data provided to the committee by NASA. These data are not always complete, and their quality is sometimes uneven.
SBIR PHASE I
Applications and Awards
Overall, the number of NASA SBIR Phase I applications declined during the study period. There were more than 1,900 Phase I applications in 2005 but only 942 in 2014. Although the numbers of applications declined at all agencies, this was a relatively large decline and could signal that the program is becoming less attractive to promising companies. However, as was noted in Chapter 2 (Program Management), in FY2007-2008, NASA imposed a limit of 10 applications per company per solicitation, and the number of applications promptly declined by about 20 percent.1
Despite this decline, the number of awards remained at approximately 300 per year. The higher rate of application acceptance need not imply deterioration in the quality of awards, because limiting the number of applications per company is expected to result in an improvement on average in
__________________
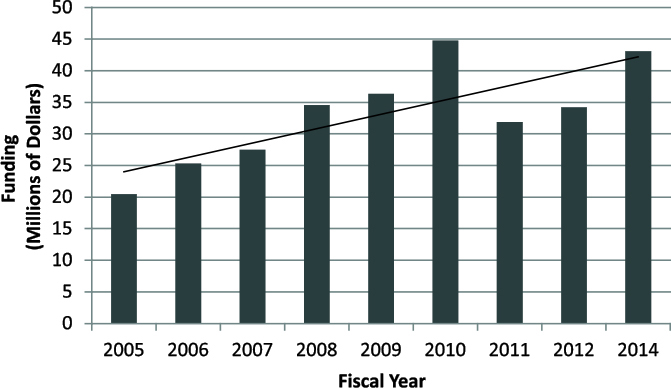
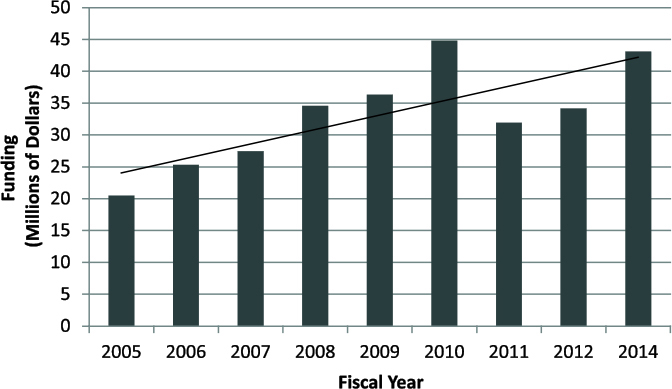
the quality of applications submitted as companies choose their better proposals to submit. FY 2014 saw a slight increase in the number of awards, perhaps reflecting growth in the mandated size of the program after reauthorization. Funding for Phase I awards expanded at NASA during the study period (see Figure 4-1), implying that the average size of Phase I awards increased.
Applications and Awards by State
Consistent with other SBIR agencies—and indeed with science and technology funding in general—NASA SBIR applications and awards are clustered geographically, generally correlated with population size. Not surprisingly, states with more scientist and engineers and more companies apply more often—and receive more awards. However, after normalizing by population size, a large spread remained between the most and least successful states, in terms of the number of Phase I awards per 1 million people. As shown in Table 4-2, seven states (Massachusetts, Colorado, New Hampshire, New Mexico, Virginia, Montana, and Maryland) generated 35 or more awards per 1 million people during FY2005-2014, while 33 states generated fewer than 10 awards per 1 million people during the same time period. Of these, Arkansas, Nebraska, North Dakota, and the District of Columbia generated none. Unadjusted for population, California had by far the greatest number of applications and awards. As discussed below, this is consistent with the concept of regional clusters of innovation generating relatively large rates of applications and awards to national competitions such as SBIR provides.
SOURCE: NASA awards and applications database.
As has been noted by the Government Accountability Office (GAO), the distribution of science-related awards tends to follow the distribution of scientists and engineers in the workforce, with geographical clusters of science and engineering talent generating proportionately more awards.2 The geographical distribution of applications and awards is also affected by the awareness of the program. Small businesses in some states are less aware of the SBIR program and, for this reason, apply less often. By like token, small businesses located in states with NASA Field Centers (or in regions surrounding NASA Field Centers) are more aware of the NASA SBIR opportunity and more likely to apply. This difference in awareness raises a question of whether NASA is receiving a full complement of innovative proposals.
Recent efforts led by the Small Business Administration to sponsor a traveling road show on the SBIR program across a number of under-served states is a public policy response that may help businesses across the nation become more aware of the SBIR opportunities. To the extent that lack of awareness is the reason for a low participation rate, this effort may boost participation rates.
Awards by Company
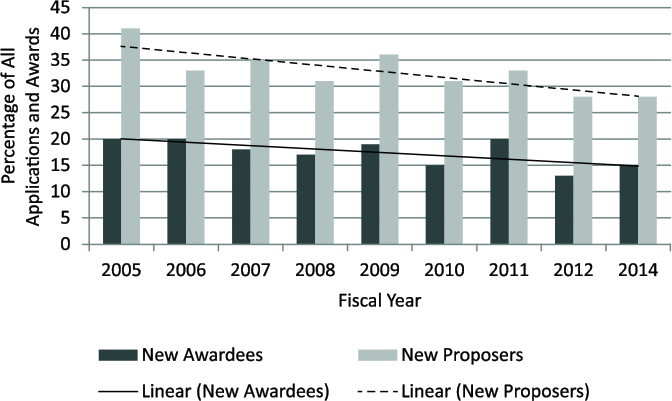
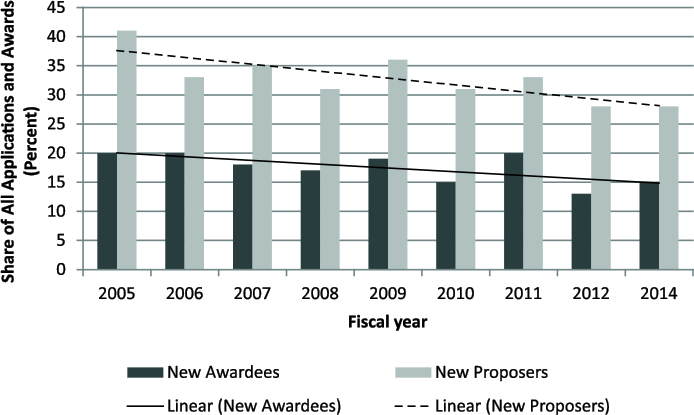
Previous reports by the Academies3 have examined claims that awards cluster within a few companies, effectively giving rise to “SBIR mills.”4Analysis of NASA SBIR Phase I awards reveals that the awards were not highly concentrated within companies. Table 4-4 lists the top 20 NASA SBIR Phase I awardees and the number of awards received by those companies during FY2005-2014. The most prolific winner (Creare) received 42 SBIR and STTR Phase I awards during FY2004-2014, or about 4 per year, which was well under the limits set by NASA.5 Combined, the top 20 awardees accounted for about 18.4 percent of Phase I awards. Conversely, firms new to the program received about 15 percent of Phase I awards in FY2014, although they submitted
__________________
2 Government Accountability Office, Federal Research: Evaluation of Small Business Innovation Research Can Be Strengthened, GAO/RCED-99-114, Washington, DC: Government Accountability Office, June 1999, p. 17.
3 Effective July 1, 2015, the institution is called the National Academies of Sciences, Engineering, and Medicine. References in this report to the National Research Council or NRC are used in an historic context identifying programs prior to July 1.
4 “SBIR mill” is a pejorative term that refers to a company that lives off SBIR awards and does not have a separate business function or true commercial objectives. It is inconsistent with the goals of the SBIR program to create and perpetuate “mills”. At the same time, it should be recognized that some companies in the technology creation and development business are positioned legitimately to apply for and receive multiple SBIR awards. In many cases, firm with multiple SBIR awards usefully meet the mission needs of NASA and operate within the spirit of the program.
5 According to the NASA 2014 program description, in addition to limiting the number of applications to 10 from any one firm, NASA also does not plan to award more than 5 SBIR contracts and 2 STTR contracts to any offerer under the solicitations described. NASA SBIR/STTR 2014 Program Solicitation, http://sbir.gsfc.nasa.gov/solicit/52896/detail?l1=52931. It is not clear whether this policy extends beyond the 2014 solicitations.
more than one-quarter of all applications. Over time, new firm shares of both applications and awards declined (see Figure 4-2).
SBIR PHASE II
The patterns of applications and awards for Phase II are largely driven by Phase I awards because until 2014 only Phase I awardees were permitted to apply for a Phase II award. This summary therefore only highlights areas where results are somewhat unexpected or deserve to be highlighted. A full analysis of Phase II is contained in the Annex at the end of this chapter. Because NASA Phase II data were not available for FY2014 as of March 2015, when the analysis was performed, and because there were no awards in FY20136, the most recent Phase II data shown are for FY2012.
During FY2005-2011, the number of Phase II awards declined somewhat on average, but finished in 2012 at about the same level as in 2005. The average may have declined further were it not for the additional funding made available through the American Recovery and Reinvestment Act of 2009
SOURCE: NASA awards and applications database.
__________________
6 Because of a change in the solicitation dates, there was no competition in FY2013, and, hence, no awards were made in FY2013.
(ARRA)7 in FY2009-2011. Total funding for Phase II SBIR awards followed a similar pattern because NASA rarely departs from stated per project award amounts.
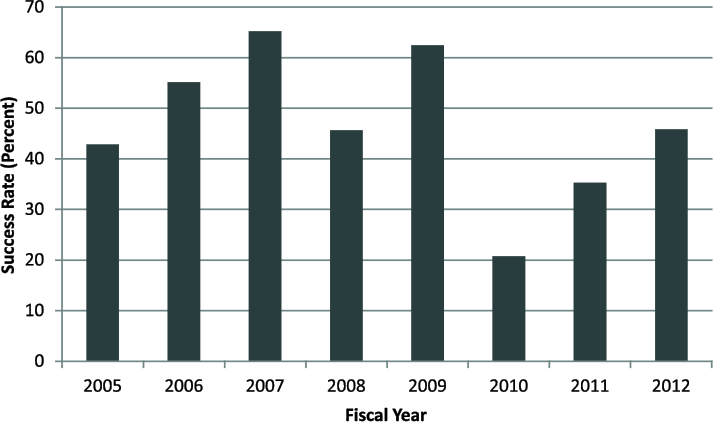
As shown in Figure 4-3, Phase II success rates (i.e., the share of Phase II applications that resulted in Phase II awards) were quite high during the early part of the period, peaking at 65 percent in 2007. The rates declined sharply to 21 percent in 2010 and recovered to near the overall average success rate of 45 percent in 2012.
As business success in the larger economy is highly variable among companies, it should be no surprise, that companies varied widely in the extent of their success in transitioning Phase I awards into Phase II awards. Among the top 20 recipients of Phase I contracts, two converted more than 90 percent of Phase I into Phase II, while the least successful company converted only 37 percent. All the top 20 recipient-companies comfortably surpassed the new 25 percent benchmark imposed by NASA in response to new requirements in the

NOTE: Phase II success rate reflects the share of Phase II applications that resulted in Phase II awards.
SOURCE: NASA awards and applications database.
__________________
7 The American Recovery and Reinvestment Act of 2009 (ARRA; P.L. 111-4) provided economic stimulus funds, a portion of which was allocated through the SBIR/STTR programs.
reauthorization legislation.8 The implication is that the 25 percent benchmark does not appear to constrain on companies from receiving multiple NASA contracts.
As a general note, some NASA SBIR/STTR companies may experience confusion between different NASA centers on value or requirement to produce a concept demonstration prototype in Phase I as compared to producing a rigorous technical study/evaluation. This confusion with small business concerns may have effect on number and quality of proposals submitted. Improved communication to potential small business submitters as to its specific preference for given topics can address this issue. A small business concern can learn which centers are prototype-focused and which are not. Better communication would allow for higher success rates for NASA and the small business concern.
ANNEX: AWARDS AND APPLICATIONS FOR THE NASA SBIR PROGRAM, FY2005-2014
This annex addresses the number and distribution of SBIR awards. It reviews Phase I and Phase II awards and discusses each in terms of the distribution of awards by component, state, and company. (Data on the participation of women and minorities is presented in Chapter 6.)
To focus attention on the most recent data, the timeframe for analysis is the 10 years from FY2005 to FY2014 inclusive. In some cases, the data series does not extend beyond FY2012. FY2005 provides the starting point of the data analysis, because pushing the data to earlier years is of only limited additional value for policy assessment purposes.
The analyses in this chapter are based on data provided to the committee by NASA. These data are not always complete, and their quality is sometimes uneven.
Phase I SBIR Awards
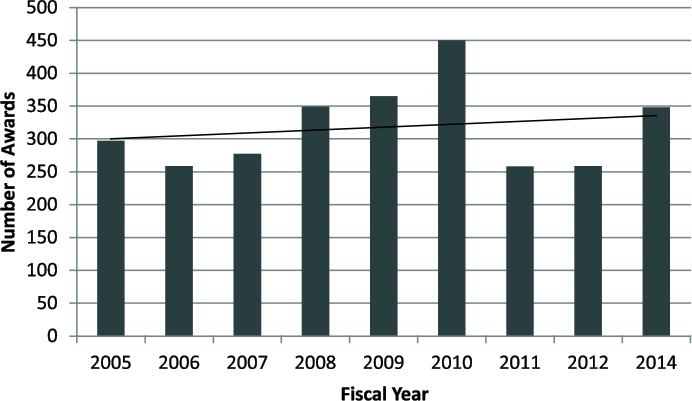
The number of SBIR Phase I awards by NASA is presented in Figure 4-4. Award numbers per year were largely stable, as shown by the trend line, but this was in part affected by the years of additional awards under ARRA, especially in FY 2010. Because of a change in the solicitation dates, there was no competition in FY2013.
__________________
8 As is explained in the section on “Company Eligibility” in Chapter 2 (Program Management), to be eligible for a Phase I award, applicants that have previously won more than 20 Phase I SBIR/STTR awards over the past 5 years must have at least a 25 percent Phase I to Phase II successful transition rate. (Based on interview with Rich Leshner, former NASA program director, January 17, 2014.)
SOURCE: NASA awards and applications database.
A declining number of Phase I applications and a flat number of awards resulted in a larger share of applications receiving a Phase I award: In FY2014, more than 35 percent of applicants received an award, compared to 15 percent in FY2005. Thirty-five percent is a very high rate, both historically and in comparison with SBIR programs at other agencies.9
Funding for NASA SBIR Phase I awards grew steadily from the base year FY2005 to peak at about $45 million in FY2010, drop back to about $30 million in FY2011, and then increase again to $43 million in FY2014. The FY2011 amount reflects ARRA funding, while the FY2014 amount reflects the increase in the size of awards and overall SBIR funding after reauthorization (see Figure 4-5).
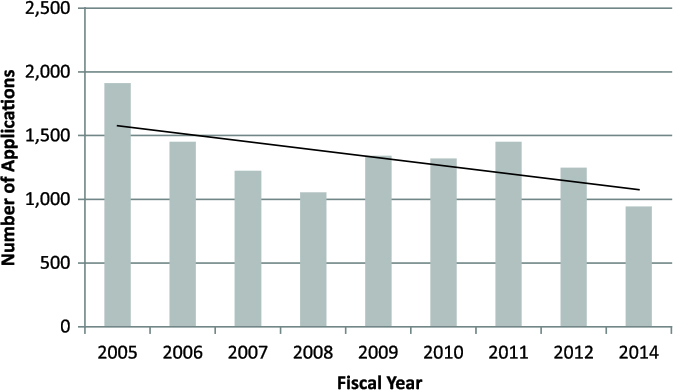
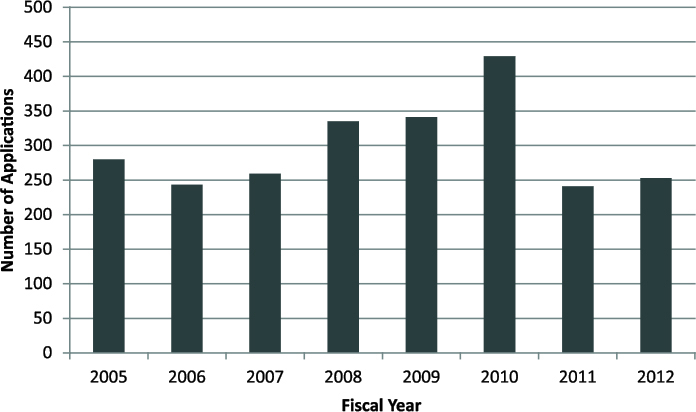
Phase I SBIR Applications and Success Rates
Data for Phase I applications at NASA are displayed in Figure 4-6. Overall, the number of applications declined from more than 1,900 in FY2005 to 942 in FY2014. Given that funding increased during that period and that small businesses experience well-known difficulties in raising funds, this trend is somewhat surprising. Application numbers remained relatively constant at about 2,000 during the FY1997-2005 period covered by the preceding study by the
__________________
9 As was noted previously, a restriction on the number of applications per company was believed to have raised the quality, contributing to the higher success rate.
SOURCE: NASA awards and applications database.
SOURCE: NASA award and applications database.
Academies.10 The declining number of applications and growing numbers of awards have driven up success rates (i.e., the share of applications that result in awards). Success rates for Phase I applications are shown in Figure 4-7. If NASA finds a decrease in quality of awarded Phase I projects, it does have internal flexibility to shift money to Phase II awards.
One likely factor contributing to the precipitous decline between 2005 and 2008 in the number of Phase I applications is the limit of 10 applications per company imposed by NASA in FY2007-2008. Other possible factors are NASA’s increasing focus on internal mission needs rather than a broader array of technologies, and possible rigid contracting practices, and long funding gaps. However, these possible explanations have not been explored in any depth and are lacking in hard evidence.
Phase I SBIR Awards by State
Several factors can affect the shares of SBIR awards by state, including the overall population of the state, the strength of its science and engineering workforce, and the number of SBIR award applications received from small businesses in a given state. For FY2005-2014, five states collectively received
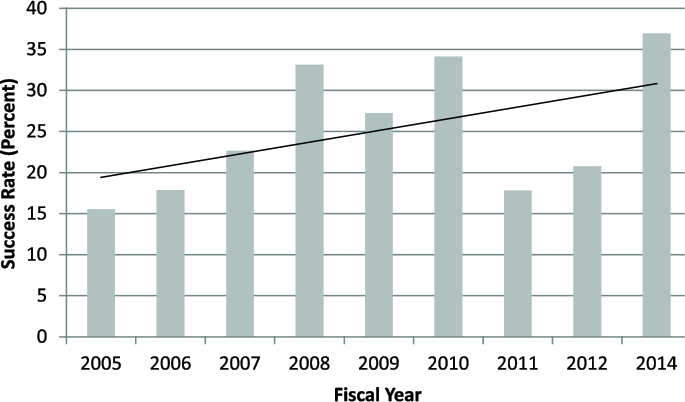
NOTE: Phase I success rate reflects the share of Phase I applications that resulted in Phase I awards.
SOURCE: NASA awards and applications database.
__________________
10 National Research Council, An Assessment of the SBIR Program at the National Aeronautics and Space Administration, p. 43.
51.1 percent of Phase I awards, a very slight increase from the time period analyzed in the previous Academies’ report.11 Conversely, three states (Alaska, Nebraska, and North Dakota) and Puerto Rico received no Phase I award during this period. Massachusetts and Virginia were the two larger states with higher shares of awards than applications, accounting in combination for 19 percent of awards and 16 percent of applications. Table 4-1 shows the distribution of NASA SBIR Phase I awards and applications by state for FY2005-2014.
Given the variation in the distribution of SBIRs across states, it is important to normalize for population and to underscore the scientific and engineering strength of some states and the weakness of others. Table 4-2 shows awards by state per 1 million people. Seven states (Massachusetts, Colorado, Virginia, Maryland, Montana, New Hampshire, and New Mexico) generated at least 35 Phase I awards per 1 million people. Thirty-three states generated fewer than 10 awards per 1 million people; of these, four generated none.
These findings suggests that population alone does not completely predict the distribution of SBIR awards. The GAO has noted that the distribution of SBIR awards tends to follow the general distribution of government science and engineering awards, which in turn tends to follow the distribution of science and engineering talent in the workforce.12 Using data from the National Science Foundation, we found that the Pearson r score for the percentage of scientists and engineers in the population and the number of NASA SBIR Phase I awards per 1 million people were highly correlated (Pearson r=0.7).13 By like token, small businesses located in states with NASA Field Centers (or in regions surrounding NASA Field Centers) are likely more aware of the NASA SBIR opportunity and more likely to apply, and this could raise a question of whether NASA is receiving as innovative proposals as it can be.
Another way to evaluate state success in attracting NASA SBIR awards is to examine success rates, which varied substantially (see Table 4-3). NASA data indicate that for FY2005-2014, for states with at least one award, success rates varied from greater than 40 percent in New Hampshire and Louisiana to less than 10 percent in six states. This variability is rooted in the complex differences in state industry focus and the locations of key firms, as well as other potential variables, including the large variability often associated with small numbers where one application and one award means a 100 percent success rate and one application and no award means a 0 percent success rate.
Phase I SBIR Awards by Company
The number of NASA SBIR Phase I awards was not highly concentrated by company. The top 20 companies accounted for 18.4 percent of
__________________
11 Ibid, p. 56.
12 Government Accountability Office, Federal Research, p. 17.
13National Science Board, Science and Engineering Indicators 2014, Arlington, VA: National Science Foundation, 2014.
NASA SBIR Phase I awards. Table 4-4 summarizes NASA SBIR and STTR Phase I awards for the top 20 awardees during the study period. The top awardee, Creare, received an average of four Phase I awards per year, a number very similar to that of other top winners, CFD Research, Aurora Flight Sciences, and Intelligent Automation.
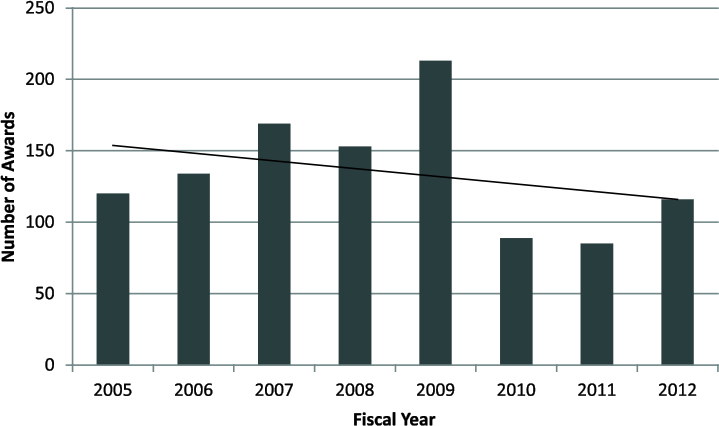
Phase II SBIR Awards
To a considerable extent, the pattern of NASA SBIR Phase II awards closely follows that for Phase I. This is not surprising because receipt of a Phase I award, until the 2011 reauthorization, has been a prerequisite for receipt of a Phase II award.
Although the overall number of Phase II awards apparently exhibits no substantial long-term trend over the study period (see Figure 4-8), if the additional funding added through ARRA in 2009-2011 is excluded, then the numbers drift down somewhat from an average of 124 awards in FY2005-2007 to 101 in FY2012-2014. The FY2012 figure rebounded from those in FY2010 and FY2011, and it is not yet known if the rebound continued in FY2014, which was the year of the next solicitation.
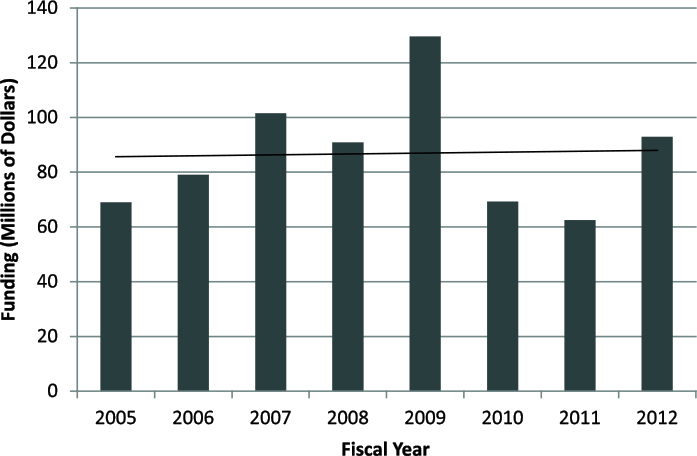
Funding for Phase II awards fluctuated considerably during the period, even excluding 2009 when ARRA funding contributed to the higher number (see Figure 4-9). NASA sticks closely to the funding limits for individual awards. During the study period, NASA made 26 SBIR non-Phase I awards greater than standard funding ($600,000 until FY2011, $700,000 until 2014, and $750,000 currently).14 Of these, 22 were made in FY2012, utilizing funds allocated through the 2010 solicitation, which may again reflect the impact of ARRA funding. In addition, in FY2014 NASA introduced a program to add funds for “Select Topics” awards (described in more detail in Chapter 3 [Initiatives]).
Phase II SBIR Applications and Success Rates
If ARRA funding years are excluded, the number of Phase II applications to NASA trended down slightly (see Figure 4-10). Although it is somewhat surprising that applications grew rapidly to meet that additional funding, these applicants were already in the program (with Phase I funding) and were likely to know that additional funding was available (this was, after all, public knowledge at the time). Phase II success rates remained at about 45 percent, except for an unexplained decline in FY2010 (see Figure 4-11).
__________________
14 Awards data show that in FY2011 16 awards were made at approximately $750,000, suggesting that new limits were implemented part way through FY2011.
TABLE 4-1 NASA SBIR Phase I Awards and Applications, FY2005-2014
| State | Number of Phase I Awards | Number of Phase I Applications | Percentage of all Phase I Awards | Percentage of all Phase I Applications |
| AK | 1 | 0.0 | 0.0 | |
| AL | 132 | 450 | 3.1 | 2.7 |
| AR | 18 | 77 | 0.4 | 0.5 |
| AZ | 119 | 492 | 2.8 | 3.0 |
| CA | 898 | 3,460 | 20.8 | 20.8 |
| CO | 282 | 1,063 | 6.5 | 6.4 |
| CT | 99 | 301 | 2.3 | 1.8 |
| DC | 1 | 12 | 0.0 | 0.1 |
| DE | 20 | 129 | 0.5 | 0.8 |
| FL | 107 | 597 | 2.5 | 3.6 |
| GA | 27 | 140 | 0.6 | 0.8 |
| HI | 2 | 30 | 0.0 | 0.2 |
| IA | 8 | 26 | 0.2 | 0.2 |
| ID | 10 | 60 | 0.2 | 0.4 |
| IL | 74 | 363 | 1.7 | 2.2 |
| IN | 29 | 102 | 0.7 | 0.6 |
| KS | 7 | 29 | 0.2 | 0.2 |
| KY | 11 | 71 | 0.3 | 0.4 |
| LA | 8 | 20 | 0.2 | 0.1 |
| MA | 483 | 1,572 | 11.2 | 9.4 |
| MD | 207 | 826 | 4.8 | 5.0 |
| ME | 8 | 39 | 0.2 | 0.2 |
| MI | 88 | 349 | 2.0 | 2.1 |
| MN | 49 | 195 | 1.1 | 1.2 |
| MO | 14 | 63 | 0.3 | 0.4 |
| MS | 8 | 47 | 0.2 | 0.3 |
| MT | 41 | 110 | 1.0 | 0.7 |
| NC | 18 | 95 | 0.4 | 0.6 |
| ND | 4 | 0.0 | 0.0 | |
| NE | 9 | 0.0 | 0.1 | |
| NH | 72 | 179 | 1.7 | 1.1 |
| NJ | 124 | 446 | 2.9 | 2.7 |
| NM | 91 | 340 | 2.1 | 2.0 |
| NV | 5 | 66 | 0.1 | 0.4 |
| NY | 134 | 518 | 3.1 | 3.1 |
| OH | 165 | 736 | 3.8 | 4.4 |
| OK | 1 | 38 | 0.0 | 0.2 |
| OR | 72 | 268 | 1.7 | 1.6 |
| PA | 135 | 607 | 3.1 | 3.6 |
| PR | 3 | 0.0 | 0.0 |
| State | Number of Phase I Awards | Number of Phase I Applications | Percentage of all Phase I Awards | Percentage of all Phase I Applications |
| RI | 9 | 36 | 0.2 | 0.2 |
| SC | 4 | 23 | 0.1 | 0.1 |
| SD | 1 | 6 | 0.0 | 0.0 |
| TN | 27 | 108 | 0.6 | 0.6 |
| TX | 188 | 813 | 4.4 | 4.9 |
| UT | 24 | 102 | 0.6 | 0.6 |
| VA | 337 | 1,052 | 7.8 | 6.3 |
| VT | 5 | 18 | 0.1 | 0.1 |
| WA | 82 | 341 | 1.9 | 2.0 |
| WI | 50 | 175 | 1.2 | 1.0 |
| WV | 8 | 32 | 0.2 | 0.2 |
| WY | 10 | 31 | 0.2 | 0.2 |
| Total | 4,312 | 16,670 | 100.0 | 100.0 |
SOURCE: NASA awards and applications database.
TABLE 4-2 NASA SBIR Phase I Awards by State, Normalized for State Population, FY2005-2014
| State | Number of Phase I Awards per 1 Million People | State | Number of Phase I Awards per 1 Million People | State | Number of Phase I Awards per 1 Million People |
| AK | 0 | MA | 73.8 | PA | 10.6 |
| AL | 27.6 | MD | 35.9 | RI | 8.6 |
| AR | 6.2 | ME | 6.0 | SC | 0.9 |
| AZ | 18.6 | MI | 8.9 | SD | 1.2 |
| CA | 24.1 | MN | 9.2 | TN | 4.3 |
| CO | 56.1 | MO | 2.3 | TX | 7.5 |
| CT | 27.7 | MS | 2.7 | UT | 8.7 |
| DC | 0.0 | MT | 41.4 | VA | 42.1 |
| DE | 22.3 | NC | 1.9 | VT | 8.0 |
| FL | 5.7 | ND | 0.0 | WA | 12.2 |
| GA | 2.8 | NE | 0.0 | WI | 8.8 |
| HI | 1.5 | NH | 54.7 | WV | 4.3 |
| IA | 2.6 | NJ | 14.1 | WY | 17.7 |
| ID | 6.4 | NM | 44.2 | ||
| IL | 5.8 | NV | 1.9 | ||
| IN | 4.5 | NY | 6.9 | ||
| KS | 2.5 | OH | 14.3 | ||
| KY | 2.5 | OK | 0.3 | ||
| LA | 1.8 | OR | 18.8 |
SOURCE: NASA awards and applications database.
TABLE 4-3 NASA SBIR Phase I Success Rates, FY2005-2014
| Firm State | Phase I Success Rate (Percent) | Firm State | Phase I Success Rate (Percent) | Firm State | Phase I Success Rate (Percent) |
| AK | 0.0 | MA | 30.7 | PA | 22.2 |
| AL | 29.3 | MD | 25.1 | PR | 0.0 |
| AR | 23.4 | ME | 20.5 | RI | 25.0 |
| AZ | 24.2 | MI | 25.2 | SC | 17.4 |
| CA | 26.0 | MN | 25.1 | SD | 16.7 |
| CO | 26.5 | MO | 22.2 | TN | 25.0 |
| CT | 32.9 | MS | 17.0 | TX | 23.1 |
| DC | 8.3 | MT | 37.3 | UT | 23.5 |
| DE | 15.5 | NC | 18.9 | VA | 32.0 |
| FL | 17.9 | ND | 0.0 | VT | 27.8 |
| GA | 19.3 | NE | 0.0 | WA | 24.0 |
| HI | 6.7 | NH | 40.2 | WI | 28.6 |
| IA | 30.8 | NJ | 27.8 | WV | 25.0 |
| ID | 16.7 | NM | 26.8 | WY | 32.3 |
| IL | 20.4 | NV | 7.6 | ||
| IN | 28.4 | NY | 25.9 | ||
| KS | 24.1 | OH | 22.4 | ||
| KY | 15.5 | OK | 2.6 | ||
| LA | 40.0 | OR | 26.9 |
NOTE: Phase I success rate reflects the share of Phase I applications that resulted in Phase I awards.
SOURCE: NASA awards and applications database.
TABLE 4-4 Top 20 NASA Phase I SBIR/STTR Award Recipients, FY2005-2014
|
Company Name |
Number of Phase I Awards |
|
Creare |
42 |
|
CFD Research |
40 |
|
Aurora Flight Sciences |
38 |
|
Intelligent Automation |
37 |
|
Honeybee Robotics |
33 |
|
NanoSonic |
28 |
|
Lynntech |
27 |
|
Orbital Technologies |
26 |
|
Physical Sciences |
25 |
|
Physical Optics |
24 |
|
Busek Company |
22 |
|
UMPQUA Research Company |
22 |
Company Name |
Number of Phase I Awards |
Los Gatos Research |
21 |
Pioneer Astronautics |
21 |
TRACLabs |
21 |
Advanced Cooling Technologies |
20 |
Luna Innovations |
20 |
Mosaic ATM |
20 |
TDA Research |
20 |
ZONA Technology |
20 |
| Total | 527 |
Percentage of all NASA SBIR and STTR Phase I awards |
18.4 |
NOTE: For the purposes of assessing company involvement, the table includes both SBIR and STTR awards.
SOURCE: NASA awards and applications database.
NOTE: Data on NASA Phase II awards for 2014 were not available as of March 16, 2015, and because of a change in the solicitation date, no awards were made in 2013.
SOURCE: NASA awards and applications database.
SOURCE: NASA awards and applications database.
SOURCE: NASA awards and applications database.
NOTE: Success rate reflects the share of Phase II applications that resulted in Phase II awards.
SOURCE: NASA awards and applications database.
Phase II SBIR Awards by State
As with Phase I awards, companies in some states had a consistently stronger record in receiving Phase II awards. Some states generated no applications, in part because a Phase I award was required for Phase II application and these states received no Phase I awards. For other states, the data reveal considerable differences in the quality of Phase II applications—overall 46 percent of Phase II applications were funded. Tennessee’s success rate was 77 percent (10 out of 13 applications) (see Table 4-5).
Phase II Awards by Company
Given that receipt of a Phase I award is a requirement for receipt of a Phase II award, it is not surprising to see many of the same company names on the list of top 25 Phase II awardees (see Table 4-6). What is quite striking, however, is the extent to which these companies’ Phase II success does not rely solely on the volume of Phase I awards that they win: for most of the top 20 awardees, the share of Phase I awards that are transitioned to Phase II (i.e., the
TABLE 4-5 NASA Phase II SBIR Applications and Awards, FY2006-2012
| State | Number of Phase II Applications | Number of Phase II Awards | Percent of all Phase II Applications | Percent of all Phase II Awards |
| AK | 0 | 0 | 0.0 | 0.0 |
| AL | 67 | 23 | 2.5 | 1.9 |
| AR | 17 | 6 | 0.6 | 0.5 |
| AZ | 77 | 41 | 2.9 | 3.4 |
| CA | 525 | 261 | 20.0 | 21.6 |
| CO | 178 | 75 | 6.8 | 6.2 |
| CT | 65 | 26 | 2.5 | 2.2 |
| DC | 0 | 0 | 0.0 | 0.0 |
| DE | 14 | 6 | 0.5 | 0.5 |
| FL | 63 | 29 | 2.4 | 2.4 |
| GA | 16 | 4 | 0.6 | 0.3 |
| HI | 1 | 0 | 0.0 | 0.0 |
| IA | 6 | 4 | 0.2 | 0.3 |
| ID | 7 | 3 | 0.3 | 0.2 |
| IL | 56 | 25 | 2.1 | 2.1 |
| IN | 17 | 8 | 0.6 | 0.7 |
| KS | 5 | 2 | 0.2 | 0.2 |
| KY | 8 | 3 | 0.3 | 0.2 |
| LA | 4 | 0 | 0.2 | 0.0 |
| MA | 281 | 135 | 10.7 | 11.2 |
| MD | 127 | 50 | 4.8 | 4.1 |
| ME | 8 | 3 | 0.3 | 0.2 |
| MI | 61 | 24 | 2.3 | 2.0 |
| MN | 33 | 10 | 1.3 | 0.8 |
| MO | 7 | 2 | 0.3 | 0.2 |
| MS | 4 | 1 | 0.2 | 0.1 |
| MT | 30 | 19 | 1.1 | 1.6 |
| NC | 11 | 5 | 0.4 | 0.4 |
| ND | 0 | 0 | 0.0 | 0.0 |
| NE | 0 | 0 | 0.0 | 0.0 |
| NH | 44 | 28 | 1.7 | 2.3 |
| NJ | 80 | 37 | 3.0 | 3.1 |
| NM | 53 | 22 | 2.0 | 1.8 |
| NV | 2 | 1 | 0.1 | 0.1 |
| NY | 89 | 41 | 3.4 | 3.4 |
| OH | 97 | 37 | 3.7 | 3.1 |
| State | Number of Phase II Applications | Number of Phase II Awards | Percent of all Phase II Applications | Percent of all Phase II Awards |
| OK | 0 | 0 | 0.0 | 0.0 |
| OR | 43 | 20 | 1.6 | 1.7 |
| PA | 85 | 48 | 3.2 | 4.0 |
| PR | 0 | 0 | 0.0 | 0.0 |
| RI | 6 | 1 | 0.2 | 0.1 |
| SC | 2 | 0 | 0.1 | 0.0 |
| SD | 1 | 0 | 0.0 | 0.0 |
| TN | 13 | 10 | 0.5 | 0.8 |
| TX | 112 | 46 | 4.3 | 3.8 |
| UT | 9 | 4 | 0.3 | 0.3 |
| VA | 214 | 105 | 8.1 | 8.7 |
| VT | 1 | 1 | 0.0 | 0.1 |
| WA | 53 | 21 | 2.0 | 1.7 |
| WI | 24 | 15 | 0.9 | 1.2 |
| WV | 6 | 3 | 0.2 | 0.2 |
| WY | 7 | 3 | 0.3 | 0.2 |
| Total | 2,629 | 1,208 | 100.0 | 100.0 |
SOURCE: NASA awards and applications database.
conversion rate15) is higher than the average success rates for all awards and reaches more than 90 percent for Paragon Space Development Corporation and Busek. CFD Research had the lowest conversion rate at 37.5 percent, but even this rate is comfortably above new benchmarks imposed as a result of reauthorization.
Overall, the top 20 winners (i.e., the companies with the most Phase II awards) accounted for 25.6 percent of all awards. Their Phase II share was higher than their Phase I share (18.4 percent) because top 20 winners generated Phase I projects that were converted to Phase II at a slightly higher than average rate.
New Participants in the NASA SBIR Program
NASA maintains data on the participation of new firms in the program, defined as firms that have not proposed or do not own awards from the NASA SBIR program. Over time, new firm shares of both applications and awards declined, which suggests substantial value in the relationships that previous winners established over time. It may also suggest that the NASA SBIR program is exhausting the supply of potential new program applicants.
__________________
15 The conversion rate is the number of Phase II awards received by a company expressed as a percentage of the number of Phase I awards received by that company.
TABLE 4-6 NASA Top 25 Phase II Companies (plus ties), FY2005-2012: Awards and Conversion Rates
| Firm Name | Number of Phase I Awards | Number of Phase II Awards | Phase I – Phase II Conversion Rate (percent) |
| Creare | 42 | 27 | 64.3 |
| Intelligent Automation | 37 | 21 | 56.8 |
| Busek Company | 22 | 20 | 90.9 |
| Orbital Technologies | 26 | 18 | 69.2 |
| Aurora Flight Sciences | 38 | 17 | 44.7 |
| Los Gatos Research | 21 | 16 | 76.2 |
| CFD Research | 40 | 15 | 37.5 |
| Honeybee Robotics | 33 | 15 | 45.5 |
| TRACLabs | 21 | 13 | 61.9 |
| ADVR | 19 | 12 | 63.2 |
| Fibertek | 18 | 12 | 66.7 |
| Lynntech | 27 | 11 | 40.7 |
| Advanced Cooling Technologies | 20 | 11 | 55.0 |
| Optimal Synthesis | 18 | 11 | 61.1 |
| Deployable Space Systems | 17 | 11 | 64.7 |
| Barron Associates | 15 | 11 | 73.3 |
| Physical Sciences | 25 | 10 | 40.0 |
| Physical Optics | 24 | 10 | 41.7 |
| Luna Innovations | 20 | 10 | 50.0 |
| ZONA Technology | 20 | 10 | 50.0 |
| Plasma Processes | 19 | 10 | 52.6 |
| Combustion Research and Flow Technology | 18 | 10 | 55.6 |
| Giner | 18 | 10 | 55.6 |
| Paragon Space Development | 11 | 10 | 90.9 |
| Total | 569 | 321 | 56.4 |
NOTE: The conversion rate is the number of Phase II awards received by a company expressed as a percentage of the number of Phase I awards received by that company.
SOURCE: NASA awards and applications database.
SOURCE: NASA awards and applications database.


