


Below is the uncorrected machine-read text of this chapter, intended to provide our own search engines and external engines with highly rich, chapter-representative searchable text of each book. Because it is UNCORRECTED material, please consider the following text as a useful but insufficient proxy for the authoritative book pages.
1 C H A P T E R 1 1.1 Problem Definition and Project Purpose The objective of this research was to explore and provide guidance on how decision makers at transportation agencies can better analyze and communicate the likely impacts of system per- formance across multiple investment types to essentially make good on performance targets. By providing an analytical data-driven performance-based framework and tool prototype for cross- asset resource allocation, this research helps answer the question, âWhat investments should be programmed to best meet agency priorities?â Transportation system performance measurement is not new; state departments of transpor- tation (DOTs) and metropolitan planning organizations (MPOs) use performance informa- tion to manage state and regional systems, to evaluate project-level investment alternatives, to assess transportation land-use issues, and for many other purposes (Maggiore, 2013). However, performance-based planning and programming, where investments and strategies are evaluated, selected, and programmed to achieve goals and performance targets across multimodal trans- portation assets, is not as common as the use of performance measures themselves. States and MPOs are only beginning to develop performance-based plans that incorporate performance management concepts for all modes, for operations, and for achieving broad economic, envi- ronmental, and community development goals. Under NCHRP Project 08-91, asset and performance management principles were fully researched and applied in an effort to establish a link between data-driven performance estimates and resource allocation decisions in support of performance-based investment strategies. The research builds upon performance management best practices by developing a methodology and accompanying tool prototype to evaluate the impact of resource allocation decisions across asset types. A user guide for the tool prototype is also provided, as well as specific implementation use cases (see Section 4.4). (The tool prototype and user guide can be downloaded from the project web page at http://apps.trb.org/cmsfeed/TRBNetProjectDisplay.asp?ProjectID=3398.) By provid- ing an implementation framework and tool prototype that can be applied to help decision mak- ers develop the best mix of performance outcomes that can be achieved under various funding levels, the common hurdles that transportation agencies may face when integrating an âun-siloedâ investment approach into decision-making practices are directly addressed. Whether comparing physical assets or operational performance, the framework was designed to be flexible and can support decision making across any investment category. With a focus on implementation, this research guide summarizes the most essential outcomes and lessons learned in researching the problem of cross-asset resource allocation. In order to arrive at the final framework, the research team conducted a comprehensive domestic and inter- national literature review focusing on the transportation and financial sectors, interviewed state Research Summary
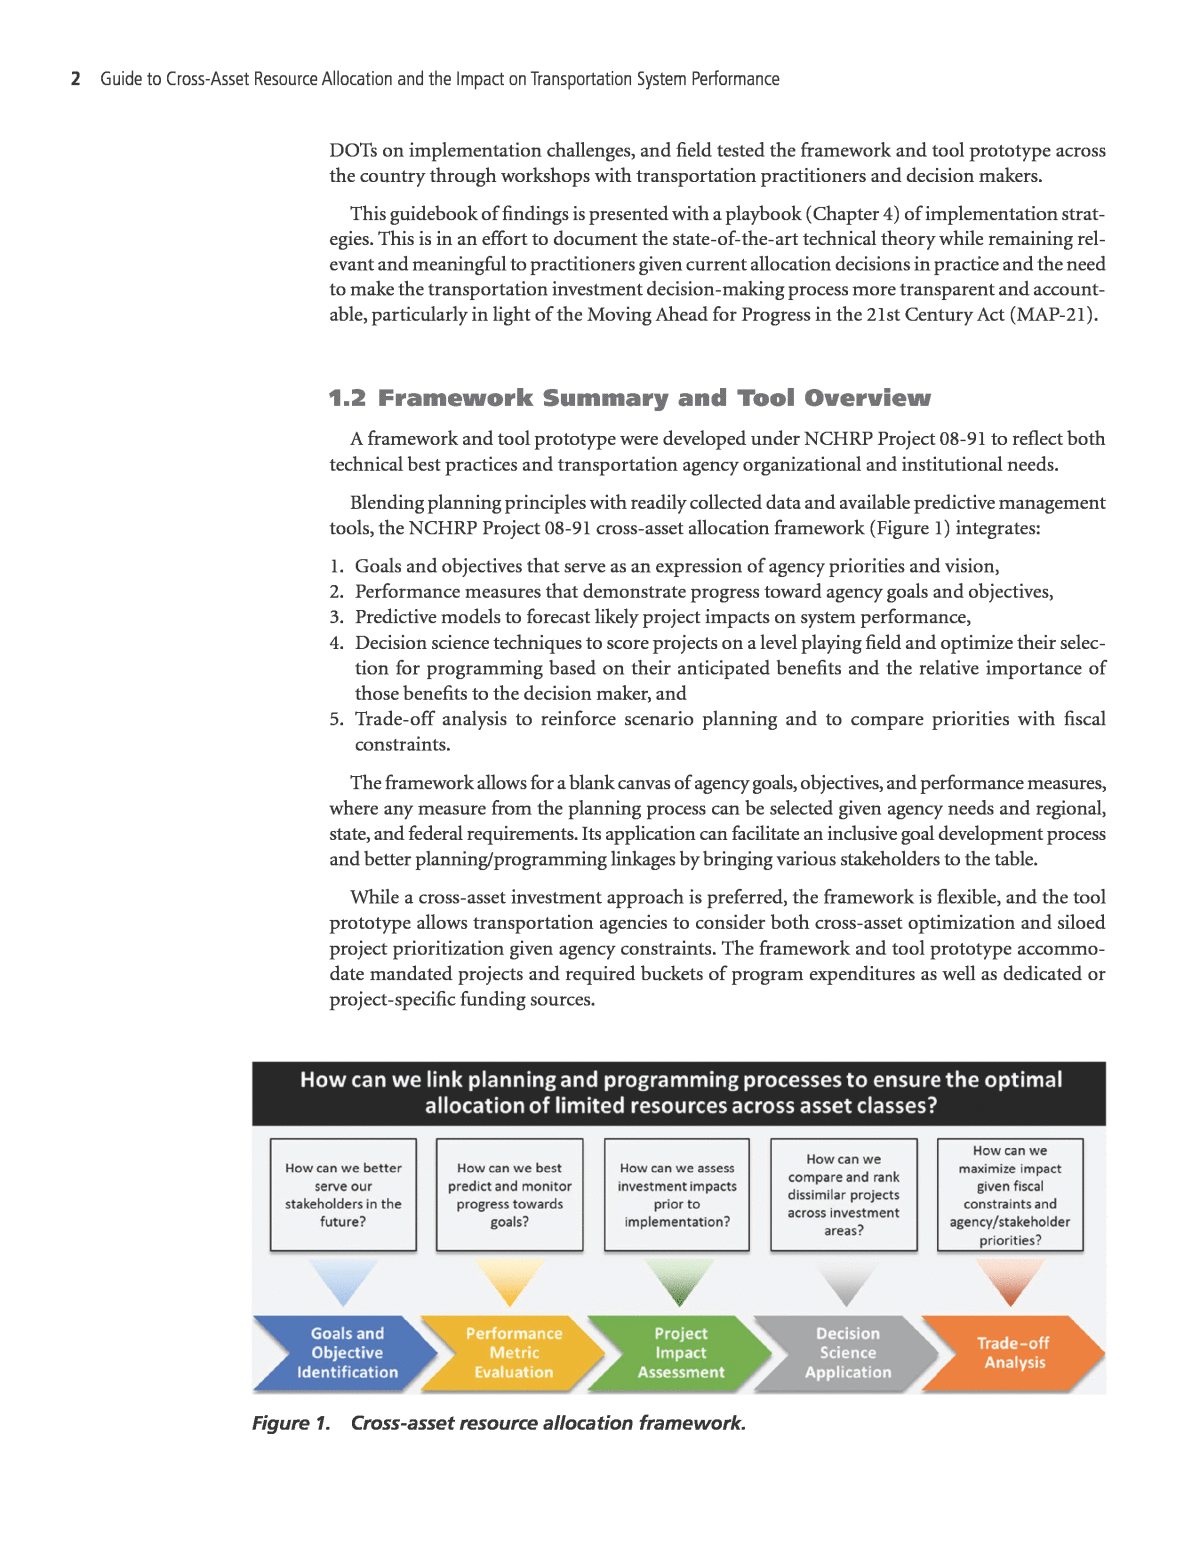
2 Guide to Cross-Asset Resource Allocation and the Impact on Transportation System Performance DOTs on implementation challenges, and field tested the framework and tool prototype across the country through workshops with transportation practitioners and decision makers. This guidebook of findings is presented with a playbook (Chapter 4) of implementation strat- egies. This is in an effort to document the state-of-the-art technical theory while remaining rel- evant and meaningful to practitioners given current allocation decisions in practice and the need to make the transportation investment decision-making process more transparent and account- able, particularly in light of the Moving Ahead for Progress in the 21st Century Act (MAP-21). 1.2 Framework Summary and Tool Overview A framework and tool prototype were developed under NCHRP Project 08-91 to reflect both technical best practices and transportation agency organizational and institutional needs. Blending planning principles with readily collected data and available predictive management tools, the NCHRP Project 08-91 cross-asset allocation framework (Figure 1) integrates: 1. Goals and objectives that serve as an expression of agency priorities and vision, 2. Performance measures that demonstrate progress toward agency goals and objectives, 3. Predictive models to forecast likely project impacts on system performance, 4. Decision science techniques to score projects on a level playing field and optimize their selec- tion for programming based on their anticipated benefits and the relative importance of those benefits to the decision maker, and 5. Trade-off analysis to reinforce scenario planning and to compare priorities with fiscal constraints. The framework allows for a blank canvas of agency goals, objectives, and performance measures, where any measure from the planning process can be selected given agency needs and regional, state, and federal requirements. Its application can facilitate an inclusive goal development process and better planning/programming linkages by bringing various stakeholders to the table. While a cross-asset investment approach is preferred, the framework is flexible, and the tool prototype allows transportation agencies to consider both cross-asset optimization and siloed project prioritization given agency constraints. The framework and tool prototype accommo- date mandated projects and required buckets of program expenditures as well as dedicated or project-specific funding sources. Figure 1. Cross-asset resource allocation framework.
Research Summary 3 By directing agency resources toward the most cost-beneficial investments, performance- based planning principles are reinforced. The framework is consistent with guidance provided in the AASHTO Transportation Asset Management Guide: âAn agency must be able to demonstrate that they are making progress on established goals and objectives and set goals and objectives tied to measurable metrics; make resource allocation decisions based on these goals and objectives and the funding available using the metrics to guide the decision making; and then demonstrate to its customers the results of the investmentsâ (AASHTO, 2011). Critical to the framework is the use of performance modeling to predict project impacts with respect to a holistic set of performance metrics within investment types. The focus of the tool prototype is on assessing and communicating the network performance impacts of investment trade-offs among investment types. The tool prototype focuses largely on framework steps four and five, and applies: ⢠Decision science techniques to score projects or on a level playing field based on their antici- pated benefits and the relative importance of those benefits to the decision maker(s); ⢠Prioritization to screen feasible projects and apply rankings based on the expected value of a project per dollar spent; ⢠Optimization to select projects from the ranked list in accordance with performance and budget constraints, where the sum of selected projects within each investment category as a ratio of the total available budget determines the optimal cross-asset resource allocation; and ⢠Trade-off analysis to support what-if analyses by conducting optimizations under varying constraints. The tool prototype applies these decision science techniques so as to create a transparent, structured, and repeatable method for project selection and communicating performance out- comes under varying constraints. This is done by facilitating the weighting of all performance measures with respect to priorities by creating a value matrix,1 converting project benefits with respect to various performance metrics into dimensionless units that can be readily compared, expressing project benefits in terms of their relative importance, and prioritizing/optimizing the project set to select the most cost-beneficial projects with respect to budget and performance constraints. The tool prototype was developed in Microsoft Excel for ease of use and to imple- ment the frameworkâs proof of concept. 1.3 Framework Benefits and Challenges Transportation officials face a myriad of projects, alternatives, and strategies when it comes to prioritizing investments and allocating resources. The main challenges in implementing such an informative approach have been the availability of trade-off tools and the lack of consensus building around performance outcomes. The capabilities of any tool implemented should allow for the opportunity to collaborate around a technically sophisticated starting point that can be readily replicated based on a transparent methodology. Expert opinion is critical for taking the results and iterating possible solutions with a focus on validating and updating decision points as data become available. To help decision makers sort through the noise of project development and selection, the tool prototype developed in the research applies trade-off analysis to better understand and commu- nicate what performance can be obtained given various investment scenarios and funding levels. Additionally, the framework and tool can be used to inform decision makers and stakeholders 1 The pairwise comparisons and weighting of all performance measures form the value matrix and are applied for project and program prioritization in the tool prototype.
4 Guide to Cross-Asset Resource Allocation and the Impact on Transportation System Performance of exactly what is gained and lost by allocating resources in a specific way, thus allowing them to consider the benefits and implications of investment decisions. In this way, the framework and tool prototype can be used to facilitate meaningful discussions around what truly mat- ters to executives, practitioners, stakeholders, and users of the transportation system given the complexity involved in applying limited resources to achieve comprehensive performance goals. Ultimately, the preferences gathered from discussions around the tool can be used to adjust per- formance targets to arrive at the most beneficial cross-asset resource allocation in light of fiscal constraints. This satisfies MAP-21 performance-based planning requirements and can support agencies in the development of transportation asset management plans (TAMPs). The research from NCHRP Project 08-91 supports direct linkages between planning and proj- ect prioritization and programming. While this is considered a best practice even outside of this research, it should be noted that the ability of transportation agencies to implement a fully flexible, discretionary approach to resource allocation varies across the country due to unique institutional, organizational, and political situations. Moreover, transportation planning and programming are not always well linked, and in certain cases, transportation agencies may not have the ability to alter program structures. This is a particular challenge for states that have resource allocations based on legislative mandates. A siloed mentality, where investment trade-offs are essentially considered only within asset classes, is also prevalent at state agencies, making a comprehensive performance approach more difficult to coordinate. Decision science applications in these contexts may be to optimize performance within an asset management system as opposed to across asset classes. The agency practice review conducted as part of this research identified these and other imple- mentation challenges that need to be addressed in order to make the framework more relevant and meaningful to practitioners. While many of the implementation challenges are institutional and organizational in nature, the siloed project development and subsequent decision making of agencies is likely the largest barrier to overcome for implementation. Comparisons of trans- portation system performance under a mandated resource allocation structure versus a flexible, cross-asset approach may be beneficial for agencies in such situations; however, the framework and tool prototype were designed to be flexible to agency constraints, allowing transportation agencies to consider both cross-asset and siloed project prioritization while encouraging an inclusive goal development process and better planning/programming linkages. The frame- work also accommodates mandated projects and program expenditures as well as dedicated or project-specific funding sources. The tool prototype communicates the results of the framework using dashboards to communicate with stakeholders, the public, and elected officials to show the minimum budgets need to meet performance targets, among other critical trade-offs. 1.4 Research Components The NCHRP Project 08-91 research was developed over an 18-month time frame through a series of reports, webinars, interactive workshops, and tool prototype testing. ⢠A baseline framework was developed by the research team in the project proposal and was expanded on throughout the research development process. ⢠An extensive review of theoretical and practical approaches to cross-asset resource allocation was conducted. While the theoretical best practices reviewed confirmed the technical approach provided in the baseline framework, the state-of-the-practice review revealed that there are significant implementation challenges that must be addressed in order to successfully apply the theory amidst operational, political, and organizational considerations. These were addressed by revising the framework and yielding a tool prototype better suited for practical use.
Research Summary 5 ⢠The tool prototype was designed to be a proof of concept and shows that a performance- based cross-asset resource allocation framework can be implemented using data and informa- tion currently available to transportation agencies. The tool prototype directly employs the framework but is flexible to allow for agency-specific implementation and reinforces scenario planning, using what-if scenario development via optimization algorithms that consider bud- geting and target-setting constraints. ⢠Workshops and tool testing (summarized in Chapter 3) allowed for the panel and other trans- portation agency practitioners and decision makers to see the power of the framework as programmed into the tool prototype. 1.4.1 Literature Review A comprehensive literature review was conducted to supplement the baseline framework, with the idea that modifications would be integrated based on current domestic and international literature in the areas of performance-based planning, asset management, financial investments, decision science, risk analysis, and multi-objective optimization. Each step of the baseline frame- work was researched and analyzed to ensure the development of a cutting-edge framework and tool prototype. Many of the sources considered in the literature review were used to develop the decision science and optimization methodologies detailed in Chapter 2. A summary of findings and sources for each step of the framework is provided in the following. 1.4.1.1 Goals and Objectives Identification State DOTs typically develop goals that align with national planning regulations (John A. Volpe National Transportation Systems Center, 2012) in addition to others that address more specific priorities for their stateâs multimodal transportation system. Visioning is commonly used by state DOTs to identify these priorities by asking the public and stakeholders how the transportation system can be improved in the future to better meet their needs. These priorities are typically grouped to form a more manageable set of goal areas for which goals and objectives are developed. Ultimately, the resulting set of goals needs to be comprehensive and succinct regardless of how they are developed; they need to fully encapsulate the transportation priorities for the state and the agency while providing clear direction for investments in the transportation system. State DOTs typically establish goals through the development of statewide long-range trans- portation plans (SLRTPs) and select projects from the statewide transportation improvement program (STIP) based on agency-specific prioritization criteria. Allocations in the STIP in many cases are based on historical precedent and funding restrictions rather than the achievement of performance goals. This is changing following MAP-21 implementation and is reinforced by the framework since the framework suggests the use of performance-based planning concepts and tools to support decision making with a focus on plans and programs that are directly linked. While these examples provide common practices for the development of agency goals and objectives, it is important to note that the successful application of the framework is not depen- dent on which goals are ultimately selected for use as long as they are measurable, nor is it dependent on the scale of implementation (i.e., statewide versus regional). Rather, the focus is placed on creating an inclusive goal and objective development process that achieves widespread recognition and buy-in among all stakeholders. 1.4.1.2 Performance Metric Evaluation The literature review provided a detailed description of tools and methods that are commonly used to predict transportation system performance with respect to infrastructure condition, safety, mobility, economic development, and other performance areas. Transportation agencies collect substantial amounts of data, and many states and MPOs apply these data to better under- stand system condition and performance.
6 Guide to Cross-Asset Resource Allocation and the Impact on Transportation System Performance NCHRP Report 660: Transportation Performance Management: Insight from Practitioners underscores the importance of performance measures as they relate to performance manage- ment: âIn the last several years, there has been a shift from performance measurement to per- formance management as well as from reporting whatever data are on hand to carefully and strategically selecting measures, setting targets, reporting measures, and using this information to shape decisionsâ (Cambridge Systematics, Inc., and High Street Consulting Group, 2010). In this way, performance measures directly link to national, regional, and agency goals and objec- tives. What makes a âgoodâ measure, however, is often subjective among agencies. The application of measures was also highlighted in the literature. Implementation of mea- sures needs to be integrated holistically (both vertically and horizontally) across business processes: policy formulation, data collection/analysis, long-range and short-term planning, programming/budgeting/resource allocation (of prime consideration herein), program/project delivery, and system monitoring/feedback (Cambridge Systematics, Inc., et al., 2010). More recently, The Task Force on Performance Measure Development, Coordination, and Report- ing, as part of the AASHTO Standing Committee on Performance Management (SCOPM), has established six overarching principles to guide the development and implementation of national performance measures (AASHTO Standing Committee on Performance Management, 2012). Similar to the flexibility of agency goals in the framework, specific performance measures are not mandated; however, performance models need to be applied (if available) to forecast future baseline performance with respect to various metrics. These models are generally developed using historical data to predict how a particular measure will respond to changes in relevant explanatory factors. To the extent practicable, the literature supports that these models should be calibrated to reflect current data and validated based on a comparison of actual to predicted performance outcomes. 1.4.1.3 Project Impact Assessment To evaluate the impacts of implementingâor not implementingâa proposed project, a vari- ety of analytical techniques were explored in the literature review that encompassed a wide range of complexity levels. To navigate this field, selection of a modeling technique ultimately comes down to the level of comfort of the modeling staff, available data, and nature of the prediction. Various methodologies and tools are available to support agencies in evaluating performance impacts. These are most established when it comes to preservation with predictive techniques described in NCHRP Report 713: Estimating Life Expectancies of Highway Assets (Thompson et al., 2012) and implemented in various off-the-shelf management systems (e.g., software developed by Deighton, AgileAssets, and Cambridge Systematics). The Federal Highway Administration (FHWA) provides national models, the National Bridge Investment Analysis System (NBIAS) and the High- way Economic Requirements System State version (HERS-ST) to help practitioners predict perfor- mance for bridges and pavements, respectively. AASHTO provides a combination of tools, including network bridge, pavement, and safety applications. Safety countermeasure impacts can addition- ally be quantified using the Highway Safety Manual, as described in NCHRP Report 715: Highway Safety Manual Training Materials (Dixon et al., 2012). For mobility impacts, statewide and regional travel demand models and techniques can be processed to assess congestion relief impacts; INRIX is also commonly used for assessing traffic speeds. The FHWA provides the Motor Vehicle Emissions Simulator (MOVES) software for air quality and emissions analysis and the Traffic Noise Model (TNM) for traffic noise. IMPLAN economic data along with models from Regional Economic Mod- els, Inc. (REMI) can be used for economic impacts, if desired. NCHRP Report 456: Guidebook for Assessing the Social and Economic Effects of Transportation Projects details an approach for property value. Techniques for evaluating energy, ecological, hydrological, visual, and socio-cultural impacts, in addition to those mentioned, have been effectively summarized in Sinha and Labi (2007). Yet, despite the abundance of technical resources, agencies often struggle to collect the right performance
Research Summary 7 data to support quantitative analysis. The benefits of the framework is that, if the data are not avail- able, professional judgment can be used to qualitatively assess the impact. Most generally, projects can be viewed as having an immediate performance impact (a jump) or having a lagging change in the rate of the performance measure. For instance, in Figure 2 a resurfacing project could be evaluated with regard to ride quality, where a lower value is pre- ferred. The change in performance (delta) with and without implementation is critical for using the framework; however, a higher-level network relationship between performance and invest- ment level can also be used. 1.4.1.4 Decision Science Application In the literature, multi-objective decision analysis (MODA) has widely been recommended to address cross-asset resource allocation problems. This decision science approach consists of using preferences to guide project selection through weighting, scaling, scoring, prioritization, and optimization techniques. In order to assign the relative importance of a performance measure or area, weighting is often used to help develop a prioritization score. Given the sensitivity of the ultimate transportation program to the indicated weights, care should be taken in selecting a representative methodology. These methods have included direct and swing weighting, the Delphi method, regression, and most popularly, the analytic hierarchy process (AHP) (Dalkey and Helmer, 1963; Hammond et al., 1975; Saaty, 1977; Goicoechea et al., 1982). The latter technique is built into the tool prototype and fur- ther discussed in Chapter 2. If users input qualitative pairwise ratings capturing the general prefer- ence between two areas, mathematical techniques can be applied to arrive at the intended weights. Scaling is a leveling technique that can be used to convert metrics with different dimensions or units of measurement into a normalized form by which they can be compared. The three most common techniques in the literature have been cardinal/ordinal linear scaling, monetization, and value/utility preference-based scaling. Cardinal scaling is used to convert metrics to a 0 (worst) to 1 (best) scale based on the raw performance relative to the maximum and minimum cases (Bai and Labi, 2012). Alternatively, ordinal scaling can be simplified by converting raw performance values to discrete levels of service, as detailed in NCHRP Report 677: Development of Levels of Service for Figure 2. Example preservation performance impact modeling (Bai and Labi, 2012). Note: IRI îµ International Roughness Index. Performance (IRI) Pre-treatment Performance Curve Performance Curve for the WITH Project Scenario Performance at t with Project Implementa on Performance at t without Project Implementa on Performance Jump T (years) Pavement Resurfacing t Performance Curve for the WITHOUT Project Scenario
8 Guide to Cross-Asset Resource Allocation and the Impact on Transportation System Performance the Interstate Highway System (Dye Management Group et al., 2010). Monetization methods have generally been divided between the value of âavoiding lossesâ or of an âimprovement over alter- nativeâ (Weisbrod et al., 2009). More predominant in the literature, and programmed in the tool prototype along with linear scaling, is that of preference-based scaling, which takes into account the level of satisfaction gained by an improvement based on where one started in terms of performance (Ford, 2011). Value scaling consists of direct rating, mid-value splitting, and regression techniques; utility scaling typically consists of direct questioning using a gambling approach and a certainty equivalent approach (Patidar et al., 2007; Spy Pond Partners et al., 2012; and Keeney et al., 1993). In order to compare projects either within or across asset management systems, a representa- tive score can be assigned that combines agency weighting and scaling preferences. Higher scores indicate the relative importance of pursuing a project and can be used to support prioritization efforts. Various methods for scoring projects have been recommended in the literature, including the weighted-sum method, the multiplicative utility function, the benefit/cost ratio method, and the goal programming method (Bai, 2012). The weighted sum method is most commonly used by agencies in developing overall pavement condition indices; it is applied in the tool prototype. The optimal solution for an agency is then the set of projects that maximize the program score subject to financial constraints and performance targets. This is referred to as an integer programming problem, where algorithms must be used in order to quickly arrive at a solu- tion, recognizing that testing all combinations of projects and alternatives would be infeasible. Preference-based optimization, similar to that shown in Li and Sinha (2004), is used in the tool prototype using the advanced algorithms detailed in Bai et al. (2011). 1.4.1.5 Trade-off Analysis Intrinsically related to multi-objective optimization, trade-offs refer to the balancing of com- peting objectives that by definition involve the sacrifice of one objective for the sake of another. Trade-off analysis can be used in transportation asset management to inform the decision- making process by evaluating the impacts of various investment levels and allocation strategies on overall system performance, as well as the extent to which one performance measure can be exchanged for another. Technically speaking, when linked to multi-objective optimization, trade-off analyses inform decision makers of the consequences (i.e., what is gained and what is lost) of moving from one feasible Pareto-optimal solution to the next (Figure 3). Most trade-off research to date has focused on pavement and bridge asset performance. In pavement management, the following trade-offs have been evaluated for Pareto-optimal solu- tions derived from various multi-objective optimization formulations and algorithms: pavement network performance versus cost (Pilson et al., 1999), maintenance cost versus work product Figure 3. Example trade-off analysis.
Research Summary 9 for pavement maintenance programming (Fwa et al., 2000), maintenance cost versus reliability (Deshpande et al., 2010), pavement maintenance and rehabilitation (M&R) cost versus average pavement network condition (Wu and Flintsch, 2009), and average annual M&R cost versus average proportion of network in the âvery goodâ condition state (Gao et al., 2012). In bridge management, Liu et al. (1997) and Liu (2005) adopted the genetic algorithm to examine the relationship between the rehabilitation cost and the deterioration degree for net- work bridge deck rehabilitation programming. Similarly, Liu and Frangopol (2005) used a genetic algorithm to perform trade-off analyses between maintenance cost, failure cost, and user cost for bridge management. In addition to studies on highway asset trade-offs, studies such as NCHRP Project 08-36, Task 7, have focused on multimodal trade-offs. The suggested analysis procedure in this study was to establish current levels of performance, identify alternative future funding levels, analyze individual programs under alternative funding levels, and analyze inter-program effects under alternative funding levels (Cambridge Systematics, Inc., 2004). While state agencies have become proficient in managing bridge and pavement assets inde- pendently, findings from NCHRP Report 545: Analytical Tools for Asset Management indicate that agencies struggle with comparing âapples to orangesâ trade-offs across asset classes (such as mobility versus preservation and maintenance versus expansion) (Cambridge Systematics, Inc., et al., 2005). This becomes particularly challenging when recognizing the fact that projects may have a positive impact on one performance measure but a negative impact on another. 1.4.1.6 Literature Review Findings In general, the literature review conducted for this project supported the baseline framework but revealed that advances can be applied to link performance-based planning to make resource allocation decisions, largely by way of the following two approaches: ⢠Target-based allocation: allocations can be determined by a qualitative review of applying optimization techniques within asset silos to systematically varied budgets, and ⢠Preference-based allocation: allocations can be determined using quantitative optimization techniques to select cross-asset projects on the basis of performance preferences. The latter approach is applied in the framework and tool prototype to support the ability of agencies to identify both performance-based cross-asset resource allocations and a baseline set of performance targets based on agency preferences. The literature review underscored that trade-off analysis can be further applied to inform the decision-making process by evaluating the impacts of various investment levels and allocation strategies on overall system performance, as well as the extent to which one performance measure can be exchanged for another. Agencies can then assess potential programs for both performance and considerations of risk. 1.4.2 Practice Review In order to help state DOTs better analyze and communicate the likely impacts of system performance across multiple investment types, the starting point for implementing a cross-asset resource allocation framework was analyzed in a case studyâstyle practice review. Specifically, an understanding regarding how state DOTs currently make decisions about the allocation of their limited resources to different types of major investment categoriesâsuch as preservation, modernization, expansion, operations, safety, and alternatives modesâwas investigated by the research team. To develop this understanding and ensure that the framework can be imple- mented in practice, the following key questions were addressed: ⢠What is the historical context for state DOT resource allocation? ⢠What are the key elements of resource allocation decision making?
10 Guide to Cross-Asset Resource Allocation and the Impact on Transportation System Performance ⢠What are the major differences in the approaches state DOTs use to make resource allocation decisions? ⢠What institutional barriers and other constraints exist that could limit the ability of state DOTs to adapt their resource allocation decision-making practices? To answer these questions, the research team developed case studies of five statesâNew Jersey, North Carolina, South Carolina, Utah, and Virginia2âand documented how decision makers in these states make high-level resource allocation decisions. Reviews of Pennsylvania, Ohio, and Texas were also incorporated based on recent experiences of the research team in develop- ing long-range transportation plans (LRTPs) in these states. This is important since resource allocation decisions can and should begin in LRTP development. Practice review findings revealed that state DOTs vary in the level of sophistication and analy- tics used to inform their resource allocation decisions. The associated approaches generally fall into the following four categories, although some states have hybrid methodologies that may straddle or combine these categories: ⢠Legacy driven: For many states where the research team has performed recent planning work, including Louisiana, Kansas, and Mississippi, the approach to resource allocation is largely legacy driven, meaning that the amount of funding that goes toward addressing a given goal or objective is largely determined by the existing program structure and either the amount or share of funding that has historically gone to each program. Changes may be made at the margins to accommodate inflation or emerging priorities. ⢠Fix it first: Several states, such as Georgia, Colorado, Virginia, and South Carolina, have allo- cation processes driven largely by asset management systems that determine needs for pres- ervation investments. Due to financial constraints in these states, this tends to leave very little funding left to be allocated for other purposes. Remaining allocations are thus typically a reflection of desired projects rather than goal-level priorities. ⢠Soft optimization: To varying degrees, some states use approaches that may start from a legacy or fix-it-first approach but then adjust allocations to better align spending with the relative priorities of the agency. This is called âsoft optimizationâ because decisions are mostly or partly driven by professional discretion and other nontechnical inputs. Example states are Arizona, Ohio, North Carolina, and Michigan, where these decisions are made by DOT leadership. ⢠Performance based: The states that come closest to performance-based cross-asset resource allocation are those that have heavily integrated performance measurement into their resource allocation decision-making approaches. The main difference between this category and soft optimization is that decisions are more data- and analysis-driven through the use of models and tools that help the state forecast likely outcomes across different goal areas; ultimately, allocation decisions still require leadership to make professional judgments about the right bal- ance of trade-offs. Examples of states that have used performance-based allocation approaches, or are at least moving in that direction, are Washington, Utah, Virginia, Florida, and Oregon. Another critical finding from the research on current state approaches to resource allocation decisions is that several barriers exist when it comes to the potential and implementation of cross-asset resource allocation optimization approaches. While the type and nature of the barri- ers vary by state and tend to be influenced by which of the allocation approach categories a state fits into, several common potential hurdles are evident across states: ⢠Weak strategic direction: While every state DOT has identified system-level goals (as has the federal government through the MAP-21 national goal areas), they typically steer clear of 2 Listed states were approached and reviewed prior to development of the final framework and tool prototype so as to build an understanding of current practices.
Research Summary 11 establishing overt relative priorities between different goals and objectives. Moreover, DOTs often share resource allocation decision-making authority with MPOs, regional planning organizations, or local governments, but the goals, objectives, and relative priorities of these partner agencies may be poorly aligned (e.g., an MPO may be focused on mobility while a DOT is more concerned with preservation). Together, these issues may make it difficult to determine what relative priorities should drive cross-asset allocation. ⢠Tools and data: The transportation community has made great strides in recent years to improve data collection and expand tools that can inform decision making. This is particu- larly true for the asset management and safety goal areas, but there are also areas where per- formance forecasting capabilities remain weak or are limited. For example, data on congestion are now readily available and accurate for the Interstate system but are less available and reli- able for lower network classifications. ⢠Institutional constraints: As exemplified by the number of states that continue to base allo- cations on legacy considerations, agencies will likely face significant institutional hurdles in trying to change their resource allocation approaches. Examples of this are statutory require- ments for how funds are distributed either geographically or by investment categories, existing program structures that have entrenched advocacy groups that will resist change, antiquated laws and policies that limit flexibility, and legacy commitments that agencies need to honor for political reasons. ⢠Organizational considerations: Factors such as reporting relationships, span of control, and agency culture may influence the ability of a DOT to make changes in its allocation process. For example, agencies that have been highly decentralized and have effectively allowed dis- tricts to decide how funds are spent may find it difficult to rein in this authority. ⢠Public/stakeholder issues: Stakeholders (and to a lesser degree, the public) typically have a strong understanding of a stateâs existing allocation processes and have learned to work within it. Changing allocation approaches may be viewed as threatening, particularly if the new pro- cess is highly technical and difficult for laypeople to understand. ⢠Political resistance: As was clearly exemplified by the resistance to the Intermodal Surface Transportation Efficiency Act of 1991 (ISTEA) management system mandates, efforts to increase the level of analytics and modeling to influence projects can threaten decision mak- ers. Any new resource allocation approach will need to balance the role of analysis and political influence in decision making. These challenges are addressed in the framework and tool prototype, both in technical appli- cation (see Section 2.4) and in possible agency applications based on the stateâs maturity in link- ing planning-level goals with project selection (see Sections 4.1 and 4.2). 1.4.3 Workshops and Tool Testing The development of a detailed review of the state of the practice was used to create an accessi- ble framework and implementable tool prototype. While the practice review uncovered potential challenges for implementation, workshops and one-one-one agency testing allowed for a review of the framework and tool prototype by the project panel and an additional 25+ transportation agencies. All workshops and the tool prototype testing are described in more detail in Chapter 3. Documentation regarding the workshops is provided in the Technical Memorandum: Cross- Asset Resource Allocation Workshops.
