
5
Sampling and Estimation
Key statistical ingredients of any survey are how the sample is designed and how estimates for dissemination to users are constructed once data are collected. In the framework of survey design steps (see Table 1-1, in Chapter 1), sample design comes before data collection (see Chapter 4), and estimation comes not only after data collection, but also after editing and imputation (see Chapter 6). Nonetheless, because they are so closely related, it makes sense to address these two steps for the U.S. Census Bureau’s annual economic surveys in a single chapter.
Sample design features include
- the frame—that is, the list of units (e.g., enterprises or establishments) from which the sample is selected;
- stratification of units on the frame, such as by industry or unit size, in order to ensure sufficient sample size for small strata and, more generally, to improve precision for a given sample size;
- the number of stages used in selection;
- the target sample size (number of units to be selected from the frame), which is a function of available resources and desired levels of precision of estimates for the desired levels of detail (e.g., industry subsectors); and
- the method of selection itself, such as stratified simple random sampling or selection with probabilities proportional to some measure of the size of units.
The standard approach to estimation involves
- construction of a set of weights that may be based on the probabilities of selection of the sample units and that may also adjust for nonresponse by sample units;
- adjustments to compensate for nonresponse (unit and item, see Chapter 6); and
- the use of auxiliary data from the frame or external sources to reduce variances and, in some surveys, correct for the possibility that the frame does not cover all units in the population.
Over the course of their existence, the Census Bureau’s annual economic surveys that the panel recommends be integrated into an Annual Business Survey System (ABSS) have developed a variety of sample design and estimation methods. Harmonizing the statistical methods that are used in carrying out these surveys would have at least three advantages: (1) leveraging the expertise of technical staff to contribute efficiently to several surveys; (2) potentially reducing burden overall and for particular respondents; and (3) presenting data users with a more coherent and understandable system than the current one.
The recommendations in this chapter call for the Census Bureau to take three steps: (1) use the same general stratified sampling design, using equal probability sampling within strata, for most or all of the annual economic surveys; (2) unify the methods used to identify certainty units—that is, enterprises, establishments, or other units sampled with probability 1.0; and (3) review the estimators used in all of the surveys to determine whether more statistically efficient methods are available or can be devised. Two other sample design features for Census Bureau consideration, which can help to control burden and facilitate longitudinal analyses, are rotation of sample units within individual surveys and controlling the overlap in the samples used for different surveys. The chapter also discusses methods for producing estimates for smaller geographic areas than are possible using survey results alone, for producing preliminary estimates to accommodate users’ expressed needs for more timely information, and for using other data sources to augment survey responses. The chapter does not explicitly discuss the choice of sample sizes given that consideration of resource and precision tradeoffs is properly the province of the Census Bureau based on consideration of users’ data needs.
5.1 OVERVIEW OF CURRENT APPROACHES
The Business Register is the basis for the frame for all of the Census Bureau’s annual economic surveys (see Chapter 3). Some of these surveys
cover companies in particular industries identified by their North American Industrial Classification System (NAICS) code, such as the Annual Survey of Manufactures (ASM) and the Annual Retail Trade Survey (ARTS), while others cover a broader spectrum of industries (see Section 5.2, “Industry Coverage and Sampling Units”). The Census Bureau uses stratified sampling for most of the annual economic surveys but with different methods for selecting sample cases within strata. Section 5.3 (“Sample Selection Methods”) summarizes the stratification variables and methods of sample selection in each survey. Three of the surveys use stratified probability proportional to size (PPS) sampling, five use simple random selection without replacement within strata, and two use systematic sampling within strata. The Company Organization Survey (COS) uses nonprobability methods for sample inclusion. Seven surveys use industry as the primary stratification variable, with four having additional stratification by a measure of size. The three other probability surveys use other types of strata. All of the surveys include certainty units, selected using one or more measures of size, and noncertainty units, which are sampled according to the designated sampling scheme. Some businesses are included in more than one survey and, consequently, must respond to more than one questionnaire.
The designation of certainty units varies across the surveys and, as described in Section 5.4 (“Identification of Certainty Units”), appears to be ad hoc. There is controlled non-selection in some of the surveys in which non-certainty units that were selected in the previous sample are excluded from the sampling frame to reduce the burden on small- or medium-sized enterprises. This type of control could be made more formal through a sample-unit rotation plan, as discussed in Section 5.5 (“Rotation and Synchronization of Samples”).
As discussed in Section 5.5, for most of the surveys, noncertainty units, once selected, remain in the sample for 5–6 years. This is potentially burdensome for the respondents, and some publication categories (e.g., industries) may be more affected than others. With retention for a period of 5–6 years, it is important to monitor response rates for possible degradation. The samples that are retained for multiple years are updated annually for births and deaths of businesses; a sample of births is added each year while deaths drop out of the sample.
As discussed in Section 5.6 (“Estimation Methods”), the core estimation method used in most surveys is Horvitz-Thompson estimation in which units are weighted by the inverse of a selection probability. Four surveys improve on this basic estimator using a difference or a link relative estimator that incorporates previous economic census data. As we recommend below, it may be possible to further reduce estimator variances by making more extensive use of auxiliary data in estimation.
Section 5.7 (“Small-Area Estimation”) discusses users’ requests for more detailed geographic estimates from some of the surveys. The obvious choice for doing this, other than substantially increasing sample sizes, is to use small-area estimation. Section 5.8 (“Preliminary Estimates”) discusses possible methods for producing preliminary estimates for key statistics from the annual economic surveys. Finally, Section 5.9 (“Use of Alternative Data Sources in Estimation”) briefly discusses the need to explore how nonsurvey data could be used to improve estimates from the annual economic surveys and an ABSS.
Toward the goal of harmonizing approaches as much as possible across the annual economic surveys, we provide specific suggestions in the remainder of this chapter to standardize the sample designs and estimation methods. It is also important that standardization include consistent terminology. During the panel’s review, it became apparent that different surveys use different terms for what appear to be the same sample design and estimation features. Different surveys confusingly use different terms such as enterprise or company and establishment or Employer Identification Number (EIN) to describe the units that they cover. Terminology used to describe estimators is also inconsistent. Some surveys describe their methods of estimation as “Horvitz-Thompson,” while others refer to “inverse probability weighting.” The terms “ratio estimate” and “link relative estimate” appear to be used to mean the same thing, although this is not clear in the documentation. This sort of inconsistency can cause confusion among users and difficulties in internal Census Bureau communications.
Finally, regardless of how similar or different the current statistical methods of the annual economic surveys are, it is important to use a common template for public documentation. A common format will show data users a coherent picture of the whole system and facilitate their understanding of the sampling and estimation methods in the current surveys and, ultimately, in an ABSS.
RECOMMENDATION 5-1: The Census Bureau should adopt standardized terminology for sample design features, sampling units, and estimation methods for the annual economic surveys and provide a glossary to users and staff for both external and internal communication. Notation for describing the designs and estimators should also be standardized. The standardized terminology and notation should be used in all documentation, and documentation should follow a standard format.
5.2 INDUSTRY COVERAGE AND SAMPLING UNITS
Table 5-1 lists the industry sectors and ranges of NAICS codes covered by each of the annual economic surveys. Agriculture, forestry, fishing, and hunting are only covered in a limited way in three surveys, the Annual Capital Expenditures Survey (ACES), the Information and Communication Technology Survey (ICTS, currently in abeyance), and the Annual Survey of Entrepreneurs (ASE). These three surveys and the COS cover all of the other sectors except public administration. The Service Annual Survey (SAS) and the Business and Professional Classification survey (known as SQ-CLASS) exclude manufacturing but cover most other sectors. The ASM, Manufacturers’ Unfilled Orders Survey (M3UFO), and Management and Organizational Practices Survey (MOPS) cover only manufacturing, while ARTS and the Annual Wholesale Trade Survey (AWTS) cover only their respective sectors. SAS, ACES, ICTS, and ASE have a substantial amount of overlap at the industry sector level, although not necessarily at the sampling frame level because the units surveyed are not the same in all four surveys. This overlap does raise the question of whether the burden on individual respondents could be reduced by rotation and synchronization of samples (see discussion below in Section 5.5).
A fundamental decision in sampling is what the sample unit(s) should be. Table 5-2 lists the types of units used in each survey in a very simplified form. An “enterprise” is a combination of legal units that produce goods or services and has some autonomy in decision making. The term “enterprise” appears to be used in the Census Bureau interchangeably with “company.” An “establishment” is a local unit within an enterprise (or company) that carries out at least one kind of production. For small businesses, an enterprise may be a single establishment (see Section 3.1.1, “Uses and Units Included [in the Business Register],” in Chapter 3).
As shown in Table 5-2, only two of the annual surveys—ASM and MOPS, which is tied to ASM—use establishments as the sampling unit. The other nine annual surveys use enterprises. It would be useful for the Census Bureau to conduct a review to ensure that the sampling unit used in each survey best supports its publication goals and also facilitates coordination among the surveys, as we recommend throughout this report. In particular, a review would be useful to evaluate whether the goals of the establishment-based surveys can be met by sampling enterprises as the initial units, followed by subsampling establishments within sample enterprises. A two-stage design could be less efficient for ASM and MOPS: if changing their sampling units to enterprises is feasible, however, it would simplify coordination of samples across the annual economic surveys (see Section 5.5).
TABLE 5-1 Industry Sector Coverage of the Annual Economic Surveys
| Sector | NAICS | ASM | M3UFO | MOPS | ARTS | AWTS | SAS | ACES | ICTSa | ASE | SQ-CLASSb | COS |
|---|---|---|---|---|---|---|---|---|---|---|---|---|
| Agriculture, Forestry, Fishing, and Hunting | 11 | Partial | Partial | Partial | ||||||||
| Mining | 21 | x | x | x | x | x | ||||||
| Utilities | 22 | x | x | x | x | x | x | |||||
| Construction | 23 | x | x | x | x | |||||||
| Manufacturing | 31–33 | x | x | x | x | x | x | x | ||||
| Wholesale Trade | 42 | x | x | x | x | x | x | |||||
| Retail Trade | 44–45 | x | x | x | x | x | x | |||||
| Transportation and Warehousing | 48–49 | x | x | x | x | x | x | |||||
| Information | 51 | x | x | x | x | x | x | |||||
| Finance and Insurance | 52 | x | x | x | x | x | x | |||||
| Real Estate Rental and Leasing | 53 | x | x | x | x | x | x | |||||
| Professional, Scientific, and Technical Services | 54 | x | x | x | x | x | x | |||||
| Management of Companies and Enterprises | 55 | x | x | x | x |
| Administrative and Support and Waste Management and Remediation Services | 56 | x | x | x | x | x | x | |||||
| Educational Services | 61 | x | x | x | x | x | x | |||||
| Health Care and Social Assistance | 62 | x | x | x | x | x | x | |||||
| Arts, Entertainment, and Recreation | 71 | x | x | x | x | x | x | |||||
| Accommodation and Food Services | 72 | x | x | x | x | x | x | |||||
| Other Services (except Public Administration) | 81 | x | x | x | x | x | x |
NOTES: See text for full names of surveys; NAICS, North American Industrial Classification System.
aSurvey is currently suspended.
bSQ-CLASS is a quarterly, not annual, survey of new Employer Identification Numbers (EINs) appearing on the Business Register each quarter; see Chapter 3.
SOURCE: Information provided to the panel by the Census Bureau.
TABLE 5-2 Strata and Sample Selection Methods Used in the Annual Economic Surveys
| Survey | Sampling Unit | Stratification | Sample Selection | Frame Size | Sample Size |
|---|---|---|---|---|---|
| ASM | Establishment (employer) | NAICS and eligible/not eligible to be mailed a questionnairea | STPPS | 101,000 | 50,000 |
| M3UFO | Enterprise (in 47 manufacturing industries that historically have had unfilled orders) | NAICS | STPPS | 72,000 | 6,000 |
| MOPS | Establishment (employer) | NAICS | STPPS | 101,000 | 50,000 |
| ARTS | Enterprise (company EIN) (employer and nonemployer) | NAICS × size | STSRS | 1,082,500 | 21,800 |
| AWTS | Enterprise (company EIN) (employer and nonemployer) | NAICS × size | STSRS | 315,000 | 8,700 |
| SAS | Enterprise (company EIN) (employer) | NAICS × size | STSRS | 2,942,000 | 71,900 |
| ACES | Enterprise (employer and nonemployer) | Major strata: employer/nonemployer. The employer stratum is substratified by industry. The nonemployer stratum consists of four substrata. | STSRS | 35,900,000 | 75,000 |
| ICTSb | Enterprise (employer) | Same as ACES employer stratum | STSRS | 5,600,000 | 45,000 |
| Survey | Sampling Unit | Stratification | Sample Selection | Frame Size | Sample Size |
|---|---|---|---|---|---|
| ASE | Enterprise (employer with more than $1,000 in annual receipts) | Category of ownership characteristic/MSA/years in business | STSYS | 5,600,000 | 290,000 |
| SQ-CLASS | EIN | NAICS × tax status × size | STSYS | 100,000 | 15,000 |
| COS | Establishment (single units) Enterprise (multi-units) | Not applicable | Non probability | 6,000,000 180,000 | 5,000 42,000 |
NOTES: See text for survey names; EIN, Employer Identification Number (see Chapter 3); MSA, Metropolitan Statistical Area; NAICS, North American Industrial Classification System; STPPS, stratified probability proportional to size (sampling); STSRS, stratified simple random sampling (selects units within a stratum at random until the desired sample size is obtained); STSYS, stratified systematic (random) sampling (which uses a random start within a stratum followed by selecting every nth unit, with n chosen to obtain the desired sample size). STSRS and STSYS select units with equal probability within a stratum. All of the probability surveys have certainty sampling units. Information on the size of the universe and the sample for each survey is for 2015.
aSee https://www.census.gov/programs-surveys/asm/technical-documentation/methodology.html [November 2017] for details.
bSurvey is currently suspended.
SOURCE: Information provided to the panel by the Census Bureau.
RECOMMENDATION 5-2: The Census Bureau should review whether the establishment-based Annual Survey of Manufactures and Management and Organizational Practices Survey could sample in two stages—enterprises followed by establishments within enterprises—without substantial losses in statistical efficiency. Such a design would facilitate the development of an Annual Business Survey System that uses enterprises as the primary sampling unit.
5.3 SAMPLE SELECTION METHODS
Two basic within-strata sample selection methods are used in the 10 annual economic surveys with probability samples. One method is stratified PPS sampling, which is used in three surveys. The other method is stratified sampling that does not use a measure of size—five surveys in this category use stratified simple random sampling (STSRS), and the
other two surveys use stratified systematic random sampling (STSYS). The strata are defined by industry, industry by size, or more specialized characteristics, such as tax status (see Table 5-2, above). Size is defined by amount of sales in a previous year or the number of employees at a previous time.
The seven surveys that use STSRS (five surveys) or STSYS (two surveys) could readily be redesigned to use the same method. The panel’s preferred method as explained below is equal probability sampling obtained by either simple random or systematic sampling within strata.
PPS sampling, which is used in three of the surveys (ASM, M3UFO, and MOPS), can be efficient, in the sense of reducing variances, for estimating totals of quantitative variables. For example, if the population total of the value of shipments in the current time period is to be estimated and previous sales are a good predictor of current shipment value, then a method that selects enterprises with probabilities proportional to a previous period value of their sales (a form of PPS) is very efficient. For estimating the total of a qualitative characteristic, such as the number of enterprises with a minority owner, PPS may be no better than equal probability sampling and could be much less efficient. Moreover, the form of PPS used by the three surveys is Pareto PPS sampling; accounting for its without-replacement feature introduces nonstandard complications in variance estimation.
Appropriately implemented, STSRS (or STSYS) designs are often nearly as efficient as PPS even when the measure of size is strongly related to the variables that are to be estimated. STSRS can also improve efficiency for estimates of characteristics not strongly related to a size measure and allow a simple way of accounting for sampling fractions in variance estimators. An alternative to PPS is to sort units by the measure of size, create substrata of equal total measure of size, and select an equal probability sample within each substratum (see Valliant, Dever, and Kreuter, 2013, Sec. 3.2.1). From the point of view of unifying the methods, simplifying operations, and retaining statistical efficiency, it may make sense to convert all 10 designs to stratified, equal probability sampling.
To support a decision to use STSRS (or STSYS) designs for all 10 surveys, it would be useful to analyze the PPS designs currently in use to examine their efficiency and the efficiency expected if they are converted to STSRS designs. Research projects for such an analysis would entail selecting a set of important estimates in each survey and computing point estimates and their variances from the current designs using previous data. The same data also would be used to estimate the point and variance estimates from an STSRS design and comparisons made to results from the current sample designs.
RECOMMENDATION 5-3: The Census Bureau should study the statistical efficiency of the probability proportional to size sample designs used in some of its current annual economic surveys and convert them to stratified, equal probability (stratified simple random sampling or stratified systematic random sampling) designs unless this would lead to a substantial loss of statistical efficiency.
5.4 IDENTIFICATION OF CERTAINTY UNITS
Choosing sample units with certainty is a way of controlling the standard errors of the resulting estimates. Variability in sample-to-sample estimates due to the inclusion or exclusion of large units is removed because certainty units are included in every sample. As shown in Table 5-3, the annual economic surveys use a variety of methods for designating certainty units, including employment, inventory, sales, and expert judgment by staff. In a number of surveys, a substantial proportion of the totals of key variables are accounted for by certainty units, especially within small publication cells. Whether the number of certainty units can be reduced in some of the surveys without reducing efficiency of estimates is a topic that is worth exploring because of the potential reduction in burden for some businesses. Examining the approaches for certainty identification is another opportunity to unify procedures across the annual economic surveys.
Determining certainty cutoffs for the annual economic surveys can be done mathematically or with empirical, iterative procedures. A mathematical procedure would be to model key variables as functions of a frame variable from the Business Register that is used to set a cutoff. Suppose that a model that approximately describes the relationship between a publication variable y and a frame variable x (e.g., sales, employment) is
![]()
where the subscript M denotes “model,” β is a parameter, and the variance, vi, may depend on characteristics of the unit. Based on theorems of Isaki and Fuller (1982) and Särndal, Swensson, and Wretman (1992, Result 12.2.1), assuming the use of a survey-weighted regression estimator of a total, the optimal selection probability is proportional to ![]() . If, for example, varM (yi) = σ2xiγ where σ2 and γ are parameters, then the optimal probability is proportional to
. If, for example, varM (yi) = σ2xiγ where σ2 and γ are parameters, then the optimal probability is proportional to ![]() . If x is sales, and γ = 2, then the optimal selection probabilities would be proportional to sales. If γ = 1, then the optimal selection probabilities would be proportional to the square root of sales. Because the value of γ will depend on the y variable, a set of important analysis variables has to be examined for each survey.
. If x is sales, and γ = 2, then the optimal selection probabilities would be proportional to sales. If γ = 1, then the optimal selection probabilities would be proportional to the square root of sales. Because the value of γ will depend on the y variable, a set of important analysis variables has to be examined for each survey.
TABLE 5-3 Methods of Designating Certainty Units and Percentage of Sample and Key Variables Accounted for by Certainty Units in the Annual Economic Surveys
| Survey | Certainty Designation | Percentage of Sample in Certainty Units | Percentage of Key Variables Accounted for by Certainty Units |
|---|---|---|---|
| ASM |
Establishments with 1,000+ employees
Top 10 employers in each NAICS6 cell All establishments in each state x NAICS4 cell with number of establishments < 20 Some certainty industries Largest establishments in cost of fuels, purchased electricity, total inventories, total assets, and last-in, first-out inventories |
Establishments: 50% | 87% of sales |
| M3UFO |
Arbitrary selections by M3UFO staff of enterprises with large relative measure of size |
Enterprises: 31% | 71% of sales |
| MOPS | Same as ASM | Same as ASM | Not available |
| ARTS |
Annual sales or end-of-year inventories above industry-specific cutoffs |
Enterprises: 18% | 58% of sales |
| AWTS |
Annual sales or end-of-year inventories above a predetermined cutoff |
Enterprises: 24%
Manufacturer’s sales branches and offices: 63% Agents and brokers: 28% |
Distributors: 52% of sales
Manufacturer’s sales branches and offices: 93% of sales Agents and brokers: not available |
| SAS |
Annual sales or end-of-year inventories above some cutoff |
Enterprises: 25% | 65% of sales |
| ACES | 500+ employees |
Enterprises with employees: 41% Entire sample: 25% |
Not available |
| ICTSa | 500+ employees |
Enterprises with employees: 38% |
Not available |
| ASE |
Based on sales, payroll, or employees |
Enterprises: 10% | Not available |
| SQ-CLASS | Based on payroll |
Enterprises
Retail: 3–5% Services: 9–16% Wholesale: 4–10% |
Not available |
| COS | Large multi-unit enterprises | Enterprises: 71–83% | 80% of employment |
NOTES: See text for survey names. Data are for the 2015 round of each survey.
aSurvey is currently suspended.
SOURCE: Information provided to the panel by the Census Bureau.
In a PPS sample of size n selected from a group (e.g., industry) of size N, the form of the selection probability is
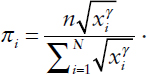
Any unit (establishment or enterprise) whose selection probability is greater than 1.0 would be a certainty unit. To be conservative, the certainty cutoff is often lowered to include any unit whose selection probability is greater than, say, 0.80. The total sample size n in the formula above is generally based on budget or desired precision. The sizes of the current samples can be used, assuming that those sample sizes meet the estimation goals and are still affordable.
As shown in Table 5-3 above, some surveys have a substantial proportion of the sample devoted to certainty units. For example, 50 percent of the sample establishments and 87 percent of sales in ASM are accounted for by the certainty units. In AWTS, 24 percent of sample enterprises and 52 percent of sales are in the certainty units. These high proportions of certainty units may not be needed to achieve precision goals. If the number of certainty units can be reduced, it will reduce the burden on any unit that is no longer a certainty and is not selected as a noncertainty. It also may be possible to reduce the size of the sample if precision goals can be met with fewer certainty units, thus decreasing total burden across all units.
The calculation above assumes that a PPS sample is selected, but this computation can just be a device for identifying certainty units. As suggested in the previous section, using a stratified equal probability sample (either STSRS or STSYS) for the noncertainty part of the sample needs to be explored. Such designs can approximate a PPS sample and will facilitate sample rotation and coordination (see discussion in the next section).
An empirical approach, similar to that suggested in the previous section, would be to use previous survey data or frame data and experiment with different cutoffs. For any given cutoff, the standard errors of estimators for different analysis variables can be computed. A decision then can be made on a compromise value for a cutoff that successfully reduces standard errors to acceptable levels. This experimentation would have to be carried out for key variables in each survey.
RECOMMENDATION 5-4: The Census Bureau should formally investigate a unified approach to determining certainty units in the annual economic surveys by using either the modeling approach described in this panel’s report or, if that is not feasible, a standardized empirical approach. A unified approach would contribute to
the overall goal of harmonizing the statistical methods used across the surveys. It could also contribute to reducing burden if the number of certainty units could be reduced in some surveys.
Note that the particular units identified as being certainty units may change over time, but the algorithm for determining the certainty cutoff should be stable over time—a feature that will facilitate operations. If the recommended research leads to the adoption of a unified empirically based approach for designating certainty units in the annual economic surveys, the Census Bureau will need to explain to users the benefits of such an approach and the characteristics of the chosen algorithm.
5.5 ROTATION AND SYNCHRONIZATION OF SAMPLES
Rotation of sample units within individual surveys and coordination of samples across surveys have the potential not only to reduce respondent burden, but also to enhance the ability to conduct longitudinal analyses. Other statistical agencies have undertaken such coordination, including the Bureau of Labor Statistics (BLS), National Agricultural Statistics Service (NASS), Statistics Canada, Statistics Netherlands, and the Australian Bureau of Statistics. The experience in these agencies could inform the undertaking of a similar coordination effort at the Census Bureau.
Rotation of sample units involves setting up a systematic pattern of sampling the units, retaining them for a specified period of time, and then dropping them from the sample. Synchronization of surveys means selecting samples in such a way that the amount of overlap of samples for different surveys is controlled. Smith (2013) and Haraldsen and colleagues (2013) discuss both of these techniques. These methods have the benefit of limiting the burden on respondents and making the timing of surveys more predictable for both respondents and data users. In addition, building in retention of sample units for periods of time would serve the needs of data users for consistent time series (see Chapter 2) and could make possible the development of longitudinal panels for analysis. At present, the annual economic surveys for which sample units are reselected every 5–6 years (ASM, M3UFO, MOPS, ARTS, AWTS, and SAS) are de facto panels since units are asked to respond for that period of time. (Units in the monthly surveys, which are not covered by this report, are even more heavily burdened because they are asked to report for 60 consecutive months.) Having a rotation plan would formalize the longitudinal aspect of those surveys, while synchronization would help minimize the burden of being in a panel on particular respondents.
All of the samples for the annual economic surveys use both certainty selections and a set of noncertainty strata. As noted above, certainty units
are generally so important to producing precise estimates that they will always be sampled as long as they maintain their certainty status. In contrast, noncertainty units are selected with probabilities less than 1.0 and open the possibility of a more elaborate rotation plan. Rotation of samples would have the benefit of controlling the burden on some noncertainty units and allow the Census Bureau to inform sample units how long they are obligated to report. Synchronization or coordination is a means of limiting the number of different surveys in which a unit is sampled. As recommended in Chapter 3 (see Recommendation 3-2), the Business Register should track the surveys and the years in which units are selected: this tracking should be done regardless of whether rotation and synchronization are adopted.
The amount of overlap across surveys varies. Large enterprises will be in all the surveys for which they are eligible. If those units are certainty units in all surveys, there is little hope of reducing their burden unless the number of certainty units can be reduced (see discussion in previous section). Table 5-4 presents some data on overlap: the upper half of the table lists the counts of single-unit establishments that were in pairs of surveys in 2014; the lower half gives other counts of overlap for single-unit establishments. The table includes the eight surveys that are administered annually. It excludes ICTS, which is intended to be an annual supplement to ACES but is currently suspended; MOPS, which is an every-5-year supplement to ASM; and SQ-CLASS, which is a quarterly survey that has a new sample each quarter.
For five of the eight surveys shown in Table 5-4, new samples are selected every 5–6 years (ASM, M3UFO, ARTS, AWTS, and SAS); ACES and COS select a new sample annually, while the goal for ASE is to select a new sample every 3 years. For the surveys for which samples are selected only every 5–6 years, selected enterprises or establishments remain in the sample and are subject to annual repetitions of the survey until a new sample is selected.
The combination of 5-year or 6-year sample reselection for five of the surveys and the overlaps shown in Table 5-4 raise concerns about respondent burden and data quality. Although response rates are high across all the annual economic surveys, it would be useful to monitor response rates over the 5 years of sample inclusion to see whether there is a dropping off overall or by category. Other more subtle data quality issues, such as fabrication of responses, are also a concern if surveys are too burdensome.
Synchronization of samples across surveys that have the same sampling population and sampling units is advisable. If an enterprise or establishment is selected for one survey, the probability of selection for a second survey can be reduced or the sets of units selected in different surveys can be staggered to reduce overlap. This practice is standard in Canada (Royce, 2000; Srinath and Carpenter, 1995), Sweden (Kroeger, Särndal, and Teikari,
TABLE 5-4 Single-Unit Establishments in the 2014 Samples in Selected Annual Economic Surveys
| Survey | ASM | M3UFO | ARTS | AWTS | SAS | ACES | ASE | COS |
|---|---|---|---|---|---|---|---|---|
| Counts of Overlapping Single Units (SUs) | ||||||||
| ASM | * | |||||||
| M3UFO | 1,580 | * | ||||||
| ARTS | 18 | 1 | * | |||||
| AWTS | 14 | 5 | 1 | * | ||||
| SAS | 36 | 4 | 9 | 2 | * | |||
| ACES | 1,016 | 286 | 204 | 64 | 1,962 | * | ||
| ASE | 2,184 | 554 | 1,311 | 576 | 3,759 | 3,222 | * | |
| COS | 0 | 8 | 103 | 29 | 468 | 634 | 1,096 | * |
| Counts of unduplicated single units within survey that overlap with one or more other surveys | 4,043 | 1,835 | 1,512 | 628 | 5,500 | 5,797 | 10,908 | 1,758 |
| Number of single units in sample | 17,111 | 3,503 | 22,912 | 5,440 | 71,407 | 23,730 | 268,179 | 4,955 |
| Percentages of single-unit sample that overlap (unduplicated) | 23.6% | 52.4% | 6.6% | 11.5% | 7.7% | 24.4% | 4.1% | 35.5% |
| Percentages of single units in total sample | 34.2% | 58.8% | 80.0% | 62.1% | 80.6% | 52.9% | 92.5% | 10.6% |
| Total sample size (includes multi-unit enterprises) | 50,093 | 5,961 | 28,653 | 8,758 | 88,617 | 44,898 | 289,910 | 46,667 |
NOTES: See text for full names of surveys. The surveys included are those that are currently administered annually.
SOURCE: Information provided to the panel by the Census Bureau.
1999; Nordberg, 2000; Ohlsson, 1995, 1998a, 1998b, 2000), and Australia (McKenzie and Gross, 2000). It also has been used in the United States at NASS (Kott, Amrhein, and Hicks, 1998) and BLS (Butani, Robertson, and Mueller, 1998).
Sample rotation, in which a portion of the non-certainty units in the sample is replaced every year, could usefully be explored. There are several forms of rotation, some of which would rotate respondents out for a period of time and then back in (as is done in Canada, Sweden, Australia, and BLS and NASS). One technique involves assigning what is known as a “permanent random number” (PRN) between 0 and 1 to each unit on the frame (see Ohlsson, 1995). Units are sorted by the PRNs and ranges of them are selected to be in the sample. By sliding the range, a portion of the non-certainty sample can be replaced, but a substantial part of the sample would be retained. Births are accounted for by assigning a PRN to any new unit and inserting it in the ordered frame. Deaths are accounted for simply by dropping them from the sample.
Rotation does, of course, have limitations. Small establishments in certain industries can be volatile, with many starting or going out of business during a year. Consequently, rotation of samples may work best in strata of medium-sized, noncertainty units, which tend to stay in business for years-long periods of time.
RECOMMENDATION 5-5: The Census Bureau should track the response rates for the annual economic surveys that keep respondents in the sample for 5–6 years to determine whether the rates decline from year 1 to year 5 or 6.
RECOMMENDATION 5-6: The Census Bureau should study the possible benefit of establishing a sample rotation for those of the annual economic surveys that currently draw a sample only once every 5–6 years. The Bureau should also investigate synchronizing the samples for surveys that have the same population and sampling unit (enterprises or establishments).
Both sample rotation and synchronization can be expected to reduce burden on individual responding units.
5.6 ESTIMATION METHODS
Table 5-5 summarizes the types of estimators, nonresponse adjustments, variance estimation methods, and benchmarking methods used in the annual economic surveys. A Horvitz-Thompson estimator, either alone or as a part of a difference estimator or a ratio estimator, is used in seven of
TABLE 5-5 Types of Estimators, Unit Nonresponse Adjustments, Variance Estimation Methods, and Benchmarking Methods Used in the Annual Economic Surveys
| Survey | Type of Estimator | Unit Nonresponse Adjustment | Variance Estimation Method | Benchmarking |
|---|---|---|---|---|
| ASM | Horvitz-Thompson for capital expenditures, electricity, inventory reserve, and purchased services; difference estimator for all other variables | None | Formula for Poisson sampling used even though sample is now Pareto PPS | Benchmarking to most recent economic censuses results |
| M3UFO | Horvitz-Thompson estimator, which is then ratio adjusted to ASM | Not applicable | Rosen’s variance/covariance for M3UFO ratio components, combined with ASM variance as input to a Taylor series approximation | No benchmarking |
| MOPS | Weighted average of management scores for all establishments in estimation domain | Cell based; adjustment is ratio (count of 2015 ASM establishments in mailout sample that were in tabulations)/(count of 2015 ASM establishments in mailout sample that were in ASM tabulations and satisfied 2015 MOPS response criteria) | Stratified jackknife | Not applicable |
| Survey | Type of Estimator | Unit Nonresponse Adjustment | Variance Estimation Method | Benchmarking |
|---|---|---|---|---|
| ARTS | Horvitz-Thompson | No weight adjustment; imputation is used to treat unit nonresponse | Random groups | Benchmarking to most recent economic censuses results |
| AWTS | Horvitz-Thompson | Same as ARTS | Random groups | Same methods as ARTS |
| SAS | Horvitz-Thompson | Same as ARTS | Random groups | Same methods as ARTS |
| ACES | Horvitz-Thompson | Weight adjustments are based on payroll for employer businesses and on unit response rate for nonemployer businesses | Delete-a-group jackknife | No benchmarking |
| ICTSa | Horvitz-Thompson | Similar to ACES employer businesses | Delete-a-group jackknife | No benchmarking |
| ASE | Horvitz-Thompson | No weight adjustment; imputation is used to treat nonresponse | Delete-a-group jackknife | No benchmarking |
| SQ-CLASS | No published data | Not applicable | Not applicable | Not applicable |
| COS | No published data | Not applicable | Not applicable | Not applicable |
NOTES: See text for full survey names. ACES, ARTS, AWTS, M3UFO, and SAS all use the Census Bureau’s Standard Economic Processing System for point estimation, variance estimation, and imputation; see Ahmed and Tasky (2000).
aSurvey is currently suspended.
SOURCE: Information provided to the panel by the Census Bureau.
the surveys (ASM, M3UFO, ARTS, AWTS, SAS, ACES, and ASE). Horvitz-Thompson estimators of totals have the form:
![]()
where h denotes a stratum (typically a NAICS industry or NAICS × size class), sh is the set of responding sample units (also nonresponding units for ARTS, AWTS, and SAS) in the stratum, and whi is the inverse of the selection probability of sample unit hi. In some surveys (MOPS, ACES, and ICTS), whi also is adjusted for nonresponse. Nonresponding units are included in sh for ARTS, AWTS, and SAS because all data are imputed for nonrespondents in those surveys.
ASM uses Horvitz-Thompson estimation for capital expenditures, electricity, inventory reserve, and purchased services. For all other items, ASM uses a difference estimator for totals:
![]()
where Ycen,h is the total value for stratum h from the last economic census, yt,hi is the time period t value for sample unit hi, ycen,hi is the previous census value for the sample unit, and weight whi varies depending on category of establishment. For certainty units and units that do not receive a questionnaire because the Business Register is the source of information on them, the weight is 1; for noncertainty units, the weight is the inverse of the selection probability for a sample unit.
M3UFO and the Advance Monthly Retail Trade Survey, the latter of which is not part of this panel’s review, use a link relative estimator that incorporates ratio changes, rather than differences, to move the estimator forward and is constructed as:
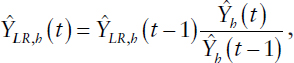
where Ŷh (t) and Ŷh (t − 1) are estimated totals for stratum h based on units that report for both times t and t – 1. Other surveys also have special-case procedures for subgroups in their samples. Estimates for aggregated industries and for the full population are obtained by summing over the strata in all surveys.
In a number of these surveys, there are frame data that may be predictive of the variables being measured in the survey. Currently, the use of the frame data is generally limited to making separate Horvitz-Thompson
estimates for detailed industry groups, as determined by the frame’s NAICS codes, and summing these to obtain higher-level aggregates. The model implicit in this procedure in STSRS is that all units in a given low-level group have the same mean, which may be too simple to be realistic.
There are other auxiliary data on the frame that also may be useful in estimation for at least some of the surveys:
- geographic location;
- legal form classification (e.g., sole proprietorship, partnership, corporation);
- federal income tax status (subject to federal tax, exempt);
- number of employees (this and other quantitative data would be for a previous time period);
- first quarter payroll;
- annual payroll;
- value of shipments, sales, receipts, or revenue;
- assets; and
- various data from the most recent economic censuses.
These frame data have the potential to be used in estimators to reduce variances. Auxiliary data are being used to some extent in a few surveys beyond treating industry as a qualitative covariate as noted above. The use of difference estimators in ASM is one example of profitably using auxiliary data.
More extensive use of frame data may improve precision. In particular, Horvitz-Thompson estimators might be replaced by some type of calibration estimator, like a general regression or raking estimator that uses both quantitative and qualitative auxiliary information. Calibration to up-to-date population controls on frame variables may adjust important survey estimates to be nearer to values that are later collected in the economic censuses, thus reducing the size of benchmark revisions.
Another avenue for exploration is whether longitudinal data can be used to a greater extent to reduce variances in the annual economic surveys, as well as providing the basis for analysis of business dynamics. Other surveys, such as BLS’s Current Population Survey (CPS), which the Census Bureau conducts, routinely use estimators that take advantage of the overlap in samples from one time period to the next. Doing so can improve precision for both cross-sectional estimates and estimates of change between time periods. Estimators that leverage longitudinal data also can have the advantage of smoothing the time series of estimates and reducing discontinuities. An example of this approach is BLS’s Local Area Unemployment Statistics program (Pfeffermann and Tiller, 2006). Modeled census division and state-level estimates take advantage of the time series of
direct CPS estimates to create current period estimates with lower variances than the CPS direct estimates. Then the sum of modeled census division estimates at a given time is constrained to be equal to the sum of the direct CPS estimates. These methods, naturally, would require adaptation to be useful in an ABSS.
Some of the annual economic surveys, such as M3UFO, ARTS, AWTS, and SAS, have certainty units as a substantial part of their samples. Any improvements using longitudinal data would apply only to the noncertainty parts of the samples.
RECOMMENDATION 5-7: The Census Bureau should systematically investigate whether auxiliary data can be used more extensively in estimation in the annual economic surveys. Such use would involve identifying which fields in a given frame are predictive of current period values for individual units and then determining how the most effective predictors can be used as covariates in calibration estimation. The Census Bureau should also investigate the use of estimators that take advantage of any overlap of samples across time to reduce variances, in addition to what is already done by difference and link relative estimators. Surveys such as the Current Population Survey can provide examples of forms of estimators to consider.
5.7 SMALL-AREA ESTIMATION
Data users interviewed by the panel were very clear about their wish for finer geographic detail from the annual economic surveys. ASM and MOPS publish state estimates, and ASE provides state and metropolitan statistical area (MSA) estimates, but users also would like MSA or county estimates from as many of the surveys as possible. The use of small-area estimation (SAE) would allow estimates for smaller geographies to be produced without increasing the sample size, provided auxiliary data on a frame can be identified that is related to the variable being estimated. (See the list of potential auxiliary variables on the Business Register in the previous section.) Data from County Business Patterns, which is based on the Business Register, may provide useful inputs to SAE. In addition to the Pfeffermann and Tiller (2006) article noted above, there is a large literature on SAE (e.g., Rao and Molina, 2015) that can provide guidance. Additional insight may be gained by talking to staff of the Bureau of Economic Analysis about their county-level business estimates that use tax data from the Internal Revenue Service along with survey data. Statistics Canada has produced documentation of its SAE for businesses (see You, 2008; You and Hidiroglou, 2012, 2014; You, Rao, and Gambino, 2003). Some of the Statistics Canada work
is reported in You, Rao, and Hidiroglou (2013). Similarly, NASS has produced extensive documentation for its agricultural county-level estimation methods (e.g., Cruze et al., 2016; Erciulescu, Cruze, and Nandram, 2016).
We are not aware of the use of SAE for the annual economic surveys, and we encourage the Census Bureau to establish a project to study the feasibility of using SAE to produce estimates for subnational geographies. It is true that SAE may be more effective in household surveys than in business surveys because of the extremely skewed variables collected in the latter. Producing higher-level aggregates like state estimates may also be easier than county and MSA estimates, but these issues can be explored as part of the research. As the samples for the surveys are redesigned, an important point to consider is whether the samples can be allocated in ways that will better support SAE. In addition, a limitation of the current system is that many of the surveys considered by the panel use enterprise as the unit of data collection (see Table 5-2, above). Data would have to be disaggregated for multi-establishment, multi-location enterprises in order to be used for SAE. For example, some large enterprises have establishments in a number of states and in different substate areas. If selected individual establishment-level data could be collected, these data could be associated with whatever small areas were of interest for users.
Another application of SAE would be to make estimates for more detailed industries than are now published. As noted in Chapter 2, users are particularly interested in more detail for the service sector. The alternative for publishing more detail would be to increase the overall sample size in services. If the budget will not support a larger sample size, however, SAE may be a feasible option for expanding the number of published categories.
Although there are many variations on how to carry out SAE, the Census Bureau does have a group in one of its research divisions that is expert in this area and should be able to advise the research (see Bell, Basel, and Maples, 2016).
RECOMMENDATION 5-8: The Census Bureau should study the feasibility of incorporating small-area estimation to produce estimates for key variables from the annual economic surveys that will better meet users’ needs for greater geographic and industry detail.
5.8 PRELIMINARY ESTIMATES
Users also expressed a desire for quicker publication of statistics from the annual economic surveys. For some surveys there can be a 2-year lag between the end of a survey’s reference year and the time of publication. To address similar concerns over publication lag, other agencies provide preliminary estimates. For example, the news release for BLS’s Current
Employment Statistics Program contains preliminary national estimates of nonfarm employment, average weekly hours, and average hourly and weekly earnings in the preceding month for industry sectors. This release is normally issued on Friday, 3 weeks after the reference week. Final estimates are published about 8 weeks after the preliminary estimates.1
There are a number of concerns with publishing preliminary estimates. Among them are determining how to process the sample data on an accelerated schedule. One option may be to designate a subsample of cases and a set of key variables that can be processed before others for the preliminary publication. Other concerns are how quickly preliminary estimates can be released and what quality standards (e.g., response rate and relative standard error) the estimates should meet to justify release. Omitting some steps in weighting may also be necessary to meet an accelerated schedule. Lastly, it will be important to communicate to users the reasons for and extent of differences between preliminary and final estimates.
RECOMMENDATION 5-9: The Census Bureau should study the feasibility of producing reliable preliminary estimates of key statistics from the annual economic surveys and, ultimately, from an Annual Business Survey System.
5.9 USE OF ALTERNATIVE DATA SOURCES IN ESTIMATION
There are many currently available alternative sources of data that could be considered as inputs to the annual economic surveys and to an ABSS once it is developed (see Chapter 4). For example, one project in the Michigan node of the National Science Foundation–Census Research Data Network involved predicting initial claims for unemployment insurance using data scraped from social media (Shapiro, 2017). It is unknown whether information from projects such as this will be useful in producing estimates on an accelerated time schedule, with less cost and/or burden, or with reduced estimated bias and/or variance. The Census Bureau can expect substantial external pressure to investigate alternative sources and either use them or justify why they cannot be used. The Bureau has already recognized the need to incorporate nonsurvey data sources to publish more timely and less expensive statistical products (Bostic, Jarmin, and Moyer, 2016; Jarmin and O’Hara, 2016). The possibility of incorporating alternative sources also has been suggested by other researchers (DeGeorge, 2016; Groshen, 2015; Horrigan, 2013).
___________________
1 See http://www.bls.gov/ces/#news (preliminary release) and https://www.bls.gov/opub/hom/pdf/homch2.pdf (final release) [November 2017].
At present, the Census Bureau uses administrative data in the Business Register in lieu of survey questionnaires to provide information for nonemployer businesses in several of the annual economic surveys, including SAS and ASE, and in the economic censuses. ASM uses Business Register data in lieu of survey questionnaires for small and medium-sized (as defined by ASM) employer businesses (see Table 4-1 in Chapter 4.) The Bureau also has experience with producing small-area estimates in other programs that rest on multiple data sources. For example, for some time it has used models to combine data from federal and state administrative records, postcensal population estimates, and the decennial census and direct estimates from the American Community Survey to provide consistent and reliable single-year poverty estimates for states, counties, and school districts.2 BLS’s Current Employment Statistics Program has used a model-based approach to improve the small-area estimates that could be produced with only survey data.3 Model-based estimates can be developed at a lower cost than adding sample or collecting new information and, once fully tested and implemented, often can produce estimates that are more timely.
Various statistical handbooks, reports, and research, particularly in the national accounts literature (see Section 2.5, “Consistency across Domains and over Time,” in Chapter 2), point to the importance of indirect means of reconciling data that may help achieve the Census Bureau’s goals of data coherence and harmonization for the annual economic surveys. Many of the balancing techniques used in input-output modeling and in reconciliation of key aggregates can be used to highlight and resolve discrepancies, duplication, and gaps in coverage. Incorporation of these techniques into the Census Bureau’s survey integration work could prove quite helpful (see, e.g., National Academies of Sciences, Engineering, and Medicine, 2017; United Nations, 2013).
RECOMMENDATION 5-10: The Census Bureau should conduct research on what alternative economic data are available and whether there are nonsurvey data sources that can be used to produce more timely estimates, more accurate estimates, or both, or otherwise supplement the annual economic surveys and, ultimately, an Annual Business Survey System.
___________________
2 See https://www.census.gov//did/www/saipe [November 2017].
3 See BLS Current Employment Statistics Technical Note at https://www.bls.gov/web/empsit/cestn.htm [November 2017].
5.10 REFERENCES
NOTE: All URL addresses were active as of November 2017.
Ahmed, S.A., and Tasky, D.L. (2000). An Overview of the Standard Economic Processing System (StEPS). Washington, DC: U.S. Department of Commerce Census Bureau. Available: https://www.oecd.org/std/30893121.pdf.
Bell, W.R., Basel, W.W., and Maples, J.J. (2016). An overview of the U.S. Census Bureau’s Small Area Income and Poverty Estimates Program. In M. Pratesi (Ed.), Analysis of Poverty Data by Small Area Estimation (pp. 349–378). Chichester, UK: John Wiley & Sons, Ltd.
Bostic, W.G., Jarmin, R.S., and Moyer, B. (2016). Modernizing federal economic statistics. The American Economic Review, 106(5), 161–164.
Butani, S., Robertson, K.W., and Mueller, K. (1998). Assigning permanent random numbers to the Bureau of Labor Statistics longitudinal (universe) data base. In Proceedings of the Section on Survey Research Methods (pp. 451–456). Alexandria VA: American Statistical Association.
Cruze, N.B., Erciulescu, A.L., Nandram, B., Barboza, W.J., and Young, L.J. (2016). Developments in model-based estimation of county-level agricultural estimates. In Proceedings of the Fifth International Conference on Establishment Surveys. Alexandria, VA: American Statistical Association. Available: http://ww2.amstat.org/meetings/ices/2016/proceedings/131_ices15Final00229.pdf.
DeGeorge, G. (2016). What are the best statistics in an era of big data? Economic Indicators, SAGE Business Researcher, February 29. Available: http://businessresearcher.sagepub.com/sbr-1775-98221-2719279/20160229/economic-indicators.
Erciulescu, A.L., Cruze, N.B., and Nandram, B. (2016). County-level crop estimates: Incorporating auxiliary sources of information. In Proceedings of the Survey Research Methods Section (pp. 3591–3605). Alexandria, VA: American Statistical Association. Available: https://ww2.amstat.org/MembersOnly/proceedings/2016/data/assets/pdf/389784.pdf.
Groshen, E. (2015). Government and Big Data: What’s Our Future? Available: https://www.aei.org/wp-content/uploads/2015/02/Groshen-presentation-3.12.pdf.
Haraldsen, G., Jones, J., Giesen, D., and Zhang, L.-C. (2013). Understanding and coping with response burden. In G. Snijkers, G. Haraldsen, J. Jones, and D.K. Willimack (Eds.), Designing and Conducting Business Surveys (Ch. 6). Hoboken NJ: John Wiley & Sons.
Horrigan, M.W. (2013). Big data: A perspective from the BLS. Amstat News, January 1. Available: http://magazine.amstat.org/blog/2013/01/01/sci-policy-jan2013.
Isaki, C.T., and Fuller, W.A. (1982). Survey design under the regression superpopulation model. Journal of the American Statistical Association, 77(377), 89–96.
Jarmin, R.S., and O’Hara, A.B. (2016). Big data and the transformation of public policy analysis. Journal of Policy Analysis and Management, 35(3), 715–721.
Kott, P.S., Amrhein, J.F., and Hicks, S.D. (1998). Sampling and estimation from multiple list frames. Survey Methodology, 24(1), 3–10.
Kroeger, H., Särndal, C.-E., and Teikari, I. (1999). Poisson mixture sampling: A family of designs for coordinated selection using permanent random numbers. Survey Methodology, 25(1), 3–11.
McKenzie, R., and Gross, B. (2000). Synchronized sampling. In Proceedings of the Second International Conference on Establishment Surveys (pp. 237–244). Alexandria VA: American Statistical Association.
National Academies of Sciences, Engineering, and Medicine. (2017). Innovations in Federal Statistics: Combining Data Sources While Protecting Privacy. Washington, DC: The National Academies Press. doi: https://doi.org/10.17226/24652.
Nordberg, L. (2000). On variance estimation for measures of change when samples are coordinated by the use of permanent random numbers. Journal of Official Statistics, 16(4), 363–378.
Ohlsson, E. (1995). Coordination of samples using permanent random numbers. In B. Cox, D. Binder, B. Chinnappa, A. Christianson, M. Colledge, and P. Kott (Eds.), Business Survey Methods (Ch. 9, pp. 153–170). New York: John Wiley & Sons.
Ohlsson, E. (1998a). Sequential Poisson sampling. Journal of Official Statistics, 14(2), 149–162.
Ohlsson, E. (1998b). Spreading respondent burden and updating samples by using permanent random numbers. In Methodological Issues in Official Statistics. Stockholm: Statistics Sweden.
Ohlsson, E. (2000). Coordination of PPS samples over time. In Proceedings of the Second International Conference on Establishment Surveys (pp. 255–264). Alexandria VA: American Statistical Association.
Pfeffermann, D., and Tiller, R. (2006). Small-area estimation with state-space models subject to benchmark constraints. Journal of the American Statistical Association, 101(476), 1387–1397.
Rao, J.N.K., and Molina, I. (2015). Small Area Estimation (2nd Edition). New York: John Wiley & Sons.
Royce, D. (2000). Issues in coordinated sampling at Statistics Canada. In Proceedings of the Second International Conference on Establishment Surveys (pp. 245–254). Alexandria VA: American Statistical Association.
Särndal, C.E., Swensson, B., and Wretman, J. (1992). Model Assisted Survey Sampling. New York: Springer.
Shapiro, M. (2017). Prediction of Initial Claims for Unemployment Insurance. Available: http://econprediction.eecs.umich.edu.
Smith, P. (2013). Sampling and estimation for business surveys. In G. Snijkers, G. Haraldsen, J. Jones, and D.K. Willimack (Eds.), Designing and Conducting Business Surveys (Ch. 5). Hoboken, NJ: John Wiley & Sons.
Srinath, K.P., and Carpenter, R.M. (1995). Sampling methods for repeated business surveys. In B. Cox, D. Binder, B. Chinnappa, A. Christianson, M. Colledge, and P. Kott (Eds.), Business Survey Methods (Ch. 10, pp. 171–184). New York: John Wiley & Sons.
United Nations. (2013). Guidelines on Integrated Economic Statistics. Studies in Methods, Series F, No. 108. New York: Author. Available: https://unstats.un.org/unsd/nationalaccount/docs/IES-Guidelines-e.pdf.
Valliant, R., Dever, J.A., and Kreuter, F. (2013). Practical Tools for Designing and Weighting Survey Samples. New York: Springer.
You, Y. (2008). Small Area Estimation Using Area Level Models with Model Checking and Applications. Paper presented at Statistical Society of Canada Annual Meeting, Ottawa, Canada, May. Available: https://pdfs.semanticscholar.org/6382/9106765da8f9bda5475496b024417832fc86.pdf.
You, Y., and Hidiroglou, M. (2012) Sampling Variance Smoothing Methods for Small Area Proportion Estimators. Methodology Branch Working Paper, SRID-2012-08E. Ottawa: Statistics Canada.
You, Y., and Hidiroglou, M. (2014). Modelbased Small Area Unemployment Rate Estimation Using the Crosssectional FayHerriot Model. Methodology Branch Working Paper, SRID-2015. Ottawa: Statistics Canada.
You, Y., Rao, J.N.K., and Gambino, J. (2003). Model-based unemployment rate estimation for the Canadian Labour Force Survey: A hierarchical Bayes approach. Survey Methodology, 29(1), 25–32.
You, Y., Rao, J.N.K., and Hidiroglou, M. (2013). On the performance of self benchmarked small area estimators under the Fay-Herriot area level model. Survey Methodology, 39(1), 217–229.


