
6
Packages of Policies and Programs That Reduce Poverty and Deep Poverty Among Children
As Chapter 5 made clear, none of the policy and program options that the committee identified could, by itself, meet the goal of reducing child poverty by 50 percent. As for reducing deep poverty by 50 percent, the simulations showed that only the more substantial $3,000 per child per year child allowance policy could achieve that goal. The failure of these options to meet our ambitious poverty-reduction goals can be attributed in part to the generally modest scope of the options themselves. Very few were estimated to cost more than $10 billion, and some (e.g., WorkAdvance and increases in the Earned Income Tax Credit [EITC]) were focused on the goal of encouraging paid work at least as much as that of reducing child poverty.
This chapter presents the committee’s ideas for ways to achieve our 50 percent child poverty-reduction goal. One approach to achieving that goal would be simply to increase the generosity of some of the individual programs presented in the last chapter. However, the committee instead chose to take an approach of combining programs to form coordinated packages that might achieve the 50 percent goal. A package approach offers some formidable advantages over an individual program approach. Most importantly, program packages are better able to address both poverty reduction and work incentive goals by combining programs that emphasize each of them. As shown in Chapter 5, expansions to income support programs such as the Supplemental Nutrition Assistance Program (SNAP) or housing vouchers were relatively effective at reducing child poverty, but they also reduced employment and earnings. Work support programs such as EITC and the Child and Dependent Care Tax Credit (CDCTC) encouraged work
but produced only modest reductions in child poverty. Packages combining these two types of programs have the potential to achieve substantial reductions in child poverty while simultaneously boosting employment and earnings.
Here too, as throughout this report, the 10-year window in the committee’s Statement of Task leads us to focus on packages of policies and programs that produce short-run reductions in child poverty. And, as was explained in Chapter 5 and further discussed in Chapter 7, the absence of sufficiently rigorous research evidence led us to omit from our packages policies involving marriage promotion and reforms to the Temporary Assistance for Needy Families (TANF) Program.
Because different packages of programs weight poverty reduction, employment incentives, and other policy goals in different ways, the committee developed four packages, each oriented toward a different mixture of policy goals.
Our first package, the “Work-Based Package,” focuses exclusively on paid employment by combining expansions of two tax credits (EITC and CDCTC) with an increase in the minimum wage and a scaling-up of the WorkAdvance Program described in Chapter 5 (see Table 6-1).
Our second package, the “Work-Based and Universal Supports Package,” builds on the work-based package by combining expansions of its two tax credits (EITC and CDCTC) with a $2,000 child allowance designed to expand the reach of the Child Tax Credit.
Our third package, the “Means-Tested Supports and Work Package,” combines expansions of the two tax credits in the work-oriented package with expansions of two existing income support programs: SNAP and housing voucher programs.
The fourth package, the “Universal Supports and Work Package,” seeks to enhance income security and stability, reward work, and promote social inclusion. The cornerstone of this fourth package is a $2,700 per child per year child allowance, but the package also includes a new child support assurance program, an expansion of the EITC and CDCTC, an increase in the minimum wage, and elimination of the immigrant restrictions imposed by the 1996 welfare reforms.
Each package is detailed below along with its rationale. This is followed by our estimates of each package’s impacts on poverty and paid employment, as well as its costs.
A WORK-BASED POVERTY-REDUCTION PACKAGE
Our proposed Work-Based Package contains four elements, with the policies numbered as they were in Chapter 5:
TABLE 6-1 Components of the Four Packages
| 1. Work-Oriented Package | 2. Work-Based and Universal Supports Package | 3. Means-Tested Supports and Work Package | 4. Universal Supports and Work Package | ||
|---|---|---|---|---|---|
| Work-Oriented Programs and Policies | Expand EITC | X | X | X | X |
| Expand CDCTC | X | X | X | X | |
| Increase the Minimum Wage | X | X | |||
| Roll out WorkAdvance | X | ||||
| Income Support-Oriented Programs and Policies | Expand Housing Voucher Program | X | |||
| Expand SNAP Benefits | X | ||||
| Begin a Child Allowance | X | X | |||
| Begin Child Support Assurance | X | ||||
| Eliminate 1996 Immigration Eligibility Restrictions | X | ||||
NOTE: CDCTC = Child and Dependent Care Tax Credit, EITC = Earned Income Tax Credit, SNAP = Supplemental Nutrition Assistance Program.
- EITC Policy #1: Increase payments along the phase-in and flat portions of the EITC schedule.
- Child Care Policy #1: Convert the CDCTC to a fully refundable tax credit and concentrate its benefits on families with the lowest incomes and with children under age 5.
- Minimum Wage Policy #1: Raise the current $7.25 per hour federal minimum wage to $10.25 and index it to inflation after it is implemented.
- WorkAdvance Policy #2: All male heads of families with children and income below 200 percent of the poverty line would be eligible for WorkAdvance programming. Training slots would be created for 30 percent of eligible men.
We estimate that this package of programs would cost only about $9 billion per year (with tax rules prevailing both before and after the 2018 Tax Cut and Jobs Act). However, our simulations showed that it does not come
close to reaching the 50 percent reduction goal for either 100 percent Supplemental Poverty Measure (SPM) poverty or for deep (<50% SPM) poverty.
Rationale for the Work-Based Package
It is widely recognized, and also demonstrated in this report, that low levels of work and earnings are responsible for a substantial portion of the high poverty rates in the United States. As seen in Chapter 4, for example, the sharp increase in single mothers’ employment meant that changes in employment, rather than changes in family structure, were the most important factor in explaining recent poverty trends. And in their analysis of differences in total family income between the top two-thirds and bottom one-third of families with an able-bodied head between ages 25 and 54, Sawhill, Rodrigue, and Joo (2016) show that the difference in earned income between the two groups explains the lion’s share of the difference in their incomes and plays a much more important role than differences in unearned income (including transfer benefits).
Our Work-Based Package consists of four programs that provide either additional work incentives beyond those currently embedded in the U.S. transfer system or additional supplements to low-income working families, or both. As shown in Chapter 5, expanding the EITC and CDCTC do both, so we include those two programs in this package. As discussed in the WorkAdvance section of Chapter 5, evaluations of that program have shown considerable promise for increasing men’s earnings. Finally, while an increase in the minimum wage reduces work to some extent, the major impact of such an increase is to supplement the earnings of unskilled workers.
A WORK-BASED AND UNIVERSAL SUPPORTS POVERTY-REDUCTION PACKAGE
As shown above, the Work-Based Package is unable to make much of a dent in poverty and deep poverty among children, which led the committee to formulate three additional packages, all of which combine work-based and income-support strategies. In the case of our Work-Based Plus Universal Supports package, we combined three policies from Chapter 5 that proved to be unusually cost-effective in either reducing poverty and deep poverty or promoting work:
- EITC Policy #1: Increase payments along the phase-in and flat portions of the EITC schedule.
- Child Care Policy #1: Convert the CDCTC to a fully refundable tax credit and concentrate its benefits on families with the lowest incomes and with children under age 5.
- Child Allowance Policy #1: Pay a monthly benefit of $166 per month ($2,000 per year) per child to the families of all children under age 17 who were born in the United States or are naturalized citizens.
We estimate that this package of programs would cost about $44 billion per year (regardless of whether the pre- or post-2018 tax code is used) and reduce child poverty by about one-third and deep poverty by about 40 percent—both of which fall short of the 50 percent poverty-reduction goals.
Rationale for the Work-Based and Universal-Supports Package
As noted for the first package—the Work-Based Package—two of the policy options detailed in Chapter 5 appeared to be unusually effective at combining strong work incentives and a relatively low budget cost:
- EITC Policy #1 was estimated to increase employment among adults in low-income families by about 270,000 and earnings by $4.9 billion, at an annual cost of $8.4 billion.1
- Child Care Policy #1 provided even more potent work incentives, increasing employment by more than 500,000 and earnings by around $9 billion. Its annual cost was estimated to be $5.1 billion.
But while both of these policy options performed well on work incentives and cost, their impacts on child poverty (an estimated 1.2 percentage-point reduction in the 13.0 percent child poverty rate and a 0.2 to 0.3 percentage-point reduction in the 2.9 percent rates of children living in deep poverty) fell far short of the committee’s mandated 50 percent poverty-reduction goal. The committee therefore coupled these components with a relatively low-cost income support component also presented in Chapter 5:
- Child Allowance Policy #1: Pay a monthly benefit of $166 per month ($2,000 per year) per child to the families of all children under age 17, which was estimated to reduce the child poverty rate by 3.0 to 3.4 percentage points and the 2.9 percent rate of deep poverty by 1.0 to 1.1 percentage points, depending on the prevailing tax law. This policy’s estimated annual cost was $33 billion.
___________________
1 To simplify our discussion of cost, we will use estimates based on the tax code prevailing in 2015, the base year for the report. We will draw attention to instances where cost estimates differ significantly before and after the 2018 Tax Cut and Jobs Act. Details on the costs of all of the programs and program packages we present at provided in Tables 6-2 and 6-3 as well as Appendix E.
TABLE 6-2 Simulated Poverty Reduction, Cost, and Employment Changes Associated with Four Poverty-Reduction Packages, Based on the 2015 Tax Law
| Poverty-Reduction Package | Reduction in Poverty (<100% TRIM3 SPM Poverty) | Reduction in Deep Poverty (<50% TRIM3 SPM Poverty) | Total Change in Government Spending (millions) | Only Families with Incomes < 200% TRIM3 SPM | |||
|---|---|---|---|---|---|---|---|
| Net Change in Earnings (millions) | Net Change in Jobs | ||||||
| 1. Work-Based | −2.5 | −18.8% | −0.6 | −19.3% | $8,654 | $18,395 | 1,002,959 |
| Expand EITC | −1.2 | −9.4% | −0.2 | −6.9% | $8,384 | $4,910 | 269,713 |
| Expand CDCTC | −1.2 | −9.1% | −0.3 | −10.3% | $5,141 | $9,342 | 518,085 |
| Increase minimum wage | −0.2 | −1.3% | 0.0 | 0.0% | −$3,688 | $3,488 | −42,347 |
| Roll out WorkAdvance | −0.1 | −1.0% | −0.1 | −3.4% | −$801 | $2,591 | 408,148 |
| 2. Work−Based and Universal Supports | −4.6 | –35.6% | −1.2 | −41.3% | $44,536 | $9,921 | 567,722 |
| Expand EITC | −1.2 | −9.4% | −0.2 | −6.9% | $8,384 | $4,910 | 269,713 |
| Expand CDCTC | −1.2 | −9.1% | −0.3 | −10.3% | $5,141 | $9,342 | 518,085 |
| Begin a $2,000 child allowance | −3.4 | −25.9% | −1.1 | 37.9% | $32,904 | –$1,627 | −68,434 |
| 3. Means-Tested Supports and Work | −6.6 | −50.7% | −1.5 | −51.7% | $90,732 | $2,188 | 404,243 |
| Expand EITC | −1.2 | −9.4% | −0.2 | −6.9% | $8,384 | $4,910 | 269,713 |
| Expand CDCTC | −1.2 | −9.1% | −0.3 | −10.3% | $5,141 | $9,342 | 518,085 |
| Expand Housing Voucher Program | −3.0 | −22.7% | −0.9 | −31.0% | $34,916 | −$5,923 | −93,181 |
| Expand SNAP Benefits by 35% | −2.6 | −20.2% | −0.8 | −27.6% | $43,075 | −$3,812 | −164,392 |
| 4. Universal Supports and Work | −6.8 | −52.3% | −1.6 | −55.1% | $108,771 | $13,447 | 611,182 |
| Expand EITC by 40% | −2.1 | −16.0% | −0.4 | −13.8% | $20,206 | $9,065 | 541,366 |
| Expand CDCTC | −1.2 | −9.1% | −0.3 | −10.3% | $5,141 | $9,342 | 518,085 |
| Increase minimum wage | −0.2 | −1.3% | 0.0 | 0.0% | −$3,688 | $3,488 | −42,347 |
| Begin a $2,700 child allowance | −4.6 | −35.7% | −1.3 | −44.8% | $77,901 | −$2,649 | −103,547 |
| Begin child support assurance | −0.2 | −1.9% | −0.1 | −3.4% | $5,660 | −$190 | −10,145 |
| Eliminate 1996 immigration eligibility restrictions | −0.1 | −1.0% | 0.0 | 0.0% | $3,933 | −$483 | −13,183 |
NOTES: Components do not add to package totals owing to redundancies and other interactions across programs (see Appendix F). CDCTC = Child and Dependent Care Tax Credit, EITC = Earned Income Tax Credit, SNAP = Supplemental Nutrition Assistance Program, TRIM3 = Urban Institute’s Transfer Income Model, version 3 microsimulation model.
SOURCE: Analyses commissioned by the committee using TRIM3.
TABLE 6-3 Simulated Poverty Reduction, Cost, and Employment Changes Associated with Four Poverty-Reduction Packages, Based on the 2018 Tax Law
| Poverty-Reduction Package | Reduction in <100% TRIM3 SPM Poverty | Reduction in <50% TRIM3 SPM Poverty | Total Change in Government Spending (millions) | Only Families with Incomes < 200% TRIM3 SPM | |||
|---|---|---|---|---|---|---|---|
| Net Change in Earnings (millions) | Net Change in Jobs | ||||||
| 1. Work-Based | −2.4 | −19.2% | −0.5 | −17.9% | $9,362 | $18,011 | 987,497 |
| Expand EITC | −1.2 | −9.8% | −0.2 | −7.1% | $8,522 | $4,910 | 269,713 |
| Expand CDCTC | −1.2 | −9.3% | −0.2 | −7.1% | $5,465 | $9,070 | 502,982 |
| Increase minimum wage | −0.1 | −1.2% | 0.0 | 0.0% | −$3,419 | $3,431 | −42,347 |
| Roll out WorkAdvance | −0.2 | −1.3% | −0.1 | −3.6% | −$744 | $93 | 406,179 |
| 2. Work-Based and Universal Supports | −4.3 | −33.7% | −1.2 | −41.3% | $44,278 | $10,185 | 563,000 |
| Expand EITC | −1.2 | −9.8% | −0.2 | −7.1% | $8,522 | $4,910 | 269,713 |
| Expand CDCTC | −1.2 | −9.3% | −0.3 | −7.1% | $5,465 | $9,070 | 502,982 |
| Begin a $2,000 child allowance | −3.0 | −23.9% | −1.1 | −34.5% | $32,553 | −$1,088 | −60,000 |
| 3. Means-Tested Supports and Work | −6.3 | −50.3% | −1.5 | −53.6% | $90,771 | $1,985 | 393,810 |
| Expand EITC | −1.2 | −9.8% | −0.2 | −7.1% | $8,522 | $4,910 | 269,713 |
| Expand CDCTC | −1.2 | −9.3% | −0.2 | −7.1% | $5,465 | $9,070 | 502,982 |
| Expand Housing Voucher Program | −2.8 | −22.6% | −0.8 | −28.6% | $34,706 | −$5,904 | −93,181 |
| Expand SNAP benefits by 35% | −2.5 | −19.6% | −0.8 | −28.6% | $42,969 | −$3,760 | −161,332 |
| 4. Universal Supports and Work | −6.5 | −51.3% | −1.5 | −53.6% | $111,625 | $13,687 | 613,000 |
| Expand EITC by 40% | −2.0 | −16.0% | −0.4 | −14.3% | $20,446 | $9,298 | 546,747 |
| Expand CDCTC | −1.2 | −9.3% | −0.2 | −7.1% | $5,465 | $9,070 | 502,982 |
| Increase minimum wage | −0.1 | −1.2% | 0.0 | 0.0% | −$3,419 | $3,431 | −42,347 |
| Begin a $2,700 child allowance | −4.3 | −34.5% | −1.3 | −46.4% | $85,469 | −$2,329 | −98,000 |
| Begin child support assurance | −0.3 | −2.0% | −0.1 | −3.6% | $5,650 | −$189 | −10,145 |
| Eliminate 1996 immigration eligibility restrictions | −0.2 | −1.4% | 0.0 | 0.0% | $4,844 | −$483 | −13,183 |
NOTES: Components do not add to package totals owing to redundancies and other interactions across programs (see Appendix F). Simulations are based on the Federal Income Tax provisions prevailing in 2018. CDCTC = Child and Dependent Care Tax Credit, EITC = Earned Income Tax Credit, SNAP = Supplemental Nutrition Assistance Program, TRIM3 = Urban Institute’s Transfer Income Model, Version 3 microsimulation model.
SOURCE: Analyses commissioned by the committee from TRIM3.
The principal rationale for a child allowance paid on a monthly basis is that it would provide a steady, predictable source of income to counteract the irregularity and unpredictability of market income (as described in Chapter 8). Because the child allowance would be available to both low-income and middle-class families, it would carry little stigma and would not be subject to the varying rules and administrative discretion of a means-tested program, thereby promoting social inclusion. As we saw in Chapter 5, the incremental cost of our proposed version of a $2,000 per child per year child allowance would be $32.9 billion using either the 2015 or 2018 tax law. In addition there would be the administrative costs from having the Social Security Administration pay the monthly benefits.
Although this second package—Work-Based and Universal Supports—failed to reach the 50 percent poverty-reduction goals, its combination of substantial child poverty reduction, positive impacts on employment and earnings, and cost led the committee to judge it to be of sufficient policy interest to include in this report.
A MEANS-TESTED SUPPORTS AND WORK POVERTY-REDUCTION PACKAGE
Our third and fourth policy packages were formulated in ways that fully met the 50 percent poverty-reduction goals set by the committee’s charge. Both combined work-based and income support enhancements. We call the third package a Means-Tested Supports and Work Package because it would expand four existing programs:
- EITC Policy #1: Increase payments along the phase-in and flat portions of the EITC schedule.
- Child Care Policy #1: Convert the CDCTC to a fully refundable tax credit and concentrate its benefits on families with the lowest incomes and with children under age 5.
- A modification of SNAP Policy #2: Chapter 5’s version of SNAP Policy #2 increases SNAP benefits by 30 percent as well as increasing benefits for older children and would be provided through the Summer Electronic Benefit Transfers for Children. In order to reach the 50 percent poverty-reduction goal, we included in this program package a 35 percent rather than a 30 percent increase in the basic SNAP benefit.
- Housing Voucher Policy #2: Increase the number of vouchers directed to families with children so that 70 percent of eligible families that are not currently receiving subsidized housing would use them.
We estimate that this package of programs would cost $90.7 billion per year and would achieve 50 percent reductions in both poverty and deep poverty for children.
Rationale for the Means-Tested Supports and Work Package
Developing a strategy to reduce child poverty by one-half within 10 years using existing programs provides a number of benefits. First, the congressional authorization, administrative regulations, and administrative implementation procedures for existing programs have been developed and are currently operating. Consequently, changes in these programs could be implemented rapidly and begin to yield reductions in child poverty rates soon after implementation.
It is obvious from a review of the poverty reductions associated with existing programs as set out in Chapter 5 (refer to Figures 5-1 and 5-2) that the largest poverty-reducing impacts result from our modifications to four of them—the EITC, the CDCTC, housing vouchers, and SNAP. Since both the EITC and the CDCTC condition families’ receipt of benefits on employment, both have positive impacts on employment and earnings, but at the same time both are relatively less effective in reducing deep poverty (<50% of SPM) than means-tested programs like SNAP. While expanding the housing voucher and SNAP programs would generate disincentives for work, it would also boost the economic resources for children in families with incomes near the thresholds that define both poverty and deep poverty. The committee judged that the combination of the four program expansions included in this income and work supports package would provide a good balance for meeting the 50 percent poverty-reduction goals by combining work-based and income-support program expansions.
A UNIVERSAL SUPPORTS AND WORK POVERTY-REDUCTION PACKAGE
The fourth package we devised and evaluated combines work incentives, economic security, and social inclusion with some existing programs, plus two new programs introduced in Chapter 5:
- EITC Policy #2: Increase payments by 40 percent across the entire schedule, keeping the current range of the phase-out region.
- Child Care Policy #1: Convert the CDCTC to a fully refundable tax credit and concentrate its benefits on families with the lowest incomes and with children under age 5.
- Minimum Wage Policy #1: Raise the current $7.25 per hour federal minimum wage to $10.25 and index it to inflation after it is implemented.
- Immigration Policy #1: Restore program eligibility for nonqualified legal immigrants. This option would eliminate eligibility restrictions for nonqualified parents and children in the SNAP, TANF, Medicaid, SSI, and other means-tested federal programs.
- A modification of Child Allowance Policy #1: Pay a monthly benefit of $225 per month ($2,700 per year) per child to the families of all children under age 17. Extending beyond citizen children, and consistent with Immigration Policy #1, this child allowance would also be paid to currently nonqualified legal immigrants. To barely reach the 50 percent poverty-reduction goal, we set the monthly benefit level at $225 rather than the $166 or $250 levels included in the Chapter 5 versions of the child allowance policy.
- Child Support Assurance Policy #1: Set a guaranteed minimum child support of $100 per month per child.
We estimate that this package of programs would cost $108.8 billion per year under the federal income tax provisions prevailing before 2018, and $111.6 billion per year based on the current tax law. It too would achieve the 50 percent poverty-reduction goals.
Rationale for the Universal Supports and Work Package
Chapter 5 results for individual programs show that the two child allowances would produce the largest impacts on both poverty (<100% SPM) and deep poverty (<50% SPM) for children, but at the same time generate work disincentives. Because supporting work as a long-term solution for child poverty was one of the criteria developed by the committee, our third proposed package combines economic security and work supports in ways that would reduce child poverty and deep child poverty, enhance security and income stability, provide significant incentives for market-based work, and promote social inclusion.
This package provides a child allowance that is similar in value to what most taxpayers now receive for their children through child tax credits and tax exemptions, combined with three work-enhancing features: an expanded EITC and CDCTC and a higher federal minimum wage. To this we add one of the Child Support Assurance policies and an additional feature that promotes equity and social inclusion—an extension of benefits to include immigrant children.
As we saw in Chapter 5, simulations showed that the incremental cost of our proposed version of a $2,000 per child per year child allowance
would be $32.9 billion annually. In order to meet its 50 percent poverty-reduction goal, the committee increased child allowance benefit levels in the Universal Supports and Work Package to $2,700, which adds about $45 billion to its annual cost. An assured child support benefit, also paid on a monthly basis, would provide a somewhat larger measure of economic security to single-parent families legally entitled to private child support. With such an assured benefit set at $1,200 per year, coupled with the child allowance it would all but erase deep child poverty, while also reducing economic insecurity and unpredictability.
To increase the incentives for market work, the package also includes a 40 percent increase in EITC benefits, an increase in the CDCTC, and an increase in the minimum wage. Each of these elements rewards those who choose market work, even parents who have young children and cannot work full time. Finally, to further promote inclusivity, we include in the universal supports and work package the restoration of program eligibility for nonqualified legal immigrants.
SIMULATING THE IMPACTS OF THE FOUR PROGRAM PACKAGES
As explained in Appendix F, simulating the impacts of packages of programs is difficult—even more difficult than simulating impacts of individual program and policy changes. For example, the simulation program must model people’s movements into and out of the labor force as the result of policy changes. All four of our packages include expansions of both the EITC and the CDCTC, and each of these two policies might induce an individual to enter the labor force. But since an individual can only enter the labor market once in response to the package, both policies cannot be estimated to produce this effect. As explained in Appendix F, the committee sought reliable estimates of package impacts by adopting conservative assumptions about these kinds of duplications. While these assumptions might be expected to produce reasonable estimates of impacts, we caution against attaching too much weight to the precise numbers generated by the simulations.
Comparisons Across the Four Packages
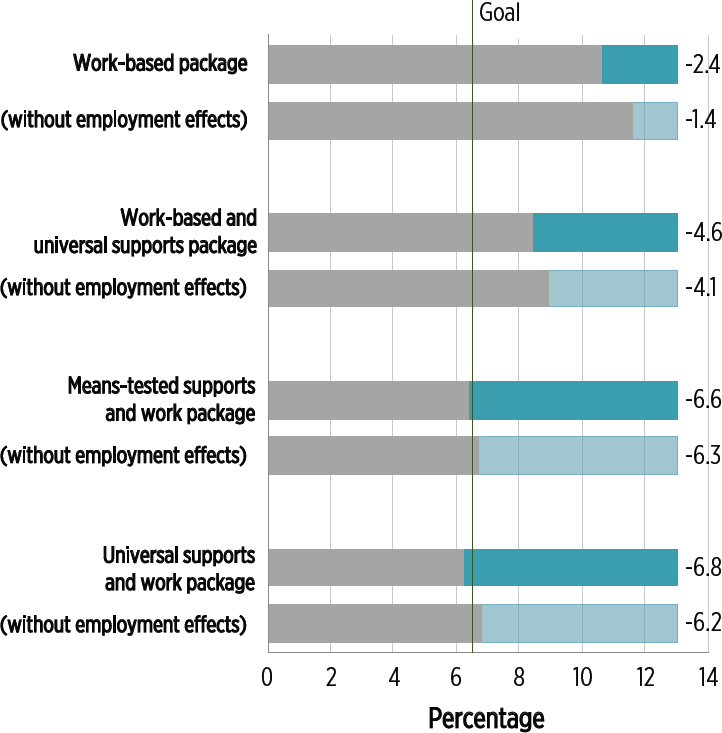
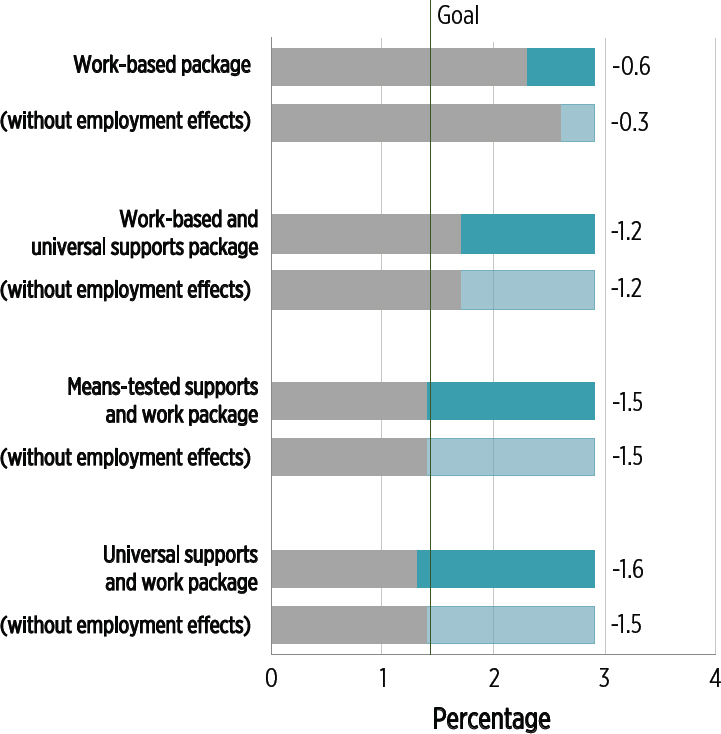
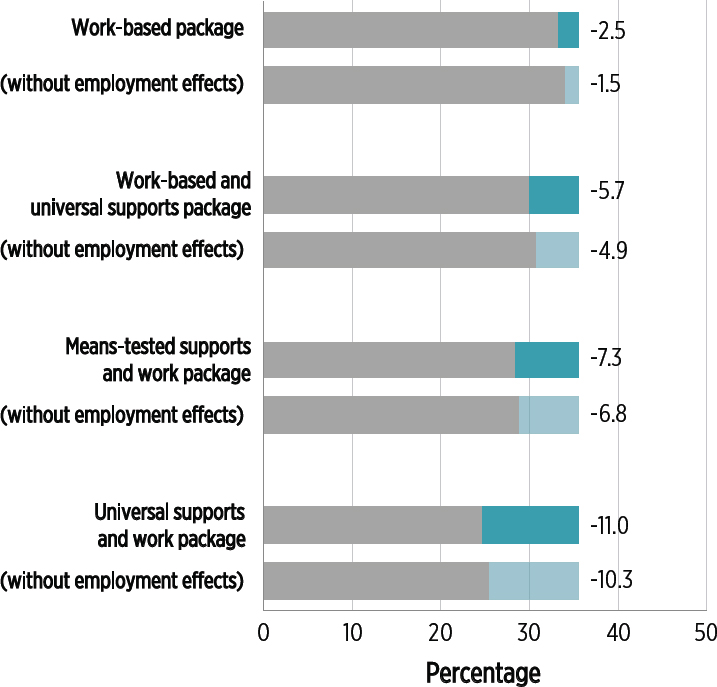
The simulated poverty-reducing impacts of the four packages are shown in Figure 6-1 for 100 percent poverty, in Figure 6-2 for deep poverty, and in Figure 6-3 for near poverty. As elsewhere in our simulations, the poverty definition here is based on SPM poverty, deep poverty is defined as below 50 percent of the SPM poverty line, and near poverty is defined as below 150 percent of the SPM poverty line.
NOTES: “Work-oriented package” combines expansions of the Earned Income Tax Credit (EITC), minimum wage, the Child and Dependent Care Tax Credit (CDCTC), and WorkAdvance. “Work-based and universal supports package” combines expansions of the EITC, the CDCTC, and a child allowance. “Means-tested supports and work package” combines expansions of the EITC, the CDCTC, Supplemental Nutrition Assistance Program, and housing vouchers. “Universal supports and work package” combines expansions of the EITC, minimum wage, and the CDCTC with child support assurance, restoration of immigrant program eligibility, and a child allowance.
SOURCE: Estimates from TRIM3 commissioned by committee. The vertical line indicates 50% reduction goal.
NOTES: “Work-oriented package” combines expansions of the Earned Income Tax Credit (EITC), minimum wage, the Child and Dependent Care Tax Credit (CDCTC), and WorkAdvance. “Work-based and universal supports package” combines expansions of the EITC, the CDCTC, and a child allowance. “Means-tested supports and work package” combines expansions of the EITC, the CDCTC, Supplemental Nutrition Assistance Program, and housing vouchers. “Universal supports and work package” combines expansions of the EITC, minimum wage, and the CDCTC with child support assurance, restoration of immigrant program eligibility, and a child allowance. The vertical line indicates 50% reduction goal.
SOURCE: Estimates from TRIM3 commissioned by the committee.
NOTES: “Work-oriented package” combines expansions of the Earned Income Tax Credit (EITC), minimum wage, the Child and Dependent Care Tax Credit (CDCTC), and WorkAdvance. “Work-based and universal supports package” combines expansions of the EITC, the CDCTC, and a child allowance. “Means-tested supports and work package” combines expansions of the EITC, the CDCTC, Supplemental Nutrition Assistance Program, and housing vouchers. “Universal supports and work package” combines expansions of the EITC, minimum wage, and the CDCTC with child support assurance, restoration of immigrant program eligibility, and a child allowance.
SOURCE: Estimates from TRIM3 commissioned by the committee.
Given that some of the components in the third and fourth packages were expressly designed to meet the committee’s 50 percent poverty-reduction goal, it is unsurprising that both packages succeeded in doing that. Both the third package, based on means-tested supports and work, and the fourth package, based on universal supports and work, were estimated to reduce the 13 percent SPM child poverty rate by at least 6.6 percentage points (refer to Figure 6-1). By contrast, the first package, which is focused on work alone, falls far short of meeting the reduction goal, achieving only a 2.4 percentage-point reduction in child poverty. The second package, which combines relatively low-cost work-based and universal supports components, would reduce child poverty and deep child poverty considerably but not enough to meet the 50 percent reduction goal.
Figure 6-1 also shows projected poverty reduction in the absence of the employment-related behavioral responses elicited by the program packages. In the case of the work-oriented package, all four components incentivize paid employment, thereby nearly doubling the poverty-reducing impact of the policy package, from −1.4 to −2.4 percentage points. The behavioral impacts of the other three packages are considerably smaller but do boost employment and reduce child poverty. This is because the work-incentivizing effects of the subcomponents that are work-oriented outweigh the work-disincentivizing effects of the purely transfer subcomponents. Employment and earnings increases add more than half a percentage point to the poverty-reducing impacts of the universal supports and work package but only about one-third of a point to the poverty-reducing impacts of the means-tested and work supports package.
Package-induced reductions in deep poverty parallel those found when the line is drawn at 50 percent of poverty (refer to Figure 6-2). Both the means-tested support and work package and the universal supports and work package were estimated to achieve the goal of 50 percent reduction in deep poverty, while the work-oriented package falls far short, even though relatively strong work incentives in the work-oriented package double its ability to reduce deep poverty. Both the third and fourth packages have positive impacts on employment and earnings, but these impacts are relatively small; consequently, the differences in estimated poverty reduction with and without employment effects are small as well. When the threshold is set at 150 percent SPM poverty, the second, third, and fourth packages again outperform the work-oriented package (refer to Figure 6-3).
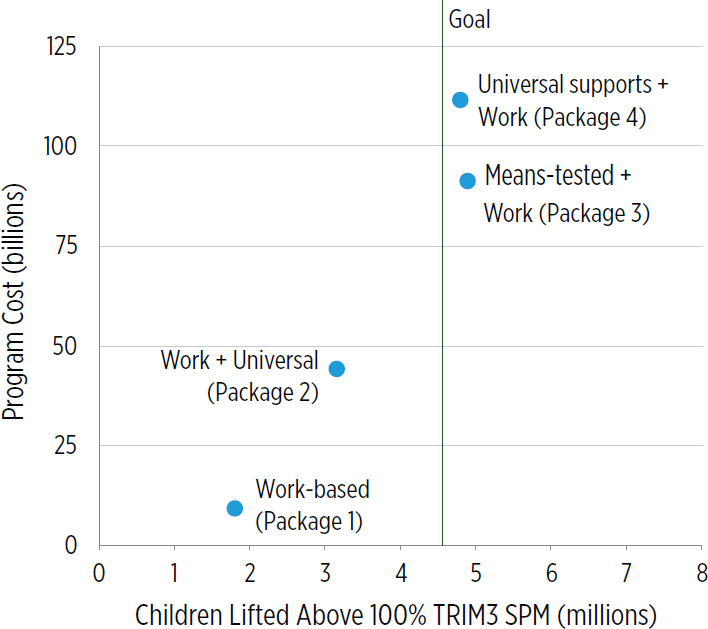
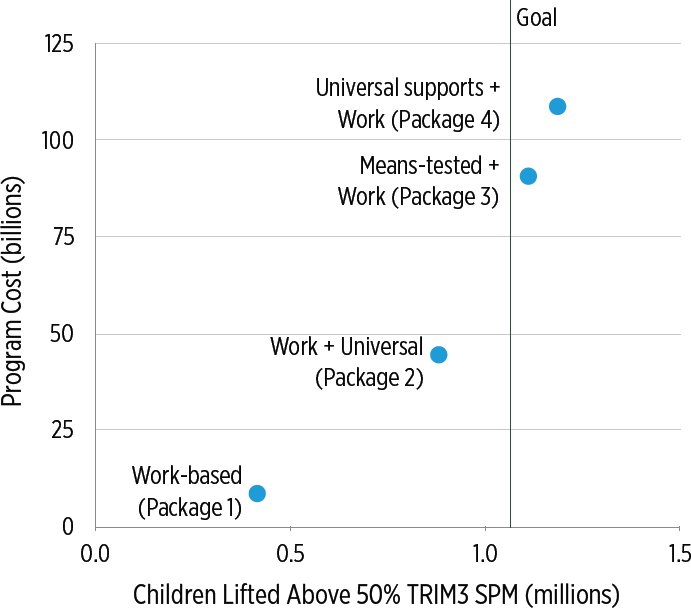
It is also useful to examine the tradeoffs between poverty reduction and budget cost across the four packages (see Figure 6-4), as we did for the individual packages in Chapter 5. The linear nature of the tradeoffs between program cost and poverty reduction, when the poverty line is drawn at 100 percent of SPM poverty, is quite apparent in Figure 6-4. The first, work-based, package is estimated to cost relatively little ($8.6 to $9.4
SOURCE: Estimates from TRIM3 commissioned by committee.
billion annually, depending on the tax code—refer to Tables 6-2 and 6-3) but lifts only 1.8 million children above the poverty line. The second package adds a $2,000 child allowance to the EITC and CDCTC components of the work-based package, which adds about $35 billion to the cost and lifts an additional 1.6 million children out of poverty. The third and fourth packages bring an additional 1.5 million children out of poverty, but at a marginal cost of about $45 to $67 billion per year.2
More details on the estimated impacts on poverty of the four packages are provided in Tables 6-2 (based on the 2015 tax law) and 6-3 (based on the 2018 tax law). The tables show overall package impacts and provide information about the role played by the individual components of each
___________________
2 The costs can be usefully compared to the $481 billion in direct federal expenditures on children in 2017 (Isaacs et al., 2018). The most expensive of our packages, costing $111 billion using the 2018 tax code, represents a 23% increase in that expenditure.
package.3 The poverty-reduction numbers in the first two columns of these two tables clearly show that for the work-oriented package, expansions of the EITC and CDCTC do much more to reduce child poverty than do expansions of the minimum wage or the WorkAdvance Program rollout. Specifically, the EITC and CDCTC expansions each generate 1.2 percentage point poverty reductions, whereas neither the minimum wage increase nor the WorkAdvance expansion generates more than a 0.2 percentage-point reduction.
The patterns for deep poverty (child poverty less than 50 percent of the SPM) are somewhat different than those for 100 percent of SPM poverty (see Figure 6-5). The work package is not as effective at reducing deep poverty as it is at reducing 100 percent SPM poverty, while the second package, combining the child allowance with work supports, is relatively more effective. As they do for 100 percent SPM poverty, the third and fourth packages both meet the 50 percent poverty-reduction goal for deep poverty.
The final three columns of Tables 6-2 and 6-3 provide information on the simulated cost and labor market impacts. As seen in Figure 6-4, costs vary enormously across the packages, with the work-based package costing around $9 billion per year, the work-based and universal supports package costing $44 billion, and the costs of the third and fourth packages ranging between $90 billion and $110 billion depending on the package and whether the 2015 or 2018 tax law is used to estimate costs.
Despite their different mixtures of income support and work incentives, all four packages are estimated to increase work and earnings for adults living in low-income families (see Figure 6-6). The first, work-oriented package is estimated to add a million low-income workers to the labor force and generate $18 billion in earned income, with the expansion of the CDCTC being the key driver of these changes. The second package, which adds a $2,000 child allowance to the EITC and CDCTC components of the first package, is estimated to add around 550,000 low-income workers to the labor force. The third package, which combines means-test supports with work-oriented provisions, is estimated to add about 400,000 workers and generate about $2 billion in additional earnings.
In the case of the fourth package, which combines universal supports and work-oriented provisions, the work reductions associated with the
___________________
3 The data compiled in Table 6-2 are based on simulations with the tax laws that prevailed in 2015 as applied to the 2015 population. Table 6-3 repeats these simulations based on the 2018 tax law but still based on the 2015 population. It is important to point out that the data listed for each component assume that each component acts independently of the others. However, in reality these components interact, and because the interactions are only factored into the package totals, the sum of the component impacts generally exceeds the overall package impacts. Nevertheless, the data for the components provide a general idea of which components matter the most.
SOURCE: Estimates from TRIM3 commissioned by the committee.
child allowance are more than offset by the gains in employment and earnings associated with the expanded EITC and CDCTC programs. Indeed, the net effect of this full set of policy and program changes is to increase employment among adults living in low-income families by more than 600,000 and earnings by more than $13 billion.
None of these estimated changes in work and earnings is affected very much by the 2018 tax reforms (refer to Table 6-3). These simulations show that a package approach to child poverty reduction can bring children out of poverty and deep poverty while simultaneously inducing hundreds of thousands of their parents and other adults living in their households to enter the paid labor market.
CONCLUSION 6-1: Two program and policy packages developed by the committee met its mandated 50 percent reduction in both child poverty (defined by 100% of the Supplemental Poverty Measure [SPM])
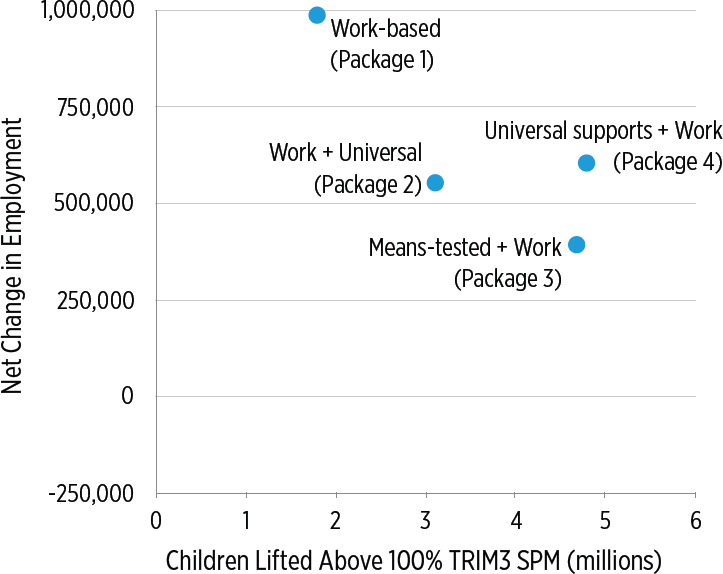
NOTE: Changes in employment are limited to individuals living in households with incomes below 200 percent of SPM poverty.
SOURCE: Estimates from TRIM3 commissioned by the committee.
and deep poverty (defined by 50% of SPM). The first of these packages combines work-oriented policy expansions with increases in benefit levels in the housing voucher and Supplemental Nutrition Assistance Programs. The second package combines work-oriented expansions with a child allowance, a child support assurance program, and elimination of immigrant restrictions on benefits built into the 1996 welfare reforms. Both packages increase work and earnings and both are estimated to cost between $90 and $111 billion per year.
CONCLUSION 6-2: The committee was unable to formulate an evidence-based employment-oriented package that would come close to meeting its mandate of reducing child poverty by 50 percent. The best employment-oriented package it could design combines expansions of the Earned Income Tax Credit, the Child and Dependent Care Tax
Credit, a minimum wage increase, and a promising career development program. Although this package is estimated to add more than a million workers to the labor force, generate $18 billion in additional earnings, and cost the government only $8.6 to $9.3 billion annually, its estimated reductions in child poverty are less than one-half of what is needed to meet the goal.
CONCLUSION 6-3: The committee combined two work-based and one income-support policy expansions in a package that was projected to reduce child poverty by one-third and deep child poverty by 40 percent, at an estimated annual cost of $44 billion. This package was estimated to increase employment by 550,000 jobs and earned income by nearly $10 billion.
REFERENCES
Isaacs, J.B., Lou, C., Hahn, H., Ovalle, J., and Steuerle, C.E. (2018). Kids’ Share 2018: Report on Federal Expenditures on Children through 2017 and Future Projections. Washington, DC: Urban Institute. Available: https://www.urban.org/sites/default/files/publication/98725/kids_share_2018_0.pdf.
Sawhill, I., Rodrigue, E., and Joo, N. (2016). One-Third of a Nation: Strategies for Helping Working Families. Washington, DC: The Brookings Institution.


