
Appendix A
Trends Affecting Urban Flooding
Four major trends are driving the current and future magnitude of urban flooding:
- The U.S. population is growing and is concentrated in urban areas.
- Policies that facilitate occupancy in flood-prone areas are placing more people in harm’s way.
- As a result of urbanization, natural landscape (storage) areas are being replaced with impervious surfaces that promote surface water runoff, increasing flood hazard in urban areas.
- Climate change is increasing the frequency and intensity of precipitation and causing sea level to rise, exacerbating flooding.
All of these factors put a strain on storm water systems, many of which were designed for cities with smaller populations, more natural land, or less extreme rainfall events.
POPULATION GROWTH
Population growth projections can be used to gain a partial understanding of the metropolitan areas most likely to experience significant impacts from future urban flooding. Figure A.1 displays the expected change in population density in the contiguous United States from 2010 to 2050, based on projections from the Environmental Protection Agency (EPA) ICLUS dataset (EPA, 2017). Aggregations of metropolitan areas, micropolitan areas, and stand-alone rural counties comprise the analysis units, of which 65 percent are expected to increase in population density. The map uses a standard deviation classification, which indicates how each value differs from the mean change in population density. Map classification using standard deviation is useful for identifying outliers. However, note that because the values are computed relative to the mean, it is possible for positive values of population growth to have a negative standard deviation. In Figure A.1, the extreme positive outliers are depicted in dark blue and indicate places among the top 7 percent in expected growth. These include the metropolitan areas of Houston, South Florida, New York, Chicago, and Los Angeles, each of which also ranks highly in the national map of Federal Emergency Management Agency insurance claims, payouts, and loans (Figure 3.2).
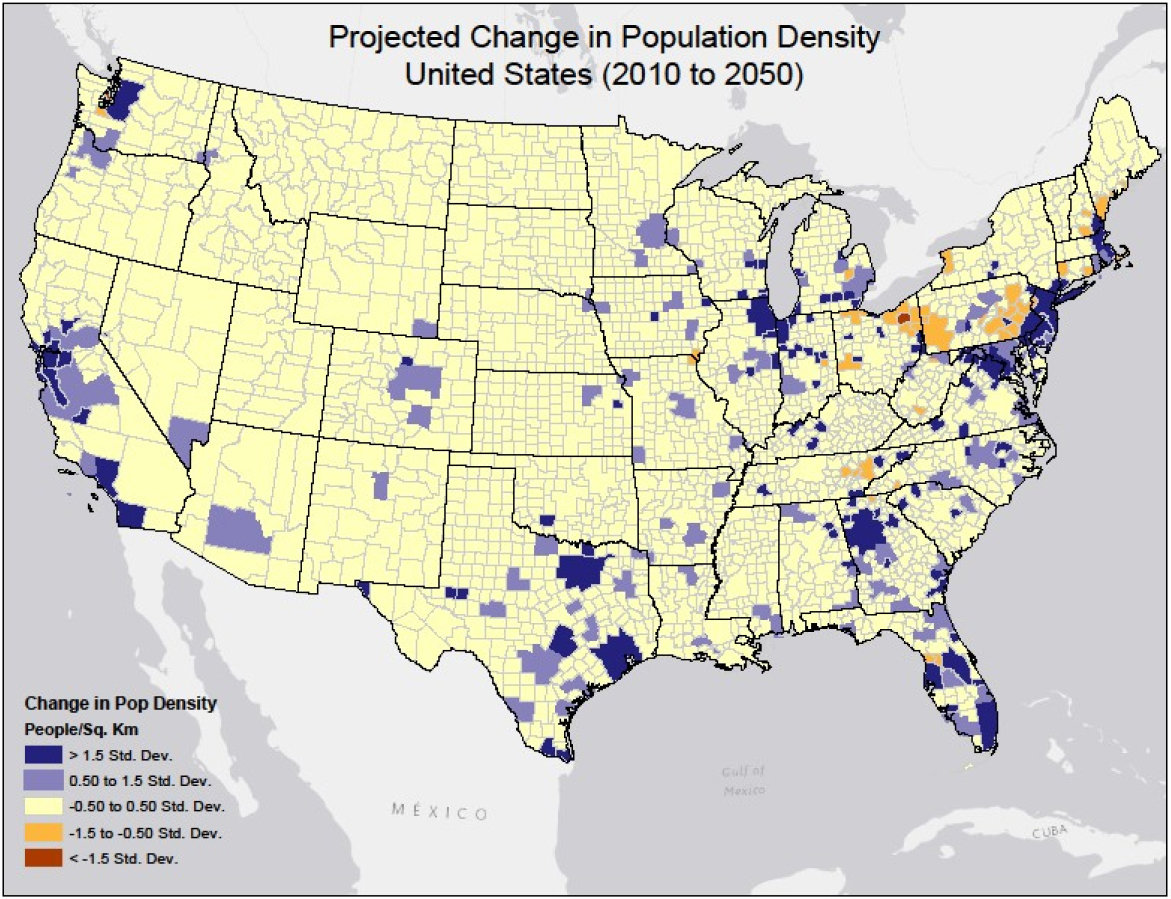
SOURCE: Created using data from the EPA Integrated Climate and Land Use Scenarios (ICLUS) v2.1.1 population projections, https://edg.epa.gov/metadata/catalog/search/resource/details.page?uuid={4C6D6B46-8CD3-428DB238-8FC9ADCBB271}.
INCREASED OCCUPANCY IN FLOOD PRONE AREAS
Historical and current development in floodplains places more people and structures in harm’s way, fragments natural drainage patterns, reduces the ability of areas to naturally store floodwaters, and changes the boundaries of the floodplains themselves. Up to 90 percent of floodplains in North America are considered heavily developed and functionally extinct (Tockner and Stanford, 2002). In the United States, urban growth rates in floodplains have been about 2 percent per year (Montz, 2000). A comprehensive study estimated that 6.6 million structures were located in Special Flood Hazard Areas in 1999, including 6.2 million residential structures and 0.4 million nonresidential structures (PricewaterhouseCoopers, 1999). This figure represents a 53 percent increase in floodplain development during the first 30 years of the NFIP, translating into roughly 2.3 million new buildings or about 76,000 buildings per year on average. The study predicted that the number of structures in Special Flood Hazard
Areas would increase to 8.7 million by 2022, an annual increase of 1 percent per year (PricewaterhouseCoopers, 1999; Burby, 2001).
The scale and pace of floodplain development varies with local policies and conditions. For example, the Houston metropolitan area added approximately 300,000 acres of new development from 1996 to 2010 (Governor’s Commission to Rebuild Texas, 2018). Most of the high-growth zip codes were suburban areas around the city, but about 12 percent occurred within Special Flood Hazard Areas. By 2050, it is expected that development within the floodplain could nearly double relative to 2001 conditions.
IMPERVIOUS SURFACES AND LAND COVER CHANGE
Urbanization and associated changes in land use and land cover increase both the likelihood and severity of flooding (see the review by Brody et al., 2015). Wetlands are particularly effective in storing and slowly releasing runoff from heavy rainfall (Bullock and Acreman, 2003). Forests and, to a lesser extent, natural grasslands, store or slow surface runoff (Nedkov and Burkhard, 2012). Some pastures used for grazing may also slow runoff, but most agricultural practices—such as tilling—compact soils and strip native vegetation, increasing surface runoff (Wheater and Evans, 2009).
Converting wetlands or other natural landscapes to impervious surfaces reduces infiltration of water into soil and increases surface runoff and flooding. The increase in runoff can be substantial, with as little as 10 to 20 percent expansion in impervious surfaces doubling runoff (Arnold and Gibbons, 1996). The higher runoff, in turn, can substantially increase peak discharge into nearby streams, increasing the chances of riverine overflow. The effect is often exacerbated in areas with a high fraction of impervious surfaces. For example, Rose and Peters (2001) found that peak discharge in highly developed urban catchments (at least 50 percent impervious area) was 80 percent higher than in less developed catchments.
The higher runoff and peak stream discharges in heavily developed areas translate to higher flood damage. Although figures are sparse, Brody et al. (2008) found that flood damage increased by $3,600 per year for every additional square meter of impervious surface in 37 coastal counties in Texas. The loss of wetlands added an average of $38,000 in property damage per flood per county. However, different types of wetlands have different mitigation capacities. In Galveston, fewer flood damage claims were made in areas with nontidal, vegetated wetlands than in areas with tidal wetlands (Brody and Highfield, 2013).
Finally, the spatial pattern of impervious surfaces also affects the amount of flood damage. For example, studies have found that highly developed urban cores along the Gulf Coast suffer less property damage from floods than sparsely developed suburban areas (Brody et al., 2011; Brody and Highfield, 2013), perhaps because (a) the urban cores in those areas are located outside of floodplains and (b) less property is exposed to flooding (i.e., only the ground floor of a multistory building). In suburban areas, impervious surfaces are spread over a large area, amplifying surface runoff, and development sometimes encroaches on flood-prone areas (Brody et al., 2014).
CLIMATE CHANGE
Global surface temperatures have been rising since the Industrial Age, and they are projected to continue rising with continued emissions of greenhouse gases (IPCC, 2013). A warming climate will likely worsen urban flooding in two primary ways. First, a warmer atmosphere holds more moisture, increasing the frequency or intensity of heavy rainfall events and thus the likelihood of pluvial flooding. The number and intensity of heavy precipitation events (Figure A.2) as well as precipitation totals have increased across most of the United States since 1950 (Hayhoe et al., 2018). The largest increases in heavy precipitation events have occurred in the Midwest and Northeast, and such events are projected to increase in those areas by 40 percent by 2100.
Second, as temperatures rise, ocean water expands and glaciers and ice sheets melt, raising sea level and exacerbating flooding of coastal cities. Rising seas mean that storm surges can reach further inland and that previously dry sections of the city begin to flood with high tides. Global mean sea level rose 0.19 meter from 1901 to 2010, and could rise another meter or more by 2100, depending on greenhouse gas emission trajectories (IPCC, 2013). The effects of sea-level rise are already being felt in many coastal cities. Extreme coastal flood heights, while uncommon, have increased since 1970 (IPCC, 2013). Tidal flooding along U.S. coastlines has increased between 300 percent and 900 percent over the past 50 years (Moftakhari et al., 2015). Sea-level rise will continue to cause higher and higher astronomical tides in coastal regions, increasing the frequency of tidal flooding and expanding the area flooded (Ray and Foster, 2016). Although tidal floods tend to be small, a heavy precipitation event at high tide can produce major flooding (e.g., Superstorm Sandy).
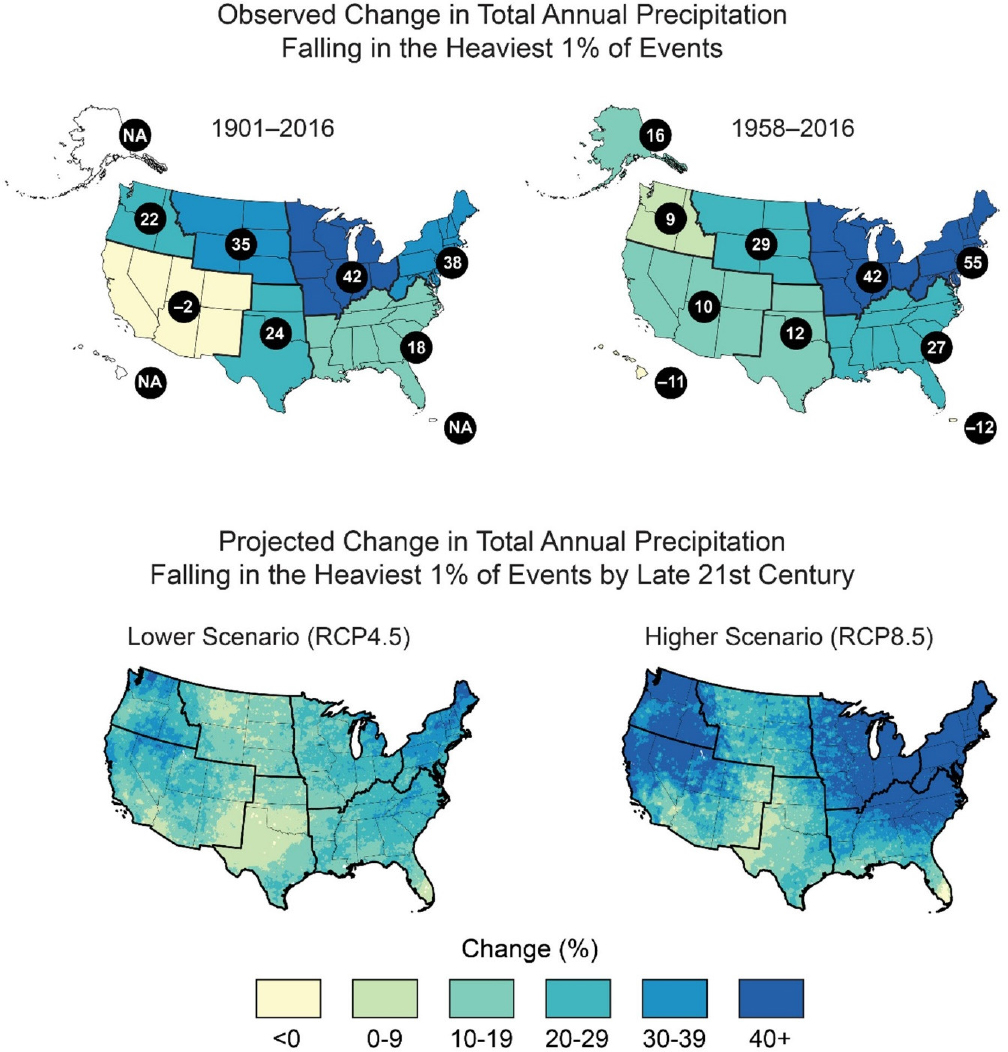
SOURCES: Adapted for the 2018 National Climate Assessment (Hayhoe et al., 2018) from Easterling et al. (2017; top) and National Oceanic and Atmospheric Admisnistration National Centers for Environmental Information, North Carolina Institute for Climate Studies, and National Environmental Modeling and Analysis Center (bottom)
This page intentionally left blank.


