
4
Evaluations of Dust Control Measures
The panel was tasked with assessing the performance of alternative dust control measures (DCMs) in reducing particulate matter 10 micrometers or less in aerodynamic diameter (PM10) at the Owens Lake bed under reduced water use. The panel was also tasked with “consider[ing] associated energy, environmental and economic impacts, and assess[ing] the durability and reliability of such control methods.”
The panel identified nine promising DCMs that are not currently considered Best Available Control Measures (BACMs). This includes natural solid and porous artificial roughness, engineered solid and porous artificial roughness, cobbles, sand fences, and solar panels, as well as two proposed modifications of current BACMs (precision surface wetting and shrubs with modified percent vegetative cover). To provide a basis for comparing the performance of these DCMs, the panel also evaluated the three current approved BACMs and three additional BACM modifications using the same criteria.
In the sections on each DCM below, the panel discusses dust control performance; practical considerations, including durability and time to achieve full performance; water use; and environmental implications, including habitat provided, aesthetic considerations, and potential effects of infrastructure installation or maintenance on environmentally sensitive areas. However, the panel did not presume an understanding of the many factors that influence the acceptability of a DCM on environmentally sensitive areas. The panel also discusses energy use; cost; systemwide factors, such as synergies with other measures and sustainability concerns; and information gaps. Table 4-1 provides an overarching summary of the evaluations discussed in this chapter.
EXISTING BACMs
Three BACMs have been approved for the Owens Lake bed: shallow flooding, gravel, and managed vegetation. Three modifications to the shallow flooding BACM are also discussed in this section: dynamic water management, brine with shallow flooding backup, and tillage with shallow flooding backup.
TABLE 4-1 Synthesis of the Evaluations of BACMs and Alternative Dust Control Measures
| Dust Control Measure (with area as of April 2019) | Reported Control Efficiency (%) | Initial and Long-term Water Use (ft/yr) | Capital Cost ($/mi2) and Lifespan | Operating Cost ($/mi2·yr) | Environment | Time to Full Performance | Site Suitability | ||
|---|---|---|---|---|---|---|---|---|---|
| Habitat Value | Impact to Cultural Resources | ||||||||
| APPROVED BACMs | |||||||||
| Shallow Flooding BACM | Shallow Flooding (19 mi2)a | 99% | 2.7–3.2 | $26–32 M; 20- to 30-yr life | $0.28–0.34 M | High value; regionally rare | High land disturbance | Immediate | Avoid sites next to drained managed vegetation |
| Dynamic Water Management (10.5 mi2) | 99% | 2.6 | ~$26–32 M; 20- to 30-yr life | $0.28–0.34 M | High value; regionally rare | High land disturbance | Immediate | Avoid sites next to drained managed vegetation | |
| Brine with Shallow Flooding Backup (3.8 mi2) | 99% | 0 (but requires backup) | $24 M; 20-yr life | $0.23 M | Low value | High land disturbance | Months to 1 year | Most suitable in low elevations | |
| Tillage with BACM Backup (2.7 mi2) | 99% | Initial: ND Long-term.: 0 (but requires backup) | $0.50 M; 5-yr life | $0.42 M | Low value | High land disturbance | Immediate | Most suitable in areas with clay-rich soils | |
| Managed Vegetation (5.4 mi2) | 99% | Leach: 0.1–8 1st 2 yrs: 1.2–4 Long-term: 1.1–2.6 | $20–36 M; 20-yr life | $1.6–2.4 M | High value; regionally occasional | High land disturbance | 2–3 yrs after planting | Most suitable in soils with low salinity and deeper groundwater | |
| Gravel (5.4 mi2) | 100% | 0 | $37 M; 20-yr life | $0.23 M | Low value | High land disturbance | Immediate | Avoid sites adjacent to emissive surfaces | |
| OTHER DCMs | |||||||||
| Precision Surface Wetting | 99% attained in testing | Uncertain | ND (~<$32 M); 20-yr life | ~$0.32 M | Low to High; regionally occasional | High land disturbance | Immediate | Avoid sites next to drained managed vegetation | |
| Artificial Roughness: Solid Natural | Depends on density and geometry; 92% obs. at Keeler Dune | 0 (without plants) Initial: 0.1 w/plants | ~$9–52 M (w/o or w/plants); lifespan unknown | ~low to $1.3 M (w/o or w/plants) | Moderate; regionally abundant | Potentially low land disturbance | Immediate | Suitable to all locations | |
| Artificial Roughness: Solid Engineered | Depends on density and geometry; 90% observed in field test | 0 | ~$45 M; lifespan unknown | ND; expected to be low | Moderate; regionally abundant | Potentially low land disturbance | Immediate | Suitable to all locations | |
| Artificial Roughness: Porous Natural | Unknown; dependent on density and geometry | 0 | ND; lifespan unknown | ND | Moderate; regionally abundant | Potentially low land disturbance | Immediate | Suitable to all locations | |
| Artificial Roughness: Porous Engineered | Unknown; dependent on density and geometry | 0 | ~$64 M; lifespan unknown | ND; expected to be low | Moderate; regionally abundant | Potentially low land disturbance | Immediate | Suitable to all locations | |
| Shrubs (with modified % cover) | Depends on density | Leach: 0.1–8 Initial: ≥ 0.2 Long-term:~0 | ND | ND; expected to be low | Moderate; regionally abundant | Potentially low land disturbance | 5–10 yrs | Most suitable in soils with low salinity and deeper groundwater | |
| Dust Meas as of Control ure (with area April 2019) | Reported Control Efficiency (%) | Initial and Long-term Water Use (ft/yr) | Capital Cost ($/mi2) and Lifespan | Operating Cost ($/mi2·yr) | Environment | Time to Full Performance | Site Suitability | ||
|---|---|---|---|---|---|---|---|---|---|
| Habitat Value | Impact to Cultural Resources | ||||||||
| Cobbles | Unknown; estimated at 100% | 0 | ND | ND; expected to be low | Low to Moderate; regionally abundant | High land disturbance | Immediate | Avoid sites adjacent to emissive surfaces | |
| Sand Fences (0.4 mi2 as min. dust control) | 70–90%; dependent on fence spacing and geometry | 0 | $15 M; 5-yr life | $0.6 M | Low | High land disturbance | Immediate | Suitable to minimum dust control areas | |
| Solar Panels | Likely > 99% on gravel; untested on non-gravel. | Initial: ~1 Long-term: ~0.02 | ~$80–120 M, not including gravel; 25- to 40-yr life | ND | Low; potential adverse impacts | High land disturbance | Immediate | If gravel used, avoid sites adjacent to emissive surfaces | |
NOTES: ND = No data; M = millions. Habitat value ratings represent the panel’s subjective assessment, based on descriptions in Chapter 3 of the diversity and productivity of the habitat in terms of food web productivity/ability to support wildlife. Habitat abundance rating is modeled after the Braun-Blanquet cover class method for vegetation cover (Braun-Blanquet et al., 1932), which classifies cover as rare (<5%), occasional (5–25%), common (25–50%), abundant (50–75%), and dominant (75–100%), with Owens Valley percent cover of these habitats classified by data from Manning (1992).
a Shallow flooding area including dynamic water management was reported by Logan (2019a) as 29.7 square miles (see Table 1-1). Shallow flooding area without dynamic water management reported here as the total minus the area of dynamic water management in the 2019 water year, although these operations can vary from year to year.
SOURCE: Data on costs and water use for current BACMs from Valenzuela (2019b; 2020) and Logan (2019a). Performance data and cost and water use estimates for non-BACMs are referenced or explained in the chapter discussions.
SOURCE: Photo courtesy of David Allen, panel member.
Shallow Flooding
Shallow flooding is the most widely used BACM at Owens Lake (see Figure 1-4 and Table 1-1). Water is spread across a graded surface with a minimum of 72-75 percent (depending on the dust control area) of the surface covered with standing water or surface-saturated conditions during the peak dust season between mid-October and mid-May (see Figure 4-1). A variety of different water delivery systems are used for this BACM, including water supply through lateral pipes and distributed sprinklers. The presence of standing water completely eliminates dust generation from the wetted surface and also traps blowing sand that enters the ponded area.
Performance
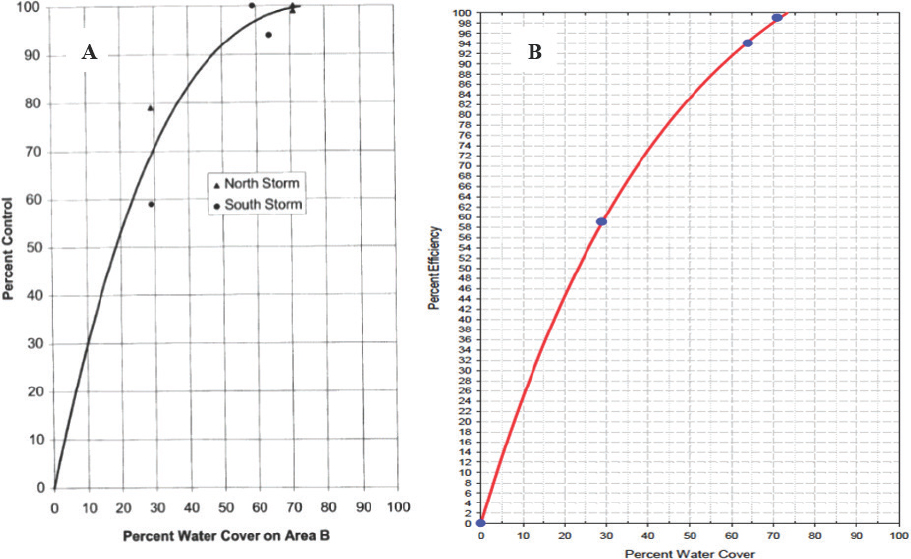
Evaluation of the performance of shallow flooding for dust control is based primarily on data from Hardebeck et al. (1996) in which shallow flooding designs were tested at the northern end of the lakebed on primarily sandy soils. Sand flux samplers and PM10 monitors were used to estimate differences in dust emissions associated with wetted surfaces, using natural storm conditions and wind tunnel testing. The control efficiency showed a strong correlation with the percentage of area covered by water (Hardebeck et al., 1996). Although there was scatter in the results, extrapolation of those data revealed that at water coverages greater than 75 percent of the dust control area, control efficiencies of 99 percent or greater for PM10 can be obtained (see Figure 4-2a). For the 16.5 square miles of shallow flooding implemented by 2003 with minimum flooded coverage of 75 percent, the Great Basin Unified Air Pollution Control District (District) estimated an average control efficiency of 99.8 percent in 2004 based on sand flux as a surrogate measure for PM10 (GBUAPCD, 2008).
SOURCES: Hardebeck et al. (1996) and GBUAPCD (2008).
The 2008 State Implementation Plan (SIP) (GBUAPCD, 2008) included a modified Shallow Flood Control Efficiency Curve (see Figure 4-2b), fitted to three of the original data points. This curve is currently applied to shallow flooding areas within the 2006 Dust Control Area (12.7 square miles), with 72 percent flooded coverage assumed to provide 99 percent PM10 control efficiency. Current efforts are underway to refine the degree of wetness required for 99 percent control efficiency (e.g., Bannister et al., 2016).
The District Governing Board requires that surface flooding conditions be met from October 16 to June 30, reflecting the period with the most intense wind and surface emissivity conditions during the dust season. The percentage of standing water coverage may be decreased to 70 percent from May 16 to May 31, 65 percent from June 1 to June 15, and 60 percent from June 15 to June 30 (see Table 4-2) (Board Order 160413-01).1
___________________
1 District Governing Board Order #160413-01 Requiring the City of Los Angeles to Undertake Measures to Control PM10 Emissions from the Dried Bed of Owens Lake. See https://gbuapcd.org/Docs/District/AirQualityPlans/OwensValley/Board_Order_FINAL_20160425.pdf (accessed January 28, 2020).
TABLE 4-2 Examples of Owens Lake BACM Performance Criteria
| BACM | Performance Criteria | ||
|---|---|---|---|
| Shallow Flooding BACM | Shallow Flooding | % wetness | 75% or 72% wetness from Oct 16–May 15; In 99% CE, spring ramping allows decreases: May 16–31 = 70%; June 1–15 = 65%; June 16–30 = 60%a,b |
| Dynamic Water Management | Sand Flux | >5.0 g/cm2/day = reflood thresholda,b | |
| IPET | Mitigation required/reflood when visible dust emissions occur when operated at reference test heighta,b | ||
| Dust Plume Obs. | Dust observations by human observers or remotely using video or photosa | ||
| Brine with Flooding Backup | Sand Flux Surface cover | >5.0 g/cm2/day = reflood thresholda,b | |
| Required 75% or 72% total surface cover (depending on dust control area) of a mix of stable qualifying surfaces: 1. Standing water or hydrologically saturated surface, 2. Evaporite salt deposit with a minimum thickness of 1.5 cm, and 3. Capillary crust with a min thickness of 10 cm and <1/3 of minimum required total cover (24% or 25%) Reflood when <60%; Maintenance required if >60% but less than required or >1/3 capillarya,b | |||
| IPET | Mitigation required/reflood when visible dust emissions occur when operated at reference test heighta,b | ||
| Dust Plume Obs. | Dust observations by human observers or remotely using video or photosa | ||
| Tillage with Flooding Backup | Sand Flux | >1.0 g/cm2/day = reflood threshold; >0.5 g/cm2/day = maintenanceb,c | |
| Tillage Roughness | Average ridge spacing/ridge height (RS/RH) in 40-acre blocks should be <10; RS/RH >12 = reflood threshold, RS/RH of 10.1–12 = maintenanceb,c | ||
| Ridge Height PM10 Monitoring | Average ridge height (RH) <1.0 ft = reflood threshold, RH <1.3ft = maintenanceb,c | ||
| Upwind-downwind concentration difference >100 µg/m3 = reflood threshold, >50 µg/m3 = maintenance | |||
| Surface Armoring IPET | >60% clod cover and clods + 1/2" diameterb,c | ||
| Mitigation action required/reflood threshold = visible dust emissions when operated at reference test heightb,c | |||
| BACM | Performance Criteria | ||
|---|---|---|---|
| Managed Vegetation | % Cover | 37% overall average vegetation cover of locally adapted native species.a | |
| Gravel | Cover | 100% coverage of either 4" thick gravel with size screened to >½ inch in diameter, or 2" thick gravel with size screened to ½ inch in diameter underlain w/geotextile fabrica,b | |
NOTE: CE = control efficiency; IPET = Induced Particle Emissions Test.
a District Governing Board Order #160413-01 Requiring the City of Los Angeles to Undertake Measures to Control PM10 Emissions from the Dried Bed of Owens Lake. See https://gbuapcd.org/Docs/District/AirQualityPlans/OwensValley/Board_Order_FINAL_20160425.pdf (accessed January 28, 2020).
b District Rule 433, Control of Particulate Emissions At Owens Lake, adopted March 13, 2016. See https://ww3.arb.ca.gov/drdb/gbu/curhtml/r433.pdf (accessed January 28, 2020).
c Stipulated Judgment in the matter of the City of Los Angeles v. the California Air Resources Board et al. Superior Court of the State of California, County of Sacramento. Case No. 34-2013-80001451-CU-WM-GDS. Approved by the court on December 30, 2014. See https://gbuapcd.org/Docs/District/AirQualityPlans/SIP_Archive/2014_Stipulated_Judgment_20141230.pdf (accessed January 28, 2020).
SOURCE: Logan, 2019d.
These performance criteria are monitored via satellite remote sensing (previously using Landsat 7/8 every 8 days and currently with Sentinel-2 every 5 days).
Practical Considerations
The shallow flooding BACM can achieve full performance following construction and upon reaching the required surface wetness coverage. However, shallow flooding is not appropriate as an emergency measure unless the area has been graded and water distribution infrastructure is present. The BACM itself is quite reliable based on reported results, but it does depend on the reliable supply and the long-term availability of water from the Los Angeles Aqueduct. If water resources are insufficient for shallow flooding, groundwater supplementation can be used, but local groundwater pumping can impact marginal springs and lake shore habitat as demonstrated in similar saline lake systems (Guteirrez et al., 2018; Ortiz et al., 2014). Additionally, changes in salinity in the shallow flooded areas are likely to impact the biota that depend on those systems (see Chapter 3). The shallow flooding BACM also relies on the lake’s water distribution system, although it can tolerate short-term interruptions if necessary.
Significant construction, including land leveling and water distribution infrastructure, is required for the BACM. Its lifespan is likely limited by the lifespan of the piping and water distribution hardware, which likely ranges from 20 to 30 years (Valenzuela, 2019b). The BACM is generally durable, however the requirement that the land surface be level to maintain even depths of standing water can be disrupted by sediment-laden flash floods, particularly in the south and east of the lake, which might necessitate regrading and repair to the water conveyance infrastructure.
Water Use
The water use of the BACM is significant, with estimated freshwater consumption of 3.15 ft/year for ponded areas, 2.68 ft/year for sprinkler irrigation, and 3 ft/year for flooding using piped laterals (Valenzuela, 2019b). The cessation of flooding in the summer months does reduce the water demand to well below the annual reference evapotranspiriation (ET0); using 2018 and 2019 data, the ET0 is ~6.6 ft/year (2020 mm/year; based on the Food and Agricultural Organization-56 method for estimating crop evaporation [Allen et al., 2005]). Shallow flooding will have greater water demands under a warming climate, because open water evaporation will increase ~3.5 percent for a projected 2°C average warming in the Owens Valley, assuming no change in relative humidity, solar radiation, or mean wind speed.2
___________________
2 Estimates of increase in reference or open water evaporation were calculated using FAO’s ET0 Version 3.2 under the assumption of only warming, with all other climate variables remaining unchanged from the 2018-2019 calculation period.
Environmental Implications
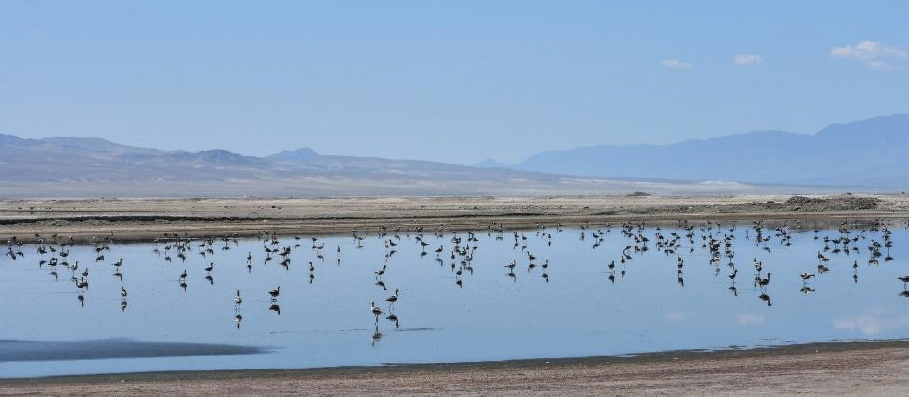
The presence of ponded water has significantly increased the avian habitat of the lakebed (see Figure 4-1). Owens Lake is considered by the Audubon Society to be an Important Bird Area and in 2018 was designated a Western Hemisphere Shorebird Reserve Network Site of International Importance. The shallow flooded areas have robust food webs and host a large number of birds (largely migratory, but some breeding), providing critical habitat along the Pacific flyway (Roberts et al., 2016; see Chapter 3). Current heterogeneity in the flooded areas provides habitat for diverse bird species. Specific characteristics of pools, such as salinity, water depth, and surrounding habitat conditions, determine to what extent they support the presence and breeding of waterfowl and shorebirds and the presence of diving waterbirds (LADWP, 2010; Roberts et al., 2016; Robinson, 2018).
Salinity is a major factor affecting the food web (Roberts et al., 2016). Invertebrate diversity is highest in low-salinity pools; electrical conductivity of 25-100 millisiemens per centimeter (mS/cm; approximately 20-100 g/L salinity) results in the highest density of invertebrates and production of benthic algae (Herbst, 2001; NRC, 1989). At more than 120 g/L salinity, the food web will begin to decline and will be decimated by 150 g/L salinity (NRC, 1987). Maintaining low- to moderate-salinity pools can be challenging in a terminal alkali lake, where salinity necessarily accumulates over time, which would lead to a decrease in brine flies that are critical food for birds (LADWP, 2010). Additional water in the summer periods is effective at slowing the buildup of salinity, increasing brine shrimp, and improving breeding habitat for birds (Roberts et al., 2016).
The flooded areas also appear to be of high aesthetic value; for example, these areas feature prominently in the public access points and interpretive centers. Because of the land disturbance associated with surface leveling (to improve water spreading efficiency and minimize water needed to cover the surface) and the amount of infrastructure required, the shallow flooding BACM is not conducive to use on environmentally sensitive areas of the lake.
Energy Use
Energy use during operation of the shallow flooding BACM is relatively low because most shallow flooding is conducted using gravity-fed systems from the Los Angeles Aqueduct.
Cost
The cost of the shallow flooding BACM is significant both in capital costs (surface grading and water distribution system construction) and operating cost (distribution system maintenance and water consumption). The cost of construction, including the water distribution system, ranges from $26 million to $32 million/square mile, depending on the type of water distribution system used. Operating costs are estimated to be between $280,000 and $340,000/square mile, excluding the value of water used from the aqueduct
(Valenzuela, 2019b). As the water rights owner for the supplies of the Los Angeles Aqueduct, the Los Angeles Department of Water and Power (LADWP) does not purchase the water used for dust control, unless water supplies in the Owens Valley fall short of that required amount. Nevertheless, assuming a market value ~$1,000/acre-ft and an annual water use for dust control at Owens Lake of 65,000 acre-ft (largely for shallow flooding), the water use for shallow flooding represents an approximate annual value of ~$65 million/year if such supplies could be allocated to other users.3
Systemwide Issues
Under a warming climate, the shallow flooding BACM will consume more water through evaporation. Warming is also expected to reduce the snowpack in the Owens River catchment. Because the Sierra snowpack serves as the major storage reservoir of the system, reduction in the available storage would lead to higher Owens River flows earlier in the runoff season when downstream demand is not yet at its peak. Therefore, climate change may affect the availability of water for the shallow flooding BACM and the potential for flood damage of the infrastructure needed for this BACM.
Information Needs to Inform Decision Making
Long-term potential changes in soil and groundwater salinity as a result of shallow flooding and their propensity to affect dust production are poorly understood. Shallow flooding may, in some areas, leach soluble salts toward the center of the lake (thus reducing the dust potential), change the chemical composition of the near surface salts, or, because of evaporation, actually accumulate additional salts at the surface. Changes in salinity could have a major effect on the food web for shorebirds, and therefore additional information on the capacity to maintain target salinities over time is needed.
In addition, more work is needed to understand the linkage between shallow flooding acreage, depth, salinity, food web production, and bird population sizes. For example, brine flies (and brine shrimp, to a lesser extent at Owens Lake) are the primary food source for most birds at Owens Lake. Brine flies have very patchy spatial distributions in saline lakes (NRC 1987), and understanding of these controls will inform design of shallow flooding strategies that maintain bird populations with reduced water use. The current habitat guild model and monitoring coarsely address the driving mechanisms that control bird presence or populations (e.g., food webs, habitat patch size [which may include multiple dust control areas that provide similar habitat], and adjacency), which limits its effectiveness for projecting the effects of different management scenarios.
___________________
3 For comparison, rates for purchasing water from the Metropolitan Water District were $1,095/acre-ft in 2019 (Valenzuela, 2020b).
If shallow flooding is to be combined with other DCMs in hybrid control measures, additional information on the control effectiveness of this DCM at areal coverages less than 75 percent is needed.
Shallow Flooding: Dynamic Water Management
Dynamic water management is an operational modification of the shallow flooding BACM that allows for later start dates and/or earlier end dates to reduce water use in areas with historically low PM10 emissions.4 Areas under dynamic water management are carefully monitored, and reflooding is required when specific performance criteria are exceeded (e.g., sand flux greater than 5 g/cm2 day, visible dust observations, or visible dust emissions when induced particle emission testing5 is performed at the reference test height). Dynamic water management was approved in 2014 during an extended drought to provide LADWP with flexibility to reduce water use on 13.15 square miles. Operationally, it is used on areas that are already constructed for shallow flooding, and therefore the capital costs are assumed to be mostly identical to that of the shallow flooding BACM. No operating costs were provided. Monitoring requirements are greater than those for the shallow flooding BACM, but other operating costs may be reduced when the area is not flooded.
Water Use
Dynamic water management reduces the volume of water needed for dust mitigation and also provides some flexibility in operations at both the beginning and end of the dust control season. Water savings (compared to the shallow flooding BACM) depend on the start and end dates. In 2018 and 2019, LADWP reported an average water use of 2.6 ft over the areas in which dynamic water management was applied, which is slightly less than the reported water use of 2.7-3.2 ft for the shallow flooding BACM. LADWP reports that, on average, dynamic water management reduced water use at Owens Lake by 1,750 acre-ft/year (Valenzuela, 2019b).
Information Needs to Inform Decision Making
Shorter flooding periods will decrease the potential breeding season for some of the birds and may also disrupt the robust food web on which migrating and breeding birds depend.
___________________
4 Dynamic water management start dates are established by Board Order 160413-01 Attachment F, while end dates depend on the type of shallow flood system in place. For surface flooded areas, flooding may cease on April 30, with no ramp down requirements as found in the traditional shallow flooding BACM. For areas of sprinkler flooding, surface wetness must be met 2 weeks prior to the start date of dynamic water management, and may be shut off with no ramping period on May 31.
5 An induced particle emission test involves the use of a small remote-controlled drone (i.e., helicopter-type craft) to generate wind at the surface. The craft is tested in advance to determine the reference height that creates target wind speed of 11.3 m/s measured at 1 cm above the land surface (District Rule 433, Control of Particulate Emissions At Owens Lake, adopted March 13, 2016. See https://ww3.arb.ca.gov/drdb/gbu/curhtml/r433.pdf [accessed January 28, 2020]).
For example, brine shrimp are particularly abundant with warm season flooding (NRC, 1987). Before dynamic water management is more widely adopted at Owens Lake, it would be important to understand the potential habitat effects.
Brine with Shallow Flooding BACM Backup
Owens Lake brines are typically considered an alkaline sodium carbonate-sulfate-chloride brine, following the model of Hardie and Eungster in which sodium is the dominant cation (Friedman et al., 1997). Chemical weathering of the Sierra batholith (primarily from feldspars; Pretti and Stewart, 2002) followed by evaporation lead to an alkaline brine that has been extensively mined for soda ash. The mineralogy of the evaporate minerals formed during evaporative enrichment (at concentrations approaching 450,000 mg/L [Groeneveld et al., 2010]) is complex, and in particular, the phase and mineralogy of sodium carbonate and sodium sulfate salts are strongly influenced by temperature. Their order of crystallization and state of hydration change seasonally, and therefore development of a long-term and stable surface crust at Owens Lake has proven challenging (GBUAPCD, 2016a). Beginning in 2012, a series of tests demonstrated that effective dust control could be maintained by a combination of both wetness (similar to shallow flooding but with a brine solution) and development of thick salt crust. The technique, known as brine with BACM backup, uses brine or salts to cover the surface, with shallow flooding required only when the surface condition deteriorates to a potentially emissive state (at the coverage defined in the previous section) (GBUAPCD, 2016b).
The brine BACM consists of three dust-mitigating surfaces: brine, evaporite salt deposit, and capillary brine salt crust. The liquid brine serves in the same manner as the shallow flooding BACM, eliminating any sand or dust sources as well as capturing saltating particles. The evaporite crust that forms subaqueously from evaporation of standing brine, serves as the armoring of the surface to reduce dust emissions. This crust is primarily evaporite minerals (solid phase salts as well as the potential for interstitial brines) and is not easily eroded by wind. Capillary brine crust, termed from its formation during the capillary rise of shallow brine in the sediments, forms from evaporation of shallow groundwater, precipitating salts both within and on top of the lake sediments (GBUAPCD, 2016b).
The brine with BACM backup (GPUAPCD, 2016b) is required to provide 75 or 72 percent coverage, depending on the dust control area, through a mixture of qualifying surfaces:
- standing water or saturated soils,
- an evaporite salt deposit of at least 1.5 cm thickness, or
- capillary crust of at least 10 cm thickness (at no more than 24-25 percent of the dust control area) (see Figure 4-3).

SOURCE: Photo courtesy of David Allen, panel member.
For areas controlled with brine with BACM backup, reflooding is required when sand flux estimates exceed 5 g/cm2 day.
The dust control performance has been documented visually, by comparison to the existing brine pool behavior, which is deemed not to be PM10 emissive, and by sand monitoring, although typically these areas do not contain appreciable sand-size fraction material. The District reported that no visible dust plumes originated from brine BACM between 2012 and 2015, during a multiyear drought. Until more data are collected during a broader range of precipitation conditions, shallow flooding backup continues to be required for the brine BACM because salt mineral crusts can generate emissive salts as they transition between hydrated and dehydrated states (GBUAPCD, 2016b).
Performance
The durability of the surface is variable, with evaporite crust being quite durable and apparently not subject to significant phase changes. In contrast, capillary crust areas are
prone to thermal effects and could become emissive following winter rains or snow events. It remains unclear how durable the evaporite crust is if brine is diverted elsewhere (i.e., is it necessary to keep brine directly beneath the salt crust?). Having the backup of surface wetting significantly improves the reliability of this BACM.
Practical Considerations
The BACM likely achieves full performance quickly because weeks to no more than a few months are needed to precipitate a centimeter of crust. For brines that are far below saturation, full performance may take longer but can easily be calculated from potential evaporation rates and brine salinity. The BACM appears to function well in both sandy and clay soil types, although the measure does require surface grading. The BACM would not be appropriate for use upgradient of any BACM that is sensitive to salinity, such as managed vegetation. This BACM is well suited for co-location with any BACM that generates brine or high-salinity waters, such as vegetated surfaces and at the downstream end of shallow flooding where tail-waters can be gathered that are likely high in salinity.
Water Use
The technique has several advantages, including reduced freshwater requirements and the ability to dispose of brines from adjacent tile-drained vegetative BACM sites. The BACM uses no freshwater during construction and, in theory, during operation. However, a source of water for flooding, such as tailwater from a shallow flooding cell, must be available if the surface becomes emissive and the shallow flooding BACM backup is required.
Environmental Implications
The brine BACM provides habitat for brine-loving bacteria and unicellular algae (Armstrong, 1981). The habitat value of the brine BACM alone is low, because salinities of around 100-120 mS/cm can limit invertebrate productivity (Herbst 2001; NRC, 1987), and brine flies can be eliminated above 150 mS/cm (Herbst, 1997; NRC, 1987). However, aquatic ecosystems can be quite productive at the interfaces between brine and freshwater-flooded areas, because the dominant invertebrate species, brine flies, have maximum productivity at 25-100mS/cm (LADWP, 2010). For example, waterfowl populations at Owens Lake have historically been supported in areas of the brine pool that are adjacent to springs or artesian wells (LADWP, 2010). Therefore, this BACM could enhance the feeding habitat for avian species if managed in conjunction with freshwater areas, although saltwater intrusion into these rare freshwater areas must be avoided. Brine BACM sites also provide sinks for salts in this alkaline basin, which helps to maintain lower-salinity habitats throughout the rest of the lake (LADWP, 2010).
Because of the infrastructure and grading required, this BACM is unlikely to be appropriate for environmentally sensitive areas. Reactions to the aesthetics of the brine BACM can
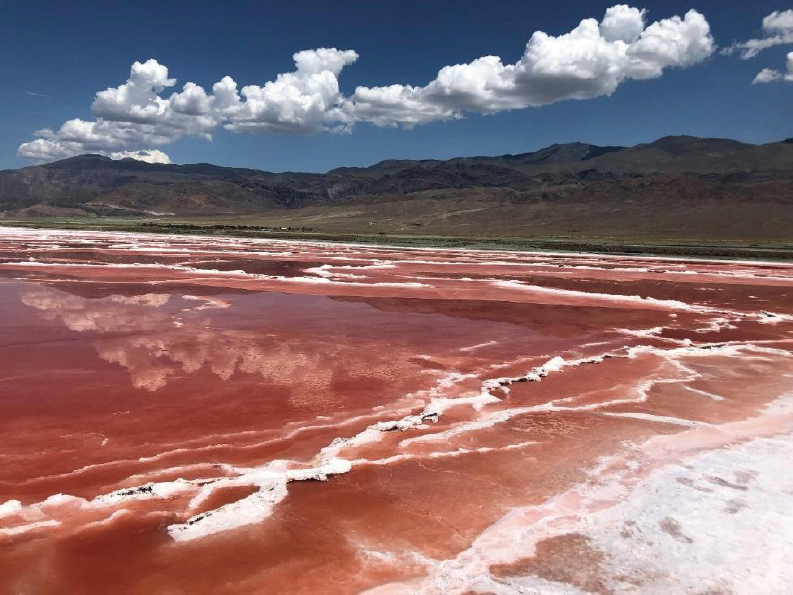
NOTE: Dark red to pink brine is bordered by white evaporate crust.
SOURCE: Photo courtesy of Stephanie Johnson, National Academies.
be mixed. Some may see the color of the halophilic bacteria as alien to the landscape, while others may appreciate the seasonal changes in the brine color as an indicator of a living landscape (see Figure 4-4).
Cost
The construction cost of the brine BACM with shallow flooding backup is $24 million/square mile, which is lower than the shallow flooding BACM. Operating costs are $230,000/square mile/year (Valenzuela, 2019b, 2020b).
Systemwide Issues
As discussed above, the long-term viability of this method relies on salt mineralogy and its stability. This BACM does not appear to have any significant sensitivity to a warming climate, except for the possibility of increased flooding. The BACM may be susceptible to unplanned surface flooding, which would dissolve both evaporite and capillary crust, potentially altering the salt chemistry. However, if salt chemistry is not significantly altered, this
BACM could serve some benefit as a repository for floodwaters. Further testing and analysis is needed to understand the impacts of surface flooding on the chemistry and durability of the evaporite and capillary crust on this BACM.
Its most logical application is in areas approaching the brine pool where, in the long run, salts will be accumulated. In addition, at lower elevations in the lakebed, the sites could receive drainage brines from managed vegetation BACM sites.
Information Needs to Inform Decision Making
Additional research could improve the applicability of the brine BACM as a DCM that does not use freshwater. Specifically, research on long-term salt stability and dust emissions under both dry and wet conditions is needed to understand the reliability of the measure without surface flooding backup. Research is also needed to understand the susceptibility of the capillary brine crust to thermal and geochemical changes that may affect the long-term dust control efficiency. Scheidlinger (2008a) reviewed the Owens Lake brine chemistries, and although it was concluded that development of a sodium chloride–dominated crust from the brine was challenging, the work could serve as a roadmap for innovation and understanding of future potential of the brine BACM to develop more stable salt crusts. The brine BACM has significant advantages for long-term management of salinity and could provide the basis for other BACM designs that utilize the natural geochemistry of saline minerals for dust reduction.
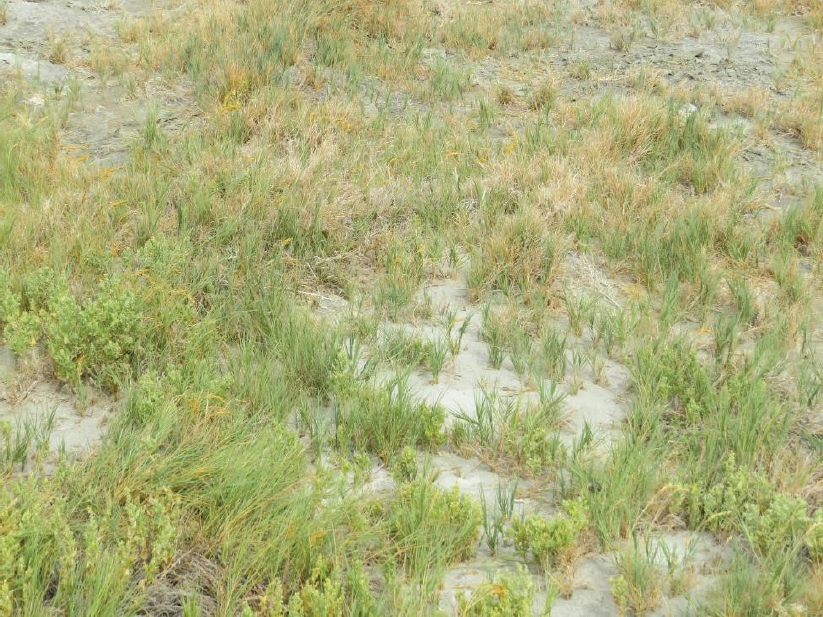
Tillage with Shallow Flooding BACM Backup
Tillage with the shallow flooding BACM backup was approved as a modification to the shallow flooding BACM in 2014.6 Tillage controls soil erosion by wind and fugitive dust emissions in several ways. Tillage, as practiced on the Owens Lake bed, creates oriented beds and large surface aggregates (termed oriented and random surface roughness, respectively; see Figure 4-5). Surface roughness has long been known to reduce surface erodibility and was one of the five factors in the first predictive equation for wind erosion (Woodruff and Siddoway, 1965). In general, soil particles and aggregates greater than 0.84 mm in diameter are considered non-erodible (Chepil, 1962; Fryrear, 1984; Zobeck et al., 2003) because the aggregates are too large to be entrained in all but the most intense windstorms. By increasing the surface roughness, tillage also reduces the wind speed at the surface by shear stress partitioning and the creation of turbulent eddies. This effect on the wind field is most effective when the direction of tillage and the ridges created are perpendicular to the dominant wind flow direction. For this reason, tillage patterns that deviate from linear are more effective at
___________________
6 District Rule 433, Control of Particulate Emissions At Owens Lake, adopted March 13, 2016. See https://ww3.arb.ca.gov/drdb/gbu/curhtml/r433.pdf (accessed January 28, 2020).
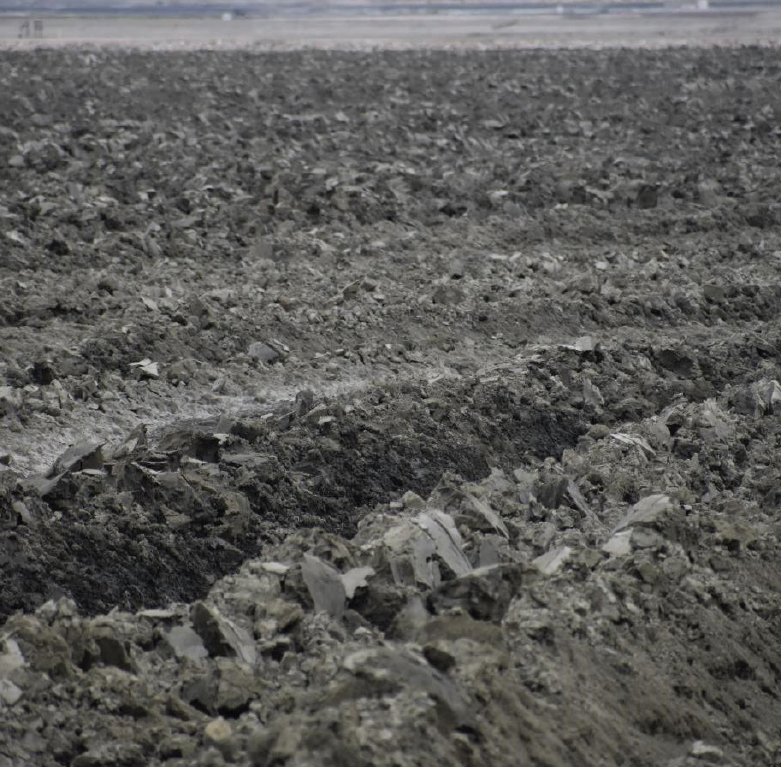
SOURCE: Photo courtesy of David Allen, panel member.
reducing surface wind speed for winds of all directions. Finally, the surface ridges and clods provide shelter angle protection that prevents wind-carried sand particles from striking a flat horizontal surface and ejecting more particles (Potter et al., 1990).
The tillage with shallow flooding BACM backup requires that a roughness value of <10 (defined as the ridge spacing [RS] to ridge height [RH]) be maintained along with a ridge height of greater than 1.3 feet. In addition, measurements, including the induced particle emission test and sand flux, are required to assess the dust control performance. If the control efficiency measurements show insufficient dust control, the area is flooded and tilled again to renew the surface roughness.7
___________________
7 District Rule 433, Control of Particulate Emissions At Owens Lake, adopted March 13, 2016. See https://ww3.arb.ca.gov/drdb/gbu/curhtml/r433.pdf (accessed January 28, 2020).
Performance
Tillage is a proven method for reducing surface erodibility (Fryrear, 1984; Potter et al., 1990). Studies at Owens Lake showed that when the performance criteria were maintained, tillage generally resulted in de minimis levels of sand flux and PM10,8 which was considered equivalent to a control efficiency of 99 percent or greater sand flux (Air Sciences, Inc., 2015). Exceedances were attributed to the tilling events, construction activities, and off-site sources. The field tests at T12 in heavy clay soils were tilled to achieve a ridge spacing of 12-14 feet and ridge heights of 1.6-2 feet (total distance between furrow bottom and ridge top of 3.2-4 feet), resulting in starting roughness values between 6 and 8.75,9 although the furrow depths and ridge heights did decrease somewhat over time. Different tilling spacing was not tested. There was no contemporaneous untreated control area during the evaluation of tillage performance, but several years of pre-tillage horizontal mass flux measurements were made at dust control area T12. In addition, the tillage test at T12 is one of the few DCMs to have performance evaluated using direct measures of PM10 at upwind and downwind locations. Tillage can also benefit adjacent dust control areas because the aerodynamic roughness it creates can slow near-surface wind speeds immediately in the lee of the tilled area.
Practical Considerations
Tillage with BACM backup can be installed and become fully functional quickly. Thus, it is especially suitable for emergency use. One limitation of emergency tillage is that the soil must be moist to allow for tillage and formation of large aggregates.
A single intense rain event can break down the aggregates in sandy soils to produce erodible particles. Tillage is most effective and durable in soils with sufficient clay content (greater than 50 percent clay content) to form aggregates with high mechanical strength (Cox, 1996a). It is used primarily on the tighter textured soils of the lakebed at present. In areas with clay-rich sediments, tillage is estimated to be effective for 5 years (Valenzuela, 2019b). Areas with sandy sediments may need tillage-induced roughness renewal more frequently than annually depending on rainfall or mechanical forces such as freezing and thawing of moist aggregates.
___________________
8 “The de minimis criterion for the tillage BACM test based on the daily sand mass consisted of the following: If the maximum area-average daily sand mass was less than one gram, the site was considered to meet de minimis. . . . The value of one gram represents a 99-percent reduction in sand motion from the sand fluxes that flagged area T12-1 for dust control in 2005.” (Air Sciences, Inc., 2015). Several criteria were used to determine the de minimis threshold for PM10. For example, step 1 of the criteria states: “The de minimis threshold is an observed 24-hour PM10 concentration difference between the upwind and downwind monitor (∆χ) at the downwind TEOM of <100 µg m−3 (µg/m3). The logic behind this screen is that if the Tillage test area does not add more than 150 µg m−3 at the downwind TEOM, then the area should not produce an exceedance of the federal 24-hour PM10 standard (150 µg m3) at the shoreline because any dust plume that leaves the area will be reduced by atmospheric dispersion before it reaches the shoreline. Lowering the screen from 150 to 100 µg m−3 adds an extra level of conservatism. The value of 100 µg m−3 represents a 99-percent reduction in the modeled 24-hour PM10 concentration that flagged area T12-1 for dust control in 2005 (based on District calculations).”
9 District Rule 433, Control of Particulate Emissions At Owens Lake, adopted March 13, 2016, Appendix C. See https://ww3.arb.ca.gov/drdb/gbu/curhtml/r433.pdf (accessed January 28, 2020).
Water Use
Tillage requires no water for routine maintenance (Valenzuela, 2019b). However, water application is typically necessary before tillage to produce large, indurate aggregates, and this water also minimizes dust during tillage. Water may also be needed for shallow flooding to control emissions if the tillage fails. If tillage renewal immediately follows the rainy season, it is possible that no water additions would be required.
Environmental Implications
Tillage has little habitat value other than a minimal potential for creating microhabitats for small vertebrates and invertebrates, and it is more likely to decrease the small baseline habitat potential of the barren playa. Because of the possibility of bacterial oxidation of any accumulated organic material in the tilled sediments, tillage may result in increased carbon dioxide (CO2) emissions from the lakebed. Tillage is destructive by nature and buries the surface. Thus, tillage would damage or destroy cultural resources. Additionally, tillage provides little aesthetic value.
Energy Use
Tillage of heavy clay soils to the depth mandated for this BACM requires the use of large tractors with high horsepower and fuel consumption.10 Following tillage, continual energy use is limited to that necessary to monitor performance, which is currently provided by photovoltaic panels.
Cost
Tillage is one of the most cost-effective DCMs available. The primary capital costs to establish a tillage plot are fuel, manpower, and amortization of equipment. According to LADWP, tillage costs $500,000/square mile to establish, and annual operating costs are $1.48 million/square mile (Valenzuela, 2019b). Operational costs include monitoring of control efficiency, roughness, crusting, and surface integrity as well as any flooding and repeat tillage needed for maintenance.
Systemwide Issues
Intense rain events are predicted to become more frequent with climate change. Thus, the durability of the tillage BACM could decline over time.
___________________
10 With tillage estimates of 130 hours/square mile (assuming a tillage rate of 4 km/hour (2.5 mph) and tillage spacing of 5 m (16.4 feet) and 17.6 gallons/hour using a 400-horsepower tractor (Grisso et al., 2014), fuel use is estimated at 2,300 gallons/square mile.
Managed Vegetation
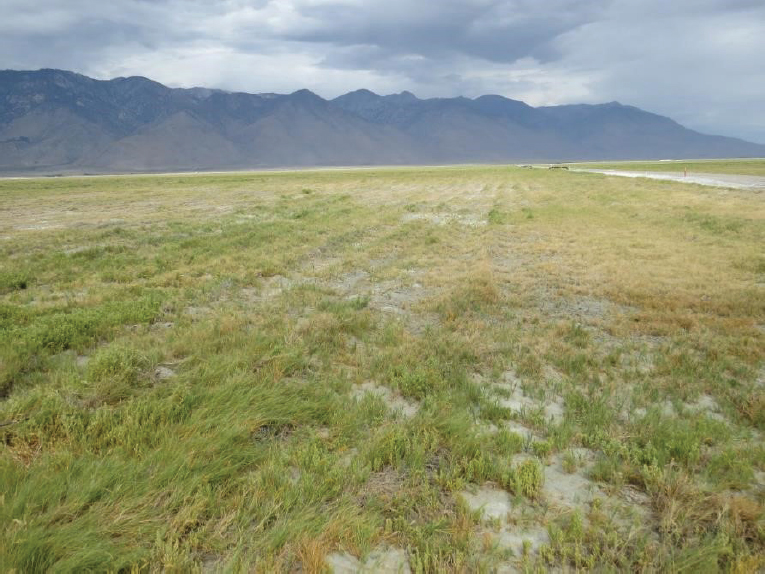
The managed vegetation BACM establishes locally adapted native vegetation into dust-emissive areas. Its initial implementation was restricted to saltgrass (Distichlis spicata), but in 2016 the species list for the managed vegetation BACM was expanded to include 47 additional species with a range of salinity tolerance, drought tolerance, flooding tolerance, rooting depth, and morphology. This increased palette of species allows for more diverse and resilient plant communities that can control dust through multiple pathways and maintain vegetation cover under variable conditions. At present, the vast majority of managed vegetation areas have been planted with saltgrass, and all data and evaluations below focus on stands of this species.
Vegetation can control dust by three key mechanisms: (1) covering and protecting the soil surface from wind, (2) decreasing wind energy at the soil surface, and (3) trapping dust particles that blow from or into the site. The relative importance of these mechanisms varies based on vegetation density, size, and morphology. In saltgrass stands, dust control is largely mediated through protecting the soil surface from the wind (reviewed in Lancaster and Baas, 1998) (see Figure 4-6).
SOURCE: Photo courtesy of Valerie Eviner, panel member.
Performance
Studies of the initial implementations of managed vegetation at Owens Lake evaluated the impact of percent cover of saltgrass on sand flux, as well as the related effects on PM10 emissions along the regulatory shoreline. An early small-scale study on a sandy area of Owens Lake found that 17.5 percent cover of saltgrass decreases sand flux by 95 percent (Lancaster and Baas, 1998).
The current vegetation cover requirements for this BACM are derived from a study of the largest area of managed vegetation on Owens Lake—2,100 acres in the southern end of the lake. Vegetation at this site was allowed to establish for 2 years (2002-2004), and then was monitored for 2 years. Sand flux decreased by an average of 99 percent (range of 97-100 percent) when vegetation cover was at least 20 percent. Plots with vegetated cover between 1 and 20 percent (with more than half of the plots being greater than 10 percent cover) resulted in an average of 97 percent decrease in sand flux (with a range of 82-100 percent) (Schaaf and Schreuder, 2006). Based on this study, 20 percent vegetation cover was established as the required minimum at any point in the year. Because vegetation sampling occurs in the fall, and vegetation cover can decrease by 10 percentage points over the winter dormancy period, leading to lowest vegetation cover in the springtime, the minimum fall vegetation cover was set at 30 percent.
Methods of assessing vegetation cover have varied over time (e.g., from point sampling to digital point sampling and satellite remote sensing methods) and by agency. Substantial effort resulted in standardized monitoring methods across the agencies involved in Owens Lake, with calibrations across the multiple ground methods and satellite measures (NewFields et al., 2007). As vegetation sampling methods shifted, the methods were calibrated, and the 30 percent vegetation cover under old vegetation sampling techniques was determined to be equivalent to 39 percent cover with new vegetation sampling techniques (NewFields et al., 2008). It is unclear how 39 percent was adjusted to 37 percent cover, but given the high dust control of much lower vegetation cover, it is likely that this current threshold is still conservative (Schaaf and Schreuder, 2006). Percent cover requirements could be refined with analyses of monitoring data using narrower vegetation cover categories.
Based on these initial data, surface cover of vegetation has become the primary performance measure for the managed vegetation BACM. Vegetation cover is assessed every fall (between September 21 and December 21) using satellite imagery that quantifies percent cover of vegetation. These images are then ground-truthed using digital point frames (GBUAPCB, 2016a). The BACM requires an average 37 percent vegetation cover, but it acknowledges that vegetation cover can be patchy and that small areas of lower vegetation cover will not be emissive. Standards for assessing suitable levels of patchiness at various grid scales are provided in the SIP (GBUAPCB, 2016a). As the patch size increases (e.g., from 0.1 to 100 acres), there are requirements for a higher percentage of the area to achieve each
threshold of vegetation cover; for example, at a grid scale of 100 acres, there is less tolerance for low-vegetation cover patches than at 0.1 acre.
Arid systems experience substantial edge effects, with the windward edge being more emissive as it takes the brunt of the wind force (Buckley, 1987). Thus, the overall effectiveness of dust control also depends on the size of managed vegetation units and whether they are adjacent to other DCMs that decrease wind force (e.g., roughness elements, tillage).
Practical Considerations
Managed vegetation dust control plots require at least 2 to 3 years to establish (Schaaf and Schreuder, 2006), so this approach is not suitable as an emergency response in an emissive area. In fact, weather variability or setbacks in construction scheduling can challenge full establishment of this BACM within the 3-year permitting and compliance window required by the agencies for BACM transitions. The establishment phase typically requires five key steps: (1) installing flood control infrastructure to prevent flood damage to the area, (2) installing tile drains and pumps if needed to lower shallow saline groundwater levels, (3) leaching salts from the soil, (4) planting vegetation, and (5) maintaining and enhancing vegetation. Delivering water to plants can be challenging. Drip irrigation, while water efficient, has high rates of emitter failure, particularly with saline water. Where flood irrigation is used in sandy soils, furrows are critical to water delivery to the plants. A long-term challenge is preventing salt accumulation, which can be caused by excessive irrigation (high cumulative salt input over time) and poor drainage, or low or sporadic irrigation rates (which over time can add salts but fail to flush salts out of the rooting zone) (Scheidlinger, 2008b).
The most vulnerable time period for this BACM is at the establishment phase. Under windy conditions, sowed seeds can blow away (Scheidlinger, 2008b). Wet years can be particularly challenging for vegetation establishment, because saline groundwater can rise into the rooting zone, and seedlings are especially sensitive to salinity (Burgess and Schaaf, 2019). Seedlings are also more vulnerable than mature plants to damage and mortality through sand blasting (Scheidlinger, 2008b). Hybrid dust control approaches may be useful during plant establishment, such as artificial roughness or precision surface wetting, discussed later in this chapter.
Once established, vegetation cover and its dust control are durable and reliable over the long term, as long as appropriate salinity conditions are maintained (Scheidlinger, 2008b). In 2002, 2,240 acres of managed vegetation were planted and achieved an average of 42 percent vegetation cover. Only 400 acres had poor establishment, and once these areas received modifications in drainage and replanting, all but 11 acres were in compliance (GBUAPCD, 2016a). The sites with long-term vegetation cover declines are usually not suitable for managed vegetation, or soil salinity was not sufficiently remediated prior to planting (Scheidlinger, 2008b).
Vegetation cover can decrease in the short term in response to floods (saltgrass has low flood tolerance), rising groundwater in wet years, surface ponding, and unexplained declines,
but most areas recover within a couple years. With managed vegetation BACMs, vegetation cover generally is only weakly affected by lower precipitation years and can survive at least one season without irrigation, as long as there is no saltwater intrusion (Scheidlinger, 2008b). Temporary decreases in vegetation cover may not impact PM10 emissions because dead vegetation can persist for at least 3 years and provide similar dust control as live vegetation, allowing for a 3-year temporal buffer of dust control while vegetation recovers (Scheidlinger, 1997). In addition, the relatively conservative threshold of required percent cover ensures that dust emissions are minimal, although managed vegetation dust control areas can be non-compliant at times (LADWP, 2018).
Achieving the full potential of this BACM over the long term would be aided by a more flexible regulatory timeline at establishment, because strict time frames are not realistic for establishment of a biological system. For example, leaching salts from sandy soils can be relatively easy, but may require many rounds of flooding and leaching in clay soils. These initial delays can lead to managers missing the two short planting windows that are available each year to establish vegetation (Scheidlinger, 2008b). Similarly, vegetation establishment and spread can vary based on annual weather conditions or level of remediation of soil salinity. Even when initial establishment is low, saltgrass rhizomes spread (Trimble, 1999) and would likely achieve the targeted percent cover given more time. However, under the current regulatory time frame of 3 years to meet performance criteria (Board Order 160413-01), there is no flexibility to allow this to occur. For example, the panel visited a managed vegetation site that will be converted to shallow flooding because vegetation cover was slightly below the required threshold, even though the site contained a healthy-looking saltgrass stand.
The extensive list of conditions that must be managed for vegetation establishment and maintenance highlights the diverse conditions necessary for plant cover. Thus, it is not surprising that site-specific conditions (e.g., soil type, salinity, groundwater depth, quality of irrigation source water) will strongly impact the management practices, costs, and potential of sites for vegetation establishment across the lake (LADWP, 2010; Scheidlinger, 2008b). Box 4-1 describes some of the location-specific factors that impact the performance and water use of the managed vegetation BACM. Of the projects implemented on Owens Lake, most managed vegetation BACMs were located on mudflat and saltcrust areas, which are more difficult to leach and maintain salinity. This likely skews existing water and cost data to more expensive, more long-term maintenance scenarios, compared to managed vegetation efforts focused on sandy areas of the lake that have been leached with freshwater from shallow flooding, or areas closer to the regulatory shoreline, which tend to be sandy, less saline, and with deeper groundwater. With the expanded species palette, it is likely that better matching of vegetation to site conditions will improve effectiveness of this BACM and will result in fewer costs and less maintenance. The more diverse vegetation choices recently approved also provide options for dust control from off-lake emissive areas.
SOURCE: LADWP and GBUAPCD, 2002.
Water Use
Water use to establish managed vegetation can vary greatly, depending on soil texture and salinity. The amount of water to flush salts from the rooting zone of the soil can vary from 0.1 ft to more than 8 ft of water (Scheidlinger, 2008b). Establishing vegetation can require 1.2-4.0 ft/year, and current irrigation rates on established vegetation range from 1.1 acre-ft/year for drip irrigation to 1.5-2.65 acre-ft/year with sprinklers (Valenzuela, 2019b). It is not clear how much of the water use difference between sprinklers and drip irrigation is due to evaporation and how much is related to the soil types on which these irrigation systems are applied. Long-term irrigation needs are likely far lower, and saltgrass can withstand at least 1 year of no irrigation (Scheidlinger, 2008b). With the expanded palette of species available under the managed vegetation BACM, the required water use will range widely, with the potential for some of the dryland species to require minimal water beyond the establishment phase.
The salinity of water applied to managed vegetation is critical, with the value depending on vegetation type and soil texture. Care must be taken to minimize long-term salt accumulation due to irrigation (Scheidlinger, 2008b).
Environmental Implications
Dry alkali meadows, such as the saltgrass planted as part of the managed vegetation BACM, are a regional hotspot for ecosystem productivity and community diversity (LADWP, 2010; Pavlik, 2008; see Figure 4-8). In fact, managed vegetation areas on Owens Lake are used to fulfill mitigation requirements due to habitat destruction in other parts of the lake (GBUAPCD, 2016a). Saltgrass meadows can provide habitat for diverse invertebrates (e.g., ants, spiders, grasshoppers, and crickets), birds (e.g., Savannah Sparrow, Horned Lark, and American Kestrel), and small mammals (e.g., kangaroo rat, mice, gophers, and rabbits). Reptiles are expected but not confirmed. When adjacent to shallow flooding areas, managed vegetation can also provide important resting habitat for waterbird species such as the Long-billed Curlew and Wilson’s Phalarope (LADWP, 2010). The expanded species list for the managed vegetation BACM allows for creation of additional habitats, including alkali marsh, playa scrub, and freshwater marsh and riparian systems.
Managed vegetation meets the California Public Trust, providing aesthetics, valuable habitat, and recreational activities. Areas that require high infrastructure for vegetation establishment (e.g., tile drains, irrigation infrastructure) are not compatible with cultural resources.
Energy Use
As with water, long-term maintenance, and thus energy use will largely be determined by site conditions. Because most of the dust producing areas have saline groundwater in or near the rooting zones, these will require pumping from the drainage system during most of the year, resulting in ongoing energy use. Areas of coarse textured soils, such as often found near
SOURCE: Photo courtesy of Valerie Eviner, panel member.
the historic shoreline and in the northern portion of the lakebed may, over time, become sufficiently leached and naturally drained that they will not need a managed drainage system.
Cost
To implement the sprinkler approach to managed vegetation in Phases 7a, 9, and 10 of Owens Lake dust control, establishment of the BACM required $36 million/square mile in capital costs, while the drip irrigation–based managed vegetation farm initially cost $20 million/square mile. These initial costs included soil reclamation, mass grading, subsurface draining materials, planting materials, and extra fees due to a compressed construction schedule to meet the narrow planting window. As described in the previous section on practical considerations, the logistics of setup and maintenance of managed vegetation can be extremely variable depending on groundwater, salinity, soil texture, and weather conditions at the time of planting. For the most part, managed vegetation has been applied to areas that would incur higher costs due to relatively clay-rich soils with shallow and saline groundwater. This decision
was partly based on setup costs, including more irrigation, but more so on the need to perpetually maintain groundwater levels through tile drains and pumping. Annual operating costs are currently $2.35 million/square mile for the sprinkler approach and $1.64 million/square mile for the drip irrigation approach. Routine maintenance includes repairing irrigation leaks, fertilizing approximately once a year, and cleaning irrigation filters. Costs could be decreased by focusing on areas where long-term maintenance would be minimal, such as in lower-salinity sandy soils near the lakeshore, and in sandy soils in the playa already leached of salts, where vegetation is naturally establishing (LADWP, 2010).
Over the long term, irrigation and drainage infrastructure and pumps will need to be periodically replaced. LADWP estimates that this infrastructure will last 20 years, and will require complete reestablishment costs at that time.
Systemwide Considerations
Long-term management of groundwater levels and salinity are the most critical factors for durability and reliability of the managed vegetation BACM. These factors are highly dependent on siting considerations (e.g., soil type, depth to groundwater). Adjacent dust control areas can also influence the durability of managed vegetation parcels. For example, dieback of saltgrass occurred due to a rise in saline groundwater during construction of an adjacent dust control area (Scheidlinger, 2008b). Because long-term vegetation vigor depends on keeping saline groundwater below the rooting zone, managed vegetation in large contiguous areas (e.g., those in the southeast part of the lake) are beneficial (Scheidlinger, 2008b). Placing managed vegetation adjacent to freshwater BACMs can allow for natural vegetation spread into those areas, increasing not only dust control over the long term, but also groundwater levels. Another important consideration in adjacency is that the tile drains avoid impacting the surface water or groundwater of existing wetlands (GBUAPCD, 2016a).
System-level considerations will become critical under climate change. Increased temperatures, particularly during the summer, will increase evapotranspiration and can exacerbate plant water limitations. However, changes in precipitation patterns will likely be the greatest challenge to managing vegetation. Year to year, precipitation will be highly variable, and high precipitation years could cause uncontrolled flooding and increases in saline groundwater levels. Saltgrass is one of the most salinity-tolerant species approved for managed vegetation, although it is highly susceptible to saline groundwater intrusion into the rooting zone (Scheidlinger, 2008b). Other species will likely be even more susceptible to saline groundwater. An increase in the diversity of species used in managed vegetation can increase the stability of vegetation cover under fluctuating conditions (Hector et al., 2010; Isbell et al., 2015), especially in the parts of the lake with deeper groundwater and lower salinity, where salinity mortality associated with rising groundwater is unlikely.
Information Needs to Inform Decision Making
The largest improvement in the managed vegetation BACM also reflects the largest information gap. Although the number of approved species has increased from 1 to 48 and the number of ecosystem types has increased from 1 to 4, there is little data on any species other than saltgrass at Owens Lake in terms of management needs for establishment, and on resilience and reliability due to short- and long-term environmental changes. Similarly, there is a need to understand the performance and functioning of different vegetation species, including habitat provisioning, dust control, and effects of salinity. Also needed is evaluation of how diverse plantings differ from monocultures in terms of performance and ecosystem effects. Diverse plantings are particularly important because they can often enhance the delivery of multiple ecosystem services, minimizing the tradeoffs associated with any single species (Lefcheck et al., 2015; Maestre et al., 2012; van der Plas et al., 2016; Zavaleta et al., 2010).
Another unanswered question is the extent to which these vegetation communities can maintain themselves over the long term, minimizing the need for perpetual management and thus decreasing costs and water use. For example, woody species have been used in other semi-arid systems to lower the groundwater table and to prevent saline groundwater from intruding into rooting zones (Bell et al., 1990), which would be an important tool if possible with the species and conditions at Owens Lake.
A key challenge lies in how to design plant communities to withstand the projected increases in extreme weather conditions year to year, with expected fluctuations between multiyear droughts and intense flooding associated with more rapid snow melt, more intense storms, and high rainfall El Niño years. Extremes in precipitation will be compounded by increased temperatures leading to higher evapotranspiration. Another challenge lies in how to manage salinity over the long term in a terminal alkali basin where salts naturally accumulate. This answer is critical, not only because of vegetation requirements but also because clay soil structures can collapse if salinity is greatly reduced. Other pressing questions for Owens Lake include where are the most appropriate areas for specific plant types and communities used in managed vegetation BACMs, how large must these vegetated areas be to minimize required maintenance, and how are they affected by adjacent dust control measures?
The ways in which natural spatial and temporal variability in vegetation impacts dust control is another important consideration, because the strict regulations of time frames and threshold percent vegetation cover values are not always realistic in an ecological system, where variability is the norm but ecosystem services can be maintained despite this variability. Understanding whether lower percent cover (especially of more diverse vegetation communities) can achieve dust control is important, because the long-term durability, effectiveness, and self-maintenance of managed vegetation may be worth the tradeoffs of short-term decreases in vegetation cover due to environmental variability or delays in vegetation establishment.
Current models poorly predict the effects of vegetation cover on dust control, because they do not adequately account for vegetation clumpiness or changing wind direction (Okin, 2008; Okin et al., 2006) and monitoring by satellite remote sensing (as currently done at Owens Lake) does not allow for quantification of the patchiness of vegetation on the ground. Studies could examine the value of higher resolution data using airborne imagery or unmanned aerial systems (i.e., drones; Cunliffe et al. 2016) and their capabilities with visual and hyperspectral cameras.
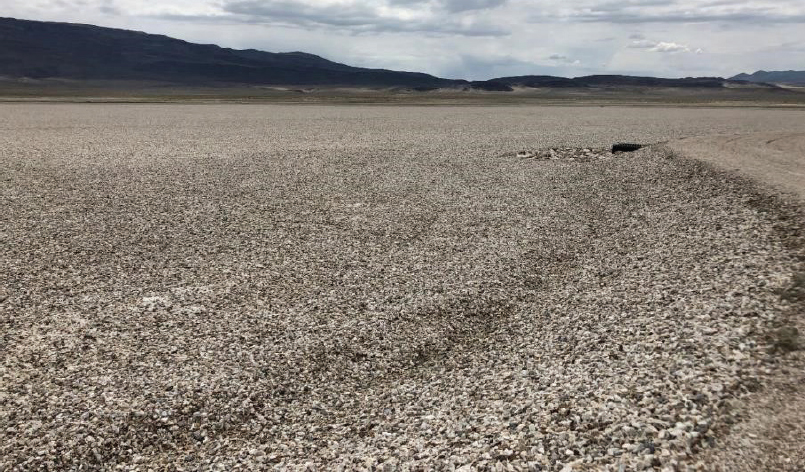
Gravel
Gravel cover is a zero-water-use DCM that involves distributing a layer of gravel on an emissive lakebed to protect it from wind (see Figure 4-9). Gravel protects the bare ground underneath it against wind erosion by substantially reducing the capillary rise of saline groundwater and salt and crust formation.
Some areas are covered by 4 inches of gravel (GBAPCD, 2003), while others are covered by 2 inches, underlain with a permanent permeable geotextile fabric to prevent settling of the gravel (GBAPCD, 2013b). The gravel, which is mined and transported to the site, is required to be of similar color to that of the lakebed soils and be at least 0.5 inches in diameter. The geotextile fabric is a 2.3-mm thick (90 mils) artificial fabric that is permeable to draining
SOURCE: Photo courtesy of Stephanie Johnson, National Academies.
and resistant against acids and alkali elements of the soils. To protect the gravel-covered area from flooding, channels and drains are incorporated in the area surrounding the control area (GBUAPCD, 2008, 2013b).
Performance
The District has estimated that PM10 emissions from an area covered with gravel with the specifications listed above will be reduced by 100 percent given the expected highest wind speeds at the lakebed. This estimate is based on a study that found that a gravel layer, with stone sizes of 0.25 inches in diameter and larger, has an entrainment wind velocity threshold of more than 90 mph (measured at 10 m [32.8 feet]) (GBUAPCD, 2008; Ono and Keisler, 1996). The District investigated the effectiveness of a gravel blanket to prevent salt accumulation at the surface (efflorescence) at two sites in June 1986 and concluded that the salt efflorescence was prevented in plots covered by 4 inches of 0.5- to 1.5-inch diameter gravel (Cox, 1996b).
Practical Considerations
The effectiveness of the gravel BACM is immediate when an emissive area is fully covered as described above. However, if applied in areas adjacent/downwind of emissive surfaces, its effectiveness is compromised because sand and silt from upwind emissive regions may fill the gaps or cover the gravel, allowing greater capillary rise of saline water and salt efflorescence at the surface, making them prone to secondary emissions. Given the time it takes to prepare a site for gravel distribution, gravel is not suitable as an emergency control.
Areas covered by gravel are monitored visually each year for signs of dust and sand accumulation, washouts, or inundation (GBUAPCD, 2013c). When fine sands and silts fill the gaps in the gravel, capillary rise of saline groundwater will increase, lowering gravel’s effectiveness for dust control (Cox, 1996b). When deterioration in gravel coverage is observed in areas larger than 1 acre, the gravel will be raked to allow the fines to settle toward the bottom. If raking cannot restore target control efficiencies, additional gravel can be brought to the site. Gravel as a DCM is expected to last for decades; it is estimated that the gravel used during phase 7a (total area of 1.5 square miles) will need to be replenished in 50 years after installation (GBUAPCD, 2013d) although LADWP staff estimate a 20-year lifespan for the gravel BACM (Valenzuela, 2019b). Overall, little maintenance is expected for gravel cover unless it is adjacent to uncontrolled emissions where dust deposition on gravel would trigger the need for raking.
Water Use
No water use is required at any point in the installation or maintenance of the gravel BACM.
Environmental Implications
Overall, gravel provides relatively low-quality habitat relative to other DCMs. Distribution of gravel prevents vegetation growth; however, if placed adjacent to shallow-flooding areas, it can provide some nesting habitat for shorebirds. Continuation of gravel mining from nearby resources may negatively impact the sensitive areas surrounding the mine while also leaving a negative visual sight at the mines. Mining, transport, and distribution of the gravel will also lead to emissions of some other atmospheric pollutants (e.g., soot, nitrogen oxides, CO2, and hydrocarbons).
Gravel also has low aesthetic value. Because installation and maintenance requires heavy machinery, the BACM is not suitable for environmentally sensitive areas.
Energy Use
Energy associated with the gravel BACM is used during gravel mining, gravel transport to and within Owens Lake, site preparation, and installation. For a 4-inch layer of gravel, an average of 510,000 tons of gravel are distributed per square mile (LADWP, 2013). With an average energy consumption rate of approximately 17 megawatt hours/ton in mining of industrial minerals (e.g., gravel) (BCS Incorporated, 2007), mining of gravel alone is estimated to use 8.7 million megawatt hours/square mile. In addition, assuming trucks can carry approximately 25 tons of gravel per trip (LADWP, 2013), 20,000 trips/square mile are needed to move the gravel from the mining site to the gravel stockpile on the lake and from the stockpile to the final dust control location. Total energy associated with transporting gravel depends on the distances traveled in each trip and the truck’s engine efficiency. Equipment used during land leveling, distribution of the geotextile fabric, and distribution of the gravel also contribute to the total energy use associated with the gravel BACM. Energy use is most intense during the installation and is expected to be significantly lower during the life of the gravel BACM because of its low maintenance.
Cost
LADWP engineers estimate the capital costs associated with the gravel BACM to be $37 million/square mile. Annual operating costs are $230,000/square mile.
Systemwide Issues
The gravel BACM is resilient against climate change except in the events of extreme precipitation/flooding, which causes either transport of sediments over the gravel or displacement of the gravel itself.
OTHER NON-BACM DUST CONTROL MEASURES
The panel reviewed nine other DCMs that show potential for use in dust control on the Owens Lake bed. Some of the measures also show potential for control of off-lake sources.
Precision Surface Wetting
Precision surface wetting as demonstrated in the Shallow Flooding Wetness Curve Refinement Field Test (SFWCRFT; LADWP, 2019b) represents a modification to the existing shallow flooding BACM. Precision surface wetting utilizes reciprocating sprinklers or perforated whip lines to wet circular areas of the lakebed to target a specific wetted percentage. Testing has been conducted in the SFWCRFT to examine approaches to using precision surface wetting to reduce water use while controlling dust emissions.
Precision surface wetting controls wind-induced erosion of soils and the resultant PM10 emissions by several mechanisms. First, individual grains on moist surfaces are linked by water molecules to form cohesive surfaces requiring much greater energy to entrain (Ravi et al., 2006). In addition, the presence of free or near-free water on the surface and in the air from sprinkler droplets tend to increase the humidity in the laminar boundary layer over and downwind of the wetted circle. Humidity above a certain threshold has been shown to inhibit dust entrainment (Ravi and D’Odorico, 2005; Ravi et al., 2004). Finally, for soils in-between the wetted circles, any particles entrained by the wind would eventually impact a wetted circle and lodge in the moist surface or collide with a sprinkler droplet and become wet deposition on the surface (Stulov et al., 1978).
Performance
The SFWCRFT examined the dust control at different wetted percentages up to 75 percent wetted area at four locations on the Owens Lake bed and LADWP has proposed additional testing (LADWP, 2019b). The sprinklers and whip lines operated during the dust control season from October 15 to May 15, although some challenges were observed in sustaining the target wetted areas throughout the dust season (Air Sciences, Inc., 2016). Performance was assessed with the proxy measurement of horizontal mass flux using Cox Sand Catchers and Sensits along with remote cameras that record dust plume emissions. The test included an unwetted control at each location, providing contemporaneous measurements to calculate the control efficiency for each wind event or measurement interval.
Preliminary data show promise for use of this approach to control PM10 emissions while potentially saving water (Air Sciences, Inc., 2016). At the sandy sediment site, the reported average of monthly control efficiencies for the 2015-2016 dust season were 96.4 percent, 97.7 percent, 99.4 percent, and 99.0 percent for the 45 percent, 55 percent, 65 percent, and 75 percent wetted cover treatments, respectively. Given the extent of volunteer vegetation at these sites, with mature vegetation, it may be possible to achieve BACM levels of dust control with lower wetted cover.
Practical Considerations
This DCM requires substantial water distribution infrastructure and therefore is not suitable for emergency use. Sprinklers or whip lines will be more effective than laterals,
because water from low-pressure lateral piping tends to follow microtopographic depressions and thus not wet a uniform and predictable area. Sprinklers, valves, and pumps are built with moving parts that wear and may corrode in the saline environment of Owens Lake. They will need to be replaced on a periodic basis and represent a perpetual material and labor expense. LADWP reported the expected lifespan of sprinklers to be 20 years (Valenzuela, 2019b). If properly maintained and operated, precision surface wetting should be a very reliable DCM.
Water Use
Because of the increased application efficiency inherent with sprinklers and other orifice-controlled application methods over simple standpipe flooding (Letey et al., 2007), this DCM is expected to use applied water more efficiently than shallow flooding. The water use needed for precision surface wetting remains uncertain, because the pilot testing failed to consistently maintain the target wetted areas over time. At the sandy site during the 2015-2016 dust season, two treatments reported 99 percent control efficiencies, as mentioned above. An average water use of 2.0 ft/year was reported from the 65 percent wetted cover treatment but met the target wetness for only 4 months. Likewise, an average water use of 2.3 ft/year was reported from the 75 percent wetted cover treatment but met the target wetness for only 2 months. These amounts represent water savings compared to 3 ft/year for shallow flooding with laterals and 2.68 ft/year for shallow flooding with sprinklers. Although these data are limited, they suggest water savings may be feasible.
Environmental Implications
Precision surface wetting using sprinklers does not offer the shallow pools necessary for waterfowl and shorebird habitat. Nevertheless, at the SFWCRFT site located at a relatively high elevation on the lakebed, the sprinklers promoted vegetation that could provide valuable habitat and shelter for terrestrial birds and other vertebrates. The volunteer vegetation sustained in the wetted cover areas is possibly a surrogate for the alkali meadow habitat that is in decline locally. The capacity for precision surface wetting to support vegetation at other sites would depend on the salinity of the soil and the depth to shallow groundwater. At sites with high salinity and shallow saline groundwater, minimal vegetation could be supported, and thus at these sites, precision surface wetting would provide minimal to no habitat.
Precision surface wetting requires a large amount of distributed irrigation infrastructure with traffic to install and maintain, which would impact environmentally sensitive areas. Even though the lateral piping and sprinklers are unsightly, the colonization of the wetted cover by grasses, forbs, and shrubs would contribute to the aesthetic value, especially from a distance.
Energy Use
Installation of a precision surface wetting system involves energy use associated with transporting the pipe, sprinklers, and pumps. Energy use is required during operation to supply the water pressures necessary for sprinkler operation.
Cost
Cost estimates were not available for precision surface wetting, but they can be approximated based on the costs of shallow flooding with sprinklers. According to LADWP, the cost of shallow flooding with sprinklers, which represents similar infrastructure requirements, is $32 million/square mile. The infrastructure costs for precision surface wetting could be expected to decrease by 13 percent for each 10 percent reduction below 75 percent wetted surface coverage. Operating costs, estimated at $340,000/year based on the costs of shallow flooding with sprinklers, would consist of monitoring and maintaining the water distribution infrastructure (Valenzuela, 2019b). Although the installation costs are comparable to that for shallow flooding with sprinklers, the reduced water use would be expected to result in substantial operational cost savings.
Systemwide Issues
Climate change experts are predicting more frequent and longer duration droughts, which could impact this DCM (although less so than shallow flooding). Extreme events such as floods could damage pumps and valves.
The use of sprinklers at higher elevations in the lakebed would best support the growth of native vegetation without the additional cost and infrastructure of underdrains. Ultimately, the establishment of vegetation could reduce the need for wetted coverage, further reducing water demand. The colonization of the wetted areas would result in reduced near-surface wind speeds for a short distance downwind, potentially benefiting adjacent BACMs.
Information Needs to Inform Decision Making
More work is needed to document the percent wetted area necessary to obtain the required control efficiency. Tests of this DCM have suffered from a lack of statistical replications and the random capping of sprinklers to achieve the desired wetted area percentage. The lack of true replication impacts the scientific integrity of the test. Performance testing should be replicated in at least three locations with all wetted cover percentages including zero percent represented in each replicate. The random capping of sprinklers is probably limiting the potential control effectiveness because longer areas of fetch between wetted circles tend to favor the saltation cascades and resulting entrainment of dry sediments. The use of orifices and pressure to control the diameter of the wetted circles or simply different sprinkler spacings would improve the design and would limit the fetch distances of unwetted and unprotected surfaces. In addition,
alternating the placement of the sprinklers on adjacent supply lines would more fully limit the possibility of long distances of unwetted surface aligning with the wind direction.
Understanding of the surface soil moisture level will be critical to reducing water use while preventing PM10 emissions. LADWP has an ongoing pilot study on soil moisture sensors that rely on the electromagnetic properties of the soil to determine water content and its variation with depth. However, these measurements are unlikely to provide useful data on the soil water content at the surface, the most vulnerable portion of the profile. Such sensors have been shown to be inaccurate in saline soils (Schwartz et al., 2018), and the estimates are integrated over a measurement volume of approximately 1 liter. McKenna Neuman et al. (2018) noted that even though the vertically integrated gravimetric water content (GWC) varied by less than 5 percent during a 2- to 3-day drying period, the surface water content in the upper 1 mm of soil decreased from about 25 percent to as low as 2-3 percent. LADWP should instead examine infrared thermometry to estimate surface and near-surface wetness. Infrared thermometry has long been used to estimate the evaporation rate of the soil surface, a function of surface and near-surface GWC (Evett et al., 1994; Qiu et al., 1999; Qiu and Ben-Asher, 2010). Other low-cost techniques to measure soil surface temperature and soil moisture content at high spatial resolution are also becoming more available, including fiber-optic based approaches (Sayde et al., 2010; Steele-Dunne et al., 2010). These measurements can be automated, are inexpensive, and would provide uninterrupted data on ground conditions between remote sensing images.
Among the advantages of precision surface wetting is the potential for dynamic operations based on climatic conditions. During periods with predicted wind velocities less than threshold, it would not be necessary to keep the wetted circles near saturation. Instead, sprinklers could be operated periodically to keep colonizing vegetation healthy, with additional sprinkler operation only a few hours before and during predicted high wind speed events. Trials of this dynamic precision surface wetting could be undertaken on smaller plots as part of the replicated field trials to test the effectiveness and water savings of this approach. Use of dynamic operations would necessitate alternate, real-time performance criteria, such as cameras and low-cost PM10 sensors along the DCM boundary.
Additional research could examine the use of precision surface wetting to build surface evaporite crusts that might eventually control dust emissions with less or no water use. According to McKenna Neuman et al. (2018), wetting the surface and allowing it to dry resulted in the formation of evaporites, aggregates too large to be entrained, and/or a surface crust that, if not disturbed, reduced dust emissions by at least three orders of magnitude compared to dry loose sediments. Further, they rarely found subsequent PM10 concentrations in the wind tunnel that exceeded 100 µg/m3, a level allowable by National Ambient Air Quality Standards (NAAQS), although still exceeding California air quality requirements. Large droplets from high-intensity precipitation events and sprinklers are highly effective at forming physical soil crusts (Fang et al., 2007; Wu and Fan, 2002).
Additional study of salinity issues would inform understanding of the long-term sustainability of these potential DCMs. Researchers could also examine the role of precision surface wetting as a temporary DCM for vegetation that takes longer than 3 years to reach full performance.
Artificial Roughness Elements
Artificial roughness as a DCM is divided into four types: solid natural, porous natural, solid engineered, and porous engineered. The mechanistic basis for the ability of artificial roughness to control dust is common among the four types. Roughness elements (either natural or artificial) can reduce the effect of the wind’s ability to move sediment on the surface and, therefore, emit dust. Roughness elements protect the surface from dust emission through several mechanisms (Wolfe and Nickling, 1993, 1996). First, the area directly underneath the roughness is generally protected from the force of the wind by the roughness itself. Second, the roughness elements extract momentum from the air. In doing so, they create wakes of relatively low shear stress in which it is more difficult for the wind to exceed the threshold shear stress for particle entrainment (Okin, 2008; Walter et al., 2012). Third, roughness and the wakes produced by roughness trap moving sediment, thus protecting it from additional transport (Raupach et al., 2001).
The material that makes up the roughness does not, in and of itself, matter, and therefore identical roughness elements made of different materials will behave identically. Thus, whether the roughness is natural or engineered is irrelevant. However, the porosity of roughness matters considerably for its behavior. Solid roughness acts as a bluff body, forcing the airstream to go around the object. This leads to acceleration of the airstream around the object, which leads to greater shear stresses at the sides of the roughness (e.g., Walter et al., 2012). In turn, scouring around sparsely arrayed individual roughness elements can occur (Nickling and McKenna-Neuman, 1995). In contrast, turbulent flow that develops within porous roughness elements more effectively removes momentum from the airstream, with the depression of wake-zone shear stress being related to optical porosity (Cheng et al., 2018). Flowthrough porous roughness, in addition, contributes to the capture of particles (Raupach et al., 2001) and reduction of scour on the sides of individual roughness elements (Walter et al., 2012).
Performance
Solid natural roughness.
The only type of artificial roughness that has been implemented at a large scale in the Owens Lake area is in the Keeler Dunes area, where straw bales are used as solid natural roughness elements (see Box 4-2 and Figure 4-10). The District reports that 92 percent sediment transport control efficiency was achieved in the center of the array (Gillies and Green, 2014; Holder, 2019b). In the small-scale (1.2-acre) pilot test (Gillies
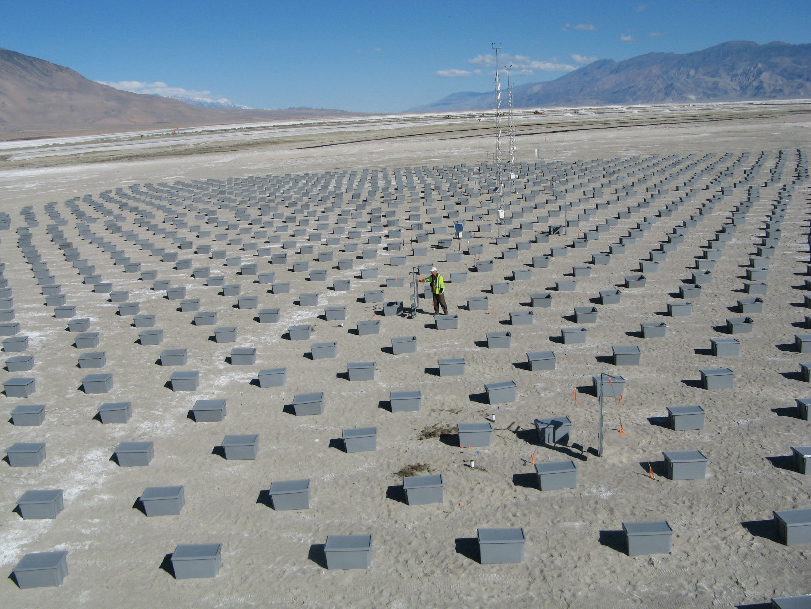
SOURCE: Holder, 2019d.
and Green, 2014), the overall control efficiency was considerably less because this control efficiency was not attained throughout the treatment. This result is due to the large spatial scale over which transport control becomes effective; sediment transport control efficiency is not achieved until some distance from the edge of the area where the roughness elements are deployed (at a normalized distance downwind [NDD; the distance downwind divided by the height of the roughness element] of about 100 NDD or about 40 m [131 feet] with 40-cm [15.7 feet] high bales). Similar edge effects occur in managed vegetation sites as well, if the sites are not bounded by other measures that reduce near-surface wind velocities. Scouring/burial can also reduce the effectiveness of the roughness elements as DCMs.
Solid engineered roughness.
All things being equal, solid engineered roughness elements (see Figure 4-10) would likely perform the same as solid natural roughness elements. In the short-term experimental work done in 2014 (T1A-4) and 2015-2016 (T26), control efficiency of 90 percent was achieved in the center of the array (~160 NDD, ~60 m from the edge of the array), though the distance over which control efficiency is obtained depends on the density and distribution of roughness elements (Gillies et al., 2017, 2018a).
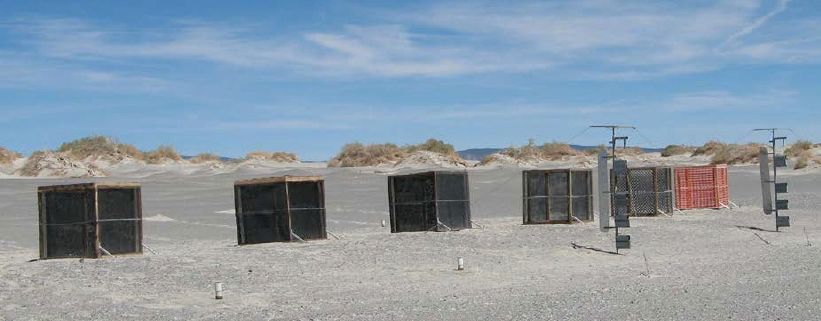
SOURCE: Holder, 2019c.
Porous roughness.
Only limited testing has been done with porous roughness elements (see Figure 4-11), and never at Owens Lake. Porous engineered roughness elements were investigated in wind tunnel tests and at Mono Lake in 2017-2018. The results of these tests confirm that porous engineered roughness elements attain target control efficiencies over shorter distances than solid roughness elements (~70 NDD for porous roughness elements and ~140 for solid roughness elements) (Gillies et al., 2017, 2018b).
No testing has been done with porous natural roughness elements (e.g., brush piles, or “vertical mulch”), but this approach could combine the positive features of the other approaches without many of the negative effects. For instance, as porous elements, they would likely attain target control efficiency at shorter distances from the edge compared to solid natural roughness elements and would also reduce the amount of scouring and burial induced by individual roughness elements.
Practical Considerations
The use of roughness elements made of natural materials holds some promise as a way to promote establishment of native shrub communities. In addition to protecting the plants from abrasion and reducing the overall level of horizontal flux, the eventual breakdown of the natural material would add organic matter to the soil, resulting in improved soil water-holding capacity, supporting plant growth and therefore providing the potential for the DCM to be self-sustaining.
An additional benefit of solid natural roughness elements as a DCM is that they could be deployed rapidly, and reversibly, as an emergency measure should a BACM fail. The material from which the roughness elements are made would determine their longevity in the Owens Lake environment.
Water Use
No additional water is required to support artificial roughness as a DCM, unless establishment of vegetation is a specific goal of the project to enhance longevity of the control. At Keeler Dunes, water use was 0.1 ft/year during establishment of vegetation (Holder, 2019c).
Environmental Implications
Artificial roughness can serve as nurse sites for native shrubs, which enhance the habitat for small mammals and other native animals. Because of their lower density, porous roughness elements would likely be better sites for native shrub establishment (probably only if the shrubs are occasionally artificially watered). Porous natural roughness elements would also provide habitat for native animals. Although weed/seed-free bales were used at Keeler Dunes, straw bales raise concerns about the introduction of unwanted species.
Through decomposition, natural roughness elements would likely contribute to soil organic matter development and increase soil water-holding capacity, especially on sands. Depending on their source material, engineered artificial roughness elements would not, in all likelihood, contribute to soil water-holding capacity as they degraded; rather, they would contribute to pollution by plastic particles of all sizes.
The aesthetics of artificial roughness elements is a downside, although some effort can be made to mimic natural vegetation distribution.
Energy Use
Artificial roughness is a relatively low-energy DCM. Energy use in artificial roughness is associated with the production and transport of the roughness materials. Engineered roughness elements would have higher energy use associated with their production compared to natural roughness.
Cost
The capital costs of the Keeler Dunes project were $52 million/square mile with plantings included and $9 million/square mile without. Annual operating costs without plants are minimal (estimated at ~$230,000/year based on the costs of gravel BACM), and with periodic watering of the plants operating costs are $1.1 million/square mile. The capital costs of engineered roughness are estimated at $64 million/square mile and $45 million/square mile for porous and solid, respectively (Gillies et al., 2017; Holder, 2019c,d). No estimates are available for installation costs for natural porous roughness.
Information Needs to Inform Decision Making
The lack of testing of natural porous roughness on the lakebed, especially in places where vegetation has the potential to be regenerated, is a major gap in our understanding of the potential for artificial roughness to contribute to dust control.
Shrubs: Modification of Managed Vegetation BACM Coverage Requirements
Shrub communities composed of several salt-tolerant shrub species are commonly found on the Owens Lake playa surface as well as the surrounding bajadas above the regulatory shoreline. Native plant communities stabilize otherwise erodible surfaces by reducing the wind speed at the surface, filtering entrained sediments through the canopy, and by biotic factors including root mass and shedding of biomass on the surface under the canopies. The current vegetation cover BACM requires a minimum of 37 percent vegetation cover, with additional spatial distribution requirements, to produce an estimated 99 percent dust control efficiency. The original experiments and existing vegetation plantings for dust control on Owens Lake use saltgrass. However, with the addition of more native species to the approved vegetation list, the potential for the use of shrubs as a DCM has arisen. LADWP has proposed to test whether similar control efficiencies could be obtained using shrubs with lower percent vegetation cover and water use.
The mechanisms by which vegetation reduces aeolian transport, and therefore dust emission, are the same as those described for artificial roughness. Low-lying vegetation, such as saltgrass, mainly protects the surface by directly covering the surface, thus reducing the available area for particle entrainment, and by trapping saltating material that has been entrained from the remaining bare areas. The wake area with reduced surface shear stress in the lee of shrubs protects larger areas from emission, more efficiently removes momentum from the wind, and captures more (and higher) airborne material (e.g., Raupach, 2001). Thus, there is merit to the notion that the same amount of control efficiency might be obtained with lower vegetation cover if taller plants (e.g., shrubs) were used in managed vegetation areas.
Shrubs can also provide other unique ways of addressing existing challenges to managed vegetation cover in Owens Lake. Greasewood (Sarcobatus vermiculatus) and Parry’s saltbush (Atriplex parryi) dominate the alkaline soils, and Atriplex confertifolia can occur in both well-drained alluvial fans, and poorly drained alkaline basins (LADWP, 2010; Smith, 2000). These woody shrubs have deeper roots and in the portions of the lakebed with deeper freshwater, they may be able to access this water, once they are mature. Woody species have been used in other semi-arid systems to lower the groundwater table and prevent saline groundwater from intruding into rooting zones (Bell et al., 1990), which would be an important tool if it is possible with the species and conditions at Owens Lake.
Performance
To date, no direct measurement of the control efficiency of shrubs on Owens Lake has occurred. Nonetheless, lessons from other tests can be drawn. In the Keeler Dunes Dust Control Project site, control efficiencies of 85-92 percent were attained in the center of the array of straw bales and vegetation plantings (Gillies and Green, 2014; see Box 4-2). Theoretical considerations as well as tests sponsored by the District indicate that porous roughness elements, such as shrubs, may be more effective than the solid roughness elements used at Keeler Dunes
(Gillies et al., 2017; Holder, 2019c). However, the effect of roughness depends on the density of the roughness and the distance from the edge of the roughness array.11
A shrub-based managed vegetation BACM, with shrub densities of ~0.2 per square meter (0.17 per square yard),12 or roughly 10 percent cover, should have greater than 85 percent control efficiency within 25 meters of the edge of the shrub area. It has not been tested whether greater than 95 percent or 99 percent control efficiency can be obtained, although preliminary simulations assuming porous vegetation estimate that greater than 20 percent shrub cover may be required (see Box 4-3).
Practical Considerations
Because of edge effects applicable to any DCM based on roughness elements, relatively large areas (>10 ha [24.7 acres]) should be used so that the majority of the area is within target control efficiencies. Initially, shrubs planted at the correct density, but as smaller individuals, will not be able to provide this control efficiency. It may take 5-10 years for nursery shrubs to grow into mature plantings, depending on the species, and thus additional DCMs will be required while shrub stands are being established. If shrub densities are too low, they might become unsustainable, because pedestaling and abrasion of shrubs by moving sand can cause dieback and mortality (Okin et al., 2006).
Water Use
The Keeler Dunes site uses ~0.1 ft/year for shrub densities one-half of that which would be required for 99 percent control efficiency. Therefore, beyond initial watering and leaching (0.1-7.9 ft/year, using values from the managed vegetation BACM), at least 0.2 ft/year would be required during the growth phase (assuming a plant density twice that of the Keeler Dunes). The maximum plant size and plant density will depend on additional factors such as soil texture and salinity. If vegetation is used during the establishment and growth phase to fill gaps between small shrubs, additional watering will be required. After shrubs have been established and have grown to target sizes, watering could be tapered to zero, because shrubs should be able to survive on local rainfall. However, watering infrastructure for management of prolonged drought should be considered.
___________________
11 Regarding density, use of the calculations of Gillies and Green (2014; Equation 1) suggests that doubling the density (all other things being equal) should reduce flux by 73 percent; increasing roughness density by 50 percent is expected to reduce the flux by 53 percent. Regarding edge effects, Gillies and Green (2014) estimate that a 1-ha area (100 m × 100 m [2.5 acres]) would have approximately 25 percent of the area with greater than 85 percent control efficiency, and a square 10-ha area would have approximately 92 percent of the area with greater than 85 percent control efficiency (85 percent was the revised target control efficiency for this project).
12 This density is assumed to estimate control efficiency from the Keeler Dune data, based on the fact that two shrubs are roughly equivalent to one straw bale. Shrubs are roughly the same height as the ~40-cm (1.3-feet) high bales, but approximately one-half the width of the 110-cm (3.6-feet) wide bales, and thus have a profile area of approximately one-half of the bales used on Keeler Dunes. See Gillies and Green (2014) equation 2.
Environmental Implications
Shrubs have the potential to provide considerable habitat for native and migratory species. Of the habitats at Owens Lake, shrublands support the most diverse species of lizards and snakes, as well as additional birds and mammals that are not supported by other habitats (LADWP, 2010). Shrubs have also been accepted as a way to reduce aeolian transport in environmentally sensitive areas, though required watering infrastructure is a potential limitation to the establishment of new shrubs in these areas. Shrubs also have positive aesthetic value.
Energy Use
If sited appropriately and groundwater pumping is not required, energy use for shrubs is expected to be low.
Systemwide Issues
Because of salt sensitivity, shrubs are most appropriately sited along the sandier margins of the Owens Lake bed. Edge effects would be reduced if located adjacent to DCMs that also reduce near-surface wind velocities.
Information Needs to Inform Decision Making
Large, established, relatively dense shrub stands could reduce aeolian transport and dust emission from the Owens Lake bed, but their potential to attain 95 or 99 percent control efficiency has yet to be established. Additional research is needed to document the vegetated cover associated with target control efficiencies using shrubs. Further study could also determine whether specific species are more appropriate for different lake conditions, such as depth to groundwater and salinity. Research could also examine whether shrubs could be used to lower the shallow groundwater table in saline areas of the lake, and thereby improve conditions for other managed vegetation.
Cobbles
As a zero-water use control measure, cobbles are similar in nature to gravel, except their size is larger, on average, and not as uniform as gravel, with individual grains ranging from 2.5 to 10 inches (6.4 to 260 cm). Cobbles and larger-sized boulders are now used as part of the Owens Lake Land Art Project (and in an unplanned fashion, on the sides of the access roads on the lake) (see Figure 4-12). The mechanism by which cobbles could control dust emissions is similar to gravel, by substantially reducing the capillary rise of saline groundwater and salt efflorescence to the surface while also preventing wind erosion of the surface underneath. The nooks and crannies present in non-uniform cobble have a greater capacity for capture and storage of windborne material compared to the more-uniform gravel.
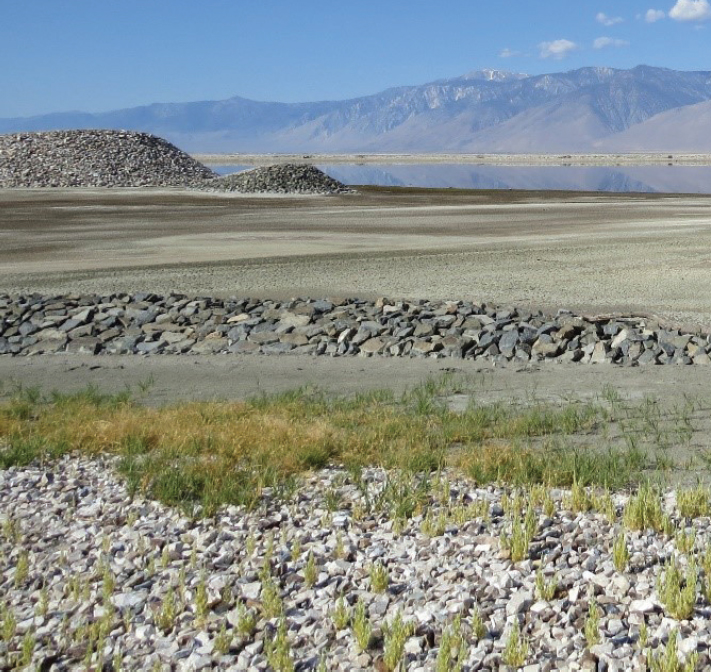
SOURCE: Photo courtesy of Valerie Eviner, panel member.
The performance and lifespan of cobbles have not been characterized, although expected to be similar to gravel. Also similar to gravel, under extreme flooding, cobbles could be displaced, exposing the surface underneath.
Environmental Implications
One noteworthy difference between gravel and cobbles is that the non-uniform spacing between cobbles allows for growth of some vegetation by trapping windblown soil and seeds (see Figure 4-12). Sand and seeds trapped in this way are held above the original, potentially salty, surface, and because of the coarse texture of the windblown sand could have a low capacity for capillary rise of salts. Cobbles on the surface of the soil are similar to “rock mulches” that have been used in dryland agriculture throughout history. By producing still-air void spaces at the surface, cobbles inhibit evaporation from the soil surface, thus increasing
the length of time that soil water is available for vegetation. In addition, protected microsites are produced within the uneven surface of a cobbled area. With lower evaporation rates and greater shade than flat surfaces, these microsites have higher potential for germination and establishment of native vegetation. This autogenic regeneration of native vegetation was observed by the panel at the Owens Valley Land Art Project. Thus, beyond directly protecting the soil surface from wind erosion, cobbles can serve as sites of native vegetation regeneration requiring no added water.
Because of their uneven surface, cobbles provide a better habitat for nesting shorebirds when placed adjacent to shallow flooding areas, and they provide shelter for other non-aquatic species, especially if vegetation regeneration has occurred. Aesthetically, cobbles look more natural than gravel because of their non-uniform size and colors and vegetation regeneration. Similar to gravel, emission of various other air pollutants during the mining, transport, and distribution of cobbles and other negative environmental impacts of cobbles mining are of concern.
Energy Use
Energy use associated with cobbles is expected to be similar to that of the gravel BACM, with intense energy usage during mining, transport, site preparation, and distribution of cobbles.
Information Needs to Inform Decision Making
The source of cobbles, the costs and energy use associated with its transport and distribution, and the overall environmental impacts of its implementation are unknown. In addition, the long-term sustainability and maintenance requirements of cobbles for dust control while providing suitable sites for vegetation is unknown.
Sand Fences
Sand fences are vertical barriers used to control movement of windblown sand. The mechanisms for controlling PM10 emissions are modifying the airflow, trapping the mobile sand, and reducing fetch. Sand fences are widely used in various environments such as deserts, beaches, and lake and river beds, and several studies report on designs and modeling approaches to optimize design parameters (e.g., array characteristics) and predict their performance (Bruno et al., 2018).
Approximately 19,500 linear feet of sand fences are installed at Owens Lake, primarily in the T1A-1 area covering about 250 acres, a minimum dust control area that enables use of a non-BACM. The installed fences are constructed from ultraviolet light–resistant fabrics with 50 percent porosity and supported on 5 feet tall posts (see Figure 4-13).
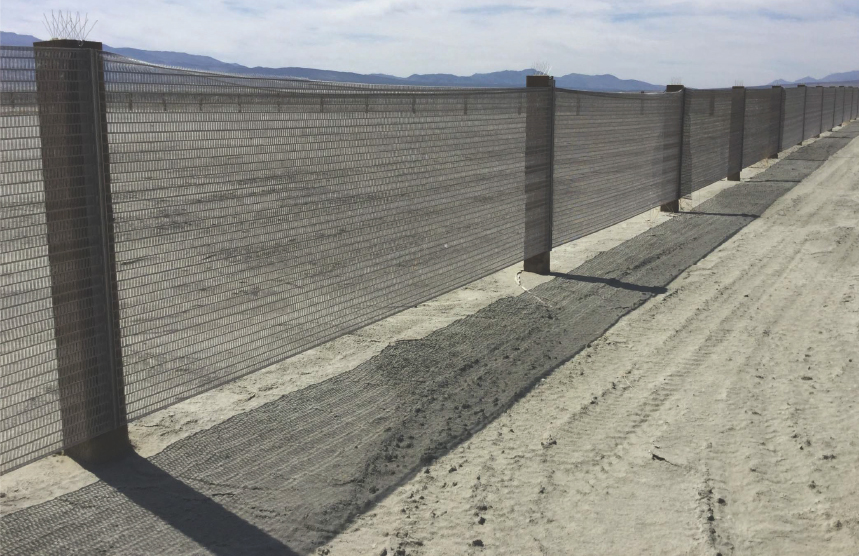
SOURCE: Schaaf, 2019.
Performance
In the 1990s, modeling analyses examined the potential for sand fences to provide target control efficiencies at Owens Lake (Ono, 1996; CH2M Hill, 2000). CH2M Hill (2000) found that the fence spacing to achieve 98 percent control efficiency was so close (20 feet for 4-foot fences) that continuous dunes could form, rather than discrete dunes at each fence. Such close spacing required extensive lengths of fencing—250 miles of 4-foot fences per square mile—and would necessitate removal of large volumes of sand as part of maintenance. Straight fences also showed poor performance when wind direction was parallel to the fence (CH2M Hill, 2000).
A Single-Event Wind Erosion Evaluation Program (SWEEP) model was used to determine the optimal spacing of the posts to attain at least a 31 percent removal efficiency (Schaaf, 2019). Eighteen Sensit/Cox Sand Catchers are used to monitor performance, and the control efficiency is determined annually when compared with baseline sand flux data from the predust control period. Although this method does not produce an accurate estimate of PM10 control efficiency (see Chapters 2 for details), reported control efficiency values range from 70 to 90 percent over a period of 9 years (Schaaf, 2019). The efficiency has also been reported
for three different wind speed ranges, although there is significant variability in the data. The uncertainty in the measurements has not been reported, which is necessary for making reasonable quantitative comparisons or commenting on the trend.
Practical Considerations
Sand fences are relatively easy to install and immediately effective. The time to install is a consideration, and hence their suitability for emergency use depends on how quickly construction can be done. Although sand fences do not achieve BACM-level control efficiencies, they are effective at localized reduction of dust levels. Other advantages include prevention of sand intrusion into gravel-deployed areas and protection of establishing vegetation and the edges of managed vegetation areas from mortality through sand abrasion. The lifespan and durability of the fence depends on the material used, and required maintenance is minimal, especially if durable material is used for fence construction. Routine wear and tear is a consideration, and the fabric may need periodic replacement. Periodically, the trapped sand from the area at the base of the fence will need to be removed.
Water Use
There is no water use associated with sand fences.
Environmental Implications
Sand fences can provide perching sites for birds that predate on the Snowy Plover, such as raptors and ravens. For sand fences within 0.25 miles of occupied shorebird nesting habitat, LADWP (2010) requires designs of posts and fencing that deter perching by predator birds. Sand fences also serve as a barrier to movement of wildlife migration. At Owens Lake, creation of a gap at the base of the fence and burrows and passages at intermediate locations in the fence has helped alleviate this problem. Nevertheless, sand fences should not be used in core wildlife areas. In addition, sand fences have poor aesthetic value on the lakebed.
Cost
The current installation cost of sand fences (based on 31 percent control efficiency) is approximately $15 million/square mile. Annual operating costs, including fencing repairs, are estimated to be $600,000/square mile (Valenzuela, 2019b, 2020b). The infrastructure is anticipated to last for 5 years before replacement is needed.
CH2M Hill (2000) estimated that 95 percent control efficiency would cost $48 million per square mile and $700,000 per year in maintenance (adjusted to 2019 dollars).
Solar Panels
Solar panels (photovoltaics, or PV) have been proposed, and tested, as a potential DCM. Solar panels would control dust by reducing ground-level wind speeds (Ravikumar and Sinha, 2017). As tested at Owens Lake (2014-2017; see Figure 4-14), the panels were placed on top of gravel, a BACM discussed previously in this chapter. However, the use with non-gravel (e.g., vegetated) surfaces could be explored because panel cleaning would provide small amounts of water, and recent studies have found that the shading can enhance some plant growth (Jossi, 2018). Three different ballast configurations and two perimeter barrier configurations were examined in the field test.
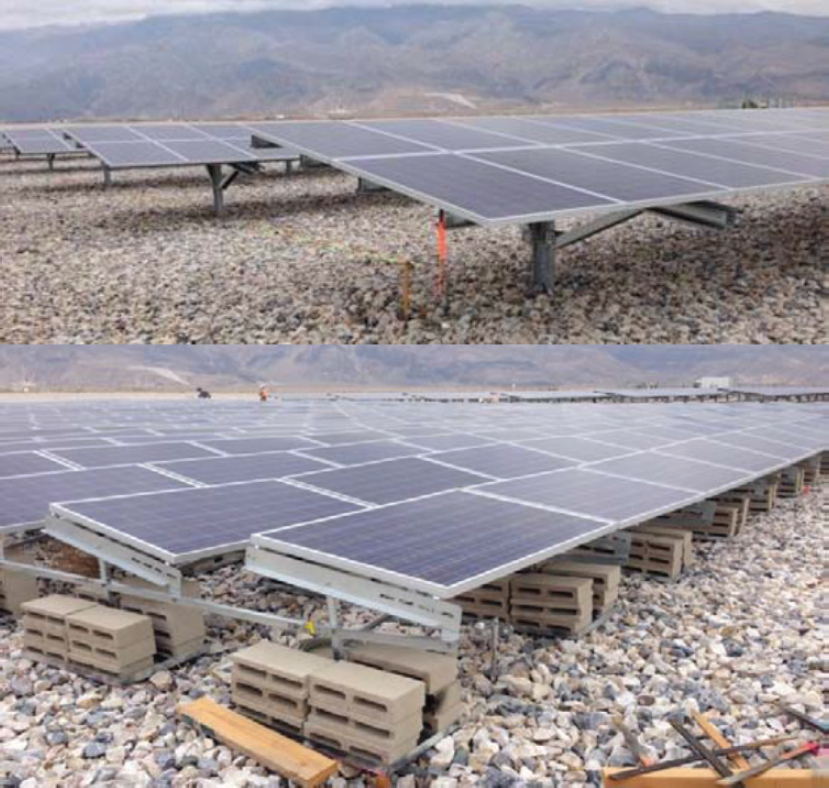
SOURCE: Schaaf, 2019.
Performance
Initial wind tunnel testing suggested the potential for BACM-level control efficiencies, reducing ground-level wind speeds. However, in the field tests at Owens Lake, the solar panels were not found to reduce ground-level winds as much as desired, although no sand flux measurements were taken (Schaaf, 2019). It is not apparent how closely the tested configurations match those in utility-scale PV installations or to what degree those configurations could be altered to further reduce wind speed at the surface. Installation over non-gravel surfaces was not tested. An impediment to conducting a more thorough analysis of the potential of solar panel arrays as a control measure is the apparent lack of formal reports documenting the testing of the three panel configurations during 2014-2017.
Practical Considerations
Solar panels have the potential to beneficially use the open space over the lake, providing electricity, while also controlling dust emissions. The Owens Lake area has a high potential for producing solar power (Bolinger and Seel, 2018).13 The presence of other solar panel farms in the region is suggestive that a solar farm could be economically attractive.
Water Use
The solar panels themselves would require little water. Assuming 26 gal/megawatt hour (MWhr; Klise et al., 2013) and 54,000 MWhr/km2·year (NREL calculator14), the estimated operational water requirement is about 0.02 ft/year. Peak water use was found to be about 50 times annual operational needs for two locations in southern California, primarily for dust control during construction (Klise et al., 2013), leading to an estimate of roughly 1 ft during installation. How these translate to a project at Owens Lake requires investigation.
Environmental Implications
The habitat value of an area of solar panels largely depends on the substrate underneath. The use of gravel provides poor-quality habitat. If the solar panels are placed directly on the natural lakebed, particularly at higher elevations where vegetation growth is feasible without underdrains, the solar panels could enhance plant growth. However, the Multiagency Avian-Solar Conservation Working Group (2018) noted that the risk of injury or mortality to birds through collision and electrocution from transmission lines needs more study. Hernandez et al. (2015) suggest avoiding solar panel use near important conservation areas, particularly because of habitat fragmentation, which may be less of an issue over Owens Lake because
___________________
13 See https://atb.nrel.gov/electricity/2019/index.html?t=su#jkwhhtv7 (accessed January 28, 2020).
14 See https://pvwatts.nrel.gov/pvwatts.php (accessed January 28, 2020).
current dust control applications are of a fractured nature. Extensive application of PV panels should consider such potential ecological effects.
A potential disadvantage of solar panels is aesthetics, although how they compare with bare gravel or other BACMs is not apparent. Some recent solar panel installations have used creative approaches to improve the aesthetics of solar farms. The solar panels could be designed to look like a water surface, but this aesthetic could harm birds. Because of extensive disruption to the surface, solar panels are not appropriate for environmentally sensitive areas.
Energy Use
Solar panels offer the potential to provide a long-term renewable energy source. Wu et al. (2019) estimate that the power production from 1 square mile of land would be 77 MW. Increased PV efficiencies would lead to increased power production per acre. Energy use is associated with production of the materials, transport to the site, and installation.
Costs
Capital costs for both fixed tilt and tracking solar panels in 2018 were highly variable, averaging slightly more than $1-$1.6 per watt (direct current) installed, and have been falling (Bolinger and Seel, 2018).15 Assuming power capacity of 77 MW/square mile, the cost of installation is estimated between $77 million/square mile to $120 million/square mile. These costs are in addition to those for any underlying surface preparation. Bolinger and Steel find a mean operating cost of about $8/MWhr. Such large capital and operating costs dwarf the estimated costs of other BACMs, although solar panels provide a long-term source of revenue. Using the NREL calculator, a 77 MW (about 1 square mile) plant in the Keeler area would generate approximately $22 million annually.
Installation lifetimes for utility-scale PV farms are about 25-40 years.16 A more comprehensive economic evaluation of the actual likely capital and operating costs, as well as potential benefits, including how this fits into California’s renewable energy plans, would inform future evaluation of the use of solar panel farms as a potential BACM when considering aesthetics and other factors.
Information Needs to Inform Decision Making
Knowledge of how solar panels fit within an integrated management plan for the Owens Lake area would benefit from more detailed information on control effectiveness (without gravel) as well as environmental and economic assessments. A potential approach to assessing
___________________
15 See https://atb.nrel.gov/electricity/2019/index.html?t=su (accessed January 28, 2020).
16 See https://www.nrel.gov/analysis/tech-footprint.html (accessed January 28, 2020).
how a large-scale PV installation would impact ground-level wind velocities and dust generation would be to conduct tests at current PV facilities in the area. Tests could also assess the potential for panel extensions, which are designed to reduce the open space below the solar panel, and alternative panel designs to reduce near-surface wind velocities. Examination of how other large-scale installations have impacted local ecology might also inform potential ecological benefits and disbenefits in a similar application to the Owens Lake area.
DUST CONTROL MEASURES NOT EVALUATED IN DETAIL
Two DCMs were not evaluated in detail: chemical stabilizers and biocrusts. Although these are low-water-use or waterless DCMs, they were not evaluated in detail because their potential near-term applicability at Owens Lake appeared limited, either based on acceptability by regulatory agencies or available science. It is possible that new science could emerge in the future that would support for their future use.
Biocrusts
In arid and semi-arid ecosystems across the world, biological soil crusts are critical in stabilizing surface soils and in providing important ecosystem services such as nitrogen addition and moisture retention (Belnap and Lange, 2003). Biocrust refers to a diverse set of communities, with composition depending on environmental conditions. Cyanobacteria, green algae, lichens, mosses, and microfungi are the key components of biocrusts.
In dry alkali environments, such as the Owens Lake playa, cyanobacteria dominate (Belnap and Lange, 2003). Their presence has been observed in the “barren” areas of the Owens Lake playa (LADWP, 2010). Some cyanobacteria are filamentous, and in well-developed mature crusts, they play an important role in the stabilization of the top 3 mm (0.1 inches) of soil. However, biocrusts are also extremely sensitive to disturbances such as compaction (e.g., vehicle traffic, footsteps) and to sand blasting (Belnap and Gillette, 1998). Once disrupted, they show extremely slow recovery (Chiquoine et al., 2016), particularly on sandy soils (Chock et al., 2019), where they show little recovery even after 5 years. As they recover, the surfaces they cover are 2-30 times more vulnerable to wind erosion, even after a year of recovery (Belnap and Gillette, 1998). Restoration of disturbed crusts can be difficult, with only a portion of the community being cultivatable and uncertain performance of cultivars under field conditions. They have high variation in establishment, and a long recovery time, during which they are vulnerable to sand blasting (Chiquoine et al., 2016). Thus, these are unlikely candidates for dust control on their own, particularly over the short term. However, if areas of Owens Lake are undisturbed over the long term, and receive little sand movement, these crusts could become an important part of the ecosystem and dust control, as they are across arid regions of the world. Biocrusts have been considered as a potential DCM
for environmentally sensitive areas, although more research would be needed to define the conditions necessary to provide reliable dust control and whether such conditions could be sustained at Owens Lake.
Soil Binders
Soil binders are chemicals applied to stabilize the soil surface and prevent dust emissions. Soil binders require no water, other than the water required to apply the chemicals. Although shown to be effective elsewhere under certain conditions (Bolander, 1997; Giummarra et al., 1997), there are concerns about their durability at Owens Lake. Only a thin layer at the top of the soil surface is controlled, which could be abraded and fail during high wind events, potentially leading to large emissions. Use of soil binders would require careful monitoring of the integrity of the surface. A small-scale field test using soil binders was conducted in 2013, but the results were compromised by a flood event. A second, larger study was designed to test eight different chemical stabilizers, but the study has yet to be conducted and is awaiting approval from the California Department of Fish and Wildlife (Schaaf, 2019; LADWP, 2020b). The California State Lands Commission has previously stated that chemical stabilizers are not acceptable on the lakebed because they are not consistent with public trust values (GBUAPCD, 1994).
MONITORING BACM EFFECTIVENESS
To ensure that deployed BACMs and other DCMs maintain their required emission control effectiveness, surrogate metrics (performance standards or criteria) are relied upon instead of direct estimates of PM10 (see Table 4-2). Performance standards are set to ensure that approved BACMs reach the required control efficiencies based on data collected for this purpose during the BACM testing and approval phases. Thus, performance standards serve as measurable surrogates for a BACM’s ability to attain required control efficiencies (e.g., 99 percent reduction in dust emission) based on previous testing and do not directly represent a BACM’s in situ attainment of required PM10 control efficiencies. Performance standards are tailored to individual BACMs and can comprise measurements of sand flux (e.g., brine BACM, tillage with flooding backup), ridge spacing and height (tillage), area of standing water or surface-saturated soil (shallow flooding BACM), vegetation cover (managed vegetation BACM), or induced particle emission (dynamic water management, tillage), among others. Direct PM10 monitoring is an established performance standard for only one BACM (tillage; see Table 4-2).
Those surrogate measures do not capture the different dust control effectiveness levels that might result from variations in the implementation of DCMs. For example, in shallow flooding for dust control, at least 75 percent of the surface must be wet or have saturated soil. However, this performance requirement does not explicitly account for the differences
in dust control that might occur between a patchwork of shallow flooding amounting to 75 percent coverage and a continuous coverage amounting to 75 percent of the dust control area. Similarly, in the managed vegetation DCM, the areal coverage of the vegetation must be at least 37 percent of the dust control area. This performance requirement does not explicitly account for the differences in dust control that might occur with different plant groupings and different maturities and heights of the vegetation. These variations in implementation create uncertainties in the degree of actual dust control that might be achieved, although they might adhere to the surrogate metric.
Uncertainties in determining DCM effectiveness at the 99 percent level based on the current measurement approaches have not been characterized. The difference between 98.5 percent and 99.5 percent control is a factor of three in emissions, and such accuracy in measuring DCM effectiveness is critical when developing an overall strategy that requires reduction of PM10 emissions by 99 percent (see Chapter 2).
Requirements for Developing Alternatives to Existing BACMs
The District enforces the requirements of the SIPs through continual oversight of LADWP’s dust control strategy using stipulated test methods and performance standards to determine compliance. As of 2019, on the emissive lakebed itself, nearly all emissive areas have experienced BACM implementation (with the exception of some environmentally sensitive areas), a fact that is reflected in the already high degree of dust control on the lakebed. Transitions from one BACM to another are possible, but LADWP is required to maintain PM10 control during such transitions (Board Order 160413-01 Paragraph 13). Transition from one existing BACM to another without meeting the performance standards of either BACM may be done, but is limited to an area with maximum size of 3 square miles at one time (Board Order 160413-01 Paragraph 13.C).17
LADWP may request, in writing to the District, the establishment of alternative DCMs as approved BACMs for use on Owens Lake. This process involves a planning phase in which the DCM’s feasibility is determined, considering criteria such as environmental impact, public trust value, climate change, risk, aesthetics, and compliance with existing laws and regulations. If the proposed BACM proves feasible, then meetings are held to introduce the concept to and obtain feedback from stakeholders. Subsequently, a plan is developed for field pilot study of the BACM to establish dust control efficiency relationships over a wide range of climate conditions. Upon receipt of permits and leases from relevant land owners and agencies, including the District, the California Department of Fish and Wildlife, the Lahontan Regional Water
___________________
17 District Governing Board Order #160413-01 Requiring the City of Los Angeles to Undertake Measures to Control PM10 Emissions from the Dried Bed of Owens Lake. See https://gbuapcd.org/Docs/District/AirQualityPlans/OwensValley/Board_Order_FINAL_20160425.pdf (accessed January 28, 2020).
Quality Control Board, the U.S. Army Corps of Engineers, and the California State Lands Commission, the design and construction can begin. A 2-year monitoring phase follows construction in which PM10 control performance is measured by District-approved methods. If PM10 control is demonstrated, then LADWP and the District's Governing Board may adopt the new BACM. However, further implementation of this new BACM in new areas or transition of existing DCMs to this new BACM may require a similar process (Valenzuela, 2019b).
Testing cannot be conducted on areas currently under approved BACMs, an area comprising nearly all of the emissive sources on the lakebed. LADWP may implement the proposed new control measure on only one-half square mile of the next area to be identified as needing control (as a BACM Contingency Measure) until the U.S. Environmental Protection Agency (EPA) approves the new measure as a BACM. The District’s Governing Board may limit the BACM to specific circumstances, such as distance to the shoreline or for specific soil types (Board Order #160413-01, Attachment D, p. 9). Collectively, the requirement that allows application of new DCMs to no more than 3 square miles, and other constraints, limits the timely transition to more integrated lake-wide dust management practices.
Using PM10 Emission Estimates to Monitor BACM Effectiveness
Estimating PM10 emissions using PM10 concentration measurements in individual dust control areas, rather than performance criteria, could reduce uncertainties and allow for more flexibility in assuring compliance with PM10 emission reduction requirements. For example, this approach could be used to demonstrate that less vegetation cover, with the locations and groupings of particular plants designed to maximize dust control, could achieve the emission reductions expected from the current 37 percent coverage requirement. This approach could also be used to assess the effectiveness of hybrid DCMs. For example, if vegetative covers fall below a threshold for required control effectiveness, then roughness elements could be added to return to the required dust control effectiveness.
One disadvantage of relying on control area–specific estimates of PM10 emissions, based on airborne PM10 concentration, is the difficulty in assessing compliance under low to moderate wind conditions. Current surrogate measures for dust control effectiveness, such as areal coverage of shallow flooding or percent vegetative cover, are applied under any wind conditions. However, if the SIP requires a 99 percent emission reduction for a DCM under the high wind-speed conditions assumed for potential NAAQS exceedances, then compliance can only be directly measured under those high wind-speed conditions. If estimates of PM10 emissions, based on PM10 concentration measurements, are used to evaluate the performance of DCMs, then the control effectiveness as a function of wind speed must be determined. As outlined in this chapter, control effectiveness as a function of wind speed is already being assessed for some DCMs (e.g., precision surface wetting). If done more broadly, compliance can be demonstrated under a variety of wind conditions.
Overall, tying the operational performance of DCMs directly to PM10 control effectiveness would provide flexibility to develop innovative and hybrid DCMs and could allow for adaptive responses for areas that experience declines in control efficiency. In addition, this approach would improve the transparency of SIP planning. Better understanding of the relationship between PM10 emissions and wind speeds would highlight how differences in the severity of high-wind events could lead to increases or decreases in NAAQS exceedances. Direct estimation of PM10 emissions for DCMs in individual dust control areas would also mitigate the uncertainties associated with the use of surrogate metrics for PM10 control efficiency.
CONCLUSIONS AND RECOMMENDATIONS
Evaluation of Dust Control Measures
Conclusion: Based on available data, none of the currently approved BACMs or other DCMs has been documented to achieve mandated dust control efficiencies, while reducing water use (compared to shallow flooding) and consistently providing moderate or high habitat values. Many of the DCMs reviewed involved a high level of land disturbance and infrastructure that could impact cultural resources in environmentally sensitive areas.
Conclusion: Of the DCMs reviewed, precision surface wetting, managed vegetation with shrubs, natural porous roughness, and cobbles appear to be promising strategies, individually or in combination, for substantially reducing water use and providing some habitat value. Examples of hybrid DCMs include managed vegetation combined with either artificial roughness elements or precision surface wetting. As mentioned above, the panel did not attempt to judge the acceptability of those DCMs on environmentally sensitive areas, including those with cultural resources.
Recommendation: Additional research on individual and hybrid DCMs should be conducted to develop new approaches that use less water, maximize other environmental benefits, and ensure that DCMs maintain performance over the long term. Specific research topics to inform future decision making at Owens Lake are outlined in this chapter and include the following:
- Strategies for long-term salinity management in shallow flooding and managed vegetation DCMs, including an evaluation of the capacity to maintain target salinities over time;
- Minimum percent coverage needed for alternative vegetation species and mixtures of species as DCMs with the potential to reduce irrigation requirements, and how site-specific conditions on the lakebed impact the performance, durability, and management requirements of those measures;
- Potential for dynamic precision surface wetting to provide effective control in real-time that reduces water use;
- Approaches to enhancing the formation of salt crusts and their long-term stability under a range of conditions;
- Performance and feasibility of cobbles and natural and artificial porous roughness as DCMs on the lakebed and their potential to provide additional vegetated habitat;
- Potential of hybrid DCMs (e.g., precision wetting with vegetation) that may lead to further reductions in water use relative to either DCM measure alone, while increasing habitat value;
- Performance and reliability of current and proposed DCMs under future conditions anticipated from climate change, including longer-term changes in climate and more extreme weather events; and
- PM10 control effectiveness for specific DCMs at various wind speeds.
Monitoring BACM Effectiveness
Conclusion: Operational evaluations of BACMs and other DCMs have relied on surrogate performance criteria to monitor PM10 control efficiency, which introduces a high degree of uncertainty.
Recommendation: LADWP and the District should evaluate DCM performance based on PM10 emissions from dust control areas, estimated from measurements of airborne PM10 concentrations under a variety of wind conditions.


