
2
NAEP Overview: Structure, Goals, and Costs
This chapter describes NAEP’s structure and goals and provides an overview of its costs. It distinguishes NAEP’s goals from those of other testing programs and connects them to NAEP’s distinctive design. The chapter also relates NAEP’s design characteristics to its cost structure and budget and compares NAEP’s costs with those of other testing programs.
STRUCTURE
For over 50 years, NAEP has provided policy makers, educators, and the public with indicators of America’s educational health. NAEP was first authorized in 1969 and has reported student achievement in 10 subject areas: reading, mathematics, science, writing, civics, U.S. history, geography, economics, the arts, and technology and engineering literacy. The assessment has two components, main NAEP and long-term trend NAEP. Main NAEP administers reading and mathematics assessments to students in the 4th and 8th grades every other year and less frequently to students in the 12th grade, as well as other subject assessments. Long-term trend NAEP is usually administered every 4 years and tracks the reading and mathematics achievements of 9-, 13-, and 17-year-olds.
Like the Program for International Student Assessment (PISA) and the Trends in International Mathematics and Science Study (TIMSS), NAEP is a survey. Its goal is to periodically report on the status of student achievement in the United States and to track trends in student achievement over time. NAEP uses complex sampling and analytic technologies to accomplish these goals. NAEP participants are selected through a multistage process that
involves sampling geographical units, schools within geographical units, and students within schools. Each NAEP participant takes a small set of questions that are sufficient to contribute to group-level estimates of achievement, but not sufficient to support precise score estimates for individuals.
In other words, by design, NAEP does not report scores for individuals because no individual takes a sufficient number of items to do so. Instead, it reports national-level results and, for reading, mathematics, and some other subjects, it compares results for regions, states, Puerto Rico, and large urban districts. It also reports data for student groups defined by gender, race and ethnicity, English-learner status, disability status, national school lunch program participation, school location, and region of the country.1 Long-term trend NAEP reports national-level results and compares results for regions. Estimating achievement results for these groups is not simply a matter of aggregating ordinary test scores. Instead, it is a process of using complicated data imputation models to produce a set of plausible values of proficiency for each test taker. Sampling weights are calculated for each participant and used in all analyses so that summary statistics, such as means and percentages, serve as appropriate estimates of the target population quantities.2
NAEP tracks achievement over time so that stakeholders can see how student results change. Main NAEP tracks trends going back as far as 1990, with the testing frameworks reviewed and refreshed every 10 years or so. Long-term trend NAEP tracks trends since the 1970s; its test questions have been largely unchanged over several decades, with a substantial update carried out in 2004.3
The administration schedule for NAEP is shown in Table 2-1. In a typical 4-year period, NAEP administers about 22 assessments.4 They are split roughly equally between “state” assessments, with larger samples sufficient
___________________
1 Although NAEP reports results with respect to these different student groups, many of these categories are not part of the sampling frame (NCES, personal communication, December 17, 2021).
2 Plausible values are proficiency estimates for an individual NAEP respondent, drawn at random from a conditional distribution of potential scale scores for all students in the sample who have similar characteristics and identical patterns of item responses. The plausible values are not test scores for individuals in the usual sense; they are offered only as intermediary computations for calculating summary statistics for groups of students. Plausible values are used to calculate summary statistics for NAEP reports and are available for the use of NAEP data users in secondary analyses of NAEP data. See https://nces.ed.gov/training/datauser/NAEP_04.html?dest=NAEP_04_S0310.html.
3 The panel’s understanding is that the original long-term trend instruments were developed in the 1980s and that there were enough common items for a scale to be fit back into the 1970s. The changes carried out in 2004 are described at https://nces.ed.gov/nationsreportcard/ltt/howdevelop.aspx.
4 Congress waived administration of NAEP assessments during the pandemic year 2021 and more assessments are scheduled for 2030 than in previous annual administrations.
TABLE 2-1 NAEP Assessment Administration Schedule, 2016–2030
| Year | State and Combined Assessmentsa | National Assessments Only |
|---|---|---|
| 2016 | Arts 8 | |
| 2017 | Reading 4, 8 Mathematics 4, 8 |
Writing 4, 8 |
| 2018 | Civics 8 Geography 8 Technology and engineering literacy 8 U.S. history 8 |
|
| 2019 | Reading 4, 8 Mathematics 4, 8 |
Reading 12 Mathematics 12 Science 4, 8, 12 |
| 2020 | Long-term trend reading 9, 13 Long-term trend mathematics 9, 13 |
|
| 2021 | ||
| 2022 | Reading 4, 8 Mathematics 4, 8 |
Civics 8 U.S. history 8 Long-term trend reading 9 Long-term trend mathematics 9 |
| 2023 | Long-term trend reading 13 Long-term trend mathematics 13 |
|
| 2024 | Reading 4, 8 Mathematics 4, 8 |
Reading 12 Mathematics 12 Science 8 |
| 2025 | Long-term trend reading 9, 13, 17 Long-term trend mathematics 9, 13, 17 |
|
| 2026 | Reading 4, 8 Mathematics 4, 8 |
Civics 8 U.S. history 8 |
| 2027 | ||
| 2028 | Reading 4, 8, 12 Mathematics 4, 8, 12 Science 4, 8 Technology and engineering literacy 8 |
|
| 2029 | Long-term trend reading 9, 13, 17 Long-term trend mathematics 9, 13, 17 |
|
| 2030 | Reading 4, 8 Mathematics 4, 8 Civics 8 Writing 4, 8, 12 |
Civics 4, 12 U.S. history 4, 8, 12 |
a Includes national assessments and administrations of the Trial Urban District Assessment (TUDA). Some assessments are given with a state sample but without an additional sample to provide estimates for TUDA, which covers 27 large urban districts.
SOURCE: https://www.nagb.gov/about-naep/assessment-schedule.html.
for estimating results for states and large urban districts in addition to the nation as a whole, and “national” assessments with smaller samples sufficient only for national estimates. On average, the schedule shows about 10 state assessments every 4 years, including two rounds of reading and mathematics assessment at grades 4 and 8, where they are required every 2 years, and one round at grade 12. The schedule projects more state assessments in the later period. On average, the schedule shows about 12 national assessments every 4 years: they usually include one round of long-term trend NAEP in reading and mathematics, a total of six assessments across the three ages, as well as various other subjects, often given in only one grade.
The state assessment samples each include roughly 150,000 students and 3,300 schools for each grade for each assessment; the national assessment samples each include roughly 10,000 students and 200 schools.5 Thus, in an average 4-year period, NAEP administers about 22 assessments to about 1.6 million students in about 35,000 schools, which means that, on average, there are 5.5 assessments annually for 400,000 students in 9,000 schools. Although the figures vary widely across years because of NAEP’s biannual cycle for the mandated assessments in reading and mathematics, the annual averages are useful for placing average annual cost figures in context.
NAEP’s current structure reflects several important changes over time, which are described in Box 2-1.
DISTINCTIVE GOALS AND PROCESSES
As detailed above, NAEP is not designed to report achievement for individual students or schools. It reports achievement and progress at the national level and, for some subjects, by jurisdiction, school type, and demographic group. This approach distinguishes NAEP from assessments that produce individual scores for student placement, selection, or certification and from assessments that report school scores for accountability purposes. The NAEP program is more like international large-scale assessments, such as TIMSS and PISA, both of which were originally patterned after NAEP but have developed in distinctive ways. NAEP’s distinctions and ambitious goals contribute to the costs and complexities of the program.
Goals
One of the best ways to understand NAEP’s distinctions is to consider some of the specific goals that NAEP works to meet. Four of them
___________________
5 Information from NCES response to Q70f and NAEP 101 PowerPoint provided by NCES in April 2021. Typical school samples vary somewhat by grade and subject. Whenever possible, assessments are coordinated to reduce costs.
are particularly noteworthy for the purposes of this report: high-fidelity measurement; meaningful comparisons over time; limiting respondents’ burdens; and public visibility along with state and local authority.
Goal 1: Measure the Knowledge and Skills of the Nation’s Students with High Fidelity
NAEP takes a leading position in assessment of the nation’s students in terms of the quality and ambition of its instruments. Measuring student achievement in the most construct-relevant ways has led NAEP’s designers to reject limits on measurement modalities with which most programs live. NAEP makes heavy use of innovative performance and constructed-response items to measure students’ knowledge and skill,
though they require significantly more time to assess than other modalities. For example, in mathematics, the assessment frameworks emphasize complex problem solving, and NAEP items ask students to solve real-world and complex problems to test that kind of knowledge. Similarly, in reading and U.S. history, extended stimuli (introductory texts) are used as the bases for item sets that measure real-world reading and understanding. In science, NAEP uses hands-on experiments to judge how well students engage in the practices of science, and many multiple-choice items are augmented by various types of constructed-response tasks.
Though these items are difficult to construct and require more testing time, they are key to NAEP’s purpose and results. Without the need to report individual scores, NAEP has the freedom to cover domains in ways that other tests cannot. Using highly sophisticated statistical models to aggregate and analyze the data and report accurate results, NAEP also provides important models for the art and science of assessment.
Goal 2: Maintain Trends in Ways that Allow Meaningful Comparisons Over Time
NAEP does more than depict performance at a given point in time. It also tracks trends in performance. That is, NAEP is not just about educational achievement; it is also about educational progress. To meet this goal, changes between one assessment administration and the next need to be minimized. Stability in the measurement process is needed.
NAEP has addressed the trend parts of its mission in various ways. As already described, the assessment frameworks for main NAEP have generally remained unchanged for at least a decade.6 Within a given framework, most assessment items and blocks are used in different years without revision. When changes are made, either to the frameworks or to conditions and approaches to test administration, bridge studies are undertaken. Bridge studies facilitate modest framework changes, allow assessment accommodations, and allow transition from paper-based to computer delivery. This careful approach has enabled NAEP to maintain trend lines for main NAEP that, in many cases, span 30 years. However, the program has broken trend lines when analysts have found that
___________________
6 NAGB’s 2018 policy on framework development calls for each framework to be reviewed for potential update at least once every 10 years, though that review might determine in some cases that no update is required. See https://www.nagb.gov/content/dam/nagb/en/documents/policies/framework-development.pdf.
changes in the measures are too large to link new results with the results from older assessments.7
For long-term NAEP, as noted above, the trend lines go back to the early 1970s, in part because some items are largely unchanged since their first use.8 Since these items measure things students were expected to know and be able to do 50 years ago, some of them may be viewed today as less relevant or less complete indicators of educational progress.
Thus, the goal of NAEP to report trends stands in tension with its goal to regularly update its assessments to provide the best current reflection of the domains it covers. This problem will become increasingly intractable in the face of rapid technological change and the instructional changes that may go with it.
Goal 3: Accomplish Goals 1 and 2 While Limiting the Burden on Respondents, Schools, and Taxpayers as Much as Possible
Limiting respondent testing time was a key goal of NAEP in its earliest implementation. Many features of the program were designed to help meet this goal. Because NAEP’s focus was on group-level performance, not individual-level performance, the reliability of group-level estimates was key. This feature means that individual students can take small numbers of items without concern about the reliability of short tests, so long as they yield results that can be aggregated into useful group performance distributions: one of the main achievements of NAEP in the early 1980s was the development of the statistical models to do so. This approach has allowed NAEP to use more complex items (see Goal 1, above).
In the original design, there were several reasons to limit student testing time. The program was originally voluntary. Testing students for an hour or less was a way to encourage participation. Short student sessions also reduced the risk that students’ fatigue would overly influence their performance. However, there are clearly drawbacks with the short testing times, not the least of which is the limitation of testing to a single subject, which both increases cost and limits any analysis of relationships across subjects. At various times between 1990 and 2010, longer testing was considered
___________________
7 Trend lines have also sometimes been broken with new frameworks for policy reasons, with the decision not to attempt bridge studies to continue the existing trend line because of change in the construct brought by the new framework. This was done in 2005 for grade 12 mathematics, in 2009 for science for grades 4, 8, and 12, and in 2011 in writing for grades 4, 8, and 12 (NAGB, personal communication, December 16 and 18, 2021).
8 The long-term NAEP assessment was changed in 2004 to remove the domains of science and writing as assessed domains and replace outdated material in reading and mathematics (NCES personal communication, December 17, 2021); also see https://nces.ed.gov/nationsreportcard/ltt/bridge_study.aspx.
but was rejected because of concerns about student burden, fatigue, and possible context effects if students took assessments in multiple subjects.
In addition to consideration of student testing time, the program prioritized efforts to limit the burden on school staff. Thus, all data collections prior to 1990 were managed by contractor-hired proctors. In the first decade of the trial state assessment program (the 1990s), school staff served as proctors. However, when NCLB mandated state participation, the state assessments were given by paid staff, as had always been the case for private schools and schools in the national samples. Similarly, when NAEP transitioned to digitally based assessment, NAEP supplied the computers and other technologies that students needed for it.
The high costs of these approaches work at cross purposes with NAEP’s goal to limit taxpayer burden. Minimizing student burden by keeping tests short increases sample sizes and data collection costs. Minimizing school burden by using paid proctors and providing students with needed technologies also increases costs. Thus, NAEP’s priorities for limiting student and school burden are at cross purposes with limiting taxpayer costs.
Goal 4: Give Stakeholders and the Public Visibility into the Program and Ensure NAEP Does Not Usurp State and Local Authority
Another important goal for NAEP is less explicitly reflected in NAEP legislation. Because education is largely a state and local matter, federal involvement is seen as a possible intrusion. Such fears of intrusion were enhanced by the expansion of NAEP to the state and district levels.
NAEP has responded to these potential concerns in three ways. First, NAEP neither measures nor is intended to directly influence any state’s curricular goals, educational practices, or assessments. NAGB develops NAEP frameworks through a national consensus-building approach among constituencies that are reflected in the board’s legally prescribed composition: teachers, principals, legislators, governors, chief state school officers, local education agencies, state and local board members, business representatives, testing experts, curriculum specialists, nonpublic school representatives, and parents. Building consensus for the assessment frameworks among these constituencies requires time and effort.
Second, NAEP opens its development process to many public groups. Participating states get to review test frameworks and assessment materials, as do representatives of academia in assessed fields. This involvement is not solely limited to test content. NAEP stakeholders are involved in discussions around contextual questionnaires, delivery of assessments, changes to testing time, and other key program characteristics.
Third, NAEP invites feedback on its reports from a variety of stakeholders, including subject-related standing committees, state assessment
and curriculum specialists, district assessment and curriculum specialists, subject matter specialists, NAGB members and staff, and NCES staff.
Processes
As a result of its open and inclusive approach, the NAEP budget and review processes include a far greater array of expert groups than is common for testing programs. Those groups include9
- subject-area framework “visioning” and “development” committees (when frameworks are under development)
- subject-area test development committees
- contextual questionnaire committees
- state item review meetings
- a design and analysis committee
- a validity studies panel
- a state advisory committee (in conjunction with the Council of Chief State School Officers)
- an urban district advisory committee (in conjunction with the Council of Great City Schools)
- technology advisory bodies
- special-purpose panels (such as the one writing this report)
These groups are in addition to NAGB, which by law provides oversight.
COSTS
Analysis of Current Costs
Costs for NAEP have increased substantially since its inception, driven by both program expansions and changes in administration. As described above, program expansions include the mandate for state assessments in 2002, the extension to trial urban districts over several years, and the addition of 12th-grade assessments in 2009. Changes in administration include the decision to use NAEP-supported proctors for the mandated assessments in 2002 and the change from pencil-and-paper testing to digitally based administration in 2017 (though there were earlier isolated efforts with digitally based administration). The inflation-adjusted costs from 2000 through 2021 are shown in Figure 2-1.
___________________
9 After a prepublication version of the report was provided to the Institute of Education Sciences (IES), NCES, and NAGB, this section was edited to add the urban district advisory committee.
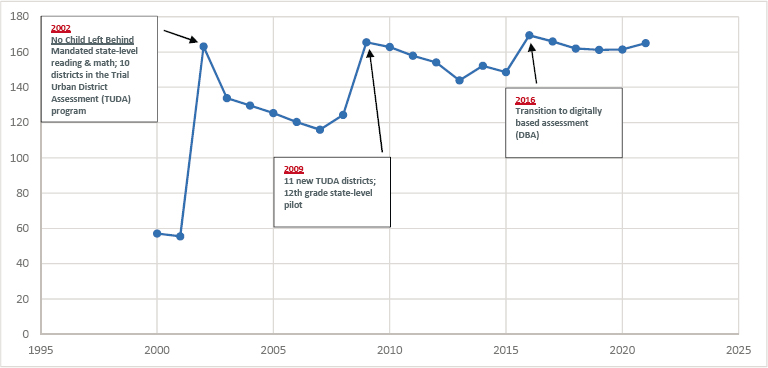
NOTE: Figure excludes a fiscal 2021 appropriation of $28 million for COVID-19 mitigation across 2 years.
SOURCE: NCES response to Q51.
Figure 2-1 does not include all NAEP-related costs. In addition to the appropriations to NCES shown in the figure for the operational work of the program, there is also a smaller appropriation to NAGB for costs associated with NAGB’s carrying out of its responsibilities, which include board meetings, staff salaries, and framework development ($7.7 million in fiscal 2021). Additionally, there are separate costs for the NCES staff who work on NAEP and are supported by other Department of Education (DoED) appropriations.10 In total, 32 full-time-equivalent federal staff currently work primarily on NAEP, 20 for NCES and 12 for NAGB.11
The majority of the appropriations for NAEP to NCES are used to support a consortium of contractors, often called the NAEP Alliance contracts, with each supporting different program functions. These contracts currently cover a 5-year period, currently from fiscal 2020 to fiscal 2024. NAGB has a smaller number of contracts, covering different support functions and the development of the assessment frameworks and achievement levels.12
Table 2-2 shows the panel’s best estimate of current average annual costs for NAEP by function, including all funding sources. The cost differences that the panel was able to analyze were generally the ones that relate to NAEP’s contract structure, since the costs inside individual contracts often
___________________
10 Information from NCES response to Q50.
11 Information from NCES response to Q64a.
12 NCES response to Q63a.
TABLE 2-2 Estimated Current Average Annual Cost for NAEP by Function
| Function | Annual Cost ($ millions) | Percentage of Total Budget |
|---|---|---|
| Contract: Item Development | 16.3 | 9.3 |
| Contracts: Data Collection; Support and Service Centers | 50.2 | 28.6 |
| Contract: Scoring and Dissemination | 8.3 | 4.8 |
| Contract: Analysis and Reporting | 17.6 | 10.1 |
| Contract: Platform Development | 19.2 | 11.0 |
| Contract: Web | 10.2 | 5.8 |
| Contract: Program Support | 6.2 | 3.5 |
| Contracts: NAEP Support | 37.0 | 21.1 |
| NCES Staff (salaries only) | 2.5 | 1.4 |
| NAGB Contracts | 3.1 | 1.8 |
| NAGB Direct Costs (including staff, office, meetings) | 4.6 | 2.6 |
| Total | 175.2 | 100.0 |
NOTES: Contract averages for the current period provided by NCES (personal communication, November 1, 2021). NCES staff numbers provided in NCES response to Q64a, with the average salary for DoED employees provided in NCES response to Q64b. NAGB staff and costs for salary and benefits were provided in NCES responses to Q64a and Q64b and NAGB follow-up to Q64b.
reflect proprietary information that could not be provided to the panel. Although the contract structure provides information about some functions, much cannot be determined. For example, the cost for pilot testing new items is spread out across many of the contracts since it includes the separate contracts used to support data collection, scoring, and analysis, in addition to the contract related to item development.13 Annual averages are given because the costs for many of the specific functions vary by year with the assessment schedule. For the Alliance contracts, the estimates of the annual averages apply the percentage spending anticipated over fiscal 2020–2024, which is the period covered by the current Alliance contracts, to the NCES appropriation of $165 million for fiscal 2021.14 With this analysis, this report uses $175 million as an approximate annual cost for NAEP. Further details about some of these costs is provided in the relevant chapters.
___________________
13 NCES answers to follow-up questions about evidence-centered design task models and item development costs (personal communication, June 24, 2021).
14 The appropriations figure of $165 million for fiscal 2021 excludes the additional appropriation of $28 million for COVID-19 mitigation across 2 years. Contract averages for the current period provided by NCES (personal communication, November 1, 2021).
As can be seen from the above text and Table 2-2, it was difficult for the panel to obtain a clear picture of the overall budget for NAEP and how it is spent for the program’s different functions. This is perhaps not surprising, given the program’s complexity, but it is a hindrance to understanding the cost of the different program functions, comparing them with alternatives, and providing support for changes. Clear and comprehensive cost information is essential as a foundation for the choices that NAGB and NCES make in governing and implementing the program, and as an essential aspect of accountability to Congress and the public.
RECOMMENDATION 2-1: The National Center for Education Statistics and the National Assessment Governing Board should develop clear, consistent, and complete descriptions of current spending on the major components of NAEP, including contract structure, contractual spending, and direct spending on government staff and other costs. These cost descriptions should be used to inform major decisions about the program to ensure that their long-term budgetary impact is supportable.
Despite the limited cost data available and the necessity to use estimates, sufficient data are available for the panel’s key conclusions and recommendations. The recommendations related to costs reflect large differences that will not be affected by any uncertainties in the estimates in Table 2-2.
Using these costs and the numbers of assessments, test items, schools, and students tested in an average year (described above), the panel calculated unit costs for NAEP assessments. Table 2-3 provides average unit costs by assessment and student.15
Comparing NAEP Costs with Those of Other Testing Programs16
NAEP’s overall costs are high, but the program’s distinctive characteristics make it difficult to find perfect comparators. In addition, the limited
___________________
15 In calculating cost per assessment, it would be possible in principle to distinguish between major and minor assessments with respect to cost, contrasting the “state” assessments with large samples and the “national” assessments with small samples, with the long-term trend assessments also having further reduced item development and fewer items. However, information about these kinds of cost contrasts was not available to the panel (NCES response to Q38). This point was added after a prepublication version of the report was provided to IES, NCES, and NAGB.
16 After a prepublication version of the report was provided to IES, NCES, and NAGB, this section was edited to note that some costs of the PISA program are paid directly by the individual participating countries. A comparison between NAEP and PISA costs was removed because the panel had inadequate information about the PISA costs paid directly by individual participating countries.
TABLE 2-3 Average Costs for NAEP, Fiscal 2021, by Assessment and per Student
| Cost | Fiscal 2021 Cost | Notes |
|---|---|---|
| Total | $175.2 million | $165m for NCES and $7.7m for NAGB; omits onetime COVID-19 administration funding; includes NCES staff salaries for NAEP but not other NCES costs for NAEP |
| Average per Assessment | $31.8 million | Average cost for assessment of one subject in 1 year for one grade; does not distinguish between assessments with small (national) and large (state and urban district) samples |
| Average per Student | $438 | Average overall program costs for one subject and 1 hour |
availability of cost data for both NAEP and other assessment programs makes it difficult to provide fair comparisons. However, the panel has used cost data that are publicly available to make some logical comparisons to the NAEP costs shown in Table 2-3.
As indicated above, international tests provide a point of comparison for NAEP’s costs. For example, PISA shares with NAEP a focus on group rather than individual scores and an oversight structure that seeks to address the views of multiple stakeholders. PISA assessments are on a 3-year cycle; they cover three core subjects (reading, mathematics, and science) in each 3-year period, along with one innovative domain.17 Development costs for each 3-year period involve a new framework for one of the core subjects and for the innovative domain.
The international funding provided for oversight, development, analysis, and reporting of PISA for the 2020–2022 period totaled roughly $43 million.18 Averaged over the four assessments given in a 3-year cycle, the cost is roughly $11 million per assessment. However, this cost cannot be compared directly to the NAEP costs because some important PISA costs are covered by the individual participating countries, including costs for test administration and scoring, as well as some aspects of item development and reporting. Unfortunately, the panel was unable to obtain data on the country level support provided by the 70+ participating countries in the PISA program to provide a complete picture of costs that could be compared with NAEP.
State assessment programs provide a seemingly reasonable comparison for NAEP, given that they assess the same grade levels and similar content,
___________________
17 See https://www.oecd.org/pisa.
18 NCES response to Q61 describes costs totaling 39 million euros over the period, converted to dollars at current exchange rates on January 27, 2022.
but it is important to remember that their goals are quite different from NAEP’s. Unlike NAEP, state programs provide scores for individual students and assess student proficiency in relation to specific state standards. For an available cost comparison, we use the state of Colorado, which has an annual appropriation of $32 million for its state assessment.19 The state program includes the development of 23 assessments in four core subjects, each of which also has a separately developed alternate version, and then 6 grade span tests for English learners.20 The state program administers roughly 1.4 million tests each year for Colorado’s 880,000 students. Across all 52 assessments developed by the state, the mean budgeted cost per assessment is $615,000. Across all 1.4 million tests administered, the mean budgeted cost per administered assessment is $23.21 The available cost averages omit various costs that are relevant for NAEP, such as the costs related to framework development and the staffing costs for both overseeing and administering the assessment.22 Nevertheless, they do allow a rough comparison showing that NAEP is substantially more expensive than state assessment programs. This analysis suggests that there may be room for greater cost effectiveness in NAEP, even while acknowledging that a comparison to a state assessment is not an apples-to-apples comparison.
NAEP’s average cost per assessed student can also be compared to the fees students pay to take high-stakes exams, such as the SAT, the American College Test (ACT), the Graduate Record Exam (GRE), the Graduate Management Admission Test (GMAT), the Law School Admission Test, and the Medical College Admission Test (MCAT). In 2021, these fees ranged from $52 to $315 for exams that test students on two to four subjects in sessions that last from 3 hours to more than 6 hours. Individual candidates for some of these tests (GRE, GMAT, MCAT) take exams in expensive brick and mortar test centers, rather than online. There are no publicly available
___________________
19 See https://leg.colorado.gov/sites/default/files/documents/2021A/bills/2021a_edu_act.pdf.
20 Colorado state assessment program information provided by Joyce Zurkowski, chief assessment officer, Colorado Department of Education, October 22 and December 2, 2021. The program includes English language arts and mathematics in grades 3–11; science in grades 5, 8, and 11; social studies in grades 4 and 7 for one-third of the students; PSAT and SAT in grades 9–11. In addition, alternate assessments for all assessments are given in grades 3–11; accommodated Spanish language arts in grades 3 and 4; and English learner assessments for grades K–12 in six grade spans.
21Chingos (2012) finds per-student costs for state assessments under No Child Left Behind ranging between $7 and $114 for the 2007–2012 period.
22 This point was added after a prepublication version of the report was provided to IES, NCES, and NAGB, to note that the available estimates for state assessment costs omit some costs that are important to the NAEP estimates, such as those for framework development and administration. Despite these omissions on the state estimates—and the resulting lack of comparability between the estimates—the overwhelming difference in costs still allows a comparison to be drawn.
data for the test sponsors’ costs to administer these exams, but one can assume that the students’ fees for them exceed the costs that sponsors pay to deliver them.
Though these various comparisons are imperfect, they suggest that the costs of the NAEP program are much higher than those of other assessment programs. The remaining chapters discuss different aspects of these costs and possible changes for the efficiency of the program.
This page intentionally left blank.


