

SECTION 6
Quantitative Analysis of the Potential Economic Impact of the ABQT Device
At a high level, the primary economic impact of adopting and using the ABQT is decreased maintenance for some number of lane-miles of asphalt roadways. If binder samples received by DOT central testing laboratories are not all tested promptly, a small number of out-of-specification samples may be missed, leading to a small number of lane-miles being paved with subpar asphalt. Using the ABQT as a screening device could potentially increase the identification of out-of-specification binder samples. If this information could be communicated sooner to paving work-sites, it could reduce maintenance costs in the future. Hence, using the ABQT as a screening device was the focus of the probabilistic model and economic impacts analysis generated for this evaluation.
The consensus from interviews with state DOTs and other SMEs was that the most likely adoption scenario for the ABQT would be as a screening device for state DOTs. The result of state DOT adoption of the ABQT would be an increase in the number of out-of-specification binder samples identified and accelerated notification to halt paving activities in the field.
Although the interviewed state DOTs and other SMEs saw a potential role for ABQT use in state DOTs, they also determined that the ABQT is not suitable for use in the official certification testing conducted by DOTs. Therefore, even if DOTs were to adopt the ABQT, they would still need to conduct the same number of full tests. Using the ABQT would not decrease the number of samples being fully tested and, thus, would not change current binder testing activities, equipment, and costs. Because the ABQT would not replace any of the full tests needed for certification, evaluating changes in testing costs is a minor part of the economic analysis, limited to the adoption and use of the ABQT device itself.
6.1 Adoption Scenarios and Impact of the ABQT
As discussed in Section 2.2, the evaluation team modeled three adoption scenarios for the ABQT because of the uncertainty related to which parts of the binder supply chain would be likely to adopt the device (descriptions of scenarios repeated here for convenience):
- Scenario 1: DOT testing labs adopt the ABQT as a screening tool. The level of full comprehensive testing is not changed, but samples are prioritized for full testing.
- Scenario 2: In addition to being adopted by DOTs, the ABQT is adopted by asphalt binder suppliers as a quick screening tool to be used at terminals to screen binder before shipping.
- Scenario 3: Mix plants also adopt the ABQT (in addition to DOTs and suppliers) as a quick screening tool to test binder specifications upon delivery.
These three scenarios are additive (stacked) with the adoption of the ABQT increasing throughout the supply chain. Based on the interviews, DOT adoption (Scenario 1) is viewed as the most
likely scenario. ABQT adoption by asphalt suppliers in addition to DOTs (Scenario 2) and DOTs, suppliers, and mix plants (Scenario 3) was considered less likely without changes in regulatory requirements.
6.2 Conceptual Model of the Impact of the ABQT as a Screening Tool (Scenario 1)
The ABQT could be used as a screening tool applied to all samples submitted to DOTs by asphalt suppliers and mix plants within a day or two of being received. The results of the screening could then be used to prioritize which samples receive full tests first, potentially finding more out-of-specification binder sooner. This could aid state DOTs with decision-making when assessing penalties and create a more robust QA/QC program.
DOT use of the ABQT as a screening tool would have two main technical impacts:
- More out-of-specification samples would be found by the full tests being conducted (assuming that not all samples submitted to DOTs are currently tested). That is, prescreening and prioritizing would increase the likelihood that the samples selected for full testing would capture most of the out-of-specification samples. Hence, the probability of failure from the full testing process would increase and the probability of untested samples being out of specification would decrease.
- Prioritization would lead to decreased lag times in identifying samples that fail full testing. Samples that fail the ABQT screening can be prioritized and tested first. Hence, out-of-specification asphalt paving can be halted early, before too many lane-miles are laid.
Figure 6-1 provides an illustrative example of the first impact. The key parameters and assumptions are based on information provided during the SME interviews and were then vetted with SMEs again through the follow-up electronic survey. Responses from the follow-up survey did not significantly change the interview-based parameter values in that survey respondents agreed that the values seemed representative of the industry as a whole.
The analysis in Figure 6-1 begins with the observation that many DOTs cannot test all the samples they receive, so a sampling process is used to select the ones that receive full testing. This practice was common among most of the interviewed DOTs. Alternatively, some DOTs requested fewer samples from suppliers and mix plants and tested all of them, but they indicated that a screening tool might lead them to require the submission of more samples. In both cases, DOTs’ use of the ABQT as a screening tool would have a similar impact in that it would increase the detection of subpar binder by allowing DOTs to screen all/more samples and prioritize full testing for the subset that failed.
6.3 The Probabilistic Model
A probabilistic model was used to link the probability of a subpar binder sample not being identified by the full testing process to lane-miles paved with the subpar binder. The change in probabilities associated with ABQT use was then combined with the additional maintenance costs per lane-mile resulting from asphalt paved with a subpar binder to calculate the economic impact.
Most SMEs pointed out that assessing the share of asphalt pavement problems (and hence maintenance) associated with binder issues is very difficult. Binder is only one of many factors
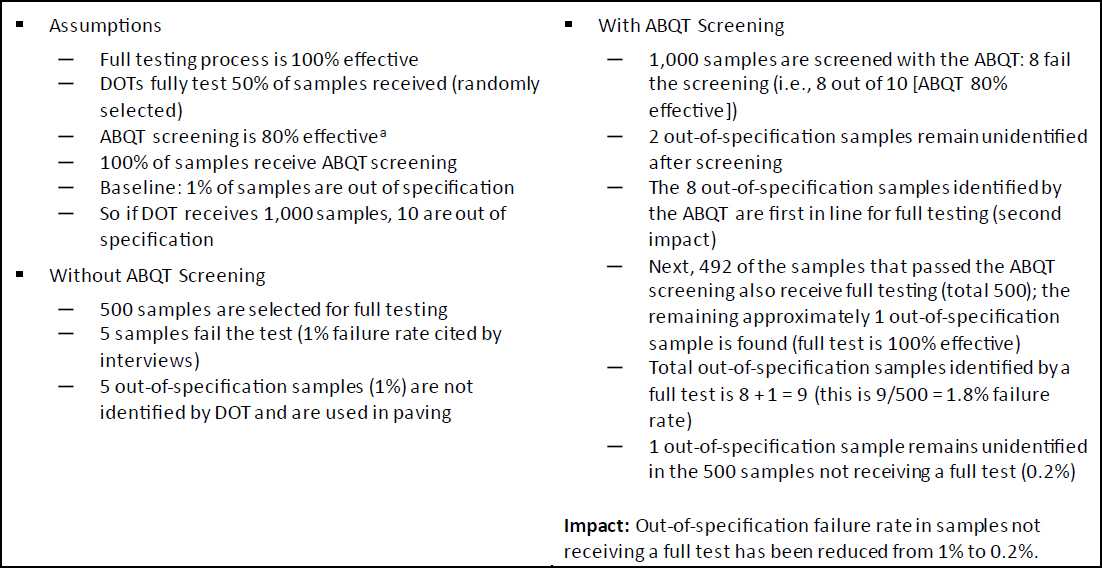
Figure 6-1. Example of Impact 1 of DOT use of the ABQT.
that can lead to cracking, rutting, and decreased life expectancy of asphalt pavement. With this limiting factor in mind, the modeling approach used in the analysis employed a bottom-up methodology, as opposed to a top-down methodology.
The model does not begin with the number of total asphalt lane-miles that require increased maintenance or early milling and then try to attribute some portion of those costs to out-of-specification binder (top-down). In contrast, the model estimates (in a probabilistic manner) the number of lane-miles paved with an out-of-specification binder. The model then tries to estimate how many fewer lane-miles might be paved with an out-of-specification binder if the ABQT were adopted as a screening tool (bottom-up).
The increased maintenance and early replacement costs associated with the very few lane-miles paved with an out-of-specification binder are much more likely to be attributable to the binder issues, as opposed to speculating on the large number of total lane-miles in general with asphalt problems that can be attributed to the binder. In this way, the model applies more certain binder costs to a small number of lane-miles, as opposed to applying highly uncertain attributable binder costs to the larger number of total lane-miles with asphalt issues.
6.3.1 Baseline
Figures 6-2 and 6-3 provide a flow diagram of the modeling approach, following the example outlined in Figure 6-1. Figure 6-2 is the current base case for a DOT that is testing only a subset of the samples it receives. In the economic impact analysis, it is assumed that 50% of samples submitted are randomly selected for full testing. Of the samples receiving full testing, all out-of-specification
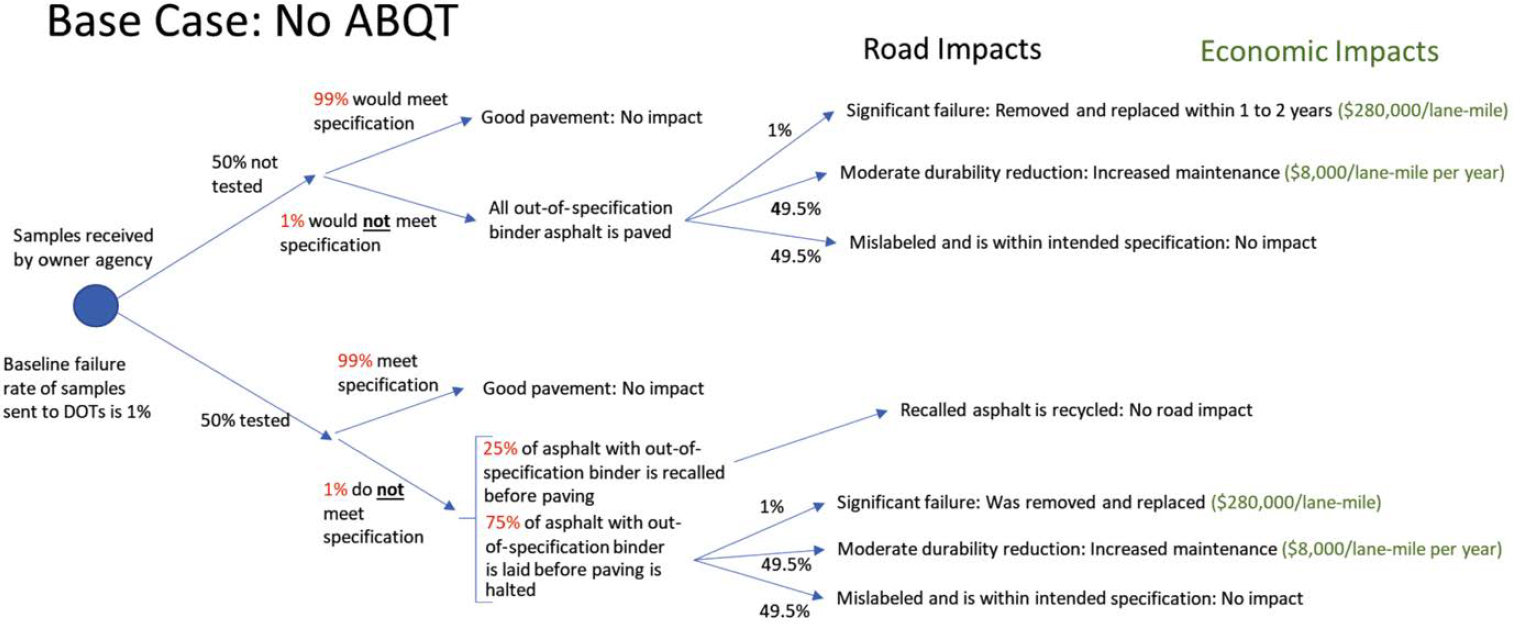
binder samples are detected (100% effectiveness). However, because of the lag in testing and in communicating delays to the field, 75% of the detected failed binder is paved. The 1% of binder samples not fully tested, which would have failed if tested, is used for paving.
As illustrated in the “Road Impacts” portion of Figure 6-2, just because a binder sample fails the full test does not necessarily mean that the binder will lead to increased maintenance or removal costs. Sometimes the samples are mislabeled or are contaminated during the sampling process, and the binder is actually within specification and does not cause any issues. In addition, if a sample is just slightly out of specification, it might be “close enough” to specification not to lead to increased maintenance. Thus, as shown in Figure 6-2, the model assumed that only about half of failed, out-of-specification binder samples used in pavement lead to increased maintenance and that the other half does not.
Finally, it was assumed that a very small fraction, 1%, of failed, out-of-specification binder leads to catastrophic failure, which would require removal and replacement. This event is extremely rare and happens only once every few years for a typical state DOT.
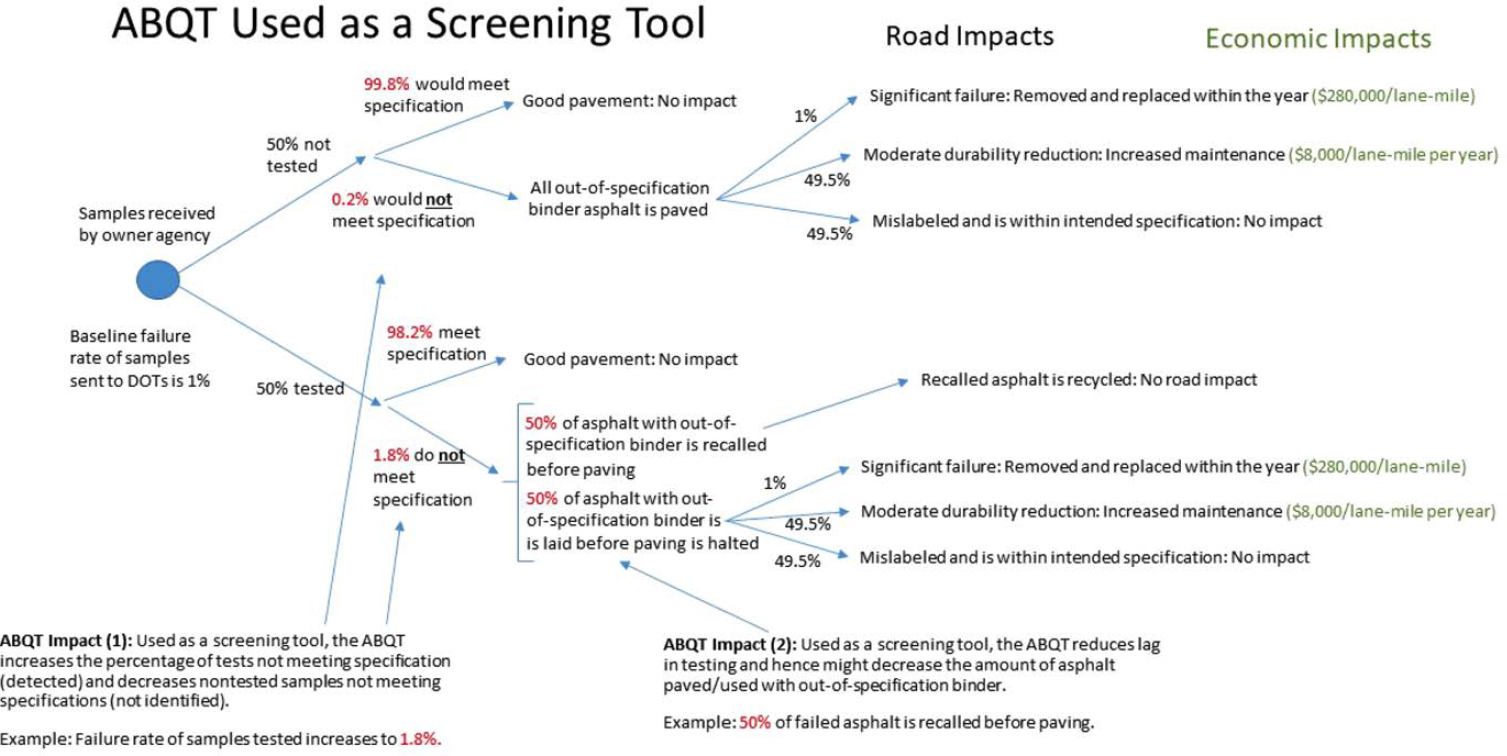
6.3.2 With ABQT Adoption
Figure 6-3 shows how some of the probabilities change with the adoption of the ABQT by DOTs. The changes in the probabilities from the base case (Figure 6-2) to ABQT use by DOTs (Figure 6-3) lead to a change in the amount of subpar asphalt paved (lane-miles), the value of which is indicated by the average maintenance and removal costs per lane-mile (which is unchanged between the base case and ABQT adoption).
The modeling approach shows that using the ABQT as a screening tool would lead to the identification of more out-of-specification samples and faster dissemination of findings of failed samples. Both of these outcomes would help reduce the number of lane-miles paved with out-of-specification asphalt binder. The probabilistic model calculated the change in the number of subpar binder lane-miles paved as a function of the change in the probabilities of detection from the ABQT screening. For example, for Scenario 1, the change in the subpar binder lane-miles was calculated by comparing the outcomes from the base case (shown in Figure 6-2) to outcomes from the owner agency adoption of ABQT (shown in Figure 6-3).
6.4 Road Maintenance Costs Used in the Analysis
Once the reduction in the number of subpar binder lane-miles paved was calculated, its value was then determined using the avoided maintenance and replacement costs. Table 6-1 presents typical maintenance costs over the lifetime of an asphalt pavement (Transportation for America and Taxpayers for Common Sense, 2019). Avoided costs include the following:
- Increased routine maintenance due to increased frequency of cracking and buckling on the small number of lane-miles paved with subpar binder asphalt and
- Removal and replacement for the very small fraction of lane-miles paved with subpar binder asphalt.
Table 6-1 shows results from Repair Priorities, prepared by Transportation for America and Taxpayers for Common Sense (2019). This report provides maintenance treatment schedules for asphalt, including treatment type, year of application, and cost per lane-mile over a 50-year life-cycle. The report draws on information from FHWA to estimate the annual average spending on roadway repair by all 50 states. The study uses several categories of data from FHWA to derive final estimates, including costs for arterial systems in rural and urban areas, as well as for rural and urban collectors. The report states that estimated costs were calculated by averaging total expenditures over the years 2009 through 2014. Costs were scaled to 2021 dollars.
Table 6-1. Typical life-cycle maintenance costs for asphalt pavement.
| Year Applied | Asphalt Treatment Schedule | |
|---|---|---|
| (over 50-year life-cycle) | ||
| Treatment Type | Cost per Lane-Mile ($2021) | |
| 0 | (Initial Construction) | N/A |
| 5 | Crack sealing | $2,808 |
| 6 | Microsurfacing | $33,851 |
| 10 | Crack sealing | $2,808 |
| 14 | Mill and resurfacing | $279,669 |
| 14 | Chip seal | $56,037 |
| 18 | Crack sealing | $2,808 |
| 19 | Microsurfacing | $33,851 |
| 23 | Crack sealing | $2,808 |
| 26 | Mill and resurfacing | $279,669 |
| 26 | Chip Seal | $56,037 |
| 30 | Crack Sealing | $2,808 |
| 31 | Microsurfacing | $33,851 |
| 34 | Crack sealing | $2,807 |
| 38 | Milling and resurfacing | $279,669 |
| 38 | Chip seal | $56,037 |
| 42 | Crack sealing | $2,808 |
| 43 | Microsurfacing | $33,851 |
| 50 | MAJOR rehabilitation | $249,447 |
| Total lifetime cost per lane-mile, 2021: | $1,411,625 | |
| Total annualized cost per lane-mile, 2021: | $28,232 | |
| Annualized cost per lane-mile of just maintenance between resurfacing | $7,959 | |
Source: Transportation for America and Taxpayers for Common Sense, 2019
If subpar binder was used to pave roads, it was assumed that the next scheduled treatment of milling and resurfacing would repair any issues. Thus, increased maintenance costs would accrue only for the approximately 12-year period between milling and resurfacing treatments. Therefore, only a single chip sealing, a single microsurfacing, and two crack sealings would be affected. It was assumed that these costs would double, on average, during this period before the next scheduled milling and resurfacing treatment, as shown in Equation 1.
Total Incremental Maintenance Costs = $56,037 + $33,851 + 2 * ($2,808)
= $95,504/lane-mile paved (1)
The total incremental maintenance cost was then annualized over a 12-year period to yield an annual incremental cost per lane-mile of $7,959. This figure was used as the annual increased maintenance cost per lane-mile paved with subpar asphalt.
In the case of a catastrophic event caused by the use of a subpar binder, for which removal and replacement were required shortly after paving, the analysis used the cost of milling and resurfacing (shown in Table 6-1 as $279,669 per lane-mile).
6.5 Scenario 1: Adoption of the ABQT by DOTs
Figures 6-2 and 6-3 outline the underlying approach for calculating the economic impact of DOTs using the ABQT as a screening tool to prioritize samples for full testing. Table 6-2 provides a summary of the key parameters/probabilities used in the model and indicates which ones would be changed as a result of DOTs using the ABQT (changed parameters are shown in boldface in Table 6-2).
Table 6-2. Impact of the ABQT on key model parameters.
| Key Model Parameters | Baseline Value without the ABQT | Value with the ABQT |
|---|---|---|
| % of binder produced that is out of specification | 1.0% | 1.0% |
| % of samples received by DOTs that are tested | 50.0% | 50.0% |
| Effectiveness of the ABQT (% correct in identifying failures) | NA | 80.0% |
| % of fully tested samples that fail | 1.0% | 1.8% |
| % of untested samples that would have failed | 1.0% | 0.2% |
| % of out-of-specification binder identified by full testing that is laid before paving is halted | 75.0% | 50.0% |
| % of failures that are not significant enough to increase maintenance costs | 50.0% | 50.0% |
| % increase in maintenance costs if impact is significant | 50.0% | 50.0% |
| Lane-miles of asphalt roads managed by state agencies | 1.2 million | 1.2 million |
Source: With and without ABQT parameter values were based on SME interviews and the follow-up survey.
Testing done by state agencies that have used the ABQT indicates that it can identify the proper PG of binder about 98% of the time. However, PG is not the only important indicator of whether the binder meets the specification for the job. The analysis assumed that slightly less than 20% of the time the PG is not a good indicator of whether the binder is within specification; hence, the model used an 80% effectiveness value for the ABQT.
The results from the Scenario 1 economic impact analysis using the probabilistic model are presented in Table 6-3. The reduction of out-of-specification binder used for paving drives the economic impacts. The percentage of out-of-specification binder placed decreases by about two-thirds. Annually, this is approximately 2,200 fewer lane-miles that would require increased maintenance until the next scheduled milling and resurfacing.
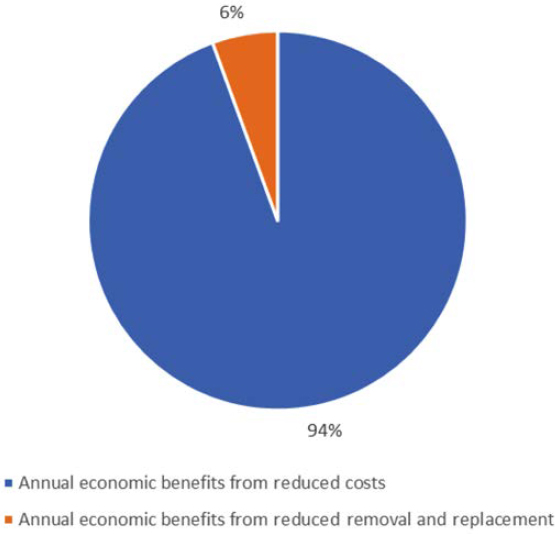
As shown in Table 6-3, the number of lane-miles removed and replaced annually decreases from 5 to 3. The relatively low number of lane-miles removed and replaced was consistent with input from state DOTs who said removal and replacement was a rare event, happening only every few years. As shown in Figure 6-4, reduced removal and replacement accounted for only 6% of benefits. This result carries through to Scenarios 2 and 3 also.
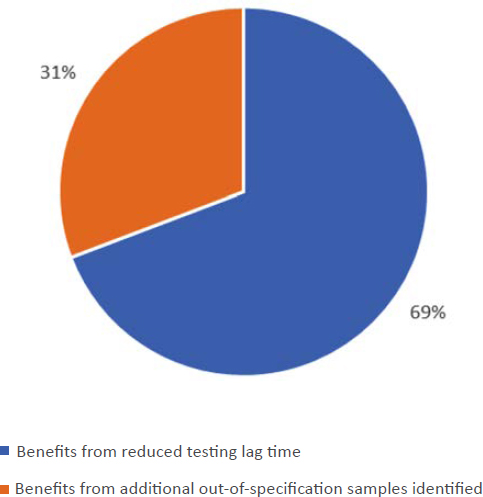
Figure 6-5 shows that the majority of the benefits associated with the adoption of the ABQT by DOTs come from reduced testing lag time, which decreases the amount of paving done with poor-quality asphalt. Almost two-thirds of the benefits are associated with identifying out-of-specification binder sooner, and the remaining one-third of the benefits comes from identifying more out-of-specification binder samples.
Table 6-3. Annual economic impacts of the ABQT used by DOTs as a screening tool (80% effectiveness).
| Parameter | % Out-of-Specification Binder Placed | Annual Lane-Miles Paved with Subpar Binder | Annual Lane-Miles Removed and Replaced | Maintenance and Removal Cost | Economic Impact: Change from Business as Usual (BAU) |
|---|---|---|---|---|---|
| BAU (without the ABQT): | 0.43% | 6,036 | 5 | $25,418,000 | – |
| DOT adoption of the ABQT | 0.16% | 3,829 | 3 | $15,977,000 | $9,441,000 |
6.6 Scenario 2: Adoption of the ABQT by DOTs and Suppliers
If binder suppliers adopted the ABQT as a quick screening tool at terminals, more out-of-specification binder could be identified before shipping. Identification of more out-of-specification binder before shipping would also reduce the failure rate observed by a DOT in its full testing of received samples and reduce the amount of out-of-specification binder slipping through the system and being used in paving.
In terms of the modeling framework presented in Figures 6-2 and 6-3, a hypothetical impact of the adoption of the ABQT by suppliers could be that the average baseline failure rate of samples submitted to DOTs might decrease from 1% to 0.5%. A decreased failure rate of samples submitted to DOTs decreases the baseline failure rate for samples that receive full tests and for samples that are not tested. Thus, for Scenario 2:
- The testing failure rate falls to 1.8/2 = 0.9%.
- The untested out-of-specification rate falls to 0.2/2 = 0.1%.
- There is no change in the percentage of fully tested, out-of-specification asphalt used in paving; it remains 50%, which is the DOT adoption Scenario 1 value.
6.7 Scenario 3: Adoption of the ABQT by DOTs, Suppliers, and Mix Plants
If mix plants, in addition to DOTs and suppliers, adopted the ABQT as a quick testing tool to verify binder specification upon delivery, the hypothetical impacts could be the following:
- Some fraction of untested binder failures would be identified at the mix plant and, hence, not used for paving.
- Some fraction of the fully tested failures that would be identified by DOT testing would also be identified at the mix plant, which would decrease the share of tested and failed binder that is used for paving because of the lag time in the notification of failed results.
- One hypothesis is that 50% of out-of-specification binder received by mix plants (tested or not tested) would be identified before use and, hence, would have no maintenance cost impact.
6.8 Impacts of the Three Scenarios
Table 6-4 shows the economic impacts of the three adoption scenarios. Note that the economic impact increases for each scenario, but at a decreasing rate. If the ABQT were adopted by DOTs, suppliers and mix plants (Scenario 3), the number of lane-miles paved with subpar binder would
Table 6-4. Annual economic impacts of ABQT use in three adoption scenarios.
| Parameter | % Out-of-Specification Binder Placed | Annual Lane-Miles Paved with Subpar Binder | Annual Lane-Miles Removed and Replaced | Maintenance and Removal Cost | Economic Impact: Change from BAU |
|---|---|---|---|---|---|
| BAU (without the ABQT): | 0.43% | 6,036 | 5 | $25,418,000 | – |
| Adoption scenarios | Adoption of the ABQT (80% effectiveness) | ||||
| Scenario 1 | 0.16% | 3,829 | 3 | $15,977,000 | $9,441,000 |
| Scenario 2 | 0.08% | 1,914 | 2 | $7,988,000 | $17,429,000 |
| Scenario 3 | 0.04% | 957 | 1 | $3,994,000 | $21,424,000 |
be greatly reduced to a little over 950 lane-miles annually. However, as reported earlier, SMEs thought it highly unlikely that asphalt suppliers and mix plants would adopt the ABQT device unless mandated to do so.
6.9 Additional Economic Benefits Investigated
In addition to investigating the direct economic benefits of reduced removal/replacement of asphalt and reduced annual maintenance costs, the evaluation team investigated other, more indirect benefits that might be associated with adopting the ABQT:
- Reduced emissions due to reduced asphalt removal/replacement and increased public health benefits from reduced asphalt production.
- Gains in vehicle fuel efficiency, reduced vehicle maintenance, and decreased accidents due to improved asphalt performance.
Ultimately, these indirect benefits were not viewed as significant by the interviewed SMEs. Several SMEs agreed that, theoretically, these could be benefits, but the SMEs thought they would be small and too speculative to quantify.
Although removal/replacement is very costly, it is also a very rare event. Most state DOTs interviewed recalled only one or two such events over the past 3 to 5 years. The amount of asphalt being replaced is negligible when compared with the overall national production and, thus, has no real impact on emissions or public health.
Similarly, SMEs thought that the amount of out-of-specification binder being used in asphalt pavement is also very small compared with the total national lane-miles in service. Furthermore, the SMEs thought that the increased maintenance conducted on affected roads would largely negate any measurable effects on fuel efficiency, vehicle maintenance, or accidents.


