
4
Safety Review
As with extraction, refining, and processing activities, the long-distance transportation of hazardous liquids and gases by transmission pipeline is a high-hazard activity but one that can be—and usually is—carried out safely on a daily basis. The primary safety aim of the pipeline industry and federal and state regulators is to prevent failures that can lead to unintentional pipeline releases, while also preparing for them through post-release mitigation and response capabilities. The previous chapter explained how prevention and mitigation are furthered through industry activities and federal and state regulation. In this chapter, the safety performance of the hazardous liquid and gas transmission pipeline industries are reviewed, giving particular attention to incident consequences and their mitigation.
The chapter begins with an overview of the general types of scenarios where the release of product from a gas or hazardous liquid pipeline can yield consequences harmful to people and the environment. The recent history of pipeline incidents is then reviewed, first for natural gas transmission pipelines and then for hazardous liquid pipelines, with a focus on incidents in high consequence areas (HCAs) and Class 3 and 4 locations. Trends and patterns discerned from incidents reported to the Pipeline and Hazardous Materials Safety Administration (PHMSA) are presented, including reported consequences.
Statistical analyses of incident reports can be helpful for identifying emerging or recurring problems that deserve more scrutiny and possible interventions; however, like many high-hazard industries, the pipeline sector can experience incidents having severe consequences but with frequencies that are too low to observe as trends or patterns in incident reporting. Such
high-consequence incidents, such as the 2010 rupture of a gas transmission pipeline in San Bruno, California, have factored into the National Transportation Safety Board’s (NTSB’s) decisions to recommend that PHMSA mandate the use of rupture mitigation valves (RMVs) on hazardous liquid and gas transmission pipelines. Rupture prevention is not fail-safe; hence, RMVs are seen as a way to reduce consequences by isolating the rupture site quickly to minimize released product. This chapter therefore provides a short synopsis of NTSB and PHMSA findings from investigations of this major pipeline incident as well as five others, noting how and when shutoff valves were deployed.
Following a summary assessment of the findings from the chapter’s review of incident reporting statistics and these major accident investigations, an addendum presents the results of an analysis of the socio-demographic characteristics of communities proximate to incidents that have been reported for hazardous liquid and gas transmission pipelines. In recent years, long-distance transmission pipelines have been attracting increased public attention due to concerns ranging from safety assurance to emissions of greenhouse gases. The nature of this public interest has taken on new dimensions as awareness about the potential equity impacts of pipeline facilities has grown, including sensitivity to whether precautions are being taken in an equitable manner to protect the safety, health, and environments of the communities through which long-distance pipelines pass. If not already part of the decision-making calculus, equity impacts are likely to receive more explicit attention in the future as pipeline risks and consequences are being modeled and as regulatory requirements are being debated and revised. The analysis in the addendum represents a preliminary attempt to consider equity in a way that may prompt more sophisticated follow-on analyses by PHMSA and others.
POTENTIAL CONSEQUENCES OF A GAS OR HAZARDOUS LIQUID PIPELINE RELEASE
Hazardous liquids are defined in Title 49 Code of Federal Regulations (CFR) Part 195.2 “Definitions” as follows: “Hazardous liquid means petroleum, petroleum products, anhydrous ammonia, and ethanol or other non-petroleum fuel, including biofuel, which is flammable, toxic, or would be harmful to the environment if released in significant quantities.” Similarly, gases are defined in Title 49 CFR 192.3 “Definitions” as follows: “Gas means natural gas, flammable gas, or gas which is toxic or corrosive.”
As these definitions imply, the release of these products into the environment because of a pipeline failure could result in the formation and spread of a toxic and/or flammable pool of liquid or cloud of gas. Many
transported liquid and gaseous products, such as the petroleum-related products of butadiene and propane, can be flammable, toxic, or both.
The consequences of a hazardous liquid or gas transmission pipeline release can be categorized into the following general scenarios:
- Flammable liquids or gases
- Ignition upon or soon after release—a fire (typically referred to as a pool fire [liquids] or a flash/jet fire [gases]), with the subsequent continuing and possible spread of fires dependent on the ability and time to shut off and isolate the flow of flammable liquids or gases.
- Delayed ignition—for liquids, formation of a pool of liquid, which then ignites and burns until the flammable material is consumed or can be extinguished; for gases or liquids that rapidly vaporize on release, the formation of a flammable cloud of material, which when ignites and could explode and continue burning until the flammable gases are consumed.
- No ignition—formation and spread of a toxic/corrosive pool of liquid or cloud of gas that could contaminate and harm people and various forms of wildlife and vegetation.
- Non-flammable liquids or gases
- As above with no ignition—the formation and spread of a toxic/corrosive pool of liquid or cloud of gas that could asphyxiate, contaminate, or otherwise harm people and various forms of wildlife and vegetation.
Two factors associated with the pipeline’s design and installation that dominate the potential volume of product that can be released from a failure are the diameter of the pipe and the distance between the sectionalizing valves that can be closed to shut off the flow of fluids to the release point. Table 4-1 presents information on the volume of liquid or gas contained within a 1-mile length of pipeline having a diameter from 6 to 48 inches.
Factors that influence the rate at which materials are released include the properties of the fluid (e.g., viscosity of the liquid material), the size and shape of the hole or point of failure in the pipeline, and the pressure at which the pipeline was operating. In general, the larger the diameter of the hole and higher the pressure in the pipeline, the faster the release of fluids from the pipeline.
The sequence of events following a catastrophic failure of a pipeline, such as a rupture, is typically categorized into three phases as follows:
TABLE 4-1 Volume of Liquid or Gas Contained Within a 1-Mile Length of Pipeline by Pipe Diameter
| Nominal Diameter (in.) | Vol. Liquid (gal.) | Vol. Gas at 500 psi (scf) |
Vol. Gas at 1,000 psi (scf) |
Vol. Gas at 1,500 psi (scf) |
|---|---|---|---|---|
| 6 | 7,121 | 35,904 | 76,032 | 120,912 |
| 12 | 27,765 | 141,768 | 299,957 | 476,955 |
| 24 | 99,765 | 507,197 | 1,073,002 | 1,706,443 |
| 36 | 262,818 | 1,333,939 | 2,822,002 | 4,487,789 |
| 48 | 473,930 | 2,406,254 | 5,090,554 | 8,095,507 |
NOTES: The liquid and gas volumes for each pipeline diameter were calculated using the volumetric equation for a cylinder [Volume = π(radius)2 × length] using a length of 1 mile. The volume was then converted to gallons for liquid and standard cubic feet (scf) for gas at the specified pressure. For gas, this is calculated assuming room temperature and using Z2P1V1 = Z1P2V2, where Z2 is the compressibility factor of natural gas at standard pressure, P1 is the designated pressure, V1 is the volume of the cylinder with the given radius, Z1 is the compressibility factor of natural gas at the designated pressure, P2 is standard pressure (14.7 psi), and V2 is the calculated volume of the gas at standard pressure.
- Phase 1—Detection or Identification. The detection phase begins immediately after the pipeline ruptures and continues until the release of materials is detected and recognized or confirmed by the pipeline operator. During this period product continues to flow through the pipeline as pumps or compressors continue to operate and valves remain open. The rate of product released during this phase tends to be at its highest.
- Phase 2—Shutdown and Block Valve Closure. This period begins after the failure is detected and the pipeline operator initiates actions to shut down any pumps or compressors on the failed segment and close block valves upstream and downstream of the release site to isolate the failed segment. Depending on the commodity, the initial pressure in the pipeline, and other factors such as temperature, the rate of product release during this phase will start to decrease.
- Phase 3—Blowdown or Drain Down. The blowdown (gases) or drain down (liquids) phase begins after complete closure of the block valves located upstream and downstream of the release site. For gases, this phase ends when the pressure of the product in the pipeline reaches the same pressure as at the site of the release (i.e., typically 1 atmosphere). For liquids, drain down may continue for some time, such as when the site of the release is at a low point in the pipeline allowing product to continue to flow to and drain from the pipeline, albeit at an ever-decreasing rate of release.
INCIDENT HISTORY OVERVIEW
Operators of hazardous liquid and gas transmission pipelines are required to submit a report to PHMSA of an incident1 (e.g., leak, rupture, mechanical puncture) that has occurred to one of their pipelines as soon as practicable but not more than 30 days after detection of the incident.2,3 PHMSA collects, collates, and makes available on its website a spreadsheet version of the various data the operators provide in their reports.4 Most of the data and information presented next were extracted from the sets of incident files PHMSA makes available on its website.
Several times, PHMSA has revised the reporting forms and the information operators are required to report. For example, it was not until 2010 that PHMSA first required operators of gas transmission pipelines to provide an estimate of the volume of gas released due to a failure in their equipment. In contrast, operators of hazardous liquid pipelines have been reporting an estimate of the volume of hazardous liquid released since 2002. As a result, in the analyses that follow, it was not always possible to include information on reported incidents prior to 2010.
Incident History: Gas Transmission Pipelines
During the 30-year period from 1993 to 2022, gas transmission pipeline operators reported 324 incidents occurring within Class 3 and 4 locations or HCAs. For this report, the only incidents included in the analyses are those involving system parts directly relevant to gas transmission pipelines and their valves.5 Incidents involving system parts separate from the main
___________________
1 This report opts for the term incident as a catchall for a hazardous liquid and gas transmission pipeline failure event.
2 49 CFR Part 191.15(a)(1) Transmission systems, gathering systems, liquefied natural gas facilities and underground storage systems: Incident report. 49 CFR 191.3 “Definitions” defines incident to mean a release of gas involving any of the following: (a) a death or personal injury necessitating in-patient hospitalization, (b) estimated property damage of $122,000 or more, (c) unintentional estimated gas loss of 3 million cubic feet or more, or (d) an event that is significant in the judgment of the operator.
3 49 CFR Part 195.50 Reporting Accidents. 195.50 requires hazardous liquid pipeline operators to report all incidents that result in (a) an explosion or fire not intentionally set by the operator, (b) a release of 5 gallons or more of hazardous liquid or carbon dioxide, (c) death of any person, (d) personal injury necessitating hospitalization, or (e) property damage in excess of $50,000.
4 PHMSA. Data and Statistics Overview. https://www.phmsa.dot.gov/data-and-statistics/pipeline/data-and-statistics-overview.
5 Examples include pipes/pipelines, valves, flange assemblies, repair sleeves or clamps, and welds/fusions. Items labeled as “other” were included, as most of these were related to the transmission pipeline itself and those related to pipeline facilities were negligible and did not impact the overall findings.
transmission line or relating to equipment located at pipeline facilities, such as compressors or drain lines, were not included, as they do not pertain to the emergency shutoff valves relevant to this study.
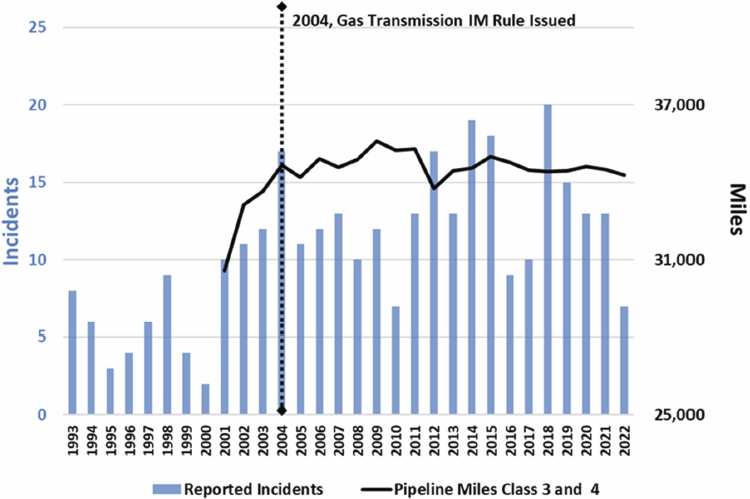
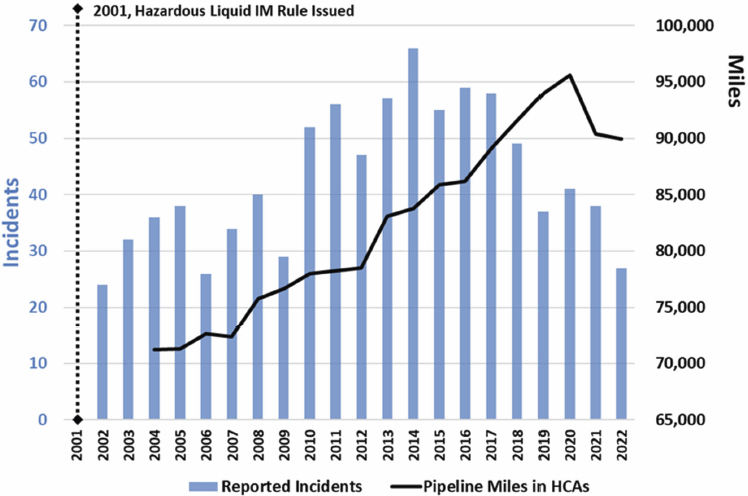
In 2010, PHMSA started to require gas transmission pipeline operators to report the volume of gas released. Table 4-2 provides a summary of the consequences of gas transmission pipeline incidents that occurred within Class 3 and 4 locations and HCAs from 2010 to 2022, as reported by operators. Figure 4-1 provides further details on the number of gas transmission pipeline incidents reported from 1993 to 2022, along with the miles of gas transmission pipeline located within Class 3 and 4 locations.6
As discussed in Chapter 3, PHMSA’s integrity management (IM) rule for gas transmission pipelines was issued in December 2003 and came into force in 2004. The preamble to the rule notes that it “comprehensively addresses statutory mandates, safety recommendations, and conclusions from accident analyses, all of which indicate that coordinated risk control measures are needed to improve pipeline safety.”7
As Figure 4-1 depicts, there had been an upward trend in reported incidents starting in 1993 through 2004, with an average of approximately seven occurring per year over that time period. From 2004 to 2022 (i.e., after the introduction of the IM regulations), the number of incidents in Class 3 and 4 locations averaged approximately 13 per year. After 2004, no discernible pattern in the annual change in the number of incidents can be observed, although since 2018 the number of incidents has decreased.
From 2001 to 2004, approximately 4,000 miles of pipeline were added to the gas transmission network in Class 3 and 4 locations (i.e., an overall increase of approximately 13%). From 2004 through 2022, the reported overall miles of gas transmission pipelines in Class 3 and 4 locations have remained relatively constant at approximately 34,500 miles.
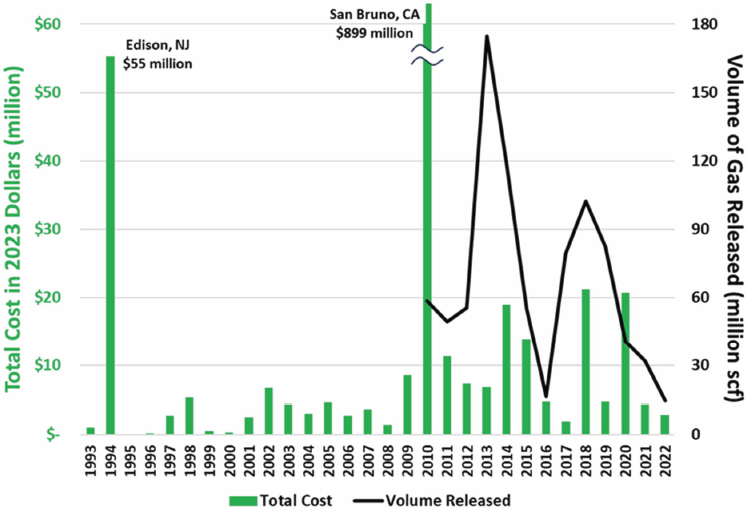
Figure 4-2 presents the reported costs (updated for inflation to 2023 dollars) of gas transmission pipeline incidents in Class 3 and 4 locations for 1993 to 2022. The figure includes the volumes released starting in 2010, which is the first year all operators were required to provide that information.
Because Class 3 and 4 locations and HCAs for gas transmission pipelines are designated based on the nature of the built environment along the pipeline right-of-way, the factors dominating the costs of gas transmission pipeline incidents are impacts on human life and damage to surrounding property from an explosion or fire. Two incidents—one in Edison, New Jersey, in 1994 (total cost of $55 million [2023 dollars]) and the 2010
___________________
6 The focus is on Class 3 and 4 locations because the 30-year span includes years prior to the establishment of HCAs.
7 68 Fed. Register, 69778, December 15, 2003.
TABLE 4-2 Gas Transmission Pipeline Incidents in HCAs and Class 3 and 4 Locations with Measures of Consequences, 2010 to 2022
| Category | No. of Incidents | No. of Fatalities | No. of Injuries | Cost of Property Damage (Million, 2023) | Cost Total (Million, 2023) | Volume of Gas Released (Million scf) |
|---|---|---|---|---|---|---|
| Totala | 174 | 10 | 70 | $53.9 | $1,019 | 881 |
| Average/year | 13.4 | 0.8 | 5.4 | $4.1 | $78.4 | 67.8 |
a The consequences of the 2010 San Bruno, California, natural gas release, explosion, and fire dominate the numbers.
SOURCE: PHMSA. Pipeline Incident Flagged Files: file title “gtggungs2010toPresent.”
SOURCE: PHMSA. Pipeline Incident Flagged Files: file titles “gtgg1986to2001,”“gtgg2002to2009,” and “gtggungs2010toPresent.” PMHSA. Gas Transmission and Hazardous Liquids Annual Report Data, https://www.phmsa.dot.gov/data-and-statistics/pipeline/gas-distribution-gas-gathering-gas-transmission-hazardous-liquids.
rupture in San Bruno, California (total cost of $899 million [2023 dollars])—dominate the physical and subsequent economic consequences of the pipeline failures (e.g., fatalities, injuries, and property damage) and the costs of those consequences. Summaries of both incidents are provided later in this section.
Since 2010, PHMSA has asked operators who are reporting an incident to indicate the type of valves used upstream and downstream from the point of release to isolate the failed segment. The forms also prompt the operator to report the length of the segment of pipeline that was isolated. Over the period of 2010 to 2022, gas transmission pipeline operators submitted 124 reports of incidents within Class 3 or 4 locations or HCAs that identified the type of valve used to isolate the failed segment. The reports also provided information on the length of the segment that was isolated once the valves were closed.
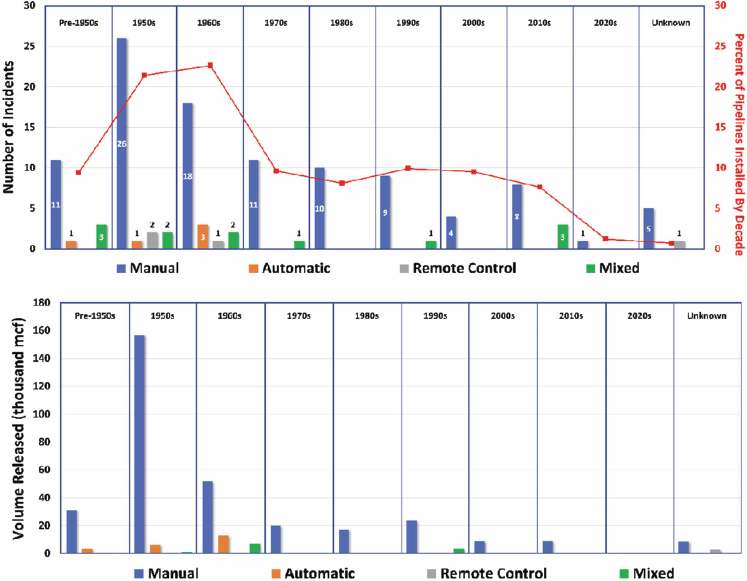
Figure 4-3 shows the percent of reported gas transmission pipeline incidents in an HCA or Class 3 or 4 location during the 2010–2022 period
SOURCE: PHMSA. Pipeline Incident Flagged Files: file titles “gtgg1986to2001,” “gtgg2002to2009,”“gtggungs2010toPresent,” and “annual_gas_transmission_gathering” reports 2001–2022.
in which a valve was reported on the segment. The chart is categorized by the decade in which the pipeline segment was installed and includes a comparison with the overall percent of gas transmission pipeline miles installed within that decade.
After removing pipelines of an unknown decade of installation, approximately 59% of these reported incidents within Class 3 and 4 locations (or that could affect an HCA) occurred on pipeline segments installed prior to 1970, which is when minimum federal safety standards were introduced. While the majority share of incidents occurring on pre-1970 pipelines is notable, the 59% value aligns with the fact that approximately 54% of the gas transmission pipeline miles in active service were installed prior to 1970. Conversely and because they are relatively new, it might be of interest that approximately 20% of the incidents occurring from 2010 to 2022 were on pipelines that were installed between 1990 and 2022; however, approximately 30% of the overall network of gas transmission pipelines was installed in that same period. These differences may arise from the fact
that many of the pipelines installed from 1990 to 2022 were not in place for the full period of 2010 to 2022.
As shown in Figure 4-3, in approximately 83% of the reported incidents within a Class 3 or 4 location, manual valves—located upstream and downstream of the release site—were used to isolate the failed pipeline.8 In addition, about 10% of the reported incidents (12 incidents) used a different valve upstream and downstream from the release site. While four of these cases were a combination of an automatic and remote-control shutoff valve, the remaining eight incidents were a combination of a manual valve and an automatic and remote-control shutoff valve or check valve. Notably, the unintentional volume of gas released where a manual valve was used to isolate the segment was approximately 15 times the volume released in the cases where automatic shutoff valves were installed and 113 times the volume in cases where remote-control shutoff valves were installed. However, those figures may be distorted because during the 2010 to 2022 period, only five incidents were reported with installed automatic shutoff valves and four with remote-control shutoff valves.
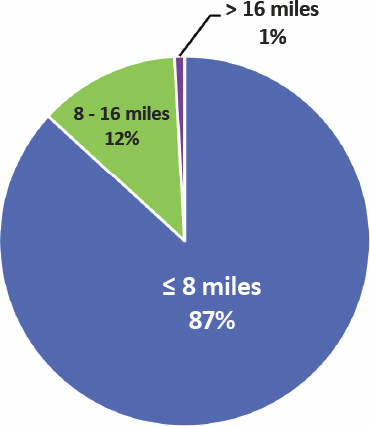
In 114 reported gas transmission pipeline incidents that occurred from 2010 to 2022 within a Class 3 location, the operator provided information on the length of the segment that was isolated. Figure 4-4 provides a summary of the reported lengths of the segments that were isolated following a failure in a pipeline and a release of gas.
49 CFR 192.179 stipulates that no point on a gas transmission pipeline within a Class 3 location should be more than 4 miles from a valve (i.e., the distance between valves within Class 3 locations should not exceed 8 miles). In approximately 87% of the 114 incidents in which the length of the isolated segment is reported, the overall length isolated was noted to be 8 miles or less. In 12% of the cases, the distance of the isolated segment exceeded 8 miles. Of the 114 incidents, there was only one instance in which the length of the isolated segment was reported to be 20.4 miles (i.e., more than twice the distance stipulated in the federal regulations). The reasons for the variation from the regulatory requirements cannot be ascertained from the incident reports.
In the reports of seven incidents that occurred in a Class 4 location, the operators provided information on the length of the isolated segment. In six instances, the lengths were below the 4-mile requirement stipulated in 49 CFR 192.179. In one case, the length of the isolated segment was reported to be 7.6 miles (i.e., approximately twice the distance stipulated in the federal regulations). Again, the reasons for this discrepancy are not clear.
PHMSA recently started collecting information on the time(s) (in hours and minutes) at which a gas transmission failure or release was first
___________________
8 Five incidents only listed “manual” as the upstream or downstream valve, while leaving the other blank.
NOTES: MCF = one thousand cubic feet. “Mixed” indicates when the upstream and downstream valves used to isolate the incident were of different types. In five of the incident reports where a manual valve was used, the operator listed only the upstream or downstream valve and therefore it is possible that an automatic or remote control valve was also used.
SOURCES: PHMSA. Pipeline Incident Flagged Files, file title “gtggungs2010toPresent”; and PHMSA. Annual Gas Transmission Gas Gathering 2010–Present, file title “annual_gas_transmission_gathering _2022.”
identified and confirmed by the pipeline operator and the time(s) at which valves upstream and downstream of the release site were closed. In 24 incidents within Class 3 and 4 locations during 2018 to 2022, operators reported these times. In 17 instances, the valves upstream and downstream of the release site were both manual valves, while in 4 instances a manual valve was listed as either an upstream or downstream valve (with the other left blank). The reported average time between when the rupture was identified and when the valves were closed was 4 hours and 43 minutes. In two instances, the upstream and downstream valves were controlled remotely,
SOURCE: PHMSA. Pipeline Incident Flagged Files: file title “gtggungs2010toPresent.”
and the reported times to close the valves were 17 and 50 minutes, respectively. In the other case, the upstream and downstream valves included a manual valve and a remote-control valve, and the operator reported a closure time of 130 minutes for the remote-control shutoff valve and just more than 4 hours for the manual valve.
Notable Gas Transmission Pipeline Ruptures
The first two incidents summarized below were investigated by NTSB and PHMSA. They involved the rupture of a natural gas transmission pipeline that had catastrophic consequences because of the gas being released to the atmosphere. In both cases, valves were not shut down for more than an hour after the pipeline had ruptured. The third, more recent incident summarized below was investigated by PHMSA. It did not have similarly catastrophic consequences to human life and property but did result in significant product losses due again to shutdown taking more than an hour to close valves and isolate the failed segment.
1994—Edison, New Jersey9 On March 23, 1994, at approximately 11:55 p.m., a 36-inch-diameter natural gas transmission pipeline that was constructed and installed in 1961 ruptured catastrophically in Edison Township, New Jersey. The force of the rupture propelled fragments from the pipeline, rocks, and other debris more than 800 feet from the site of the rupture. The initial force of the rupture created a crater about 140 feet long, 65 feet wide, and 14 feet deep. Within 1 to 2 minutes of the rupture the escaping gas ignited, sending flames 400 to 500 feet in the air. Emergency response personnel evacuated 23 individuals to a local hospital, and another 70 individuals made their own way to hospitals. In addition, 1,500 occupants in a complex of two- and three-story apartments had to escape on foot from the residences. Cars within the area could not be used as the heat from the fires made the metal too hot to touch.
The 400- to 500-foot flames were fed for about 2.5 hours before crews from the pipeline operator could access and manually close valves located approximately 3 to 3.5 miles upstream and downstream of the release.
One of several findings of the NTSB investigation into this incident was that the operator’s “lack of automatic or remote operated valves on Line 20 prevented the company from promptly stopping the flow of gas to the failed pipeline segment, which exacerbated damage to nearby property.”
As a result of this finding, one of NTSB’s recommendations to the U.S. Department of Transportation (U.S. DOT) was to “expedite requirements for installing automatic or remote operated mainline valves on high-pressure pipelines in urban and environmentally sensitive areas to provide for rapid shutdown of failed pipeline segments (Class II, Priority Action) (P-94-1).”
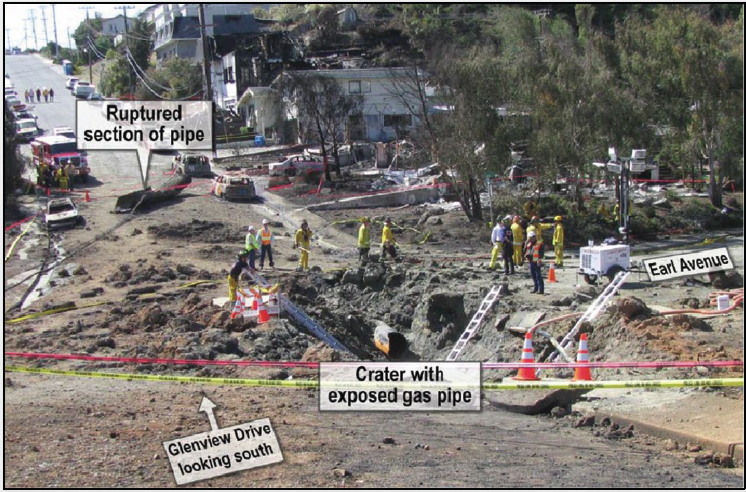
2010—San Bruno, California10 On September 9, 2010, at about 6:11 p.m., a 30-inch-diameter segment of a natural gas transmission pipeline that was installed in 1956 ruptured catastrophically in a suburban area of San Bruno, California. The section of pipe that ruptured was about 28 feet long and weighed about 3,000 pounds. That section was ejected from its original position and found 100 feet from the site of the rupture. The rupture resulted in a crater about 72 feet long and 26 feet wide. The released natural gas ignited almost immediately following the rupture. Eight individuals were fatally injured, another 10 were seriously injured, and 48 other individuals were treated for minor injuries. Blast injury was not identified as
___________________
9 NTSB. 1995. Texas Eastern Transmission Corporation Natural Gas Pipeline Explosion and Fire, Edison, New Jersey, March 23, 1994. Pipeline Accident Report NTSB/PAR-95/01. Washington, DC.
10 NTSB. 2011. Pacific Gas and Electric Company Natural Gas Transmission Pipeline Rupture and Fire, San Bruno, California, September 9, 2010. NTSB/PAR-11/01. Washington, DC.
the cause of death for any of the eight fatalities. For three of the fatalities, the medical examiner indicated that the cause was undetermined. For the five others, the cause of death was listed as fire, specifically “generalized conflagration effects.” One person survived for 18 days before succumbing to their injuries. The pipeline operator estimated that approximately 47.6 million standard cubic feet (scf) of gas were released.
Eight homes were destroyed and another 70 buildings were damaged. For about 50 hours following the initial rupture of the pipeline, 600 firefighting (including medical service) personnel and 325 law enforcement personnel responded. In total about 300 homes were evacuated. Figure 4-5, taken from NTSB’s report, shows the site of the incident after the fires were finally extinguished.
The cost of this incident as recorded in PHMSA’s incident database (“gtggungs2010toPresent” denotes all costs in 1984 dollars) is $305.9 million, or approximately $899.4 million in 2023 dollars. This cost figure does not include the $1.4 billion fine levied on the operator by the California Public Utilities Commission.
According to NTSB’s investigations, it took about 95 minutes from the time the pipeline first ruptured for qualified personnel to access and close manual valves located approximately 1.5 miles apart upstream and
SOURCE: NTSB. 2011. Pacific Gas and Electric Company Natural Gas Transmission Pipeline Rupture and Fire, San Bruno, California, September 9, 2010. NTSB/PAR-11/01. Washington, DC.
downstream of the rupture site. Provisions in 49 CFR Part 192.935(c) stipulate that operators are to conduct a risk analysis of their pipelines in Class 3 and 4 locations. Furthermore, the regulations require that when the operator determines that the installation of an RMV (remote control valve) is an efficient means to mitigate the consequence, they must install the RMV. As part of its investigations, NTSB found a 2006 memo that was prepared by Pacific Gas and Electric (PG&E) in respect to these provisions.11 The memo cited industry references that as most of the damage from a pipeline rupture occurs within 30 seconds of a release and ignition of the gas cloud, the use of an automatic or remote-control shutoff valve as a mitigation measure in an HCA would have “little or no effect on increasing human safety or protecting properties.” At one of NTSB’s investigative hearings, a PG&E manager acknowledged that the use of remote-control valves could have reduced the time taken to isolate the rupture by about 1 hour. As a result, NTSB concluded that the 95 minutes it took the operator to stop the flow of gas to the rupture site was excessive, contributed to the severity and extent of property damage, as well as presented an increased risk of injury to residents and emergency responders. The report went on to note that had the two isolation valves—located approximately 1.5 miles apart upstream and downstream of the rupture site—been outfitted with remote closure capability, prompt closure of the valves would have allowed emergency responders to enter the affected area sooner.
As a result of these findings, NTSB recommended (P-11-11) that PHMSA “amend Title 49 Code of Federal Regulations 192.935(c) to directly require that automatic shutoff valves or remote-control valves in high consequence areas and in Class 3 and 4 locations be installed and spaced at intervals that consider the factors listed in that regulation.”
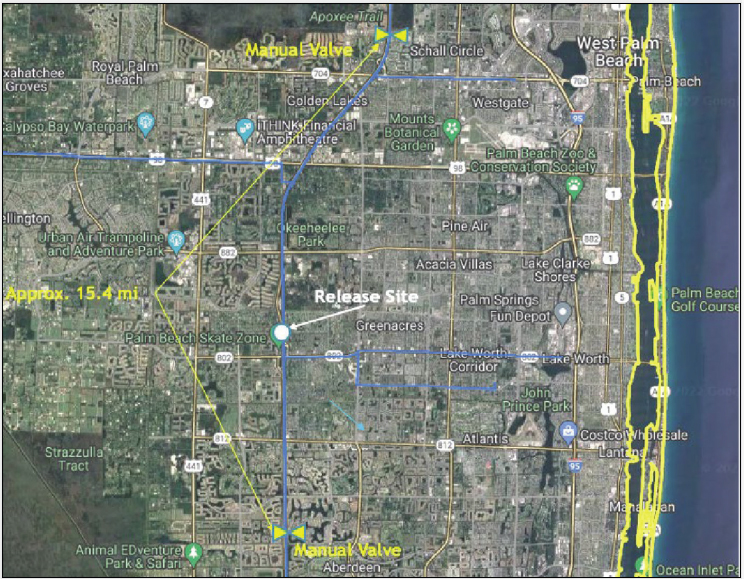
2020—West Palm Beach, Florida12 On September 24, 2020, at approximately 9:48 a.m., an 18-inch-diameter gas transmission pipeline that was installed in 1959 ruptured at the intersection of Lake Worth Avenue and Interstate-95 in the general area of West Palm Beach. The segment of the pipeline in which the rupture occurred follows the general path of Interstate-95 through this urbanized area. The released gas did not ignite, and there were no fatalities or injuries. Manual valves located approximately 15 miles apart were closed and the pipeline segment isolated at approximately 10:53 a.m. (i.e., approximately 65 minutes after the rupture occurred). The operator estimated the volume of natural gas released at 12 million scf. The operator estimated the total cost of the incident at approximately $1.7
___________________
11 NTSB public docket for NTSB/PAR-11/01.
12 PHMSA. Pipeline Incident Flagged Files: file title “gtggungs2010toPresent.”
million. Figure 4-6 shows the general environment surrounding the site of the release.
Incident History: Hazardous Liquid Pipelines
While PHMSA’s Pipeline Incident Flagged Files contain records of hazardous liquid pipeline incidents starting in 1986, it was not until 2002 that the forms contained fields for operators to indicate whether a release could affect an HCA. For this report, the only incidents included in the analysis are those involving system parts directly relevant to hazardous liquid pipelines and their valves.13 Incidents involving system parts separate from the
SOURCE: PHMSA. National Pipeline Mapping System, https://www.npms.phmsa.dot.gov.
___________________
13 Examples include pipes, valves, flange assemblies, repair sleeves or clamps, and welds/fusions. Items labeled as “other” were included, as most of these were related to the transmission pipeline itself and those related to pipeline facilities were negligible and did not impact the overall findings.
main pipeline or relating to equipment located at pipeline facilities, such as pumps or drain lines, were not included, as they do not pertain to the emergency shutoff valves relevant to this study. Figure 4-7 provides the number of hazardous liquid pipeline releases each year from 2002 through 2022.
The figure also shows the total installed miles of hazardous liquid pipeline segments that were reported as “could affect” an HCA in the event of a release starting in 2004, which was the first year that PHMSA required operators to report such data for the annual reports.
Over the period of 2004 to 2007, the reported miles of hazardous liquid pipelines in an HCA (or that could affect an HCA) in the event of a release averaged approximately 72,000 miles, and the number of reported incidents averaged approximately 32 per year. Starting in the 2007–2008 timeframe, the miles of pipeline segments involving an HCA increased by about one-third to approximately 95,500 miles in 2020. During this same
SOURCES: PHMSA. Pipeline Incident Flagged Files: file titles “hl2002to2009” and “hl2010toPresent”; and PHMSA. Annual Hazardous Liquid 2010 to Present files: file titles “annual_hazardous_liquid_2004_2009” and “annual-hazardous-liquid-2010-present.”
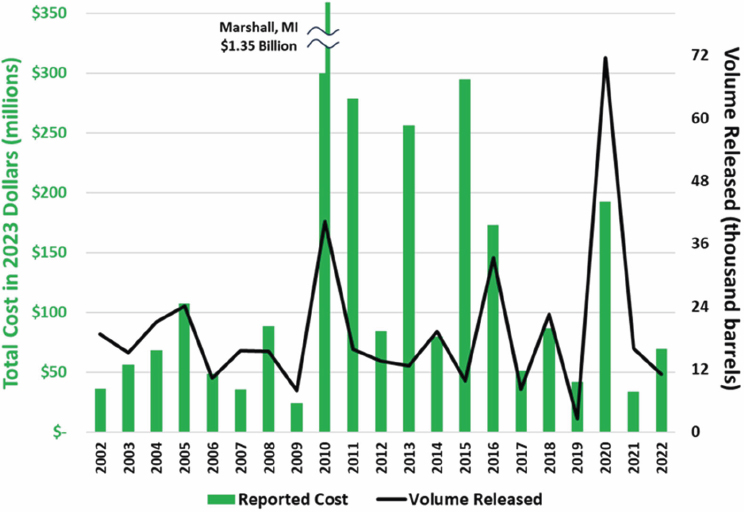
period, the number of reported incidents also increased but at a larger rate, averaging approximately 47 per year (i.e., about a 45% increase). Since 2017–2018, incidents reported per year have decreased, averaging about 38 per year over the period of 2017 to 2022 (i.e., a few incidents more than the 2004 to 2007 period but with about 20,000 additional pipeline miles). During 2020–2022, the reported miles of pipeline in an HCA decreased by about 5% (i.e., from a reported approximately 95,500 to 90,000 miles). Figure 4-8 provides the total volume of hazardous liquid released from pipeline segments in an HCA each year along with the total costs of those incidents in 2023 dollars.
The 2010 Marshall, Michigan, rupture of a 30-inch pipeline that released 840,000 gallons (approximately 20,000 barrels) of heavy crude oil into a wetland area and the Kalamazoo River dominates the reported incidents. A summary of the Marshall incident is provided below. In addition to this major incident, significant releases occurred in 2011, 2013, and 2015 that affected HCAs and resulted in cumulative costs exceeding $250 million in each of those 3 years.
SOURCE: PHMSA. Pipeline Incident Flagged Files: file titles “hl2002to2009” and “hl2010toPresent.”
There are five categories of HCAs that could be affected by a release of hazardous liquids: populated areas, including (1) high population areas (HPAs) or (2) other populated areas (OPAs); unusually sensitive areas, including (3) an ecological or environmental resource or sensitive area or (4) a drinking water resource (DW); and (5) commercially navigable waterways (CNWs).
In many of the reported incidents, the release was noted as potentially affecting multiple HCA types. As an example, reports have indicated that a single release could have affected an HPA, OPA, DW, and perhaps a CNW. A review of the incidents found that a primary factor impacting the overall costs associated with a hazardous liquid release was cleanup of the spill. Depending on the type of HCA into which the commodity was released, reported costs ranged from a low of $200 to more than $150,000 per barrel. This variation in cost is due in part to the type of commodity and the locations where the releases occurred and their associated cleanup complexities. In 2020, for instance, a total of 72,000 barrels of hazardous liquid released resulted in reported costs of around $192 million (i.e., an average cost of $2,666/barrel). Conversely, in 2015, a total of 9,700 barrels of released product resulted in reported costs around $295 million (i.e., an average cost of $30,400/barrel).
Since 2010, the form for reporting incidents of product released from hazardous liquid pipelines includes information on the type of valve used to isolate the failed segment and the length of the segment. Figure 4-9 presents the share of incidents reported from 2010 to 2022 that could affect an HCA for non-highly volatile liquids (non-HVLs) (e.g., crude oil and refined petroleum products) and HVLs where a valve was reported on the pipeline segment. The chart is categorized by the decade in which the pipeline was installed and includes a comparison with the overall percent of hazardous liquid (non-HVL) and HVL pipeline miles installed within that decade.
As depicted in Figure 4-9, the percent of releases occurring on segments of non-HVL hazardous liquid pipelines that were installed pre-1950 through 1979 (i.e., pipelines of an age of 40 or more years) is greater than the percent of miles of pipelines installed. Pre-1970 pipelines were installed prior to the introduction of the minimum federal safety standards for hazardous liquid pipelines. Some of the observed differences in the occurrence of incidents may arise from the fact that some of the pipelines installed from 1990 to 2022 were not in place for the full period of 2010 to 2022.
In contrast to gas transmission pipelines, remote-control shutoff valves were reported to have been used in approximately 34% and 21% of the incidents involving non-HVL hazardous liquid and HVL pipelines, respectively. A manual valve was reported to have been used in about 43% of
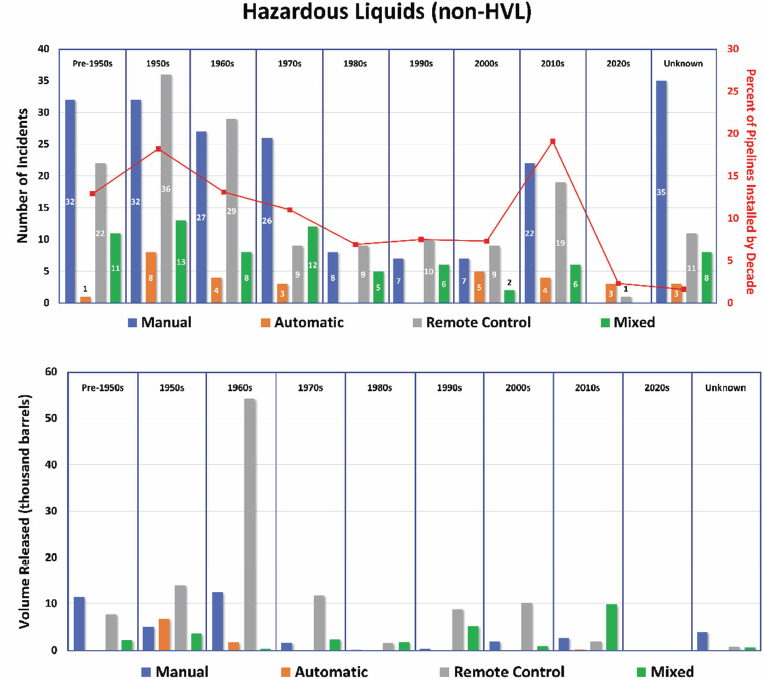
NOTE: “Mixed” indicates when the upstream and downstream valves were of different types.
SOURCES: PHMSA. Pipeline Incident Flagged Files, file title “hl2010toPresent”; and PHMSA. Annual Hazardous Liquid 2010 to Present, file title “annual_ hazardous_liquid_2010_present.”
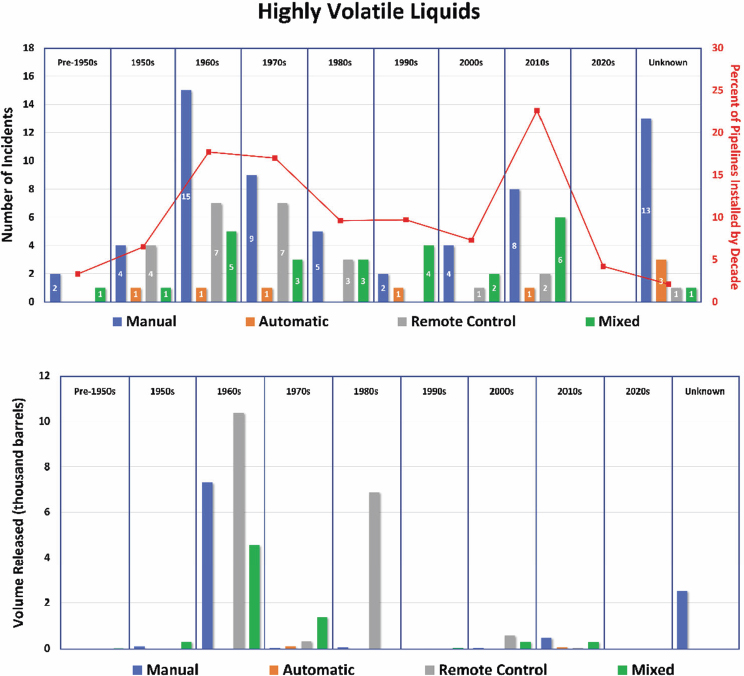
the incidents involving a release of a non-HVL hazardous liquid and in 51% of the incidents involving releases of an HVL. In addition, automatic shutoff valves were used in about 7% of non-HVL hazardous liquid incidents, while 16% of incidents involved the use of a mix of valves, where the upstream and downstream valves installed were of different types. For HVL pipeline incidents, automatic shutoff valves were used in about 7% of incidents, while 22% involved the use of multiple valve types. More than 90% of both the non-HVL hazardous liquid and HVL pipeline incidents with different types of upstream and downstream valves used a combination of a manual valve and an RMV (i.e., automatic and remote-control shutoff valve or check valve). Another contrast to what is observed for gas transmission pipelines, as shown in Figure 4-3, is that the volumes of commodity released during hazardous liquid pipeline incidents were 1.5 to 3
times higher for incidents involving the use of remote-control valves than incidents involving manual valves.
As noted in Chapter 3, PHMSA’s recent regulation for newly constructed and entirely replaced segments of pipelines established a requirement to install an RMV at a spacing not to exceed 15 miles for pipelines transmitting non-HVL hazardous liquids and 7.5 miles for those carrying HVLs. Table 4-3 provides a summary of the lengths of pipeline segment that were isolated due to a reported release in an HCA for the period 2010 to 2022.
In approximately 77% of the reported incidents involving the release of a non-HVL hazardous liquid, the length of the isolated pipeline segment was reported to be less than 15 miles, with an average length of 4.8 miles. In the other 23% of the incidents, the isolated pipeline segment was reported to be longer than 15 miles, with an average length of 33.8 miles (i.e., more than twice the distance required in the RMV regulations for newly constructed pipelines). For incidents involving a release of HVLs, in about 61% of the cases the length of the pipeline segment isolated was reported to be less than 7.5 miles, with an average spacing of 3.3 miles. For the other 39% of the cases involving a release of HVLs, the reported length exceeded 7.5 miles, with an average length of 19.8 miles (or approximately three times the distance specified in the new RMV regulations). Here again, the reason for these variances from the required spacing interval could not be determined from the incident reports.
Over the period of 2020 to 2021, operators submitted 30 reports of releases from pipeline segments in an HCA that included the time the release was first identified and the time the upstream valves were closed. Table 4-4
TABLE 4-3 Reported Number and Average Lengths of Hazardous Liquid Pipeline Segments Isolated from Releases, Incidents from 2010 to 2022
| No. of Reports, Segment Length <15 mi |
Avg. Segment Length <15 mi |
No. of Reports, Segment Length >15 mi |
Avg. Segment Length >15 mi |
|
|---|---|---|---|---|
| Crude Oil | 326 | 4.8 | 99 | 33.8 |
| No. of Reports, Segment Length <7.5 mi |
Avg. Segment Length <7.5 mi |
No. of Reports, Segment Length >7.5 mi |
Avg. Segment Length >7.5 mi |
|
| HVLs | 72 | 3.3 | 46 | 19.8 |
SOURCE: PHMSA. Pipeline Incident Flagged Files: file title “hl2010toPresent.”
TABLE 4-4 Overview of the Elapsed Times from First Identifying a Hazardous Liquid Release to Closing the Upstream Valve, Incidents from 2010 to 2022
| Upstream Valve Type | No. of Incidents | Avg. Time to Upstream Valve Closure (min.) | Range of Time to Valve Closure (min.) |
|---|---|---|---|
| Manual | 12 | 171 | 0–1,130 |
| Remote-Control | 15 | 30 | 1–125 |
| Automatic | 3 | 257 | 0–757 |
SOURCE: PHMSA. Pipeline Incident Flagged Files: file title “hl2010toPresent.”
provides a summary of the reported times by the type of upstream valve closed.
Based on what operators reported for the incidents in which remote-control valves were installed, the period of time from identification to closure of upstream and downstream valves was approximately one-fifth of the average elapsed time taken when compared with incidents where the upstream valve was manual. While automatic valves have a longer average time to valve closure, two instances were below 15 minutes while the third instance took more than 12 hours to close. Therefore, the average time to closure for automatic valves is likely skewed due to the low number of incident reports.
Notable Hazardous Liquid Pipeline Ruptures
The following three incidents investigated by NTSB and PHMSA involved the rupture of a hazardous liquid pipeline that had catastrophic consequences due to the commodity being released. In all three cases, valves upstream and downstream of the release site remained open for upward of 1 hour.
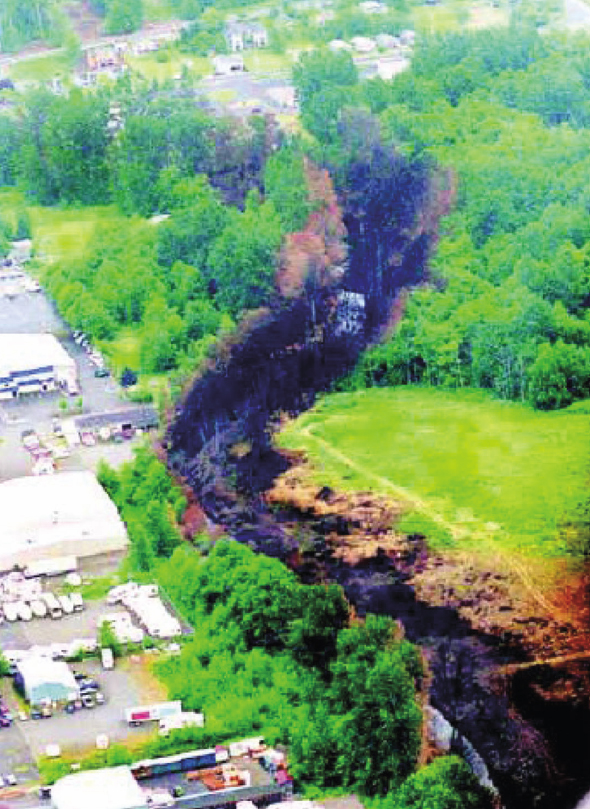
1999—Bellingham, Washington14
On June 10, 1999, at about 3:18 p.m., a 16-inch-diameter pipeline that was installed in 1966 ruptured and released about 237,000 gallons of gasoline into a creek that flowed through a park in Bellingham, Washington. Due to a variety of factors involving the pipeline’s supervisory control and data acquisition (SCADA) system, a command to shut down remotely controlled valves upstream and downstream of the rupture site was not initiated until approximately 4:32 p.m. (i.e.,
___________________
14 NTSB. 2002. Pipeline Rupture and Subsequent Fire in Bellingham, Washington, June 10, 1999. NTSB/PAR-02/02. Washington, DC.
about 74 minutes after pipeline rupture). At approximately 4:34 p.m. the SCADA system recorded the upstream and downstream valves to be closed.
About 1.5 hours after the rupture the gasoline ignited and burned approximately 1.5 miles along the creek. Two children and an adult were fatally injured by the fires. Eight additional injuries were recorded, and a single-family residence and the City of Bellingham’s water treatment plant were severely damaged. Other consequences of the release included 24 acres of land burned along the banks of Whatcom and Hannah Creeks. Figure 4-10 is an aerial view of the burned section of one of the creeks taken post-incident.
As part of the remediation efforts, water upstream of the release was diverted from Whatcom and Hannah Creeks to allow for more than 1,200 feet of creek bed and banks to be removed where gasoline had saturated 5 feet into the creek face. More than 9,500 cubic yards of gasoline-contaminated soils were removed from the creeks. In 2002, the operator estimated the damage to property at approximately $45 million ($76.4 million in 2023 dollars).
The two recommendations NTSB made to U.S. DOT were focused on providing guidance about the testing of new equipment prior to being put into use and that off-line workstations should be used when modifying and updating SCADA system software.
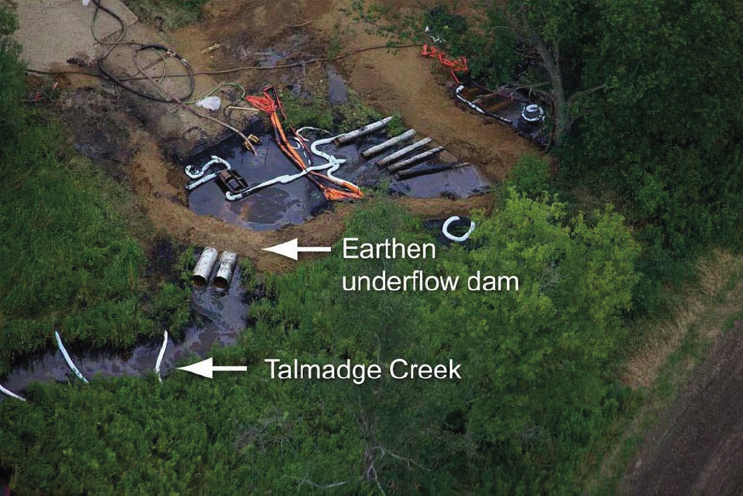
2010—Marshall, Michigan15
On July 25, 2010, at 5:58 p.m., a segment of a 30-inch-diameter pipeline that was installed in 1969 ruptured. The pipeline was transporting a viscous crude oil. The pipeline was fitted with various instruments that monitored the pressure and flow through the pipeline as well as remote-control valves located upstream and downstream of the rupture site, all of which were tied into the operator’s SCADA system. Following the rupture, the system sounded alarms indicative of a leak or rupture; however, because there had been a planned shutdown and restart of the pipeline, control room operators interpreted the alarms to be an artifact of the planned shutdown and restart of the pipeline. Consequently, even though the pipeline was shut down when the SCADA system alarmed, it was restarted twice; this accounted for approximately 80% of the estimated 20,000 barrels of crude oil that were released into the surrounding wetlands. Approximately 17 hours after the rupture and in response to receiving numerous calls about oil odors, the control center in Edmonton, Canada, began closing remotely controlled valves to isolate a nearly 3-mile section of the pipeline that contained the ruptured pipe. The remote-control
___________________
15 NTSB. 2012. Enbridge Incorporated Hazardous Liquid Pipeline Rupture and Release, Marshall, Michigan, July 25, 2010. NTSB/PAR–12/01. Washington, DC.
SOURCE: NTSB. 2012. Pipeline Rupture and Subsequent Fire in Bellingham, Washington, June 10, 1999. NTSB/PAR-02/02 PB2002-916502. Washington, DC.
shutoff valves were closed within a period of about 5 minutes once control room staff confirmed the alarms were the result of a rupture and not due to abnormal operating conditions.
The released crude oil saturated the wetlands area near the rupture and flowed into Talmadge Creek and then to the Kalamazoo River. Local residents self-evacuated, and about 320 individuals reported symptoms consistent with crude oil exposure. No fatalities were reported.
NTSB noted in its report that one factor contributing to the severity of the environmental consequences was “the failure of Enbridge’s control center staff to recognize abnormal conditions related to ruptures.”
The cost of this incident as reported in PHMSA’s “hl2010toPresent” file is approximately $1,350 million in 2023 dollars (PHMSA reports in 1984 dollars or $460 million). That equates to a cost of about $67,000 per barrel or $1,610 per gallon of crude released (2023 dollars). Figure 4-11 provides an aerial view of some of the efforts undertaken to contain the release of product and to protect the surrounding wetlands.
2011—Yellowstone River, Laurel Montana16
On July 1, 2011, at approximately 10:40 p.m., a failure occurred on a 12-inch-diameter pipeline that was installed in 1991. The failed segment of pipeline was reported to have released approximately 1,510 barrels of crude oil into the Yellowstone River, near Laurel, Montana. There were no reported fatalities or injuries related to the failure. Controllers shut down the pumps and valves at the beginning of the pipeline within 10 minutes of receiving alarms. However, a remote-control valve located just upstream of the Yellowstone River was not closed for an additional 46 minutes (i.e., a total of approximately 56 minutes) after the failure was first identified. PHMSA’s report notes that the 46 minutes taken by the control room supervisor and control room staff to analyze the various SCADA data and alarms that were received before closing the upstream valve allowed crude oil to drain from the failed section of the pipeline into the Yellowstone River, increasing the consequences of the failure.
The operator estimated the total combined cost of the release at $135 million (in 2011 dollars, or approximately $183.1 million in 2023 dollars). That equates to a cost of about $121,258 per barrel or $2,900 per gallon of crude oil released (2023 dollars).
SUMMARY POINTS
Key Factors Affecting Release Volumes and Consequence Severity Following a Rupture
- After rupture, the two factors associated with the pipeline design and installation that determine the volume of gas or hazardous liquid released from a pipeline are
___________________
16 U.S. DOT, PHMSA, Office of Pipeline Safety, Western Region. 2012. ExxonMobil Silvertip Pipeline Crude Oil Release into the Yellowstone River in Laurel, Montana, on July 1, 2011. October 30, 2012. See https://www.phmsa.dot.gov/sites/phmsa.dot.gov/files/docs/ExxonMobil_HL_MT_10-2012.pdf.
SOURCE: NTSB. 2012. Enbridge Incorporated Hazardous Liquid Pipeline Rupture and Release, Marshall, Michigan, July 25, 2010. NTSB/PAR-12/01 PB2012-916501. Washington, DC.
- the elapsed time from identifying and confirming the failure and the release of material to closing valves or using other means to shut in and isolate the failed segment; and
- the diameter and spacing or length between valves or whatever means is used to isolate a failed segment and, for gases, the pressure at which the pipeline was being operated.
- Factors that impact the magnitude of the consequences include
- the physical and chemical properties of the product released including its flammable and toxic properties; and
- the nature of the surrounding built and natural environment into which the materials are released.
Evidence of Valve Types and Closure Times from Incident Reports: Gas Transmission Pipelines
- There is no apparent downward trend in the number of reported incidents within Class 3 and 4 locations or HCAs after the introduction of IM rules in 2004. The lack of an observable trend may be attributable, in part, to the overall scatter in the number of incidents reported each year.
- Approximately 59% of reported incidents have occurred on segments within Class 3 and 4 locations that are on pipelines installed before 1970 (i.e., pipelines 50 or more years old), which aligns reasonably well with the fact that 54% of the overall network of gas transmission pipelines was installed before 1970.
- For incident reports in which operators indicated the types of valves used to isolate a failed pipeline segment, more than 80% of the cases used a manually operated valve. Furthermore, in about 87% of the cases the length of the pipeline segment isolated was less than the distance stipulated in federal regulations.
- Twenty-four incident reports contain information on the elapsed time from identifying a release to closing upstream and downstream valves. In 17 cases, the two valves used to isolate the pipeline were manual, while in 4 cases one manual valve was listed while the other was not reported. For these 21 cases, the average time taken to close the valves was 4 hours and 43 minutes. In two incidents, the valves were RMVs, with reported elapsed times from identification to closure of 17 and 50 minutes, respectively. In the other case, the upstream and downstream valves included a manual valve and a remote-control shutoff valve, and the operator reported a closure time of 130 minutes for the remote-control valve and just more than 4 hours for the manual valve.
Evidence of Valve Types and Closure Times from Incident Reports: Hazardous Liquid Pipelines
- There is no definitive trend of a reduction in the number of reported incidents that could affect an HCA after the introduction of IM rules in 2001. The lack of an observable trend may be attributable, in part, to the overall scatter in the number of incidents reported each year.
- For pipelines transporting non-HVL hazardous liquids, approximately 70% of the reported incidents in HCAs or that could affect an HCA were on pipelines installed before 1970. In contrast, less
- For pipelines transporting HVLs, approximately 59% of the reported releases occurred on pipelines installed before 1970, which aligns well with the fact that 58% of the overall network of pipelines transporting HVLs was installed before 1970.
- For incident reports in which operators indicated the types of valves used to isolate a failed pipeline segment, in approximately 34% of the cases the valve used was controlled remotely. Furthermore, in about 77% of the incidents that could affect an HCA, the length of the pipeline segment isolated was less than 15 miles, with an average length of about 5 miles.
- Thirty incident reports contain information on the elapsed time from identifying a release of hazardous liquid to closing upstream and downstream valves. In 12 incidents, the two valves closed to isolate the pipeline were manual, with an average elapsed time from identification to closure of 171 minutes. In 15 incidents, the valves were controlled remotely, and the average time from identification to closure was 30 minutes. In the other three incident reports, automatic shutoff valves activated and the closure times averaged 257 minutes, although two incidents were closed in less than 15 minutes while the third took more than 12 hours. Therefore, the average time to closure for automatic shutoff valves is likely skewed due to the low number of reports.
than 60% of the overall pipeline network was installed prior to 1970.
Evidence of Valve Types and Closure Times from Incident Reports: General
A review of the incident reports submitted by operators to PHMSA supports the view that RMVs can be an effective means of reducing the time between identifying the occurrence of a rupture and closing valves upstream and downstream from the rupture site to isolate the failed segment.
- For existing gas transmission pipelines, an extrapolation of incident data on the lengths of pipeline segments isolated after failure suggests that about 87% of the overall network of gas transmission pipelines in Class 3 and 4 locations is already fitted with isolation valves placed distances in accordance with the RMV requirement for newly constructed pipelines. Albeit based on the information submitted, more than 80% of these valves are now manually operated.
- For existing hazardous liquid pipelines, extrapolating from data provided on incident reports revealed the following:
- The proportion of the installation of automatic and remote-control shutoff valves to manual valves is higher, with approximately 40–50% of the valves being of an automatic or remote-control type and the remaining being operated manually.
- The spacing or distance between valves also appears to be, in general, in accordance with the provisions in the recently introduced rule for newly constructed pipelines (i.e., at a distance of 15 miles or less for non-HVL pipelines and 7.5 miles for HVL pipelines). Albeit due to the variety of HCAs defined in the regulations, the actual situation for hazardous liquid pipelines is more difficult to assess from incident records than that for gas transmission pipelines.
ADDENDUM: A LENS ON EQUITY IN DECISION MAKING
The study committee was charged with examining factors that should be considered when establishing regulatory requirements for the installation of RMVs on existing hazardous liquid and gas transmission pipelines. In addressing its charge, the study committee was cognizant of the broader government and societal interest in ensuring that the equity impacts are considered when making public policy choices. Indeed, since 1994, federal agencies have been required by executive order to make “achieving environmental justice part of [their] mission by identifying and addressing, as appropriate, disproportionately high and adverse human health or environmental effects of [their] programs, policies, and activities on minority populations and low-income populations.”17 Inasmuch as pipelines pose public safety, health, and environmental risks, the obligation to consider equity impacts can extend to PHMSA’s pipeline regulatory program.
While a growing body of research has focused on the safety, health, and environmental burdens on communities that are created by highways, airports, railroads, and other similarly conspicuous modes of transportation, long-distance pipelines have only recently begun to attract the attention of researchers. For instance, the study committee could not find many peer-reviewed studies that involve demographic analyses of people living and working in locations proximate to hazardous liquid and gas
___________________
17 Executive Order 12898. 1994. Federal Actions to Address Environmental Justice in Minority Populations and Low-Income Populations.
transmission pipelines. A recent study by Emanuel et al. (2021)18 found that gas transmission and gathering pipeline densities are positively correlated with higher levels of social vulnerability at the county level. Conversely, a recent study by Strube et al. (2021)19 found that gas transmission pipelines are less likely to be proposed and planned in census tracts with high proportions of Black and Hispanic residents and high poverty rates. The safe performance of pipelines in relation to the demographic characteristics of communities has likewise received limited attention in the peer-reviewed literature. Luna and Nicholas (2022)20 found that people of color and the poor in communities in Massachusetts are more likely to live in areas with a higher density of gas leaks; however, the study focused on leaks from gas distribution pipelines.
A possible reason for the paucity of equity-related studies of pipeline exposures is that detailed pipeline location data are considered security-sensitive, and thus made available on a restricted basis only.21 Moreover, PHMSA does not collect and publish data on the boundaries of Class 3 and 4 locations and some HCA types, such as drinking water HCAs; boundaries that, if known, could be mapped in relation to area populations and their socio-demographic patterns.
In not having a solid base of research to draw from, but interested in ensuring that equity is not neglected in the calculus of pipeline safety decision making, the committee asked the Pipeline Safety Trust (PST), a nonprofit organization devoted to pipeline safety issues, to design and conduct a geospatial analysis of hazardous liquid and gas transmission pipeline incidents involving HCAs and Class 3 and 4 locations. In the absence of data on pipeline network locations, these incident reports, which contain location coordinates, can provide an indication of where pipelines are known to be present (because an incident occurred there) to create some degree of risk exposure to people living and working in the vicinity. Data on the socio-demographics of the people living in the identified locations could then be compared with data on the socio-demographics of people in living in other locations where there were no incidents (and thus where pipelines may or may not be present).
___________________
18 Emanuel, R.E., M.A. Caretta, L. Rivers III, and P. Vasudevan. 2021. Natural gas gathering and transmission pipelines and social vulnerability in the United States. GeoHealth 5:e2021GH000442.
19 Strube, J., B.C. Thiede, and W. Ech. 2021. Proposed pipelines and environmental justice: Exploring the association between race, socioeconomic status, and pipeline proposals in the United States. Rural Sociology 86:647–672.
20 Luna, M., and D. Nicholas. 2022. An environmental justice analysis of distribution-level natural gas leaks in Massachusetts, USA. Energy Policy 162.
21 PHMSA. About the Pipeline Information Management Mapping Application. https://www.npms.phmsa.dot.gov/ApplyForPIMMAAccess.aspx.
PST was asked to perform the analysis by using geographic information system (GIS) tools to create a buffer, or potential impact area, around each reported incident location. Areas encompassed within the buffer could then be matched with community-level (block group) data on the population’s socio-demographic characteristics as collected by the U.S. Census Bureau. The socio-demographics of these communities could them be compared with the socio-demographics of populations in non-buffer areas. For more granularity, a similar analysis was requested for only the states of California and Texas. The data and methods used by PST for these geospatial analyses are summarized next.
It is important to emphasize that the committee’s purpose in requesting PST’s work was to bring attention to equity as a factor deserving consideration when designing, implementing, and assessing pipeline regulatory policy. The geospatial analysis is therefore described as an “illustrative and preliminary” exercise, not suitable for drawing conclusions about whether pipeline exposures and risks are distributed equitably or inequitably. Instead, the purpose of the exercise is to prompt more sophisticated and data-intensive follow-on work that can be helpful for policy making that considers equity. The addendum therefore ends by noting several of the limitations of the analysis that would need to be addressed to further this purpose.
Geospatial Analysis of Pipeline Incidents and Community Socio-Demographics: An Illustrative and Preliminary Exercise
Pipeline Incident Data
Data on hazardous liquid and gas transmission pipeline incidents from calendar years 2010 through March 31, 2023, were acquired from PHMSA’s online Flagged Incident Files, a publicly available source of information on reported pipeline incidents.22 The incident data were filtered for only onshore incidents involving pipelines at least 6 inches in diameter and an
___________________
22 The regulatory definition of a gas transmission incident is “[a]n event that involves a release of gas from a pipeline … and that results in … [a] death, or personal injury necessitating in-patient hospitalization, [e]stimated property damage of $122,000 or more … [or] an unintentional estimated gas loss of three million cubic feet or more” (49 CFR Part 191.3). The definition has not changed since 2010, except that the reporting threshold for property damage increased from $50,000 to $122,000 in 2021 and was tied to inflation. The definition of a hazardous liquid incident during the period relevant to the study is “a release of the hazardous liquid … transported resulting in … [e]xplosion or fire not intentionally set by the operator[;] [r]elease of 5 gallons (19 liters) or more of hazardous liquid [with an exception for pipeline maintenance activities] …; [d]eath of any person; [p]ersonal injury necessitating hospitalization; [or] [e]stimated property damage … exceeding $50,000” (49 CFR Part 195.50).
additional filter was applied to focus on incidents reported to have occurred in HCAs and Class 3 and 4 locations. Hazardous liquid pipeline incidents were further divided to distinguish among incidents involving HVL and non-HVL pipelines. The filtered incident counts at the national level are shown in Table 4A-1.
For a more granular view, the incident data were filtered further to include only incidents in the nation’s two most populous states, California and Texas.23 These state-level results are displayed in Table 4A-2. Because of the small number of incidents, HVL pipeline incidents were not separated from hazardous liquid pipelines.
Community Socio-Demographic Data
To identify communities affected by pipeline incidents (and thus known to be near pipelines), a GIS buffer was built around the coordinates of each incident. The buffer diameter, developed by consulting referenced studies was set at 1,320 feet for gas pipeline incidents and 1,085 feet for hazardous liquid pipeline incidents.24 Socio-demographic data on economic status (household income and unemployment rate) and race and ethnicity were acquired from the U.S. Census Bureau’s American Community Survey for 2021 (ACS 5-year estimates) using block group data.25 A census block
TABLE 4A-1 National Summary of Gas, Hazardous Liquid, and HVL Transmission Pipeline Incidents in HCAs and Class 3 and 4 Locations, January 2010–March 2023
| Type of System | Incidents |
|---|---|
| Gas Transmission | 76 |
| Hazardous Liquid (non-HVL) | 357 |
| HVL | 58 |
SOURCE: PHMSA. Pipeline Incident Flagged Files: file title “hl2010toPresent.”
___________________
23 Texas also has the most hazardous liquid and gas transmission pipeline mileage of all the states.
24 For reference to hazardous liquid and gas releases, PST consulted a 2012 report by Oak Ridge National Laboratory (ORNL), Studies for the Requirements of Automatic and Remotely Controlled Shutoff Valves on Hazardous Liquids and Natural Gas Pipelines with Respect to Public and Environmental Safety, and accident reports published by NTSB and cited in Chapters 1 and 4.
25 Raw census data and incident data were aggregated by each desired geography using the R statistical software package “tidyverse,” version 2.0.0. For “tidyverse” documentation, see https://cran.r-project.org/web/packages/tidyverse/tidyverse.pdf.
TABLE 4A-2 State-Level: California and Texas Hazardous Liquid and Gas Transmission Pipeline Incidents in HCAs and Class 3 and 4 Locations, January 2010–March 2023
| Type of System | California Incidents | Texas Incidents |
|---|---|---|
| Gas Transmission | 13 | 13 |
| Hazardous Liquid (including HVLs) | 38 | 95 |
SOURCE: PHMSA. Pipeline Incident Flagged Files: file title “hl2010toPresent.”
group, typically having populations of 600 to 3,000 people, is the smallest geographical unit containing household socio-demographic sampling data.
The census block groups that intersected with the buffers were defined as the affected block groups, or “affected communities.” Household socio-demographic characteristics of these affected communities were then compared against all other block groups in the relevant larger jurisdiction (i.e., United States, Texas, and California).
Results and Limitations
The outcomes of the comparisons are shown in Tables 4A-3 (national level), 4A-4 (Texas), and 4A-5 (California). Because the analyses were undertaken for only illustrative purposes, the results in the tables are not assessed and should not be used to form conclusions. There are many limitations to the analytic methods employed that would need to be improved through the marshaling of more data, testing of assumptions, and the use of more sophisticated statistical methods. For instance, if pipeline incidents must be used to identify known pipeline locations (in the absence of network location coordinates), it will be necessary to ensure that the socio-demographic data used are aligned with the time period of the recorded incidents to account for the social, economic, and demographic changes that will occur in communities over time.
Likewise, the diameters used to create buffers would need to be established in a more systematic manner to have confidence that they do not overestimate or underestimate the populations exposed to the risk of a pipeline incident. Ideally the analyses could be performed in a more comprehensive manner by using pipeline system location data rather than the incident data, because there are certain to be many communities located near pipelines that have not experienced an incident but are nevertheless exposed to risk.
It is important to reiterate that the analyses in this addendum were not undertaken to reach conclusions about pipeline risk exposure and equity, but rather to call attention to the importance of informing public policy choices through equity-oriented analyses and by exploring the methods for doing so.
TABLE 4A-3 Comparison of Socio-Demographics of Communities Affected by a Transmission Pipeline Incident and All Other Communities in the United States
| Gas Pipeline Incidents | Hazardous Liquid Pipeline Incidents | HVL Pipeline Incidents | |||||
|---|---|---|---|---|---|---|---|
| Socio-Demographic Indicator | All Other | Affected | Difference | Affected | Difference | Affected | Difference |
| Percent of annual household income <$20,000 | 13.5 | 13.8 | +0.3 | 11.4 | –2.1 | 10.7 | –2.8 |
| Percent of annual household income >$150,000 | 17.1 | 20.1 | +3.0 | 18.1 | +1.0 | 16.9 | –0.2 |
| Unemployment rate | 5.5 | 6.2 | +0.7 | 5.2 | –0.3 | 6.0 | +0.5 |
| Percent White | 68.0 | 64.4 | –3.6 | 68.1 | +0.1 | 77.3 | +9.3 |
| Percent Black | 12.5 | 11.3 | –1.2 | 11.5 | –1.0 | 11.0 | –1.5 |
| Percent Asian | 5.6 | 6.9 | +1.3 | 5.1 | –0.5 | 1.4 | –4.2 |
| Percent Hispanic or Latino | 19.2 | 24.7 | +5.5 | 23.0 | +3.8 | 16.8 | –2.4 |
| Percent American Indian or Alaska Native | 0.8 | 1.0 | +0.2 | 1.0 | +0.2 | 0.7 | –0.1 |
TABLE 4A-4 Comparison of the Socio-Demographics of Communities Affected by a Transmission Pipeline Incident and All Other Communities in the State of Texas
| Gas Pipeline Incidents | Hazardous Liquid Pipeline Incidents | ||||
|---|---|---|---|---|---|
| Socio-Demographic Indicator | All Other | Affected | Difference | Affected | Difference |
| Percent of annual household income <$20,000 | 13.1 | 18.5 | +5.4 | 11.3 | –1.8 |
| Percent of annual household income >$150,000 | 16.4 | 9.9 | –6.5 | 19.8 | +3.4 |
| Unemployment rate | 5.3 | 5.4 | –0.1 | 6.3 | +1.0 |
| Percent White | 64.3 | 72.4 | +8.1 | 71.9 | +7.6 |
| Percent Black | 12.1 | 4.6 | –7.5 | 10.6 | –1.5 |
| Percent Asian | 5.0 | 0.6 | –4.4 | 2.6 | –2.4 |
| Percent Hispanic or Latino | 39.8 | 56.3 | +16.5 | 33.1 | –6.7 |
| Percent American Indian or Alaska Native | 0.5 | 0.6 | +0.1 | 0.2 | –0.3 |
TABLE 4A-5 Comparison of the Socio-Demographics of Communities Affected by a Transmission Pipeline Incident and All Other Communities in the State of California
| Gas Pipeline Incidents | Hazardous Liquid Pipeline Incidents | ||||
|---|---|---|---|---|---|
| Socio-Demographic Indicator | All Other | Affected | Difference | Affected | Difference |
| Percent of annual household income <$20,000 | 11.2 | 11.1 | –0.1 | 9.2 | –2.0 |
| Percent of annual household income >$150,000 | 25.1 | 26.6 | +1.5 | 23.3 | –1.8 |
| Unemployment rate | 6.5 | 7.5 | +1.0 | 6.4 | –0.1 |
| Percent White | 52.1 | 54.3 | +2.2 | 49.1 | –3.0 |
| Percent Black | 5.7 | 4.1 | –1.6 | 8.0 | +2.3 |
| Percent Asian | 14.9 | 18.5 | +3.6 | 13.5 | –1.4 |
| Percent Hispanic or Latino | 39.5 | 29.3 | –10.2 | 48.7 | +9.2 |
| Percent American Indian or Alaska Native | 0.9 | 0.8 | –0.1 | 0.9 | 0 |
This page intentionally left blank.


