
3
Detection of Evidence of Earlier Life
The search for evidence of former life, assumed to be carbon-based and microbial, seems certain to be a time-consuming, needle-in-a-haystack hunt. The first task should be to identify the haystack: to detect and profile the distribution of carbonaceous (“organic”) matter in a representative subset of the total sample. Organic matter is a signature general to known living systems whether they be viable, recently dead, or fossil. The failure of the Viking gas chromatography-mass spectrometry experiment (detection limits of 1 part in 106 to 109) to detect organic material in martian surface and subsurface materials at two landing sites dealt a severe blow to the prospect of life on Mars.1 Because the infall of carbonaceous chondrite meteorites, if nothing else, should build up a finite level of organic compounds in the martian soil, it seems likely that such compounds are systematically destroyed in the martian environment, perhaps by ultraviolet radiation and/or an oxidizing agent such as hydrogen peroxide or hydroxyl radicals in the atmosphere,2 although they may survive inside sufficiently large, impermeable rock fragments.
The search for organic carbon should be accomplished early during sample processing, by surveying a sterilized representative subset of the sample outside of the quarantine facility. Such a survey will require use of extensive laboratory facilities that are stringently clean3 both of biological and organic terrestrial contaminants. Similarly specialized facilities and appropriate precautions to mitigate contamination will be required for all other paleobiological studies. Because of these requirements, both the initial assay (of a sterilized subset of the sample) and all subsequent searches for evidence of fossil life should be carried out in laboratories designed for and experienced in such studies.
Concurrent experiments to detect viable (including potentially biohazardous) and recently dead organisms, using the techniques discussed in Chapter 2, will depend critically on the abundance and distribution of organic
carbon in the samples. These data will also support all other paleobiological investigations as well as the design of follow-on sample return missions.4 If carbonaceous material is shown to be present, subsequent detailed studies will be required to establish whether it is indigenous to the sample (as opposed to being terrestrial contamination, introduced during sample collection and/or processing) and whether it is biogenic (rather than being of nonbiological origin, implanted by impacting meteoroids or synthesized in the martian environment). Like the initial assay, these and all other paleobiological studies should be carried out in existing laboratories equipped for and experienced in such research.
Evidence of earlier life can take the form of characteristic patterns of organic compounds and isotopes or morphological fossils (both individual microorganisms and fragments of finely laminated biosedimentary structures, like stromatolites). Although these categories of evidence are very different, both must meet the following tests to constitute strong evidence.5,6
-
Indigenousness. To avoid the mistake of identifying contaminating materials introduced during sample collecting and/or terrestrial processing as martian life or evidence of it, the property studied must be shown to be indigenous to the martian sample. Materials present in high abundance in the sample, and millimeter-sized or larger structures (perhaps such as grains that contain stromatolithic laminae and cellular microfossils), should pose little problem in this regard; establishment of the indigenity of materials detected in trace amounts and of minute structures, especially if rare (including microbe-sized bodies), may be difficult. Stringent precautions should be taken to avoid both biological and organic contamination of the sample during both collection and processing.
-
Biogenicity. The supposed evidence must be demonstrably biological in origin. Criteria currently used in studies of Precambrian paleobiology7 should prove particularly applicable to this purpose. To obtain data that will permit use of these criteria, the analyses should be designed to document multiple properties that are uniquely biological, depending on the nature of the evidence and its fidelity of preservation, ranging from biochemical properties (such as the presence of limited suites of biologically selected classes of stereoisomers, monomers, polymers, and organic-inorganic isotopic compositions), to organismal (cellularity, reproduction, heritable morphologic variability) and ecological properties (behavioral interactions and populational and community structures).
BIOGEOCHEMICAL PATTERNS
On Earth, early life left its geochemical mark in several ways.8-10 The chemically variable, macromolecular carbon-rich kerogen of ancient sediments was derived principally from the “coalified,” geochemically altered
|
Box 3.1 Gas Chromatography–Mass Spectrometry Organic materials usually are mixtures of compounds. Gas chromatography-mass spectrometry (GC-MS) is a technique that allows certain of the compounds in organic mixtures (relatively volatile, nonpolar compounds such as biological lipids) to be separated and identified. It employs an instrument that combines a gas chromatograph with a mass spectrometer. The gas chromatograph separates compounds and sends them in sequence to the mass spectrometer. The mass spectrometer provides information that can either identify the compound outright or at least provide definitive information on its composition. The gas chromatograph includes a carrier-gas supply, an inlet system, and a chromatographic column. The carrier gas, usually helium, flows continuously through the inlet system and the chromatographic column. The unknown sample is flash-vaporized in the inlet system and carried into the column. The column is a long, thin tube; its inner wall is coated with an organic gum in which the vaporized compounds tend to dissolve. Thus they travel less rapidly than the carrier gas and become separated according to their differing tendencies to dissolve in the gum. Individual compounds emerge from the end of the column spaced in time, in pulses 3 to 10 seconds wide. The temperature of the chromatographic column is adjusted so that a single chromatographic run can last 1 hour or more. Hundreds of compounds can be separated. As gas containing each compound exits the gas chromatograph, that compound is separated from the carrier gas and introduced into the mass spectrometer. There an electron beam ionizes the gas molecules, and electrostatic fields inject a beam of the ions into an oscillating electric field. The properties of that field are varied so that molecules with different masses are sequentially directed to a measurement system. This process produces a mass spectrum, a plot that displays the relative abundances of molecules having a range of masses. Interpretation of these spectra in terms of the composition of the organic mixture introduced into the GC-MS is not completely straightforward, because compounds in the mixture are to some degree damaged (fragmented) by the process of ionization in the mass spectrometer and because the spectra of compounds can overlap, creating mixed signals that cannot be separated without further evidence. |
remains of cell walls of living systems. Enzyme-driven metabolic processes can create characteristic patterns of isotopic abundances, affecting in particular the ranges of compositions of the stable isotopes of carbon, sulfur, nitrogen, hydrogen, and possibly iron. Additionally, life leaves biomarkers (from “biological marker compounds”) in the rocks, distinctive geochemically altered biomolecules such as various hydrocarbons, fatty acids, amino acids, and porphyrins that by their presence provide evidence of the existence of particular biosynthetic pathways and the biological groups in which they occur.
Martian samples that contain detectable levels of organic carbon may contain enough material to permit further analysis of individual organic compounds. This is generally accomplished by gas chromatography-mass spectroscopy (GC-MS; see Box 3.1) techniques. The products of such analyses are both chromatograms showing the relative abundances of organic compounds and mass spectra that can aid in the identification of the compounds. The shape of a chromatogram with peaks for many compounds can be used to judge whether the organic compounds were generated abiotically or through known biological synthesis pathways. Abiotic synthesis of
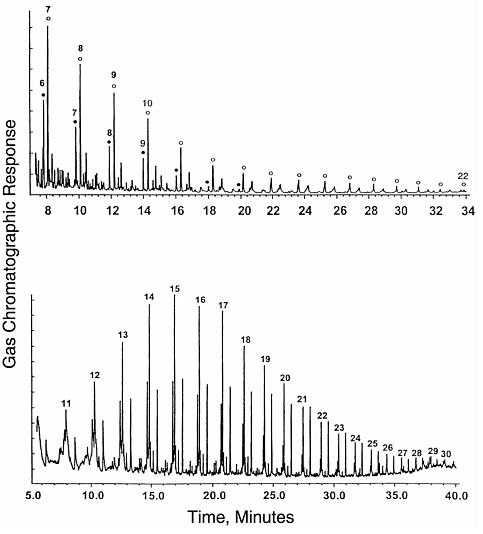
FIGURE 3.1 Gas chromatograms of compounds formed by an abiotic process, Fischer-Tropsch-type synthesis from formic acid solutions. Top, total ion chromatogram for the CH2Cl2 extract after derivitization of acids and alcohols (acids form the peaks under filled circles; alcohols, under open circles). Bottom, underivitized extract showing dominant peaks for straight-chain alkanes and alkenes. Numbers show the quantity of carbon atoms in each compound. The distribution of peaks forms a smooth envelope in both cases. SOURCE: Reprinted with permission from McCollom, T.M., Ritter, G., and Simoneit, B.R.T. 1999. Lipid synthesis under hydrothermal conditions by Fischer-Tropsch-type reactions. Origins of Life and Evolution of the Biosphere 29:153.
organic compounds tends to generate very wide varieties of products leading to smooth envelopes of peaks in a chromatogram, as shown by the examples in Figure 3.1. These chromatograms show the distribution of hydrocarbons, alcohols, organic acids, and other compounds generated from formic acid in hydrothermal synthesis experiments.11 The peaks are labeled with the number of carbon atoms in each molecule.
It can be seen in Figure 3.1 that the distribution of peaks with mass is extremely smooth, showing no particular preference for any individual molecules. In contrast, chromatograms of biological debris are not nearly as smooth,
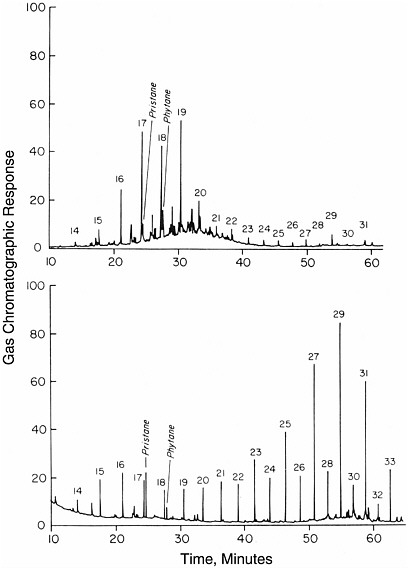
FIGURE 3.2 Gas chromatograms of compounds formed by biological processes; shown are total hydrocarbon extracts from surface marine sediments in the Guaymas Basin (above) and the Escanaba Trough (below). Peaks representing alkanes are identified by numbers representing the number of carbon atoms they contain. In contrast to the chromatograms of Figure 3.1, the distribution of peak heights is uneven. SOURCE: Reprinted with permission from Simoneit, B.R.T. 1993. Hydrothermal alteration of organic matter in marine and terrestrial systems, pp. 397-418 in Organic Geochemistry—Principles and Applications, M.H. Engel and S.A. Macko, eds. Plenum Press, New York.
and they generally contain individual peaks that stand out above the rest. Examples are shown in Figure 3.2, two seafloor sediment hydrocarbon samples that yielded more selective distributions. Compounds with odd numbers of carbon atoms often are more abundant than adjacent compounds with even numbers of carbon atoms. Enhancement in the concentration of individual compounds is characteristic of enzymatic processes that generate certain compounds preferentially.
Patterns must be assessed and interpreted very carefully. Abiotic processes can alter biological products so that their biological characteristics are practically invisible, and a succession of differing abiotic processes might produce a mixture of organic compounds with some “biological” characteristics. As a means of examining mixtures of organic compounds, however, the approach has several fundamental strengths. It is general and can be
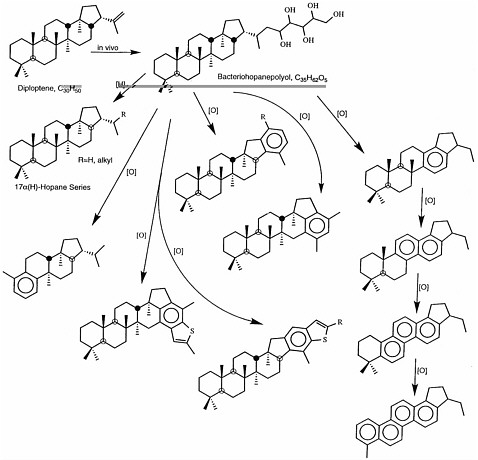
FIGURE 3.3 Alteration scheme for the hopanoid family of compounds, which are found in geologic samples. Hopanoids are the most extensively documented biomarkers for bacteria. The two molecules shown at the top, diploptene and bacteriohopanepolyol, are produced in bacterial cells. Reduction of bacteriohopanepolyol (arrow labeled [H]) produces a series of hopanes, and oxidation (arrows labeled [O]) leads to the series of partially aromatic compounds shown, all of which can be found in extracts of geologic material. SOURCE: Reprinted with permission from Simoneit, B.R.T., Summons, R.E., and Jahnke, L.L. 1998. Biomarkers as tracers for life on early Earth and Mars. Origins of Life and Evolution of the Biosphere 28:475-483.
applied to any collection of molecular products. It can be extended or deepened in proportion to the detail available and has the potential to use all of the information provided by the analytical data. And it can be made multidimensional, with patterns of order being searched for in isotopic distributions, in relative abundances of structurally related compounds, and in distributions of structural types.
Biomarker compounds are derived from biochemical precursor molecules through alteration reactions that include oxidation, reduction, and hydrolysis. An example of biomarkers indicative of a bacterial source is shown in Figure 3.3. Note that some parts of the biological molecule are easily (and rapidly) transformed or lost, while other parts exhibit remarkable resistance to geochemical alteration. As an example, the compound in the lower right corner of Figure 3.3 maintains several major structural features of its biological precursor despite the loss of most of a major side chain, several methyl groups, and more than half of the hydrogen atoms originally attached to the multi-ring structure. Although the presence of this individual compound might be enough to deduce a biological origin, that deduction is strengthened if a series of related compounds is found in a sample. This is often
the case for biomarkers in terrestrial samples, and the presence and distribution of sets of biomarkers compounds are being exploited to greatly expand upon the fossil record of life on Earth.12-14
This point can be illustrated with some recent examples of the use of biomarkers to expand on the fossil record. Fossil diatoms are found in rocks of Jurassic age (144 to 208 million years old) and younger, and there is a strong correlation between ratios of certain cholestane biomarkers, rocks of the appropriate age, and paleolatitude, as documented by Holba et al.15 These ratios can be used in samples where microscopic identification of diatoms is impossible because the biological opaline silica that is characteristic of diatoms has been converted to cristobalite. However, the link between diatoms and these biomarkers is largely circumstantial, and the authors report traces of these compounds in samples that predate the Jurassic. Stronger links are established between oleonane and flowering plants16 and between 24-isopropyl cholestane and sponges,17 and both of these compounds have been used to expand upon the fossil record. Similarly, the association of certain dinosteroids with dinoflagellates not only correlates closely with the presence of dinoflagellate fossils in Mesozoic rocks, but also has raised intriguing questions about the ancestry of these organisms, as these compounds have been extracted from Paleozoic and Precambrian rocks that are much older than any known dinoflagellate fossils.18,19 More recent work has confirmed the presence of dinoflagellate ancestors as early as the Early Cambrian (~570 million years ago), which nearly doubles the known period in which these eukarya have existed.20
In another recent breakthrough driven by biomarker analysis, Brocks and co-workers report evidence of steranes,21 which are indicative of eukaryotic organisms, in 2.7 billion-year-old shales from Australia. Not only does this study demonstrate that biomarkers can survive for great lengths of time under geologically gentle conditions, but this evidence also strongly suggests that eukaryotic organisms were present 500 million to 1 billion years earlier than the fossil record indicates. These same samples contain hopanes that are characteristic of cyanobacteria, which shows that bacterial oxygenic photosynthesis evolved well before there is evidence in the rock record for a highly oxidized atmosphere. The connection between cyanobacteria and fossil hopanoids has been thoroughly examined by Summons and co-workers,22 who extended the record of these compounds to ~2.5 billion years ago with samples of the Mt. McRae shale from the Hammersly basin of Australia. These studies have focused on samples that are well preserved and of low metamorphic grade, with the hope of more easily finding biomarkers that might otherwise be altered or destroyed by high temperatures. Another recent development by
|
Box 3.2 Carbon Isotopes Carbon occurs as three isotopes: 12C (98.9% abundance), 13C (1.1%), and 14C (a transient radioactive isotope created by cosmic rays). These are only average abundances; natural processes tend to fractionate 13C from 12C in forming particular organisms and minerals from their surroundings. The fractionation arises because atoms of 13C tend to react slightly more slowly than those of 12C. Analysis of a succession of reactants and products thus commonly reveals declining relative abundances of 13C. The magnitude of the decline, or “fractionation,” can vary widely. The conversion of carbon dioxide to organic material by plants provides a notable example of isotopic fractionation. Plant biomass in Earth’s oceans is depleted in 13C by 2 to 3% relative to carbonate minerals that form there. Land plants are depleted in 13C by about 2% relative to CO2 in the terrestrial atmosphere. These small differences are easily detected in samples by mass spectrometric analysis. Isotope effects can be associated with both biological and nonbiological processes. Isotopic fractionations are, therefore, not a definitive indicator of life. Systematic interpretation of isotopic variations can, however, indicate relationships between reactants and products and provide evidence for or against biological processes. |
Price and co-workers holds hope for even highly metamorphosed sediments.23 These authors used a new extraction protocol to obtain trace amounts of organic compounds and report the extraction of cholestanes, tricyclic terpanes, hopanes, and steroids from anthracites, meta-anthracites, black shales, and carbonaceous schists that have reached temperatures from 200 to 450 ºC during hydrothermal alteration and metamorphism. These compounds resemble many found in hydrothermally generated petroleum from sedimented ridge systems.24
Studies of terrestrial biomarkers in petroleum, rock, sediment, water, plant, animal, microbe, and atmospheric particulate samples have identified the diverse sources of organic compounds that can be present in a sample from Earth’s surface. As a consequence, it is increasingly possible to identify terrestrial organic contaminants, and to fingerprint their sources. For example, chromatograms of organic compounds extracted from atmospheric particulates filtered from air in diverse locations reveal the presence of compounds derived from the burning of fossil fuels, biomass burning, cigarette smoke, cooking, and releases from industrial processes and natural vegetation. Individual peaks in chromatograms can be identified in catalogues of peaks of known compounds from known sources. These advances will greatly increase the probability of differentiating terrestrial contamination from the signal of indigenous organic compounds in samples from Mars.25
If organic carbon is found in martian samples, its isotopic composition can be informative (see Box 3.2). Dissimilarity between the isotopic compositions of martian and terrestrial organic carbon would demonstrate that the martian carbon analyzed is indigenous to that planet, possibly the product of an extraterrestrial life process. Similarity between the isotopic compositions of organic carbon from the two planets could mean that the martian carbon analyzed is actually terrestrial contamination, or it could mean that fractionation processes operate in the same way on both planets.
MORPHOLOGICAL FOSSILS
Fossils of ancient life are found in terrestrial rocks, as individual organisms or in colonies (Figure 3.4).26-28 They may be cellular and three-dimensional in form (as in the case of microbes preserved by petrifaction), or they may be preserved as flattened compressions. Some are carbonaceous in character, whereas others are mineralic (e.g., calcareous or siliceous shells, or forms in which new minerals have replaced the original organisms). Intact whole bodies may be present (as for many fossil microbes), or parts thereof (such as skeletal fragments, spicules, and disarticulated cells). A chronology of the geologic record, and the positions of important fossils in it, are reviewed in Figure 3.5.
Two techniques have been important in the detection of terrestrial microfossils: the use of acid macerations and petrographic thin sections (see caption for Figure 1.2 in Chapter 1). Transmission and scanning electron microscopy (TEM, SEM) have been used to characterize microfossils previously detected in macerations or thin sections, but they have not proven to be reliable detection techniques.
Maceration, the easier and faster of the two detection techniques, refers to the dissolution of a rock in mineral acid (for example, hydrochloric acid for limestones, hydrofluoric acid for siliceous cherts and siltstones). Because of their coaly composition, organic-walled microfossils survive, apparently unscathed. Abundant fossils are concentrated in the resulting sludge-like acid-resistant residue, which can be slurried onto a microscope slide for study. Unfortunately, this technique is vulnerable to error-causing contamination.
In petrographic thin sections (Figure 3.6), fossils are detected encased within the rock, so indigenity can be demonstrated and the possibility of laboratory contamination can be ruled out.29 Disadvantages of thin-sectioning are that special equipment is needed for preparation and the study of sections is time-consuming. However, the fact that fragile fossils are spared chemical maceration or mechanical crushing, and the assurance that external contamination has been avoided, justify use of the technique.
Transmission electron microscopic studies of terrestrial microfossils have involved examinations either of organic-walled fossils freed from their rock matrix by acid maceration, embedded in epoxy resin, and sectioned using a diamond knife; or of fossil-like objects detected in plastic (Formvar) surface replicas of polished and etched petrographic thin sections. Transmission electron microscopy of macerated microfossils has been used to elucidate the structure of cell walls, membranes, and internal organic contents.30 But because macerations are susceptible to contamination, such studies are useful only for fossils previously detected in petrographic thin sections. Similarly, contamination by nonindigenous particles presents a problem for studies of surface replicas, as does the introduction of nonbiogenic artifacts of a variety of types (blisters, bubbles, strands of Formvar, and so forth) that in the 1960s and early 1970s were repeatedly identified mistakenly as “ancient fossils.”31
Preparation of samples for study by SEM is simpler than for TEM and the results obtained are generally easier to interpret. But, as in TEM studies, establishment of the indigenity of the objects detected and their syngeneticity with a primary mineral phase is not straightforward. And, also as in TEM studies, fossil-like artifacts have been misinterpreted by SEM, especially in rock samples where mineralic morphology has been altered and smoothed to “biologic-like” shapes by acid-etching.32
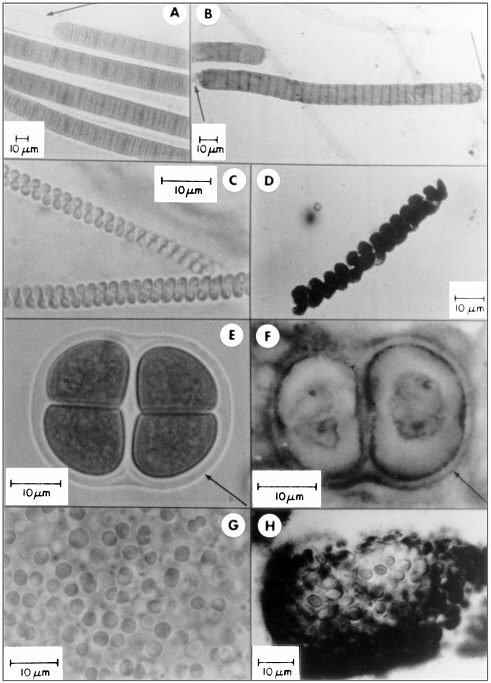
FIGURE 3.4 A comparison of living cyanobacteria with their fossil counterparts. A, C, E, and G show living bacteria from stromatolitic microbial mats in Baja California, Mexico. B, D, F, and H show fossils of comparable bacteria from terrestrial rocks of Precambrian age, 0.8 to 2.1 billion years old. SOURCE: Figure from Schopf, J.W. 1984. Disparate rates, differing fates: Tempo and mode of evolution changed from the Precambrian to the Phanerozoic. Proc. Natl. Acad. Sci. USA 91:6735.
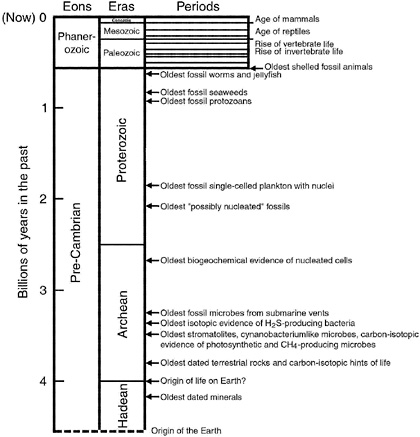
FIGURE 3.5 A summary of the names given to various intervals of geologic time on Earth, and important landmarks in the evolution of life on our planet. (Different time intervals and names are used in characterizing Mars and other planets.) Only the Phanerozoic Eon has been subdivided into periods. These are ~50 million years in duration; their names are not given in this figure.
Macroscopic trace fossils are also studied in terrestrial settings. These include stromatolites (lithified layered organosedimentary structures produced by the activities of mat-building microbial communities33) and also such structures as tracks, trails, burrows, and carbonate microborings that evidence the presence of living systems but are themselves not organismal remnants;34-36 see Figure 1.2. Fossil evidence on this scale is unlikely to be found in the martian samples, although the possibility cannot be ruled out that a fragment of an ancient stromatolite will be found.
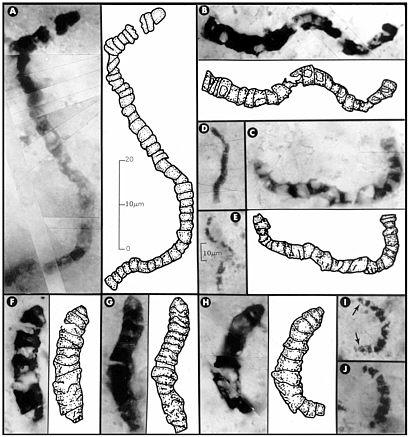
FIGURE 3.6 Carbonaceous prokaryotic fossil microorganisms, with interpretive drawings, in 3.46-billion-year-old siliceous rocks (chert) from Western Australia. All these fossils are completely encased in chert, which has been made into petrographic thin sections, rendering them visible under the microscope. The 10-µm scale bar in E is also applicable to D, I, and J; all other images are to the scale shown in A. SOURCE: Reprinted with permission from Schopf, J.W. 1993. Microfossils of the early Archean Apex chert. Science 260:640-646. Copyright 1993 by the American Association for the Advancement of Science.
CLOSING OBSERVATIONS
In summary, there are significant limits on the ability to detect life, even in samples that are in-hand, on Earth. Methods based on molecular biology and PCR provide some of the best tools for detecting terrestrial contamination of samples, or Mars life that had an ancient common origin with terrestrial life. A variety of chemical, physical, and visual examinations provide some chance of detecting novel forms of life, but they all suffer from limitations in sensitivity, generality, and/or throughput. Due to the limited amount of any sample that can be devoted to most of the forms of testing (recognizing that the tests will irreversibly alter the sample), there will be major limitations on the statements that can be made about the absence of life in any unsterilized sample.
Further, while the techniques described in this chapter can demonstrate or suggest the presence of life in martian samples, none of them can conclusively prove the absence of life, in light of the unknown character of hypothetical Mars life.37


