
Appendix D
Demographic Projections of the Research Workforce, 2001–2011
Are universities educating enough research scientists in the biomedical, clinical, and behavioral fields, or are they educating too many or, perhaps, too few? These questions underlie this attempt to project the research workforce. To determine how this workforce will grow, projections are created by taking the current workforce data in these fields and extrapolating over 10 years. Then this projected workforce is compared with estimates of the demand for future researchers.
This analysis only deals with the workforce in the aggregate form looking at the major fields of biomedical, clinical, and behavioral research and does not seek to provide complete answers. In particular, it does not tell whether the workforce will be adequate in specific disciplines. It says nothing about the quality of the workforce, although that is a critical variable. It can be used to evaluate projected quantity in relation to the expected numbers of positions, which could be altered were it essential to national goals.
A demographic model for the current workforce in each field is created by adding graduates year by year (these numbers are estimated with regression models based on data from past decades) and then subtracting retirees and decedents. From these calculations a picture of how the workforce may evolve is developed. Provision is also made in the model for immigrants who arrive with Ph.D.s in these fields, who move from employment to unemployment and back, and for graduate students, who take nonscience jobs and possibly move into science jobs late. The original model is described fully in Appendix D of the last report on the scientific workforce in these fields, Addressing the Nation’s Changing Needs for Biomedical and Behavioral Scientists (National Research Council, 2000).1 For this report, the model has been updated with new data and the addition of new groups.
This appendix will address the following issues:
-
fields covered and the data used: more than those in the previous application of the model;
-
current workforce: its components and characteristics, with some attention to recent trends and how they might be extrapolated;
-
workforce projections: over a decade; and
-
parallel projections of research positions: by sector that may become available.
COVERAGE AND DATA
For this report the definition of the behavioral field has been expanded to include clinical psychologists—a substantial expansion which means that current results for this field cannot be compared with previous results because the projections for 1995–2005 in the previous report did not include this category. The major field of clinical research was also added and includes Ph.D.s in clinical areas (except psychology) and M.D.s engaged in clinical research. Data for the clinical Ph.D.s are available from the same sources as for biomedical and behavioral Ph.D.s. For the M.D.s, only limited data are available; thus, it is only possible to speculate about orders of magnitude.
The disciplines included in biomedical and behavioral sciences include fields from anatomy to zoology; the behavioral sciences cover psychology, sociology, anthropology, demography, and speech-language pathology and audiology. The clinical sciences include all medical disciplines that are not considered biomedical. These categories have not changed from those covered in the previous report except for the addition of clinical psychology in the behavioral sciences.
Data on the U.S.-trained Ph.D. workforce in these fields were obtained from the Survey of Doctorate Recipients (SDR), a longitudinal biennial survey. Data on graduates were obtained from the Survey of Earned Doctorates—an

FIGURE D-1 The potential research workforce.
annual, virtually complete census of doctoral graduates in the United States.2 Data on foreign-trained Ph.Ds in the United States were obtained from the National Survey of College Graduates—rounds of this survey were conducted in 1993, 1995, 1997, and 1999, following up the migrants originally identified in the 1990 census. For clinical M.D.s, data were gleaned from the national roster of medical school faculty from the American Association of Medical Colleges (AAMC). These AAMC data allow some inferences about numbers of researchers, but projections are generally not possible. Therefore issues relating to this group are discussed further below.
CURRENT WORKFORCE AND RECENT TRENDS
The active workforce of Ph.D. and M.D. researchers includes all those employed in research. The potential workforce is broader and includes those unemployed, those neither employed nor looking for work (provided they are not retired), and those with jobs outside science (see Figure D-1). Some proportion of each of these groups returns to the active research workforce every year.
To avoid confusion, the term “employed” is used instead of “active workforce” and refers to those employed in science jobs. Those employed in nonscience jobs are not counted in the employed group but are referred to as being outside science. The unemployed and those not in the labor force are referred to together as “not working” and combined with those outside science as “not active” in research.
The potential workforce is incremented—in this model on an annual basis—by entering graduates and migrants with
|
2 |
See Appendix D in Addressing the Nation’s Changing Needs for Biomedical and Behavioral Scientists (National Research Council 2000a) for more details on these surveys. |
|
BOX D-1 Are the previous projections, for 1995–2005, consistent with current workforce data? The answer to this question is limited by the following:
To make the comparison, the earlier projections are rerun excluding the foreign-trained researchers but not changing any other assumptions. The projections, shown in Table D-A, up to 2001 for male and female biomedical researchers were 2-3 percent too low. By comparison with actual growth, this is not a large error. For males the error is smaller than growth in the workforce between 2000 and 2001; and, for females only a sixth of 2000-2001 growth. The error is also small relative to the uncertain number of foreign-trained researchers in the workforce. Nevertheless as small as this error is, it is not easy to explain. Looking at the number of graduates, the most important component of the projections, it can be seen that the medium projection TABLE D-A Comparison of Projected with Reported 2001 Workforce in Biomedical Research
from 1995 did not capture the fluctuations in reported numbers but is reasonably close. The estimates of male graduates are slightly too high rather than too low. Another possible explanation for projection error has to do with stay rates, the proportions of graduates assumed to stay and work in the U.S., based on their stated intentions. The 1995 projections assumed constant stay rates, whereas rates actually rose, so that by the year 2001 males were 93 percent instead of the projected 90 percent. This still would not account for more than a quarter of the error. Other possibilities may include retirement or death rates being slightly too high, relatively too much assumed movement toward jobs outside science, or even errors in the data (such as errors in age distribution) that could affect projections. Because the projections seem generally accurate, many of these errors, if they exist, probably cancel each other out. |
||||||||||||||||||
doctoral degrees. It is decremented by retirements and deaths. Movements within the workforce are also modeled, such as those between employment and unemployment. The most common movements are those in both directions between science employment and nonscience employment.
The biomedical and behavioral fields include only Ph.D.s. The clinical field includes Ph.D.s and M.D.s. The distinction between Ph.D.s and M.D.s is relevant partly for methodological reasons as the kinds of data available for each are quite different. Therefore, these groups are discussed separately. Similarly, a distinction between U.S.-trained and foreign-trained researchers is important because the types of data differ.
The components of the current potential workforce, as illustrated in Figure D-1, are given in the following order: U.S.-trained Ph.D. researchers; M.D. researchers; foreign-trained Ph.D. researchers; entrants into the workforce, meaning migrants and graduates; and movements within the workforce and exits from it. Current levels as well as recent trends that suggest possible approaches to projection are

taken into consideration in the discussion. The characteristics of each group will be addressed below.
U.S.-Trained Ph.D. Workforce
Numbers
Table D-1 shows the U.S.-trained potential workforce of Ph.D.s in 2001 as determined from the Survey of Doctoral Recipients. The size of the workforce is essentially equal in both the biomedical and behavioral fields, at 113,000 to 114,000 each, but much smaller in the clinical field, at 19,100. Between 87 and 90 percent of the potential workforce in each major field is employed in science, and 7 to 9 percent have jobs outside science. Nonscience jobs are more common among behavioral scientists than the other two groups. Those who are not working, whether they are unemployed or simply not looking for work, comprise 3 to 5 percent in each field. The numbers of Ph.D.s not working are
TABLE D-1 Potential Workforce of U.S.-Trained Ph.D. Graduates in Three Major Fields, by Employment Status and Sex, 2001
|
Field and employment status |
Number |
% of Workforce |
||||
|
Males |
Females |
Total |
Males |
Females |
Total |
|
|
Biomedical |
||||||
|
Potential workforce |
75,866 |
37,422 |
113,288 |
67.0 |
33.0 |
100.0 |
|
Employed |
69,156 |
31,106 |
100,262 |
61.0 |
27.5 |
88.5 |
|
Postdoctorates |
6,342 |
5,338 |
11,680 |
5.6 |
4.7 |
10.3 |
|
Unemployed |
713 |
306 |
1,019 |
0.6 |
0.3 |
0.9 |
|
Not in labor forcea |
1,340 |
2,576 |
3,916 |
1.2 |
2.3 |
3.5 |
|
Out of science |
4,657 |
3,434 |
8,091 |
4.1 |
3.0 |
7.1 |
|
Clinical |
||||||
|
Potential workforce |
8,149 |
10,956 |
19,105 |
42.7 |
57.3 |
100.0 |
|
Employed |
7,526 |
9,654 |
17,180 |
39.4 |
50.5 |
89.9 |
|
Postdoctorates |
136 |
279 |
415 |
0.7 |
1.5 |
2.2 |
|
Unemployed |
3 |
124 |
127 |
0.0 |
0.6 |
0.7 |
|
Not in labor forcea |
74 |
330 |
404 |
0.4 |
1.7 |
2.1 |
|
Out of science |
546 |
848 |
1,394 |
2.9 |
4.4 |
7.3 |
|
Behavioral and Social |
||||||
|
Potential workforce |
59,175 |
54,822 |
113,997 |
51.9 |
48.1 |
100.0 |
|
Employed |
52,606 |
46,540 |
99,146 |
46.1 |
40.8 |
87.0 |
|
Postdoctorates |
759 |
1,377 |
2,136 |
0.7 |
1.2 |
1.9 |
|
Unemployed |
280 |
509 |
789 |
0.2 |
0.4 |
0.7 |
|
Not in labor forcea |
647 |
2,771 |
3,418 |
0.6 |
2.4 |
3.0 |
|
Out of science |
5,642 |
5,002 |
10,644 |
4.9 |
4.4 |
9.3 |
|
aNot employed, not looking for work, but not retired. SOURCE: National Science Foundation Survey of Doctorate Recipients. |
||||||
higher among women: 2 to 3 percent of the total workforce compared to less than 2 percent of men.
Trends
Over the past three decades, the U.S.-trained workforce in each field has grown steadily. From 1973–2001, the average annual workforce growth rates have been 4.1 percent for biomedical researchers, 6.8 percent for clinical researchers, and 4.8 percent for behavioral researchers (see Figure D-2). Growth in employment outside science has contributed to this (see Figure D-3). When only those employed in science are considered, growth rates would be 0.2 to 0.5 percentage points lower. More recently, from 1991 to 2001, growth rates were lower for the workforce as a whole: 3.7 percent for biomedical, 6.3 percent for clinical, and 2.7 percent for behavioral researchers.
As a proportion of the potential workforce, the percentage of those not working has increased. Their proportion varied roughly between 1.5 and 2.5 percent up to 1990, but the range has since increased to 3.0 to 4.5 percent. These percentages appear small, but the numbers involved have risen rapidly. For example, in the biomedical field, those not working numbered 1,500 in 1989. This increased to 4,900 in 2001. Two major factors contributed to this increase. First, the proportion not working was consistently higher in each field among females, who comprised only 10 to 20 percent of the workforce in the 1970s and increased to 30 to 60 percent in 2001. Second, around 1990, the proportion of males not working began to increase. Nevertheless, total unemployment has not increased by much, neither among males nor females. Notably, most of the increase in those not working has involved people staying out of the labor force. This not-working group represents a small proportion of the workforce, but the absolute numbers have grown rapidly among females, and males in the not-working category began to outnumber the unemployed in the early 1990s (see Figure D-4). People may stay out of the labor force to care for chil-
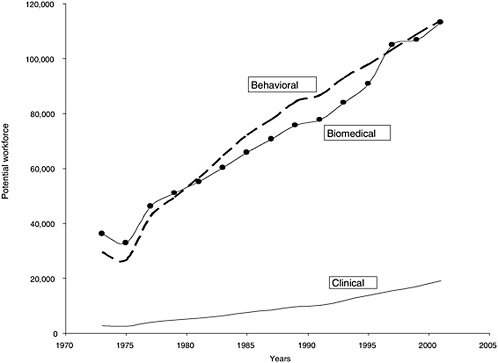
FIGURE D-2 Trends in the U.S.-trained potential workforce by major field, 1973–2001.
SOURCE: National Science Foundation Survey of Doctorate Recipients.
dren, to take a break between jobs, or for other personal reasons, but the extent to which this is voluntary is not evident from the data.
M.D. Workforce
Numbers
These data include M.D.s if they also have a Ph.D. from a U.S. institution. There are few data on clinical researchers with only M.D. degrees. Medical school faculty in the year 2000 totaled 90,678, but only a small minority of these should be considered clinical researchers (see Table D-2).
-
of the total, only 64 percent have M.D.s, rather than Ph.D.s, M.D./Ph.D.s, or no doctoral degree (M.D./Ph.D.s are grouped with Ph.D.s because they are included in datasets on Ph.D.s).
-
of the M.D.s, 96 percent are in clinical departments and the rest are in biomedical departments (anatomy, biochemistry, microbiology, basic pathology, pharmacology, physiology, and other basic sciences).
-
of the clinical M.D.s, only 2,879, or 5.2 percent, have ever had an R01 grant.
Therefore, it is feasible to add the 2,879 M.D. researchers to the 19,105 clinical researchers in the workforce. This number allows for M.D.s who are not currently doing research but have done so in the past, yet it is still a substantial underestimate for three reasons. First, R01 grants are not the only possible type of grant; research funds from pharmaceutical companies, foundations, and other sources compose a sig-

FIGURE D-3 Percent in conscience jobs by major field, 1973–2001.
SOURCE: National Science Foundation Survey of Doctorate Recipients.
nificant part of the research enterprise. Second, M.D. researchers may not be on medical faculties. Third, some additional (though very small) number currently may not be working or may be employed outside science. While one could argue that all M.D.s not in research should be categorized as “outside science” in the workforce, the discussion here is limited by the available data. Fourth, the criterion that requires evidence of a research grant may be too strict as Ph.D.s may not have had a research grant but are still counted in the potential workforce.
Of the Ph.D.s and M.D./Ph.D.s in clinical departments, 3,860 have had R01 grants. These individuals were included among those counted in the previous U.S.-trained Ph.D. discussion. However, the 13,577 who have not had an R01 grant were also counted. Ph.D.s and M.D./Ph.D.s in clinical departments make up 90 percent of the clinical Ph.D. workforce, although the proportion is somewhat uncertain due to lack of data on the foreign-trained Ph.D. component. These Ph.D.s and M.D./Ph.D.s in clinical departments total 4.5 times the number that have had R01 grants. When this same ratio is applied to the number counted as M.D. clinical researchers, it results in a total of 13,000. While there is some ambiguity in defining the M.D. clinical research workforce, it could be assumed that their numbers are between 3,000 and 13,000. This means that the number of clinical researchers regardless of degree type would have to be increased from the earlier estimate by as little as 16 or as much as 68 percent to incorporate the M.D. researchers who would, however, still
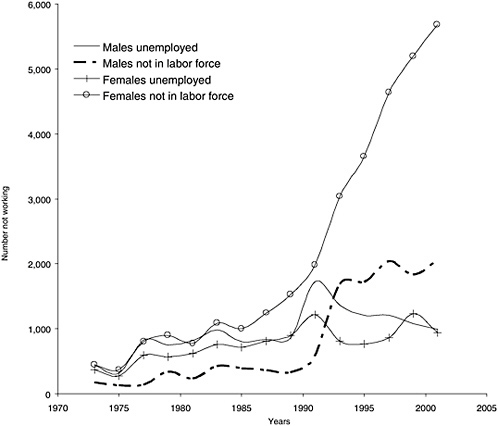
FIGURE D-4 Numbers unemployed and not in labor force for all fields combined by sex, 1973–2001.
SOURCE: National Science Foundation Survey of Doctorate Recipients.
be in the minority. Given the considerable uncertainty in these numbers, no attempt is made to project clinical M.D. researchers other than to make the following observations.
Trends and Characteristics
The faculty roster data show that M.D.s in clinical departments who have ever had an R01 grant increased from 2,482 in 1993 to 3,090 in 2003, which is an annual rate of increase of 2.4 percent. This is much slower than the rate of increase for clinical Ph.D. researchers of 6.3 percent annually (from 1991 to 2001) and slightly slower than faculty growth in clinical departments. However, M.D. clinical researchers with other types of grants or those not on medical faculties might have increased more rapidly.
There is a striking contrast between the male-female ratios for both M.D. and Ph.D. clinical researchers. Ph.D. clinical researchers are 57 percent female (see Table D-1). However, M.D. clinical researchers on medical faculties who have had R01s are 84 percent male. In each clinical discipline, male faculty with M.D.s and R01 experience outnumber equivalent female faculty by at least 2 to 1 and often much more. This is true from anesthesiology to surgery, including such fields as family medicine, pediatrics, and obstetrics and gynecology. Since Ph.D. clinical faculty with R01s are also largely male (71 percent), the mechanisms by
TABLE D-2 Medical School Faculty, by Major Field and Degree, and Number and Percent Having Had an R01 Grant, 2000
|
|
Total |
Biomedical |
Clinical |
Behavioral |
|
Faculty |
||||
|
Total |
90,678 |
14,583 |
76,073 |
22 |
|
M.D.s |
58,104 |
2,285 |
55,819 |
0 |
|
Ph.D.s |
23,759 |
11,030 |
12,715 |
14 |
|
M.D./Ph.D.s |
5,706 |
983 |
4,722 |
1 |
|
Other |
3,109 |
285 |
2,817 |
7 |
|
Faculty who have ever had an R01 grant |
||||
|
Total |
11,824 |
5,033 |
6,787 |
4 |
|
M.D.s |
3,183 |
304 |
2,879 |
0 |
|
Ph.D.s |
6,960 |
4,191 |
2,767 |
2 |
|
M.D./Ph.D.s |
1,585 |
490 |
1,093 |
2 |
|
Other |
96 |
48 |
48 |
0 |
|
Percent who have ever had an R01 |
||||
|
Total |
13.0 |
34.5 |
8.9 |
18.2 |
|
M.D.s |
5.5 |
13.3 |
5.2 |
|
|
Ph.D.s |
29.3 |
38.0 |
21.8 |
|
|
M.D./Ph.D.s |
27.8 |
49.8 |
23.1 |
|
|
Other |
3.1 |
16.8 |
1.7 |
|
|
aFewer than 20 base cases. NOTE: Major field is defined by department, which may not agree exactly with field definitions in Table D-1. SOURCE: American Association of Medical Colleges Faculty Roster. |
||||
which medical faculty obtain R01s may have something to do with the small proportion of females.
Foreign-trained M.D.s on faculty rosters represented 15 percent of those with R01s in 1993, rising slightly to 17 percent by 2002. It is important to distinguish between the data on Ph.D.s discussed in the previous section, which only included U.S.-trained Ph.D.s, and this section, which integrates an estimate of foreign-trained Ph.D.s. The following discussion will address this issue of the number to add for foreign-trained Ph.D.s.
Foreign-Trained Ph.D. Workforce
Numbers and Trends
Foreign-trained Ph.D.s are an important component of the workforce. However, the data are limited and provide uncertain results. The data for foreign-trained Ph.D.s come from the National Survey of College Graduates. This survey covers only those identified in the 1990 U.S. census. Therefore the numbers for those who migrated since 1990 and for attrition up to 2001 needed to be determined. This was done in several steps. First, those identified in the 1993 survey by date of entry into the United States are broken down and then are “reverse survived” by age group for each field and sex to obtain estimates of their original numbers at entry going back as far as 1980. Second, this flow of migrants, from 1980 to 1990, is projected forward to 2001 using regression models. Third, by taking the distribution of the foreign trained in 1993 as roughly equivalent to the 1990 Census cohort, they are projected forward from 1990 to 2001 by adding, year by year, the estimated flow of migrants. This same projection model is used just as in the main exercise, although in this case it deals only with migrants and not U.S. graduates. This model allows for the accumulating numbers of migrants and for attrition. These rates are similar to those described below for the workforce as a whole.
Figure D-5 shows data and results in the biomedical field. The stock of foreign-trained biomedical Ph.D.s in the 1993 survey (at the left end of the middle line) was 8,800. This stock declined in subsequent surveys since migrants after 1990 were not added to the sample. The slight increase in 1999 occurred because survey nonresponse was reduced. Working backward from these levels, the migrant flow over the 1980s is estimated, shown by the line on the lower left. This flow, referred to as “entrants” to distinguish them from the stock of migrants, rose from 400 to over 700 annually during the 1980s. These entrants are added to the stock to give the projected stock of foreign-trained Ph.D.s, which doubled from 1993 to 2001, when it reached 17,400.
This projected stock analysis relies on the trends of the 1980s entrants. There are no data that allow direct assessment of whether changes in the flow took place in the 1990s. However, there are data on postdoctorates that permit a similar exercise to be conducted. Assuming that foreign-trained postdoctorates entered the United States just before accepting their posts, their dates of entry must have been more recent, on average, than those of migrants captured in the 1990 Census. Again, the data used are from the Graduate Student Survey, which includes numbers of postdoctorates by calendar year and field. Those with M.D.s rather than Ph.D.s are eliminated. Those with U.S. rather than foreign doctoral training are determined by applying ratios of temporary residents to U.S. citizens and permanent residents. In addition, stay rates are estimated for graduates. Both of these will be discussed further below. An estimate is made of when each postdoctorate started, using data on the duration an individual spent as a postdoctorate, and the assumption is made that this date is identical to the date of migration.
Figure D-6 resembles Figure D-5 (and is drawn to the same scale to facilitate comparison). The middle line shows the stock of foreign-trained postdoctorates, and the bottom line shows entrants estimated, as described above, from this stock. The stock numbers in Figure D-6 are consistent with those in Figure D-5, at least to the extent of indicating a smaller number of foreign-trained postdoctorates than foreign-trained researchers generally. The entrant numbers, however, are inconsistent, which suggests that more foreign-
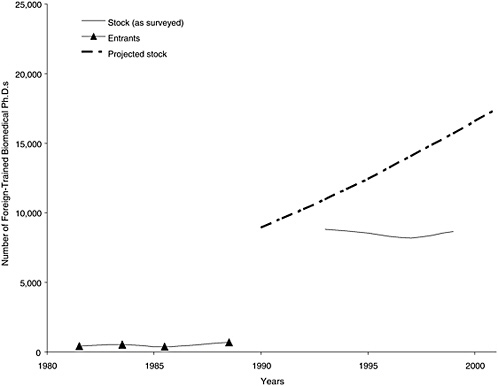
FIGURE D-5 Proportion of temporary residents among graduates and proportion of each group intending to stay in the United States: Means for 1997–2001.
SOURCE: National Science Foundation Survey of Earned Doctorates.
trained Ph.D.s entered the U.S. to take postdoctorates than the total number of entering foreign-trained Ph.D.s.
The reasons for this inconsistency are not clear. Either the data or the assumptions must be incorrect in Figure D-5 or Figure D-6, but it is not possible to determine which. One scenario would be to take the estimated entrants in Figure D-6, add a minimal 10 percent to allow for entrants who do not take postdoctorates, and apply the trend to 1993 stock numbers for all foreign-trained Ph.D.s. This results in a projected stock shown in the top line in Figure D-6. Note that these numbers are higher than those in Figure D-5 by 40 percent in the year 2001. Consequently, both estimates referring to the projected stock in Figure D-5 will be termed “medium” estimates, while those in Figure D-6 will be termed “high” estimates.
Similar results can be produced for foreign-trained clinical Ph.D.s. As for biomedical Ph.D.s, estimates based on surveyed migrants are lower than estimates based on reported postdoctorates. The former are obtained by working backwards from a stock of 2,200 foreign-trained researchers in 1993. This results in just under 200 annual entrants in the 1980s but follows an upward trend. Projections based on this trend would result in foreign-trained researchers tripling during the 1990s and reaching 6,200 by 2001. However, using reported postdoctorates results in an estimate that is 30 percent higher by 2001. Again, the former is considered a medium estimate and the latter a high estimate.
In contrast, foreign-trained behavioral researchers have a different picture. In 1993 this group was almost 50 percent more than clinical researchers, but proportionally more of

FIGURE D-6 Foreign-trained biomedical Ph.D.s: postdoctorates, postdoctoral entrants, and projected total stock.
SOURCE: National Science Foundation Survey of Graduate Students and Postdoctorates in Science and Engineering; and National Science Foundation National Survey of College Graduates.
them arrived before 1980, and during the 1980s entrants were few topping off at 100 annually. Projections based on this flow would indicate an increase in the stock to 4,300 by 2001. Foreign-trained postdoctorates are very few. As a result, the stock averages about 100 over two decades. For this group the projected stock from the migrant survey gives the high estimate, and the medium estimate is created by assuming a constant inflow of 100 per year.
Characteristics
The estimates for 2001 of foreign-trained Ph.D.s in each field-broken down by sex and employment status based on the 1993 survey-are shown in Table D-3. In the biomedical field there are between 17,400 and 24,800 foreign-trained Ph.D.s who make up 13 to 18 percent of the entire workforce. Although the number of foreign-trained Ph.D.s in the clinical field is smaller, they comprise between 25 and 30 percent of the workforce, which is a larger proportion; only 17 percent of the M.D. clinical researchers are on medical faculties. Finally, in the behavioral field they are much less consequential, at 3.0 to 3.6 percent of the entire workforce.
The distribution of foreign-trained Ph.D.s by employment status resembles that for U.S.-trained Ph.D.s with one exception: female biomedical researchers appear substantially more likely to be out of the labor force. The balance between males and females differs somewhat by field. In clinical research, foreign-trained Ph.D.s are more likely to be male than the U.S.-trained Ph.D.s, but the reverse appears to be the case in the other two fields (among M.D. clinical re-
TABLE D-3 Potential Workforce of Foreign-Trained Ph.D.s In Three Major Fields, By Employment Status, 2001: Medium and High Estimates
|
Field and Employment Status |
Number |
% Distribution by Status |
% Males Among Foreign Trained |
% Foreign Trained of Total Workforce |
||||
|
Medium |
High |
Medium |
High |
Medium |
High |
Medium |
High |
|
|
Biomedical |
||||||||
|
Potential workforce |
17,443 |
24,795 |
100.0 |
100.0 |
55.6 |
52.5 |
13.3 |
18.0 |
|
Employed |
14,629 |
20,514 |
83.9 |
82.7 |
61.9 |
59.3 |
12.7 |
17.0 |
|
Unemployed |
105 |
140 |
0.6 |
0.6 |
53.3 |
49.3 |
9.3 |
12.1 |
|
Not in labor forcea |
1,478 |
2,423 |
8.5 |
9.8 |
5.2 |
4.2 |
27.4 |
38.2 |
|
Out of science |
1,231 |
1,718 |
7.1 |
6.9 |
42.1 |
39.2 |
13.2 |
17.5 |
|
Clinical |
||||||||
|
Potential workforce |
6,197 |
8,133 |
100.0 |
100.0 |
79.1 |
78.8 |
24.5 |
29.9 |
|
Employed |
5,846 |
7,683 |
94.3 |
94.5 |
79.8 |
79.4 |
25.4 |
30.9 |
|
Unemployed |
17 |
21 |
0.3 |
0.3 |
52.9 |
52.4 |
11.8 |
14.2 |
|
Not in labor forcea |
30 |
38 |
0.5 |
0.5 |
30.0 |
28.9 |
6.9 |
8.6 |
|
Out of science |
304 |
391 |
4.9 |
4.8 |
72.4 |
73.1 |
17.9 |
21.9 |
|
Behavioral |
||||||||
|
Potential workforce |
3,483 |
4,284 |
100.0 |
100.0 |
38.8 |
34.8 |
3.0 |
3.6 |
|
Employed |
3,041 |
3,756 |
87.3 |
87.7 |
39.1 |
34.9 |
3.0 |
3.7 |
|
Unemployed |
14 |
17 |
0.4 |
0.4 |
21.4 |
17.6 |
1.7 |
2.1 |
|
Not in labor forcea |
105 |
137 |
3.0 |
3.2 |
7.6 |
6.6 |
3.0 |
3.9 |
|
Out of science |
323 |
374 |
9.3 |
8.7 |
47.4 |
44.7 |
2.9 |
3.4 |
|
aNot employed, not looking for work, but not retired. SOURCE: National Science Foundation Survey of Doctorate Recipients. |
||||||||
searchers on medical faculties, the male-female ratio, which heavily favors males, is similar for both the U.S.- and the foreign-trained postdoctorates).
INFLOWS OF MIGRANTS AND GRADUATES
Every year foreign-trained researchers and graduates of U.S. institutions are added to the workforce. The inflows, and the corresponding outflows of retirees and decedents, constitute the forces that shape and reshape the workforce. Therefore it is important to consider each of these flows carefully, using past trends and alternative assumptions that might be made in projecting the future workforce. As done for projections in the previous report, past trends are used to define high, medium, and low options for numbers of future entrants.
Migrants
The inflow has largely been described for foreign-trained Ph.D.s, and only a few points need to be added. To project their future flow, projections of migrant flow up to 2001 can be extended for an additional decade as described above. For each field this gives a medium and a high option. A low option is defined for biomedical and clinical researchers by keeping the number of entrants constant at the 2001 value and for behavioral researchers by reducing it to 90 percent of that value.
Numbers of Graduates
For females the number of Ph.D. graduates entering the workforce has been rising since 1970 in each major field (see Figure D-7). For male graduates the trend is less consistent: male clinical and biomedical graduates have generally risen since the mid-1980s, but male behavioral graduates have clearly fallen. The latter group aside, year-to-year increases are common, but there are exceptions: from 2000 to 2001, male behavioral graduates fell as well as graduates in four of the other five groups. To project graduates from these trends, the total graduates in each group (the proportion who stay in the United States and enter the workforce) and their age distribution need to be considered.
Regressions were run for total numbers of graduates over time in each field by sex, using data that start in 1985, 1990, or 1995 to reflect longer-term and shorter-term trends. For

FIGURE D-7 Trends in Ph.D. graduates by major field and sex, 1970–2001.
SOURCE: National Science Foundation Survey of Earned Doctorates, 2001.
the 1985 regressions, a quadratic term was used. Pre-1985 data were not used because breaks in the trend appear for some groups. In addition, as noted below, age patterns of graduates also shifted slightly around that time.
Table D-4 shows the regression results. The longer-term regressions appear to fit better, probably because year-to-year fluctuations have proportionally less of an impact than in shorter-term regressions. The regression equations are used to define possible future paths, as illustrated in Figure D-8 for female behavioral graduates, and an additional path is defined by keeping the numbers of graduates constant at the average of the past five years (1997–2001). For female behavioral researchers and the other groups generally, the linear regression from 1985 provides the greatest increase in graduates, whereas holding graduates constant provides the least optimistic option. Conversely, numbers of male behavioral graduates are declining and, as noted by the 1985 linear regression, are the least optimistic. The 1985 linear regression defines a high option for graduates in general and a constant flow as the low option, except for male behavioral graduates, for which these are reversed. A medium option is then defined as the average of these two.
Stay Rates Among Graduates
Not all Ph.D. graduates enter the U.S. workforce. In particular, non-U.S. citizens with temporary visas are less likely to stay in the country after graduation. These temporary residents represent a variable proportion of graduates across major fields, ranging over time from 3 to 40 percent. Unlike U.S. citizens and permanent residents, 95 to 99 percent of whom express an intention to stay in the United States, temporary residents express a similar intention only 25 to 80 percent of the time. In any year and field when the proportion of temporary-resident graduates is high, they are slightly more likely to intend to stay, but their inclusion among
TABLE D-4 Regressions For Total Ph.D. Graduates By Major Field and Sex
|
|
From 1985 |
From 1985 |
From 1990 |
From 1995 |
||||
|
B |
t-test |
B |
t-test |
B |
t-test |
B |
t-test |
|
|
Male biomedical |
||||||||
|
Year |
66.356 |
10.53 |
16400.811 |
4.04 |
47.245 |
4.66 |
–3.742 |
–0.28 |
|
Constant |
–129516 |
–10.31 |
–16406702 |
–4.05 |
–91351 |
–4.52 |
10542 |
0.39 |
|
R2 |
0.881 |
|
0.945 |
|
0.685 |
|
0.015 |
|
|
Female biomedical |
||||||||
|
Year |
92.043 |
20.38 |
8291.131 |
2.26 |
86.031 |
9.63 |
40.635 |
2.87 |
|
Year2 |
–2.057 |
–2.23 |
|
|||||
|
Constant |
–181592 |
–20.17 |
–8351933 |
–2.28 |
–169586 |
–9.52 |
–78864 |
–2.79 |
|
R2 |
0.965 |
|
0.974 |
|
0.903 |
|
0.623 |
|
|
Male clinical |
||||||||
|
Year |
19.002 |
25.63 |
–329.462 |
–0.47 |
19.968 |
13.70 |
17.746 |
4.38 |
|
Year2 |
0.087 |
0.50 |
|
|||||
|
Constant |
–37479 |
–25.36 |
309764 |
0.45 |
–39407 |
–13.55 |
–34969 |
–4.32 |
|
R2 |
0.978 |
|
0.978 |
|
0.949 |
|
0.794 |
|
|
Female clinical |
||||||||
|
Year |
40.917 |
21.34 |
1808.031 |
1.03 |
40.441 |
11.00 |
35.361 |
3.84 |
|
Year2 |
–0.443 |
–1.01 |
|
|||||
|
Constant |
–80850 |
–21.16 |
–1841769 |
–1.06 |
–79901 |
–10.89 |
–69752 |
–3.80 |
|
R2 |
0.968 |
|
0.970 |
|
0.924 |
|
0.747 |
|
|
Male behavioral |
||||||||
|
Year |
–26.591 |
–8.69 |
–6125.923 |
–2.56 |
–18.257 |
–4.36 |
–10.710 |
–1.30 |
|
Year2 |
1.530 |
2.55 |
|
|||||
|
Constant |
54699 |
8.97 |
6132646 |
2.57 |
38060 |
4.55 |
22973 |
1.40 |
|
R2 |
0.834 |
|
0.887 |
|
0.655 |
|
0.252 |
|
|
Female behavioral |
||||||||
|
Year |
62.020 |
14.17 |
6678.112 |
1.78 |
52.806 |
6.49 |
38.210 |
1.80 |
|
Year2 |
–1.660 |
–1.77 |
|
|||||
|
Constant |
–121132 |
–13.88 |
–6714028 |
–1.80 |
–102732 |
–6.33 |
–73559 |
–1.73 |
|
R2 |
0.930 |
|
0.943 |
|
0.808 |
|
0.393 |
|
|
SOURCE: Analysis based on data from the National Science Foundation Survey of Earned Doctorates. |
||||||||
graduates contributes to a lower proportion for those intending to stay among graduates as a whole.
Around 1990, temporary residents increased as a proportion of all graduates, particularly in the biomedical field. Since then their proportion has fluctuated with no clear trend. Their stay rate—the proportion intending to stay in the U.S.—may have increased since 1995 but only after an apparent decline earlier in the 1990s. It is not certain how to extrapolate from these trends and trend reversals, given the apparent volatility of the stay rates. For projection purposes the assumption is made that both the percentage of temporary residents and the stay rate remain constant, by field and sex, at the average level for the past five years. This assumption gives overall stay rates (for U.S. citizens and noncitizens combined) of between 87 and 96 percent (see Table D-5). For biomedical researchers these levels are slightly higher than those used in the 1995-2005 projections.
Some evidence suggests, however, that actual stay rates for temporary resident science and engineering Ph.D.s rose during the 1990s. This is supported by Finn (2003), who followed up 1991, 1996, and 1999 cohorts using Social Security data.3 Actual stay rates tend to match stated intentions to stay. For instance, temporary resident behavioral graduates clearly have lower stay rates than temporary resident biomedical graduates. However, whether the relatively short-
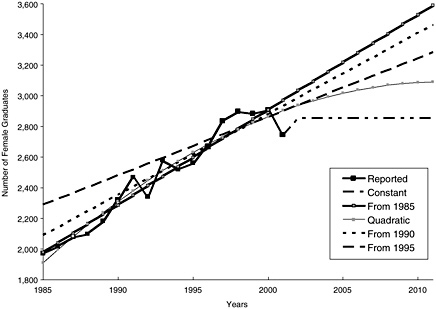
FIGURE D-8 Female behavioral graduates projected using various equations.
SOURCE: National Science Foundation Survey of Earned Doctorates, 2001.
TABLE D-5 Proportion of Temporary Residents Among Graduates and Proportion of Each Group Intending To Stay In The U.S.: Means For 1997–2001
|
Indicator |
Biomedical |
Clinical |
Behavioral |
|||
|
Male |
Female |
Male |
Female |
Male |
Female |
|
|
Proportion of temporary residents |
0.257 |
0.209 |
0.294 |
0.151 |
0.099 |
0.054 |
|
Proportion intending to stay in the U.S.: |
|
|||||
|
U.S. citizens and permanent residents |
0.964 |
0.969 |
0.960 |
0.967 |
0.970 |
0.980 |
|
Temporary residents |
0.845 |
0.841 |
0.669 |
0.550 |
0.518 |
0.584 |
|
All graduates combined |
0.934 |
0.942 |
0.874 |
0.904 |
0.925 |
0.959 |
|
SOURCE: National Science Foundation Survey of Earned Doctorates, 2001. |
||||||
term rise in rates will continue and whether it will be matched with increases or decreases in the proportion of graduates who are temporary residents remain to be determined. There is an alternative method to model the rise in overall stay rates. Linear regressions were run on the 1995-2001 data to extrapolate trends to 2011 for U.S. citizens and noncitizens combined (however, for male clinical researchers, data from 1990 were used to avoid too rapid a rise that would contrast strongly with other groups). The results, compared with the projected constant stay rates shown in Figure D-9, indicate that stay rates could be as much as five percentage points higher at the end of the projection period.
Age Distribution of Graduates
Ph.D. graduates in these fields have aged over the years. This major change took place in the mid-1980s, and no clear trend has become evident since then. In the 1970s graduates of these ages accounted for about 45 percent of all graduates in these fields combined. This percentage dropped by five

FIGURE D-9 Proportion of all graduates intending to stay and rising and constant projections by major field and sex, 1990–2011.
SOURCE: National Science Foundation Survey of Earned Doctorates, 2001.
points in the early 1980s and again in the late 1980s. Similar reductions took place in the smaller proportions graduating under age 28. Some of these reductions were due to more students graduating at ages 32 to 35, but a larger increase occurred above age 35. Overall, ages 28 through 31 are the peak ages for graduating with a Ph.D.; about 10 percent of graduates are typically of each age. However, this trend did not continue into the 1990s. Some changes in age at graduation did take place in the 1990s but were inconsistent across fields and did not indicate any sustained trends.
Since there is no clear evidence that age at graduation is rising or falling, it is assumed (for projection purposes) that it stays constant at the average levels by field and sex for the past five years. The median ages in these distributions are lowest in the biomedical field and highest in the clinical field. For males and females, respectively, median ages at graduation are 31.1 and 30.5 in biomedical research, 34.7 and 39.5 in clinical research, and 33.4 and 32.7 in behavioral research.
OUTFLOWS AND CHANGES IN STATUS
Once in the workforce, individuals may take a job outside science, become unemployed, move out of the labor force, or eventually leave the workforce altogether through retirement or death (they may also emigrate, but these numbers are small and probably unreliable, so they have not been considered). Such changes in status were used to track changes in the potential workforce. The likelihood of most of these movements is estimated from the biennial survey of doctoral recipients for the years 1993 to 2001. When the
numbers of cases in various categories are small, data were pooled across surveys and tabulations were produced for employment status initially and again two years later. Table D-6 summarizes these tabulations.
The most common work scenario is for a graduate to be initially employed in science and to still be so employed two years later (note that the data do not indicate whether the job is the same or whether there was a break in employment in between). This holds for 77 to 86 percent of researchers in each major field. By contrast, those with jobs outside science who are still in the same or similar jobs two years later, range from 3 to 6 percent of the entire group. Movement from science to nonscience employment and vice versa involves 4.5 to 8 percent with comparable flows in each direction. Movement toward nonscience employment is more common in the biomedical field. Movement to or from nonscience jobs does not appear to be age related. Median ages of those moving out of or into science from nonscience jobs are close to median ages for those who stay in science employment, and age distributions have similar patterns across these groups.
Those not working (whether unemployed or not in the labor force) tend to be proportionally more numerous among females than males. In the biomedical field they are 7.4 percent among females but only 2.2 percent among males (averaging across initial percentages and percentages two years later). In the clinical field the contrast is between 4.4 and 1.4 percent and in the behavioral field between 5.2 and 1.5 percent. Women are also more likely to still not be working two years later. In each field more than half of females who are initially not working are still not working two years later. Among males the parallel proportions are 10 to 25 percentage points lower. Males are slightly more likely than females to be employed two years later, to take a job outside science, or even to retire.
Retirement is a major transition point that is fairly predictable. At least half of each group retires between the ages of 61 and 70. Females tend to retire slightly earlier than males, especially in the biomedical field.
The SDR data do not provide mortality rates. Consequently, these rates were obtained from TIAA/CREF to represent rates in academia generally. Separate rates are used
TABLE D-6 Initial Employment Status and Status 2-Years Later: Percentages Based On All Cases in Each Field by Sex, Pooled 1993–2001 Data
|
Employment Status After 2 Years |
Initial Employment Status |
|||||||
|
Males |
Females |
|||||||
|
Employed |
Not Workinga |
Out of Science |
All Males |
Employed |
Not Workinga |
Out of Science |
All Females |
|
|
Biomedical |
||||||||
|
Employed |
86.1 |
1.0 |
2.0 |
89.1 |
77.1 |
2.2 |
2.5 |
81.7 |
|
Not workinga |
1.2 |
0.8 |
0.1 |
2.1 |
2.8 |
4.2 |
0.5 |
7.4 |
|
Out of science |
2.5 |
0.2 |
3.5 |
6.1 |
3.4 |
0.7 |
5.2 |
9.4 |
|
Retired |
2.2 |
0.3 |
0.2 |
2.6 |
0.9 |
0.3 |
0.3 |
1.5 |
|
Total |
91.9 |
2.3 |
5.8 |
100.0 |
84.2 |
7.4 |
8.4 |
100.0 |
|
Weighted cases |
185,335 |
4,643 |
11,594 |
201,572 |
68,401 |
6,024 |
6,831 |
81,255 |
|
Clinical |
||||||||
|
Employed |
85.6 |
0.5 |
3.3 |
89.4 |
81.8 |
1.3 |
3.4 |
86.5 |
|
Not workinga |
0.5 |
0.7 |
0.0 |
1.2 |
1.6 |
2.3 |
0.4 |
4.3 |
|
Out of science |
2.3 |
0.3 |
3.9 |
6.5 |
3.6 |
0.3 |
3.1 |
7.0 |
|
Retired |
2.4 |
0.2 |
0.3 |
2.8 |
1.4 |
0.5 |
0.2 |
2.2 |
|
Total |
90.8 |
1.7 |
7.6 |
100.0 |
88.3 |
4.5 |
7.1 |
100.0 |
|
Weighted cases |
17,788 |
328 |
1,485 |
19,601 |
19,290 |
990 |
1,556 |
21,836 |
|
Behavioral |
||||||||
|
Employed |
83.3 |
0.6 |
2.7 |
86.7 |
80.4 |
1.5 |
2.8 |
84.7 |
|
Not workinga |
0.7 |
0.5 |
0.2 |
1.4 |
1.9 |
2.8 |
0.4 |
5.2 |
|
Out of science |
2.8 |
0.3 |
5.8 |
8.9 |
2.7 |
0.6 |
5.1 |
8.3 |
|
Retired |
2.3 |
0.3 |
0.4 |
3.0 |
1.3 |
0.3 |
0.1 |
1.8 |
|
Total |
89.1 |
1.7 |
9.2 |
100.0 |
86.4 |
5.2 |
8.4 |
100.0 |
|
Weighted cases |
164,788 |
3,204 |
16,992 |
184,984 |
115,366 |
6,975 |
11,186 |
133,527 |
|
a“Not working” includes the unemployed and those not in the labor force. SOURCE: National Science Foundation Survey of Earned Doctorates, 2001. |
||||||||
for males and females. These mortality rates are slightly lower than those in the 2000 report, reflecting secular improvement in life expectancy.
WORKFORCE PROJECTIONS
Scenarios
An analysis of the research workforce provides the base for 10-year projections. The inflows, outflows, and shifts in status provide alternative assumptions for future trends. Various assumptions are combined in order to define three main projection scenarios: (1) high for high numbers of graduates and high numbers of foreign-trained migrants, (2) medium for intermediate numbers in both groups, and (3) low for low numbers in both groups. The medium and low scenarios both start with the lower estimates of the 2001 stock of foreign-trained Ph.D.s, and the high scenario starts with the higher estimates. Additional scenarios will be considered below based on variations in stay rates and migrants.
Table D-7 shows the varying numbers of graduates assumed in each scenario. In the medium scenario, biomedical graduates reach the 6,000 level by 2006. In the high scenario they are at this level by 2002. In the low scenario they never
TABLE D-7 Projected Ph.D. Graduates in Three Major Fields, by Sex: Medium, High, and Low Scenarios
|
|
Biomedical |
Clinical |
Behavioral |
||||||
|
Total |
Male |
Female |
Total |
Male |
Female |
Total |
Male |
Female |
|
|
Medium |
|||||||||
|
2002 |
5,730 |
3,202 |
2,528 |
1,540 |
535 |
1,005 |
4,459 |
1,514 |
2,945 |
|
2003 |
5,806 |
3,235 |
2,571 |
1,568 |
544 |
1,024 |
4,476 |
1,502 |
2,974 |
|
2004 |
5,888 |
3,269 |
2,619 |
1,599 |
553 |
1,046 |
4,494 |
1,489 |
3,005 |
|
2005 |
5,962 |
3,300 |
2,662 |
1,624 |
559 |
1,065 |
4,511 |
1,477 |
3,034 |
|
2006 |
6,041 |
3,333 |
2,708 |
1,658 |
572 |
1,086 |
4,530 |
1,463 |
3,067 |
|
2007 |
6,122 |
3,366 |
2,756 |
1,690 |
582 |
1,108 |
4,546 |
1,451 |
3,095 |
|
2008 |
6,199 |
3,401 |
2,798 |
1,716 |
593 |
1,123 |
4,568 |
1,439 |
3,129 |
|
2009 |
6,286 |
3,434 |
2,852 |
1,747 |
601 |
1,146 |
4,580 |
1,423 |
3,157 |
|
2010 |
6,363 |
3,466 |
2,897 |
1,779 |
610 |
1,169 |
4,599 |
1,408 |
3,191 |
|
2011 |
6,440 |
3,497 |
2,943 |
1,809 |
618 |
1,191 |
4,619 |
1,398 |
3,221 |
|
Total |
60,837 |
33,503 |
27,334 |
16,730 |
5,767 |
10,963 |
45,382 |
14,564 |
30,818 |
|
High |
|||||||||
|
2002 |
6,003 |
3,327 |
2,676 |
1,632 |
567 |
1,065 |
4,603 |
1,570 |
3,033 |
|
2003 |
6,167 |
3,398 |
2,769 |
1,690 |
582 |
1,108 |
4,663 |
1,570 |
3,093 |
|
2004 |
6,325 |
3,460 |
2,865 |
1,748 |
602 |
1,146 |
4,727 |
1,570 |
3,157 |
|
2005 |
6,481 |
3,526 |
2,955 |
1,809 |
618 |
1,191 |
4,788 |
1,570 |
3,218 |
|
2006 |
6,644 |
3,596 |
3,048 |
1,867 |
639 |
1,228 |
4,847 |
1,570 |
3,277 |
|
2007 |
6,806 |
3,664 |
3,142 |
1,928 |
660 |
1,268 |
4,912 |
1,570 |
3,342 |
|
2008 |
6,956 |
3,729 |
3,227 |
1,992 |
678 |
1,314 |
4,971 |
1,570 |
3,401 |
|
2009 |
7,116 |
3,794 |
3,322 |
2,045 |
698 |
1,347 |
5,040 |
1,570 |
3,470 |
|
2010 |
7,275 |
3,859 |
3,416 |
2,109 |
714 |
1,395 |
5,099 |
1,570 |
3,529 |
|
2011 |
7,434 |
3,927 |
3,507 |
2,166 |
734 |
1,432 |
5,161 |
1,570 |
3,591 |
|
Total |
67,207 |
36,280 |
30,927 |
18,986 |
6,492 |
12,494 |
48,811 |
15,700 |
33,111 |
|
Low |
|||||||||
|
2002 |
5,450 |
3,076 |
2,374 |
1,445 |
505 |
940 |
4,316 |
1,462 |
2,854 |
|
2003 |
5,450 |
3,076 |
2,374 |
1,445 |
505 |
940 |
4,293 |
1,439 |
2,854 |
|
2004 |
5,450 |
3,076 |
2,374 |
1,445 |
505 |
940 |
4,261 |
1,407 |
2,854 |
|
2005 |
5,450 |
3,076 |
2,374 |
1,445 |
505 |
940 |
4,240 |
1,386 |
2,854 |
|
2006 |
5,450 |
3,076 |
2,374 |
1,445 |
505 |
940 |
4,212 |
1,358 |
2,854 |
|
2007 |
5,450 |
3,076 |
2,374 |
1,445 |
505 |
940 |
4,184 |
1,330 |
2,854 |
|
2008 |
5,450 |
3,076 |
2,374 |
1,445 |
505 |
940 |
4,157 |
1,303 |
2,854 |
|
2009 |
5,450 |
3,076 |
2,374 |
1,445 |
505 |
940 |
4,133 |
1,279 |
2,854 |
|
2010 |
5,450 |
3,076 |
2,374 |
1,445 |
505 |
940 |
4,103 |
1,249 |
2,854 |
|
2011 |
5,450 |
3,076 |
2,374 |
1,445 |
505 |
940 |
4,079 |
1,225 |
2,854 |
|
Total |
54,500 |
30,760 |
23,740 |
14,450 |
5,050 |
9,400 |
41,978 |
13,438 |
28,540 |
|
SOURCE: NRC analysis. |
|||||||||
TABLE D-8 Projected Inflow of Foreign-Trained Ph.D.s by Major Field: Medium, High, and Low Scenarios
|
Field and Year |
Biomedical |
Clinical |
Behavioral |
||||||
|
Medium |
High |
Low |
Medium |
High |
Low |
Medium |
High |
Low |
|
|
2002 |
1,003 |
1,785 |
977 |
504 |
724 |
483 |
93 |
200 |
82 |
|
2003 |
1,037 |
1,845 |
978 |
524 |
751 |
478 |
93 |
208 |
83 |
|
2004 |
1,064 |
1,901 |
979 |
548 |
782 |
478 |
94 |
216 |
83 |
|
2005 |
1,095 |
1,949 |
980 |
570 |
818 |
480 |
93 |
222 |
83 |
|
2006 |
1,126 |
2,010 |
983 |
592 |
846 |
480 |
94 |
228 |
83 |
|
2007 |
1,160 |
2,060 |
984 |
615 |
876 |
480 |
95 |
233 |
83 |
|
2008 |
1,190 |
2,123 |
986 |
643 |
909 |
480 |
95 |
240 |
83 |
|
2009 |
1,222 |
2,181 |
986 |
665 |
940 |
479 |
95 |
247 |
83 |
|
2010 |
1,255 |
2,234 |
988 |
685 |
969 |
479 |
95 |
256 |
83 |
|
2011 |
1,283 |
2,287 |
988 |
708 |
1,003 |
479 |
95 |
263 |
83 |
|
Total |
11,435 |
20,375 |
9,829 |
6,054 |
8,618 |
4,796 |
942 |
2,313 |
829 |
|
Stock, 2001 |
17,437 |
24,787 |
17,437 |
6,178 |
8,115 |
6,178 |
3,469 |
4,269 |
3,469 |
|
SOURCE: NRC analysis. |
|||||||||
reach this level. Variation is also evident for other groups. For example, in the medium scenario behavioral graduates increase by 400 over a decade; in the high scenario they increase by over 900; but in the low scenario they decrease by over 140. Note that some of these graduates are assumed not to enter the U.S. workforce but to move abroad.
Table D-8 shows the assumed number of entrants among foreign-trained Ph.D.s. The biomedical field should have the most entrants—1,000 a year, possibly rising to 2,000. By contrast, in the behavioral field 100 or 200 are projected annually. Total entrants over a decade will be substantial—at least 50 percent and possibly 100 percent of the initial stock of foreign-trained Ph.D.s in 2001, except in behavioral research.
THE GROWING WORKFORCE
Numbers
The projected workforce that absorbs these graduates and migrants is shown for each field in the medium scenario in Figure D-10. Projections shown for U.S.-trained Ph.D.s as well as for U.S.- and foreign-trained Ph.D.s combined are consistent with the historical series. Looking at all Ph.D.s by 2001, behavioral researchers increase to 176,400, clinical researchers increase to 41,700, and behavioral researchers increase to 134,500 (see Table D-9). The clinical field shows the fastest growth but is relatively small. Its total increase over 10 years by 16,400 will be only a third of the increase in the biomedical field and slightly smaller than the increase in the slow-growing behavioral field.
These increases are based on a calculated balance between inflows of U.S. graduates and foreign-trained researchers and outflows of retirees and decedents. The combined inflows are projected at 4.5, 6.5, and 3.5 percent of the workforce in the biomedical, clinical, and behavioral fields, respectively, and foreign-trained Ph.D.s represent a significant proportion of the clinical and biomedical research numbers (see Table D-10). Outflows of retirees are in the range of 1.2 to 1.7 percent annually, and deaths represent one-fourth to one-fifth of that number. In total these flows produce average annual growth rates of 3.0, 5.0, and 1.4 percent in biomedical, clinical, and behavioral research, respectively.
In the high scenario, annual increases will be roughly 30 percent larger and in the low scenario about 20 percent smaller. Annual increases will not be uniform across the decade. The behavioral field will experience slowing growth in each scenario, whereas the biomedical and clinical field scenarios will be marked by slowing growth in the low scenario but accelerating growth in the high scenario (see Figure D-11).
Composition of Growing Workforce
Those employed in science represent the most important component of the workforce, as shown in Table D-9. This table also shows the projected numbers to be roughly 90 percent of the potential workforce. This should be interpreted to mean that this proportion should be available for employment on the basis of the past distribution of the workforce and on the movement between employment status. However, whether these jobs will be available is not being predicted
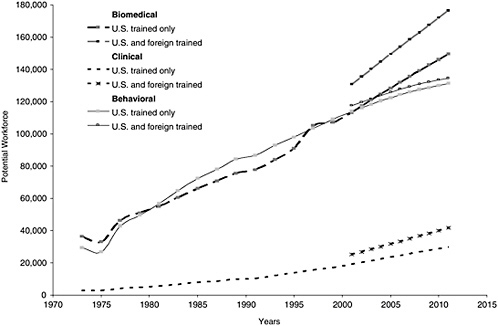
FIGURE D-10 Potential workforce as reported and projected including and excluding foreign trained medium scenario, 1973–2011.
SOURCE: National Science Foundation Survey of Doctorate Recipients and NRC analysis.
and will be discussed in a later section. These projected numbers of employed change in a complex fashion and can increase faster or slower than the workforce. In the biomedical field, annual increases in the employed are projected to be smaller than workforce increases; however, in the behavioral field the reverse will be true in the initial years.
Other components of the workforce, comprising all those not active in research, are shown in Table D-11. Those unemployed (not in the labor force or out of science) are projected to vary only slightly over time as percentages of the potential workforce in the medium scenario (see Figure D-12). Those outside science are the largest group of nonactive researchers. Annually, 1.5 to 1.6 percent of the workforce will move from science to nonscience employment, and an almost equal percentage will move in the other direction (see Table D-10). The variation in the percentage not active in science is due to changes in the age and sex composition of the workforce and not to changes in the probability that researchers become unemployed, exit the labor force, or take nonscience jobs. This probability is fixed in the projection model for each sex and age group and is not allowed to vary. However, in reality it may vary and whether it will depends on how many research positions are available in these fields; this issue is discussed later.
The composition of the projected workforce by sex is illustrated in Figure D-13, which counts only those in the employed category. Employed males outnumber employed females by more than 40,000 in the biomedical field. This gap will not change much, even though the percentage of employed females will rise from 31 to 35 by 2011. Males slightly outnumber females in clinical research employment, mainly due to foreign-trained Ph.D.s. If foreign-trained doctorates are excluded, females outnumber males by a few thousand with that gap growing. Finally, in the behavioral field, a cross-over is projected by 2004, with females overtaking males to reach 57 percent of the workforce by 2011, which represents 16,000 more females than males.
Median ages for the workforce will generally rise, notably by 4.1 years over a decade for male behavioral researchers, but increases will be substantially less for other main fields. For male clinical researchers, the median age will fall marginally. In each field those age 41 to 60 will decline as a
TABLE D-9 Projected Workforce and Employed Researchers, by Field, Three Main Scenarios, 2001–2011
|
Field and Year |
Potential Workforce |
Employed |
||||
|
Medium |
High |
Low |
Medium |
High |
Low |
|
|
Biomedical |
||||||
|
2001 |
130,726 |
138,076 |
130,726 |
114,889 |
120,776 |
114,889 |
|
2002 |
135,505 |
143,922 |
135,215 |
118,379 |
125,111 |
118,172 |
|
2003 |
140,203 |
149,792 |
139,514 |
121,912 |
129,584 |
121,426 |
|
2004 |
144,840 |
155,697 |
143,649 |
125,531 |
134,221 |
124,681 |
|
2005 |
149,446 |
161,663 |
147,654 |
129,236 |
139,019 |
127,941 |
|
2006 |
154,049 |
167,727 |
151,551 |
133,030 |
143,992 |
131,203 |
|
2007 |
158,605 |
173,830 |
155,291 |
136,843 |
149,059 |
134,392 |
|
2008 |
163,113 |
179,975 |
158,881 |
140,649 |
154,191 |
137,484 |
|
2009 |
167,584 |
186,172 |
162,323 |
144,436 |
159,379 |
140,464 |
|
2010 |
172,019 |
192,419 |
165,623 |
148,191 |
164,610 |
143,325 |
|
2011 |
176,400 |
198,703 |
168,770 |
151,889 |
169,864 |
146,046 |
|
Clinical |
||||||
|
2001 |
25,282 |
27,219 |
25,282 |
23,020 |
24,860 |
23,020 |
|
2002 |
26,838 |
29,084 |
26,732 |
24,580 |
26,706 |
24,483 |
|
2003 |
28,439 |
31,025 |
28,175 |
26,125 |
28,566 |
25,881 |
|
2004 |
30,059 |
33,014 |
29,584 |
27,686 |
30,467 |
27,246 |
|
2005 |
31,686 |
35,054 |
30,956 |
29,250 |
32,411 |
28,573 |
|
2006 |
33,332 |
37,138 |
32,292 |
30,818 |
34,382 |
29,856 |
|
2007 |
35,002 |
39,275 |
33,598 |
32,399 |
36,392 |
31,101 |
|
2008 |
36,679 |
41,456 |
34,861 |
33,978 |
38,436 |
32,298 |
|
2009 |
38,352 |
43,659 |
36,068 |
35,542 |
40,485 |
33,429 |
|
2010 |
40,031 |
45,902 |
37,234 |
37,102 |
42,564 |
34,512 |
|
2011 |
41,716 |
48,181 |
38,355 |
38,662 |
44,675 |
35,551 |
|
Behavioral |
||||||
|
2001 |
117,466 |
118,266 |
117,466 |
102,193 |
102,898 |
102,193 |
|
2002 |
119,737 |
120,783 |
119,589 |
104,951 |
105,871 |
104,820 |
|
2003 |
121,833 |
123,174 |
121,499 |
107,302 |
108,476 |
107,005 |
|
2004 |
123,862 |
125,548 |
123,297 |
109,464 |
110,928 |
108,956 |
|
2005 |
125,813 |
127,888 |
124,980 |
111,457 |
113,253 |
110,708 |
|
2006 |
127,670 |
130,178 |
126,526 |
113,319 |
115,491 |
112,288 |
|
2007 |
129,371 |
132,363 |
127,874 |
114,993 |
117,594 |
113,644 |
|
2008 |
130,892 |
134,408 |
128,998 |
116,462 |
119,528 |
114,752 |
|
2009 |
132,244 |
136,343 |
129,919 |
117,747 |
121,333 |
115,648 |
|
2010 |
133,450 |
138,176 |
130,649 |
118,884 |
123,034 |
116,354 |
|
2011 |
134,466 |
139,863 |
131,149 |
119,840 |
124,594 |
116,845 |
|
Ten-year increase |
||||||
|
Biomedical |
45,674 |
60,627 |
38,044 |
37,000 |
49,088 |
31,157 |
|
Clinical |
16,434 |
20,962 |
13,073 |
15,642 |
19,815 |
12,531 |
|
Behavioral |
17,000 |
21,597 |
13,683 |
17,647 |
21,696 |
14,652 |
|
Average annual growth (%) |
||||||
|
Biomedical |
3.00 |
3.64 |
2.55 |
2.79 |
3.41 |
2.40 |
|
Clinical |
5.01 |
5.71 |
4.17 |
5.18 |
5.86 |
4.35 |
|
Behavioral |
1.35 |
1.68 |
1.10 |
1.59 |
1.91 |
1.34 |
|
SOURCE: NRC analysis. |
||||||
TABLE D-10 Projected Annual Growth Rates, and Inflow and Outflow Rates (%) for the Potential Workforce,by Major Field, and Medium Scenario, 2001–2011
proportion of the workforce and essentially be replaced by those older than 60 (see Figure D-14). Additionally as seen in Figure D-13, the increase in older researchers will parallel the increase in the general population—though for age groups that may be off by one year—from Census Bureau projections.
MIGRANT SCENARIOS
Table D-12 shows how the workforce is divided between U.S.-trained and foreign-trained researchers. Over the decade, the foreign-trained group will increase from 13 to 15 percent for biomedical Ph.D.s and from 24 to 29 percent for clinical Ph.D.s. In behavioral research, which starts at only 3 percent, foreign-trained employed researchers will decline both in absolute numbers and relative to U.S.-trained researchers.
These figures understate the contribution that foreign-trained Ph.D.s make to the workforce. Notably, among
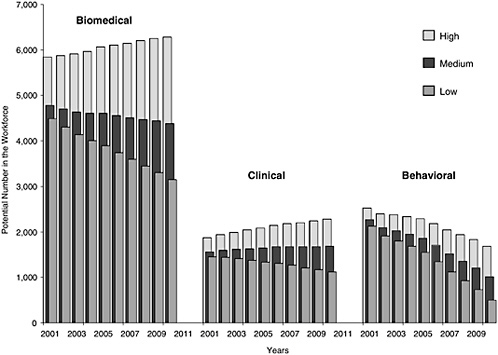
FIGURE D-11 Projected annual increase in the potential workforce in three scenarios by field 2001–2011.
SOURCE: NRC analysis.
TABLE D-11 Projected Workforce Not Active in Scientific Research, by Major Field, Medium Scenario, 2001–2011
|
Field and Year |
Out of Science |
Unemployed |
Not in Labor Force |
Total Not Active |
|
Biomedical |
||||
|
2001 |
9,323 |
1,125 |
5,389 |
15,837 |
|
2002 |
9,933 |
960 |
6,233 |
17,126 |
|
2003 |
10,425 |
925 |
6,941 |
18,291 |
|
2004 |
10,819 |
916 |
7,572 |
19,307 |
|
2005 |
11,152 |
923 |
8,134 |
20,209 |
|
2006 |
11,462 |
940 |
8,616 |
21,018 |
|
2007 |
11,765 |
963 |
9,033 |
21,761 |
|
2008 |
12,064 |
988 |
9,412 |
22,464 |
|
2009 |
12,356 |
1,013 |
9,779 |
23,148 |
|
2010 |
12,650 |
1,038 |
10,140 |
23,828 |
|
2011 |
12,954 |
1,062 |
10,495 |
24,511 |
|
Clinical |
||||
|
2001 |
1,700 |
137 |
426 |
2,263 |
|
2002 |
1,718 |
139 |
402 |
2,259 |
|
2003 |
1,794 |
144 |
375 |
2,313 |
|
2004 |
1,862 |
145 |
366 |
2,373 |
|
2005 |
1,916 |
148 |
371 |
2,435 |
|
2006 |
1,985 |
153 |
376 |
2,514 |
|
2007 |
2,064 |
159 |
381 |
2,604 |
|
2008 |
2,148 |
165 |
386 |
2,699 |
|
2009 |
2,241 |
172 |
397 |
2,810 |
|
2010 |
2,339 |
179 |
410 |
2,928 |
|
2011 |
2,441 |
185 |
426 |
3,052 |
|
Behavioral |
||||
|
2001 |
10,957 |
794 |
3,522 |
15,273 |
|
2002 |
10,915 |
577 |
3,293 |
14,785 |
|
2003 |
10,860 |
509 |
3,161 |
14,530 |
|
2004 |
10,816 |
481 |
3,101 |
14,398 |
|
2005 |
10,802 |
466 |
3,087 |
14,355 |
|
2006 |
10,788 |
461 |
3,101 |
14,350 |
|
2007 |
10,768 |
464 |
3,145 |
14,377 |
|
2008 |
10,758 |
469 |
3,202 |
14,429 |
|
2009 |
10,759 |
473 |
3,265 |
14,497 |
|
2010 |
10,761 |
477 |
3,328 |
14,566 |
|
2011 |
10,755 |
478 |
3,393 |
14,626 |
|
SOURCE: NRC analysis. |
||||
U.S.-trained Ph.D.s, as seen in Table D-5, 20 to 25 percent of the biomedical graduates are noncitizens on temporary visas, and an additional undetermined number are noncitizens on permanent resident visas. However, these numbers are uncertain. First, there are statistical uncertainties. There are no data available to distinguish permanent residents from U.S. citizens, and therefore future numbers could be affected by immigration policies. The data used on the foreign trained are very limited compared to the data on U.S.-trained Ph.D.s. Second, there are policy-based uncertainties due to the recent flux in immigration policies. Third, there are behavioral uncertainties because reactions to policy changes by potential immigrants as well as immigrants’ decisions to stay in the United States or to emigrate are difficult to predict. Although some statistical information is available, the data are not determinate nor necessarily easy to explain. For these reasons, additional scenarios to reflect possible paths that the inflow of noncitizens might take are addressed below.
There are four possibilities, and each is a variation of the medium scenario. First, stay rates might actually rise, particularly among temporary resident graduates. This possible rise, as discussed earlier, is modeled on the upward trend in stay rates since 1995. Second, stay rates could go in the opposite direction because potential migrants might be discouraged by bureaucratic difficulties, delay, and inconvenience. Therefore, the assumption can be made that temporary resident graduates might increase more slowly, showing a trend that is only 90 percent of the medium scenario. At the same time, the assumption could be made that the flow of foreign-trained migrants would immediately drop to 90 percent of its current estimated level and remain fixed throughout the projection. Third, assuming that immigration restrictions and obstacles are more severe than in the 90 percent scenario, temporary resident graduates could fall to 50 percent of the medium trend, and the flow of foreign-trained migrants could also fall to 50 percent of its current level and stay at that level. Finally, to illustrate an extreme possibility, the flow of both temporary resident graduates and the foreign trained could be reduced to zero.
Table D-13 compares these scenarios with the medium, high, and low scenarios. The behavioral research workforce is little affected by the assumed variations because the number of foreign-trained Ph.D.s are few. The focus instead is on the other two fields. In all fields the scenario of rising stay rates is little different from the medium scenario, giving only a 1 percent larger workforce by 2011. Increases in stay rates in the 1990s, even if they are real, appear to be of little quantitative significance for the workforce in the near term.
The other scenarios produce more variation. As a percentage of all entrants into the workforce (i.e., graduates and migrants), the foreign trained in biomedical research fall from 16 percent in the medium scenario to 13 percent in the 90 percent scenario and in clinical research from 27 to 22 percent. With this reduction of inflow, the 90 percent scenario produces a reduction in the total workforce by 2011 (relative to the medium scenario) of 2 to 4 percent. In other words, there would be a reduction of 3,700 biomedical researchers and 1,900 clinical researchers by 2001. The 50 percent scenario produces substantially more variation, giving workforces that are smaller than in the low scenario. This indicates that a 50 percent reduction in the inflow of foreign-trained and U.S.-trained graduates would affect the workforce more than would cutting back on all graduates from the medium to the low trend. The 0 percent scenario, finally, reduces the workforces in biomedical and clinical research

FIGURE D-12 Projected percent of workforce not active in research (out of science, not in the labor force, or unemployed) by field, 2001–2011.
SOURCE: NRC analysis.
by 14 and 20 percent, respectively, relative to the medium scenario. These reductions appear fairly severe, but the workforces would still grow over the decade at annual rates of 1.5 and 2.7 percent.
EMPLOYMENT PROJECTIONS
An expanding workforce will require a growing number of jobs, which leads to the question of whether enough jobs will be available. This question can be addressed in two ways. First, the trends in employment by sector are reviewed using some of the same data as in the workforce projections, but instead of looking at inflows and outflows by age and sex, only positions by broad sectors are looked at. Second, government projections for the national labor force and its components are looked at in an attempt to identify where the jobs will be in the future by industry and occupation.
Sectoral Trends and Projections
The Survey of Doctorate Recipients shows numbers employed by sector. These data come with caveats. The survey does not cover the foreign trained. The number of positions could also be underestimated from these data if some positions were unfilled.
In Figure D-15 six sectors are distinguished as listed below: faculty; other academic positions, excluding postdoctorates; industry, including self-employment; government;
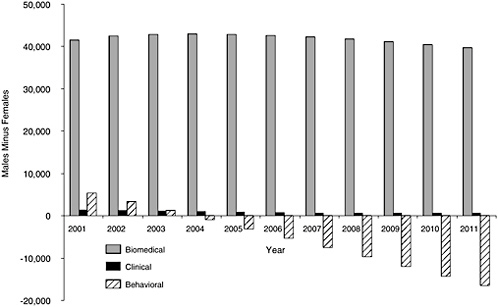
FIGURE D-13 Difference between numbers of employed males and females by field, 2001–2011.
SOURCE: NRC analysis.
other employment, mainly nonprofit groups; and all postdoctorate positions combined, around 75 percent of which are in academia. The largest of these sectors, in each of the three major fields, is faculty. However, industry appears to be catching up fast in the behavioral and biomedical fields. Other sectors have smaller numbers and show slower growth. Sector employment generally moves upward over time, apart from a discontinuity in the late 1980s or early 1990s. In this period, faculty employment in the biomedical and behavioral fields appears to have declined first, followed a few years later by a decline in industrial employment. Nonprofit employment and postdoctorate positions also showed declines. Since the early 1990s, all employment sectors show sustained growth, except for postdoctorates.
Beginning in the late 1990s, postdoctorate employment began to decline, so that by 2001 the numbers had regressed to about the levels of five years earlier (note that foreign-trained postdoctorates are not included here). Even before the decline the numbers of postdoctorates in the clinical and behavioral fields were small, but in the biomedical field employment of U.S.-trained postdoctorates was over 14 percent of total employment and 18 percent of academic employment at its peak.
Employment trends can be extrapolated from the 1990s, avoiding the earlier discontinuities. Specifically, by extrapolating from the five-year trend and using 1997–2001 data, the recent slowdown in growth in behavioral employment may be captured (though for biomedical and clinical employment, using 1991–2001 data would produce the same results). However, one may question whether it is right to ignore discontinuities around 1990 and whether such sectoral employment declines might not reoccur. A second extrapolation is produced from the 20-year trend, using 1981–2001 data, which captures the effects of the discontinuities. Since it is not possible to assign a possible employment decline to any particular future period, this extrapolation in effect reduces growth in each year in the future by a constant factor.
Table D-14 shows the regressions that were run, by major field and sector, with five-year (1997–2001) and 20-year (1981–2001) data. Applying the regression results gives projected 10-year increases in positions by sector shown in Table D-15 (the table also shows estimates based on Bureau of Labor Statistics projections, to be discussed next).
In projections based on the five-year trend, total employment of biomedical researchers appears to grow 2.6 percent annually from 2001 to 2011; employment of clinical researchers grows somewhat faster at 3.7 percent annually; and employment of behavioral researchers grows slowest at 1.7 percent annually. In projections based on the 20-year trend, overall employment growth is reduced for biomedical

FIGURE D-14 Age distribution (percent) of workforce by field, 2001–2011.
SOURCE: NRC analysis.
and clinical researchers but increased for behavioral researchers. If sectors were combined instead of distinguishing them before running regressions, results would actually be similar.
BUREAU OF LABOR STATISTICS PROJECTIONS
The projected growth rates can be compared with growth rates from the Bureau of Labor Statistics (BLS; see Table D-16). BLS produces national labor force projections covering a decade or so, the two latest covering 2000–2010 and 2002–2012.4,5 The dates do not exactly match this study’s workforce projections, but there is a bigger problem in matching occupational categories. BLS does not classify occupations by educational qualifications. Nevertheless, it is possible to roughly equate some of the BLS categories with the ones created for this report. The BLS category of “biological scientists” probably corresponds roughly to what is classified here as “biomedical researchers” (around 2000). The BLS category has about 90 percent as many individuals as the biomedical researchers category. Weaker comparisons can be made between BLS “medical scientists” and this report’s category of clinical researchers since the former are more than double the latter. The clinical researcher category includes only Ph.D.s and not M.D.s. The BLS categories of “psychologists,” “other social scientists” (which in the later BLS projections is expanded into two categories: “sociologists” and “miscellaneous social scientists and related workers”), and “speech-audio pathologists” are comparable to behavioral researchers. “Psychologists” alone compose 50 percent more than behavioral researchers, presumably because many without Ph.D.s are included, whereas “other social scientists” are few, fewer even than speech-language
TABLE D-12 Projected U.S.-Trained and Foreign-Trained Workforce and Employed Researchers by Field, Medium Scenario, 2001–2011
|
Field and Year |
Potential Workforce |
Employed |
||||
|
U.S. Trained |
Foreign Trained |
% Foreign |
U.S. Trained |
Foreign Trained |
% Foreign |
|
|
Biomedical |
||||||
|
2001 |
113,289 |
17,437 |
13.3 |
100,262 |
14,627 |
12.7 |
|
2002 |
117,175 |
18,330 |
13.5 |
103,148 |
15,231 |
12.9 |
|
2003 |
120,953 |
19,250 |
13.7 |
105,851 |
16,061 |
13.2 |
|
2004 |
124,661 |
20,179 |
13.9 |
108,544 |
16,987 |
13.5 |
|
2005 |
128,335 |
21,111 |
14.1 |
111,305 |
17,931 |
13.9 |
|
2006 |
131,992 |
22,057 |
14.3 |
114,147 |
18,883 |
14.2 |
|
2007 |
135,590 |
23,015 |
14.5 |
117,010 |
19,833 |
14.5 |
|
2008 |
139,135 |
23,978 |
14.7 |
119,875 |
20,774 |
14.8 |
|
2009 |
142,632 |
24,952 |
14.9 |
122,730 |
21,706 |
15.0 |
|
2010 |
146,082 |
25,937 |
15.1 |
125,564 |
22,627 |
15.3 |
|
2011 |
149,482 |
26,918 |
15.3 |
128,361 |
23,528 |
15.5 |
|
Clinical |
||||||
|
2001 |
19,104 |
6,178 |
24.4 |
17,180 |
5,840 |
25.4 |
|
2002 |
20,177 |
6,661 |
24.8 |
18,281 |
6,299 |
25.6 |
|
2003 |
21,273 |
7,166 |
25.2 |
19,344 |
6,781 |
26.0 |
|
2004 |
22,368 |
7,691 |
25.6 |
20,405 |
7,281 |
26.3 |
|
2005 |
23,454 |
8,232 |
26.0 |
21,459 |
7,791 |
26.6 |
|
2006 |
24,536 |
8,796 |
26.4 |
22,504 |
8,314 |
27.0 |
|
2007 |
25,621 |
9,381 |
26.8 |
23,546 |
8,853 |
27.3 |
|
2008 |
26,694 |
9,985 |
27.2 |
24,563 |
9,415 |
27.7 |
|
2009 |
27,744 |
10,608 |
27.7 |
25,541 |
10,001 |
28.1 |
|
2010 |
28,785 |
11,246 |
28.1 |
26,498 |
10,604 |
28.6 |
|
2011 |
29,818 |
11,898 |
28.5 |
27,444 |
11,218 |
29.0 |
|
Behavioral |
||||||
|
2001 |
113,997 |
3,469 |
3.0 |
99,146 |
3,047 |
3.0 |
|
2002 |
116,267 |
3,470 |
2.9 |
101,902 |
3,049 |
2.9 |
|
2003 |
118,368 |
3,465 |
2.8 |
104,256 |
3,046 |
2.8 |
|
2004 |
120,408 |
3,454 |
2.8 |
106,418 |
3,046 |
2.8 |
|
2005 |
122,375 |
3,438 |
2.7 |
108,416 |
3,041 |
2.7 |
|
2006 |
124,247 |
3,423 |
2.7 |
110,281 |
3,038 |
2.7 |
|
2007 |
125,960 |
3,411 |
2.6 |
111,957 |
3,036 |
2.6 |
|
2008 |
127,497 |
3,395 |
2.6 |
113,432 |
3,030 |
2.6 |
|
2009 |
128,868 |
3,376 |
2.6 |
114,729 |
3,018 |
2.6 |
|
2010 |
130,101 |
3,349 |
2.5 |
115,887 |
2,997 |
2.5 |
|
2011 |
131,154 |
3,312 |
2.5 |
116,874 |
2,966 |
2.5 |
|
SOURCE: NRC analysis. |
||||||
pathologists. To compare with behavioral researchers, these categories are totaled without weighting.
In the last two BLS projections, the number of employed implies an average annual growth rate for biological scientists of 1.8 to 1.9 percent; for medical scientists a rate of 2.4 percent; and among psychologists, other social scientists, and speech-language pathologists a combined rate of 2.1 to 2.2 percent. These growth rates are reasonably close to those estimated from 20-year trends. Note, however, that BLS constructs employment projections differently. BLS assumes a full-employment economy, takes labor supply into account, assesses growth in industries’ outputs and intermediate inputs, and applies occupational staffing patterns by industry, coupled with expert assessments of likely trends.6 The confluence of results from the BLS approach with at least our longer-term trend may provide some additional confidence.
In the past, BLS has underestimated growth in professional as well as service occupations.7 For 1988-2000 the Bureau’s projected annual growth rate for biological scientists of 2 percent was well below the actual growth rate of 3.3 percent, and the rate for psychologists of 2 percent was also well below the actual rate of 2.8 percent (for all occupations combined, the BLS projection was for 1.2 percent annual growth compared to the actual 1.6 percent growth rate). Furthermore, the BLS projected growth rates for 2000–2010 and 2002–2012 are even smaller than the rates projected for 1988–2000. If the new projections are similarly too conservative, the higher rates, at least for biomedical and clinical researchers, estimated from our five-year trend may be appropriate.
Applying BLS growth rates to the reported number of positions provides alternative projections of the positions to become available. These are shown in Table D-15. These projections do not represent actual BLS numbers but rather the numbers that would be obtained by applying their implied growth rates beginning in 2001. Estimates by sector are derived by partitioning total increases in proportion to increases in the 20-year trend projections.
The projections from the five-year trend clearly stand out. Over the decade the BLS growth rates, as well as the 20-year trend, imply an increase of about 20,000 biomedical researchers, but the five-year trend implies an increase of almost 30,000. Similarly, the BLS and the 20-year trend imply an increase of about 4,700 clinical researchers, as opposed to 7,700 from the five-year trend. How these projections compare with the projected workforce is the critical issue.
WORKFORCE VERSUS POSITIONS
Comparisons are made with projected U.S.-trained researchers because research positions have been projected from survey data limited to U.S. graduates. (The BLS projections presumably allow for migrants, but their growth rates are applied to our own base-sector employment num-
TABLE D-13 Percent Foreign Trained in Alternative Scenarios, Projected 2011 Total Workforce, and Comparisons of Total to Medium Scenario, by Field
|
Scenario |
% Foreign Trained Among Entrants (2002–2011) |
2011 Total Workforce |
Ratio to Medium Scenario Total Workforce |
|||||||||
|
Biomedical |
Clinical |
Behavioral |
Biomedical |
Clinical |
Behavioral |
Biomedical |
Clinical |
Behavioral |
||||
|
High |
23.3 |
31.2 |
4.5 |
198,703 |
48,181 |
139,863 |
1.13 |
1.15 |
1.04 |
|||
|
Rising |
15.8 |
26.6 |
2.0 |
178,203 |
42,011 |
135,139 |
1.01 |
1.01 |
1.01 |
|||
|
Medium |
15.8 |
26.6 |
2.0 |
176,400 |
41,716 |
134,466 |
1.00 |
1.00 |
1.00 |
|||
|
90% |
13.2 |
21.5 |
1.8 |
172,702 |
39,843 |
134,180 |
0.98 |
0.96 |
1.00 |
|||
|
50% |
8.7 |
14.2 |
1.0 |
163,699 |
36,886 |
133,105 |
0.93 |
0.88 |
0.99 |
|||
|
0% |
0.0 |
0.0 |
0.0 |
152,346 |
33,184 |
131,791 |
0.86 |
0.80 |
0.98 |
|||
|
Low |
15.3 |
24.9 |
1.9 |
168,770 |
38,355 |
131,149 |
0.96 |
0.92 |
0.98 |
|||
|
SOURCE: NRC analysis. |
||||||||||||
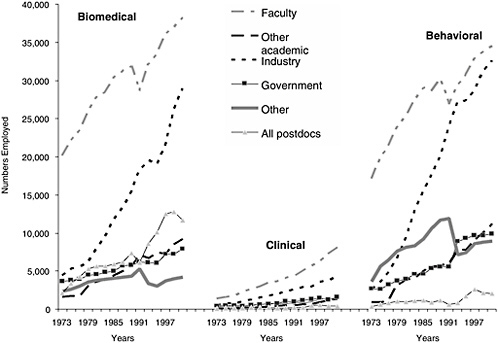
FIGURE D-15 Trends in employment by major field and sector, 1973–2001.
SOURCE: National Science Foundation Survey of Doctorate Recipients.
TABLE D-14 Linear Regressions for Trends in Employment in Various Sectors
|
|
1997–2001 Data |
1981–2001 Data |
||||||
|
Constant |
B |
t-test |
R2 |
Constant |
B |
t-test |
R2 |
|
|
Biomedical researchers |
||||||||
|
Faculty |
–1050820 |
544.25 |
8.44 |
0.986 |
–943405 |
490.08 |
6.88 |
0.840 |
|
Other academics |
–961154 |
485.00 |
5.92 |
0.972 |
–550611 |
279.69 |
15.65 |
0.965 |
|
Industry |
–3618579 |
1823.00 |
6.81 |
0.979 |
–1942012 |
984.15 |
16.98 |
0.970 |
|
Government |
–329386 |
168.50 |
1.89 |
0.781 |
–300883 |
154.16 |
12.02 |
0.941 |
|
Other |
–238397 |
121.25 |
12.18 |
0.993 |
20757 |
–8.42 |
–0.29 |
0.009 |
|
Postdoctorates |
430600 |
–209.25 |
–1.02 |
0.511 |
–784436 |
398.21 |
7.11 |
0.849 |
|
All employed |
–5773736 |
2935.75 |
7.12 |
0.981 |
–4500066 |
2297.61 |
19.18 |
0.976 |
|
Clinical researchers |
||||||||
|
Faculty |
–891776 |
449.75 |
10.42 |
0.991 |
–529538 |
268.42 |
15.27 |
0.963 |
|
Other academics |
–207292 |
104.25 |
4.49 |
0.953 |
–103572 |
52.32 |
9.65 |
0.912 |
|
Industry |
–418385 |
211.25 |
2.82 |
0.888 |
–292163 |
148.06 |
19.47 |
0.977 |
|
Government |
–67025 |
34.25 |
0.42 |
0.147 |
–104107 |
52.80 |
11.18 |
0.933 |
|
Other |
–12660 |
7.00 |
1.01 |
0.505 |
–85473 |
43.38 |
8.65 |
0.893 |
|
Postdoctorates |
57922 |
–28.75 |
–1.52 |
0.698 |
–33401 |
16.92 |
3.55 |
0.583 |
|
All employed |
–1539217 |
777.75 |
7.56 |
0.983 |
–1148253 |
581.90 |
18.02 |
0.973 |
|
Behavioral researchers |
||||||||
|
Faculty |
–740856 |
387.50 |
11.09 |
0.992 |
–750028 |
391.74 |
5.89 |
0.794 |
|
Other academics |
–1009329 |
510.00 |
46.49 |
1.000 |
–716760 |
363.48 |
15.09 |
0.962 |
|
Industry |
–1881172 |
956.50 |
4.95 |
0.961 |
–2296361 |
1164.63 |
19.79 |
0.978 |
|
Government |
–82699 |
46.25 |
1.81 |
0.766 |
–683510 |
346.82 |
8.89 |
0.898 |
|
Other |
–192626 |
100.75 |
7.67 |
0.983 |
69222 |
–30.17 |
–0.38 |
0.016 |
|
Postdoctorates |
247152 |
–122.50 |
–2.22 |
0.832 |
–137383 |
69.70 |
3.06 |
0.509 |
|
All employed |
–3648552 |
1873.00 |
12.95 |
0.994 |
–4512779 |
2305.16 |
31.26 |
0.991 |
|
SOURCE: Analysis based on National Science Foundation Survey of Earned Doctorates. |
||||||||
bers; consequently the resulting employment projections share the same limitation). Comparisons are made not with the potential workforce as a whole but with the numbers employed assuming that some proportion of the future workforce (as at present) will take jobs outside science, choose not to work, or be unemployed (possibly temporarily between jobs).
Table D-17 shows the comparisons between the projected numbers employed in the workforce and the projected numbers of positions from sector employment trends and BLS projections. Results vary by field, and Figure D-16 focuses on some key comparisons. On the one hand, U.S.-trained biomedical researchers will be close to the available number of positions in 2006 and 2011 if the five-year trend projections are correct. On the other hand, they will be about 4 percent too numerous in 2006 and 6 to 7 percent too numerous in 2011 if the 20-year projections and the BLS projections are correct. Possibly, a small deficit would not be an issue since it could presumably be filled by those projected not to be active in science or by foreign-trained Ph.D.s. A possible excess, however, could be more of an issue, particularly since the foreign-trained Ph.D.s, who are not in the comparison, appear to be increasing more rapidly than U.S.-trained biomedical researchers.
Where clinical researchers are concerned, each comparison indicates that the workforce will exceed future available positions. By 2011 the excess will be 10 percent if the five-year trend continues and about 25 percent whether the 20-year trend continues or the BLS is accurate. This is a relatively small field that is growing rapidly. Some adjustment to slower workforce growth can be expected in the future but at what point and what level is not possible to say.
However, the situation for behavioral researchers is different. By 2006 little by way of excess or deficit will be evident. By 2011 this will still hold if the five-year trend is correct. If the 20-year trend or the BLS projections are accurate, there will be a deficit in the number of U.S.-trained Ph.D.s of around 5 percent. Because there are fewer foreign-
TABLE D-15 Positions by Sector and Increases from 2001–2011 In Alternative Projections, by Major Field
|
Field and Sector |
Positions in 2001 |
5-Year Trend |
20-Year Trend |
Projected 10-Year Increase Based on BLS Rates for |
|
|
2000–2010 |
2002–2012 |
||||
|
Biomedical |
|||||
|
Facultya |
38,299 |
5,368 |
3,842 |
3,915 |
3,810 |
|
Other academic |
9,236 |
4,945 |
2,612 |
2,662 |
2,591 |
|
Industry |
28,935 |
18,539 |
8,170 |
8,325 |
8,103 |
|
Government |
7,886 |
1,582 |
1,254 |
1,278 |
1,244 |
|
Other |
4,213 |
1,224 |
–385 |
–392 |
–382 |
|
Postdoctorate |
11,655 |
–1,856 |
4,716 |
4,806 |
4,678 |
|
All sectors |
100,224 |
29,801 |
20,210 |
20,594 |
20,045 |
|
Clinical |
|||||
|
Facultya |
8,124 |
4,547 |
2,127 |
2,068 |
2,098 |
|
Other academic |
1,285 |
1,069 |
364 |
354 |
359 |
|
Industry |
4,413 |
2,026 |
1,171 |
1,138 |
1,155 |
|
Government |
1,604 |
247 |
479 |
466 |
473 |
|
Other |
1,339 |
78 |
429 |
417 |
423 |
|
Postdoctorate |
415 |
–309 |
207 |
201 |
204 |
|
All sectors |
17,180 |
7,659 |
4,777 |
4,643 |
4,711 |
|
Behavioral |
|||||
|
Facultya |
34,491 |
3,915 |
3,263 |
3,251 |
3,324 |
|
Other academic |
11,194 |
5,087 |
2,998 |
2,987 |
3,055 |
|
Industry |
32,561 |
9,788 |
13,143 |
13,093 |
13,390 |
|
Government |
9,877 |
433 |
4,073 |
4,058 |
4,149 |
|
Other |
8,960 |
1,023 |
–415 |
–413 |
–423 |
|
Postdoctorate |
2,093 |
–1,289 |
691 |
688 |
704 |
|
All sectors |
99,176 |
18,958 |
23,754 |
23,663 |
24,199 |
|
NOTE: BLS rates are Bureau of Labor Statistics employment projections. aTenured or on tenure track—those on nontenure track are counted under “Other academic.” SOURCE: Analysis based on National Science Foundation Survey of Earned Doctorates and Bureau of Labor Statistics employment projections (Hecker, 2001, 2004). |
|||||
trained migrant Ph.D.s, their numbers are unlikely to be sufficient to fill any gap. In principle, a deficit could be filled from the portion of the workforce with jobs outside science because this field is larger than the other two. However, whether this is practical would have to be investigated.
Therefore, the three fields have different prospects. Nor is each field homogeneous, being composed of a variety of specific disciplines and separate sectors. Although they deserve attention disciplines cannot be considered here. Instead sectoral trends are briefly examined.
SECTORAL PROSPECTS AND POSTDOCTORATES
Sectors
If employment grows according to the projections given here, the distribution by sector of those employed in science could show one important change: the balance could shift in the other direction of those employed as faculty (either tenured or on a tenure track) in the biomedical and social and behavioral fields in 2001 who outnumbered those in industry or self-employed by 2011. In the social and behavioral field this will happen whether growth is as slow as projected from the five-year trend or as fast as projected from the 20-year trend. But in the biomedical field it will happen only with the faster growth scenario from the five-year trend. However, academic employment in each field will still be higher than industrial employment if nonfaculty appointments and postdoctorates are taken into account.
Nontenure appointments are a growing part of academic employment. The growth has been steady since the 1970s. Those who are neither tenured nor on a tenure track are close to becoming half of all academic employees in the biomedical field. This proportion is lower in the other fields but is
TABLE D-16 Projected and Actual Growth Rates (%) for Various Occupational Groups
|
2001–2011 Projections |
Biomedical Researchers |
Clinical Researchers |
Behavioral Researchers |
|
||
|
1997–2001 Data |
2.60 |
3.69 |
1.75 |
|
||
|
1981–2001 Data |
1.84 |
2.45 |
2.15 |
|||
|
Bureau of Labor Statistics |
Biological Scientists |
Medical Scientists |
All Social Scientistsa |
Psychologists |
Other Social Scientists |
Speech-Language Pathologists |
|
2002–2012 Projection |
1.82 |
2.42 |
2.18 |
2.19 |
0.57 |
2.44 |
|
2000–2010 Projection |
1.87 |
2.39 |
2.14 |
1.62 |
1.25 |
3.27 |
|
1988–2000 Projection |
1.95 |
1.99 |
2.08 |
|||
|
1988–2000 Actual |
3.33 |
2.77 |
5.78 |
|||
|
aCombines psychologists, other social scientists, and speech-language pathologists. bNo reported data. SOURCES: Bureau of Labor Statistics rates are estimated from projections for 2002–2012 (Hecker, 2004), 2000–2010 (Hecker, 2001), and 1988–2000 (Alpert and Auyer, 2003) and data reported in Alpert and Auyer (2003). |
||||||
TABLE D-17 Excess or Deficit of U.S.-Trained Researchers in Relation to Various Projections of Research Positions
|
Field and Year |
Excess or Deficit Relative to Positions |
Excess or Deficit as % of Positions |
||||||
|
Projected from Trend Over |
Based on BLS Growth Rates to |
Projected from Trend Over |
Based on BLS Growth Rates to |
|||||
|
5 Years |
20 Years |
2010 |
2012 |
5 Years |
20 Years |
2010 |
2012 |
|
|
Biomedical |
||||||||
|
2002 |
–483 |
3,395 |
1,033 |
1,080 |
–0.5 |
3.4 |
1.0 |
1.1 |
|
2003 |
–712 |
3,800 |
1,810 |
1,905 |
–0.7 |
3.7 |
1.7 |
1.8 |
|
2004 |
–952 |
4,196 |
2,541 |
2,685 |
–0.9 |
4.0 |
2.4 |
2.5 |
|
2005 |
–1,124 |
4,659 |
3,302 |
3,499 |
–1.0 |
4.4 |
3.1 |
3.2 |
|
2006 |
–1,215 |
5,203 |
4,107 |
4,357 |
–1.1 |
4.8 |
3.7 |
4.0 |
|
2007 |
–1,284 |
5,768 |
4,894 |
5,200 |
–1.1 |
5.2 |
4.4 |
4.7 |
|
2008 |
–1,352 |
6,335 |
5,644 |
6,008 |
–1.1 |
5.6 |
4.9 |
5.3 |
|
2009 |
–1,430 |
6,892 |
6,344 |
6,768 |
–1.2 |
5.9 |
5.5 |
5.8 |
|
2010 |
–1,529 |
7,428 |
6,983 |
7,468 |
–1.2 |
6.3 |
5.9 |
6.3 |
|
2011 |
–1,664 |
7,927 |
7,543 |
8,092 |
–1.3 |
6.6 |
6.2 |
6.7 |
|
Clinical |
||||||||
|
2002 |
442 |
1,561 |
685 |
680 |
2.5 |
9.3 |
3.9 |
3.9 |
|
2003 |
727 |
2,042 |
1,322 |
1,311 |
3.9 |
11.8 |
7.3 |
7.3 |
|
2004 |
1,011 |
2,521 |
1,947 |
1,930 |
5.2 |
14.1 |
10.5 |
10.4 |
|
2005 |
1,287 |
2,993 |
2,554 |
2,530 |
6.4 |
16.2 |
13.5 |
13.4 |
|
2006 |
1,554 |
3,456 |
3,141 |
3,111 |
7.4 |
18.1 |
16.2 |
16.0 |
|
2007 |
1,818 |
3,916 |
3,714 |
3,678 |
8.4 |
20.0 |
18.7 |
18.5 |
|
2008 |
2,058 |
4,351 |
4,251 |
4,207 |
9.1 |
21.5 |
20.9 |
20.7 |
|
2009 |
2,258 |
4,747 |
4,737 |
4,686 |
9.7 |
22.8 |
22.8 |
22.5 |
|
2010 |
2,437 |
5,122 |
5,191 |
5,131 |
10.1 |
24.0 |
24.4 |
24.0 |
|
2011 |
2,605 |
5,487 |
5,621 |
5,553 |
10.5 |
25.0 |
25.8 |
25.4 |
|
Behavioral |
||||||||
|
2002 |
675 |
–272 |
581 |
537 |
0.7 |
–0.3 |
0.6 |
0.5 |
|
2003 |
1,150 |
–224 |
744 |
653 |
1.1 |
–0.2 |
0.7 |
0.6 |
|
2004 |
1,434 |
–369 |
667 |
529 |
1.4 |
–0.3 |
0.6 |
0.5 |
|
2005 |
1,553 |
–677 |
378 |
189 |
1.5 |
–0.6 |
0.3 |
0.2 |
|
2006 |
1,540 |
–1,118 |
–94 |
–335 |
1.4 |
–1.0 |
–0.1 |
–0.3 |
|
2007 |
1,337 |
–1,748 |
–805 |
–1,100 |
1.2 |
–1.5 |
–0.7 |
–1.0 |
|
2008 |
934 |
–2,579 |
–1,769 |
–2,121 |
0.8 |
–2.2 |
–1.5 |
–1.8 |
|
2009 |
352 |
–3,589 |
–2,964 |
–3,375 |
0.3 |
–3.0 |
–2.5 |
–2.9 |
|
2010 |
–368 |
–4,737 |
–4,351 |
–4,823 |
–0.3 |
–3.9 |
–3.6 |
–4.0 |
|
2011 |
–1,260 |
–6,056 |
–5,965 |
–6,501 |
–1.1 |
–4.9 |
–4.9 |
–5.3 |
|
SOURCE: NRC analysis. |
||||||||
rising just as insistently. The biomedical field is ahead in this trend mainly because of a high number of postdoctorates, which was rising until the late 1990s.
Postdoctorates
A specific look at postdoctorates is warranted, first those who are U.S. trained, since the foreign-trained postdoctorates data are not included in the sectoral data. Though many Ph.D. graduates may spend some time as postdoctorates, this period is generally short in comparison to other employment, so that at any given time postdoctorates are few relative to total employment. Among clinical and behavioral Ph.D.s, postdoctorates are only 1.5 to 3.5 percent of the total. In the biomedical field, though, they compose about 10 percent of total employment.
U.S.-trained postdoctorates are not necessarily young. Roughly 40 percent tend to be age 25 to 34, but about the
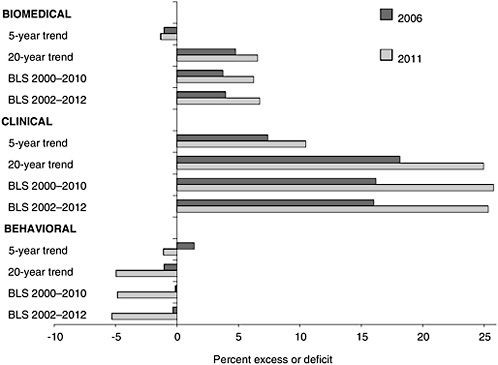
FIGURE D-16 Percent excess or deficit of U.S.-trained researchers in relation to various projections of research positions, 2006 and 2011.
SOURCE: NRC analysis and Bureau of Labor Statistics.
same proportion are 35 to 44. In the clinical and behavioral fields, about 20 to 25 percent are 45 and older. This is for years 1997, 1999, and 2001, across which there is little change. At younger ages, proportionally more of those employed are postdoctorates; this is particularly true in the biomedical field, where, under age 35, 50 percent of employed males and 60 percent of employed females are postdoctorates.
For the remainder of the postdoctoral pool, more limited information is available from department reports in the Graduate Student Survey, which was used to estimate the foreign-trained workforce. These reports indicate that postdoctorates with U.S. Ph.D.s, who have been considered first because of better information, are actually a minority in two fields, making up only 49 percent of biomedical postdoctorates and 40 percent of clinical postdoctorates in 2001. Among the much smaller contingent of behavioral postdoctorates they form a majority of 80 percent (see Figure D-17).
M.D.s and foreign-trained Ph.D.s take the remaining positions, M.D.s being more important among clinical postdoctorates and foreign-trained Ph.D.s more important among biomedical and behavioral postdoctorates. The trends for M.D.s and foreign-trained Ph.D.s are opposite. The percentage of clinical postdoctorates taken by M.D.s has fallen by more than a third in two decades, from 59 percent in 1983 to 37 percent by 2001. Over the same period, the percentage of postdoctorates taken by foreign-trained Ph.D.s roughly doubled in each of the three fields, reaching 39 percent in biomedical research, 22 percent in clinical research, and 18 percent in behavioral research. The importance of noncitizen researchers may be even greater than these figures indicate. Among U.S.-trained Ph.D.s with postdoctorates, a number are on temporary resident visas: 25 percent in biomedical research, 23 percent in clinical research, and 8 percent in behavioral research. These percentages have risen about as fast as those for foreign-trained Ph.D.s.
Note, however, that department reports are not entirely consistent with sector data. Figure D-18 matches comparable groups: academic postdoctorates in sector data (who must, because of the survey sample, have U.S. Ph.D.s) and postdoctorates with U.S. Ph.D.s in department data (who

FIGURE D-17 Postdoctorates reported by graduate departments, by field, degree, and visa status, 1983–2001.
SOURCE: National Science Foundation Survey of Graduate Students and Postdoctorates in Engineering and Science, 2001.
must be academic). The sector data suggest a surge in academic postdoctorates in the 1990s that does not appear in the department data, except among clinical researchers. In the clinical field, however, the department data indicate far more postdoctorates (even with M.D.s excluded) than the sector data. The definition of clinical disciplines may be different between surveys, and some of the postdoctorates in clinical departments might have biomedical Ph.D.s. It is also possible that our partitioning of temporary residents into U.S. trained and foreign trained is inaccurate and that the foreign trained are even more common than they appear among clinical Ph.D.s. However, these possible explanations cannot be verified, and the inconsistencies need further investigation.
If sector data (which provide ages) is relied upon and it is assumed that the proportions of Ph.D.s on postdoctorates stay constant by age, these proportions can be applied to the projected workforce to estimate the number likely to be seeking postdoctorates in the near future. This can be done only for U.S.-trained Ph.D.s—a significant but unavoidable limitation. Table D-18 shows their numbers as well as the numbers of projected postdoctorate positions, taken from the preceding sectoral projections.
Numbers and positions are compared in Figure D-19. U.S.-trained graduates seeking postdoctorates may or may not outnumber the positions available for them. In the biomedical field, individuals and positions may in fact be in balance if the 20-year trend continues, but individuals will be far too numerous—by 5,600 by 2001 or 57 percent more than the available positions—if the more recent downturn reflected in the five-year trend continues. In clinical research, individuals will outnumber positions by 15 percent even given the more optimistic 20-year trend in positions, and if the more pessimistic five-year trend comes to pass, the number of individuals will be a startling eight times greater than the number of positions available. Similarly, in behavioral research, there will be either 13 percent more individuals than there are positions available or four times the number of positions, depending on which projection is used. A projected downturn in positions derived from the five-year trend is responsible for the large shortfalls; this essentially extrapolates from the recent decline in the number of positions taken by U.S.-trained Ph.D.s. This decline at least partly reflects the rising share of postdoctorates taken by foreign-trained Ph.D.s. Whether the foreign inflows—which also include

FIGURE D-18 Postdoctorates compared from sector data and department reports, by field 1973–2001.
SOURCES: National Science Foundation Survey of Earned Doctorates, 2001, and National Science Foundation Survey of Graduate Students and Postdoctorates in Engineering and Science, 2001.
rising U.S.-trained temporary residents—will continue is uncertain.
CONCLUSION
This discussion began with the question of whether the right numbers of people are being trained for the future research workforce. To answer this question, first data on the workforce and its components were examined and then recent trends were modeled and projected into the future. Such workforce projections appear to have worked in the past. Projections from 1995 were generally accurate up to 2001, in the partial comparisons that are possible with current data.
Nevertheless, the projections have limitations, rooted especially in inadequate data. Projections have been made only for Ph.D. researchers and not for M.D. researchers since there was only a rough estimate of the numbers of the latter. Our projections for foreign-trained Ph.D.s are based on dated and inconsistent data. Rates were assumed for movement between statuses that are constant within age groups, and adequate information was not available on trends in rates. A basic assumption could be made that future trends will resemble past trends. Trends in graduates (and to a degree in prior enrollment levels) are assumed to follow a future course modeled on past trends. Migration is assumed to follow previous trends, though alternatives were also modeled. Retirement ages are assumed to maintain their current distribution. Graduation, migration, and retirement are discretionary behaviors that could be postponed at will, within limits, or possibly accelerated, but no attempt was made to model the factors underlying such decisions.
The projections have been extended in another dimension
TABLE D-18 Projected U.S.-Trained Postdoctorates and Positions for U.S.-Trained Postdoctorates by Field, Alternative Scenarios, 2001–2011
|
Field and Year |
Postdocs in Workforce |
Projected Positions from Trend Over |
|||
|
Medium |
High |
Low |
5 years |
20 years |
|
|
Biomedical |
|||||
|
2001 |
12,711 |
12,711 |
12,711 |
11,655 |
11,655 |
|
2002 |
12,726 |
12,820 |
12,627 |
11,682 |
12,787 |
|
2003 |
12,819 |
13,025 |
12,613 |
11,473 |
13,186 |
|
2004 |
12,950 |
13,278 |
12,617 |
11,263 |
13,584 |
|
2005 |
13,214 |
13,686 |
12,739 |
11,054 |
13,982 |
|
2006 |
13,515 |
14,149 |
12,882 |
10,845 |
14,380 |
|
2007 |
13,916 |
14,721 |
13,111 |
10,636 |
14,779 |
|
2008 |
14,291 |
15,282 |
13,309 |
10,426 |
15,177 |
|
2009 |
14,695 |
15,871 |
13,524 |
10,217 |
15,575 |
|
2010 |
15,052 |
16,416 |
13,690 |
10,008 |
15,973 |
|
2011 |
15,392 |
16,948 |
13,843 |
9,799 |
16,371 |
|
Clinical |
|||||
|
2001 |
507 |
507 |
507 |
415 |
415 |
|
2002 |
546 |
554 |
540 |
364 |
470 |
|
2003 |
585 |
601 |
570 |
336 |
487 |
|
2004 |
620 |
643 |
594 |
307 |
503 |
|
2005 |
659 |
694 |
623 |
278 |
520 |
|
2006 |
705 |
751 |
658 |
249 |
537 |
|
2007 |
750 |
808 |
690 |
221 |
554 |
|
2008 |
785 |
855 |
713 |
192 |
571 |
|
2009 |
813 |
895 |
727 |
163 |
588 |
|
2010 |
834 |
930 |
735 |
134 |
605 |
|
2011 |
859 |
967 |
744 |
106 |
622 |
|
Behavioral |
|||||
|
2001 |
2,391 |
2,391 |
2,391 |
2,093 |
2,093 |
|
2002 |
2,527 |
2,543 |
2,512 |
1,907 |
2,157 |
|
2003 |
2,651 |
2,685 |
2,617 |
1,784 |
2,226 |
|
2004 |
2,746 |
2,800 |
2,693 |
1,662 |
2,296 |
|
2005 |
2,842 |
2,917 |
2,765 |
1,539 |
2,366 |
|
2006 |
2,905 |
3,002 |
2,806 |
1,417 |
2,435 |
|
2007 |
2,968 |
3,090 |
2,845 |
1,294 |
2,505 |
|
2008 |
3,021 |
3,167 |
2,873 |
1,172 |
2,575 |
|
2009 |
3,072 |
3,245 |
2,900 |
1,049 |
2,645 |
|
2010 |
3,109 |
3,308 |
2,912 |
927 |
2,714 |
|
2011 |
3,144 |
3,369 |
2,919 |
804 |
2,784 |
|
SOURCE: NRC analysis. |
|||||
to cover not only the workforce but also the positions that will become available. Positions are projected based on employment trends by sector and give results that appear comparable to occupational projections from the BLS. However, whether past employment trends will be sustained in the future is not known. Societal changes, such as the aging of the population, the increasing need for and complexity of health care, and the growing importance of science-based decision making could affect the demand for health research.
Without attempting to assess such factors, these projections of positions rely on past sectoral trends—which, it should be noted, presumably also reflect substantial and sometimes unexpected societal changes. Comparing these projections with workforce projections gives some limited and tentative answers to the initial question. The answers differ by field. Biomedical researchers are probably being graduated in sufficient numbers for the next decade (2001–2011), though perhaps they will be a few percentage points too numerous. Clinical Ph.D.s, however, seem to be headed for a situation of substantial oversupply. This field includes substantial numbers of M.D.s, who are not projected, that category is smaller but growing more rapidly than the other fields, so the trajectory is somewhat uncertain. Finally, behavioral researchers are on a trend that will lead largely to balance until the end of the decade, at which time a slight deficit is possible.
These statements refer only to U.S.-trained researchers. Foreign-trained researchers are an important and increasing part of the workforce in the biomedical and clinical fields. The research positions they fill are not distinguished from those taken by U.S.-trained researchers (but are not reflected in our sectoral employment data). Therefore the balance, or lack of balance, between the U.S.-trained workforce and positions filled by foreign-trained researchers presents a partial and somewhat artificial picture.
The complications introduced by foreign-trained researchers are evident from the perspective of postdoctorates. U.S.-trained researchers on postdoctorates declined in the late 1990s, and if this trend continues, a substantial oversupply of those seeking postdoctorates may emerge. However,
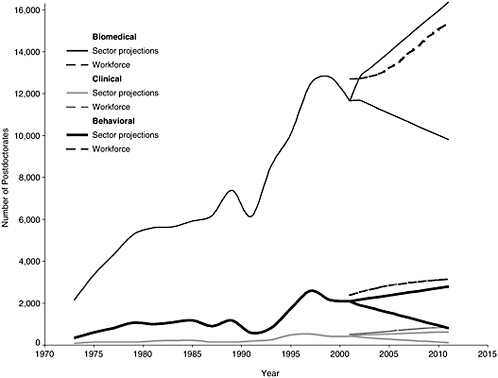
FIGURE D-19 Reported and projected U.S.-trained postdoctorates and postdoctorate positions, 1973–2011.
SOURCES: National Science Foundation Survey of Doctorate Recipients; and NRC analysis.
this decline may actually indicate a replacement of U.S.-trained with foreign-trained researchers, who are increasing rapidly in the postdoctorate pool in the biomedical and clinical fields. If this proves to be the case, the uncertain prospects for future migrants may substantially affect the prospects for bringing the numbers of U.S.-trained researchers seeking postdoctorates into balance with the numbers of positions that, from past trends, will be available to them.


