
3
Raw Materials and Minerals Supply
It is important to remember that there are four stages in the life cycle of a mineral: (1) geological mineral deposits are mined and processed into refined materials, (2) refined materials (few if any minerals are economically interesting as mined) are subsequently utilized in either civilian or defense manufacturing industries to produce end products, which are (3) used for a certain period of time before they become obsolete and (4) enter waste management where they are either recycled or discarded in landfills. Trade in all products along the cycle arises from changes between countries in terms of their resource endowment, industry structure, and consumer preferences. This chapter analyzes changes in different parts of the mineral cycle.
The National Defense Stockpile (NDS) is an inventory of raw materials held in various forms such as ingots, pressed powders, and so on. These materials have been held (and, more recently, sold) against the backdrop of a global minerals market that since the 1970s and the height of the cold war has changed dramatically on both the supply and the demand side. These changes can be considered in five categories:
-
Increasing demand for minerals from both industrial and developing countries,
-
Dramatic changes in where minerals come from,
-
Volatile markets and pricing,
-
Corporate consolidation in the global mineral industry, and
-
Increased vulnerabilities in the mineral supply chain.
Part of the change in the minerals market can be traced to the major shifts under way in globalized world markets and economies in general. Economists have sought to capture these developments by positing the notion of BRIC economies, with the acronym standing for Brazil, Russia, India, and China (Wilson and Purushothaman, 2003). It is predicted that by 2040 the combined economies of the four BRICs will be larger than the combined economies of France, Germany, Italy, Japan, the United Kingdom, and the United States. Emerging market economies, most notably China, have become the dominant materials consumers as their industrial and consumer needs are met. China is also a major supplier of raw materials. The increasing demand has pushed mineral prices up to new highs over the last 10 years (see Figure 3-1).
A recent report of the United States Geological Survey (USGS, 2007) states as follows:
The extent to which economic growth in developing countries, especially China and India, can lead global economic growth will be of increasing significance. China’s economic development has been the main impetus for higher commodity prices in the last few years. If China is able to continue that development to the level of Europe, Japan, and the United States and if India also continues to develop its economy, mineral consumption is likely to continue to grow for a number of years.
Meanwhile, as discussed later in this chapter, mining production in the United States has seriously eroded over the past three decades. Perhaps even worse is the situation for mineral processing, with domestic processing plants and smelters having been closed. Some material mined in the United States has to be sent abroad for smelting or other processing. The result is an increasing dependence on imported minerals in both raw and processed forms.
The resulting volatility in today’s minerals market—in terms of price, supply, and demand— compared to 30 years ago adds complexity and uncertainty to planning, purchasing, and managing decisions, such as those taken by the Department of Defense (DoD) and its contractors in the provision of defense systems. In the seven decades since the National Defense Stockpile (NDS) was established there have been marked changes in who is purchasing and using minerals and metals in the global market and where those minerals and metals are being obtained and processed.
GLOBAL MINERAL USE
The 20th century was characterized by a rapid increase in the wealth of the then industrializing countries—a trend that accelerated from decade to decade in the latter half of the century. Economic data from the International Monetary Fund (IMF) for the years 1950 through 2004 show that in a little more than 50 years, the global economy grew from $7.1 trillion to $56 trillion in constant (inflation
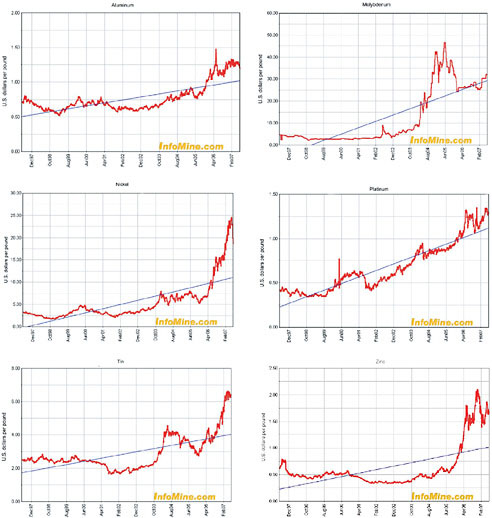
FIGURE 3-1 Price data for aluminum, molybdenum, nickel, platinum, tin, and zinc from 1997 to 2007. SOURCE: Infomine.com.
adjusted) U.S. dollars. This is equivalent to an annual growth rate of 3.8 percent over more than 5 decades. Growth has continued since, with the gross world product in 2006 estimated by the Central Intelligence Agency at $66 trillion.1
The demand for minerals (and for energy) grows with the global economy,
|
1 |
See the CIA World Factbook, available at https://www.cia.gov/library/publications/the-world-factbook/. Accessed July 2007. |
and growth in the 20th century and since was fueled by unprecedented growth in raw materials use on a global scale, with the United States and Europe being the dominant users of raw materials. The output of mines around the world is a good indicator of these changes. During the 20th century, for instance, tin production increased threefold since 1900, and aluminum production grew 3,000-fold over the same time period (USGS, 2007).
More recent data show that since 2000 many developing economies, such as the BRIC economies, have experienced above-average economic growth. IMF data show that annual growth in GDP in emerging market economies over the last 6 years has been two to three times greater than the growth of GDP in industrialized countries.2 Such rapid growth is being fueled by the greater consumption of industrial minerals.
This increasing global activity can be seen from the history of crude steel production in six countries. Since steel production is a principal user of a variety of alloying elements—such as chromium, nickel, and molybdenum—crude steel production is a good indicator for the use of other materials as well. Figure 3-2 shows that in 1953, U.S. steel production reached 100 million metric tonnes (MT) per year, which is about the current level of production. At that time, China’s crude steel production was 1.8 MT per year; by 2006, China was producing 422 MT per year, more than four times as much as the United States. In the last 2 years alone, China added about 150 MT per year to its production capacity.
GLOBAL DISTRIBUTION OF GEOLOGICAL MINERAL RESOURCES
A fundamental factor in the global materials market is that Earth’s mineral resources, while vast, are very unevenly distributed geographically. Economically recoverable concentrations are irregularly concentrated in discrete geologic environments around the world. Historically, the minerals industry has focused on world-class deposits (Singer, 1995), which are sizeable and high grade (quality) and have the greatest economic value. These world-class deposits have supplied large portions of the world’s industrial requirements over the last century. They include cobalt from the Congo; chromium, platinum-group metals, and manganese from South Africa; tungsten, rare earths, and antimony from China; bauxite from Jamaica; manganese from Ukraine; platinum-group metals from Russia; nickel from Canada; and molybdenum from the United States, to name but a few.
Since many known, most available mineral ore deposits, especially those in Europe and North America, have already been fully utilized or cannot be brought into production owing to environmental concerns, exploration for new sources of
|
2 |
See the IMF World Economic Outlook Report at http://www.imf.org/external/pubs/ft/weo/2007/01/index.htm. Accessed July 2007. |

FIGURE 3-2 Annual raw steel production. SOURCE: International Iron and Steel Institute (2007); U.S. Geological Survey (2007). BR, Brazil; CN, China; IN, India; JP, Japan; RU, Russia; UK, United Kingdom; and US, United States.
needed minerals and mining operations will continue to expand to more remote locations around the world. There are many steps needed to bring minerals from these undeveloped sources to the market—exploration, development, extraction, processing, refining, manufacturing, and marketing. All of these steps are expensive and—for geological, technical, economic, sociological, and political reasons—often uncertain and very risky. A mineral deposit can be developed only when the recovery and processing can be done at a profit. As the market value of a particular commodity increases, the economic incentive increases to develop deposits that are either physically or chemically more challenging. Human innovation and technology also influence which deposits can be economically recovered. For instance, the United States is mining much poorer grades of copper and iron than many other countries because a technology advantage makes the mining effort economically competitive. Figure 3-3 shows the average yield of copper from U.S. ore since 1950.
Higher demand and higher prices continue to push mineral production into
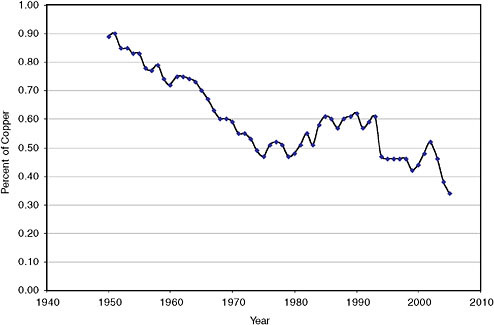
FIGURE 3-3 Average yield of U.S. copper over time. Yield here is defined as the recovery rate from the ore excluding overburden. Yield is used here as a first-order approximation of the average ore grade. Data show the average yield has decreased by half over the last 50 years. SOURCE: U.S. Bureau of Mines and the U.S. Geological Survey.
emerging and undeveloped countries around the globe, bringing higher costs for development and transportation. Overseas sourcing and production also bring new political vulnerabilities if, for example, a foreign government is able to control the export. The rarer or more valuable a particular mineral or material, the more likely it is that some sort of policy will influence its supply. The threat of export cut-offs is particularly burdensome if there is no alternative source, domestic or foreign, of the mineral at a competitive price.
It is important to note another potential source of materials that is largely ignored in the current supply assessments. These is scrap material that could be recycled or reused. A longer discussion of recycling can be found in Chapter 5. The largest U.S. export by weight is scrap metal (steel, aluminum, and copper).
U.S. MINING AND PROCESSING SECTORS
Because mining activities usually follow economic rules and focus on the richest ores available at the time, taking account of the safety and reliability of the potential mining sites, the mineral concentration of mined ores is continu-
ally declining. The yield of copper in the United States, reflecting the grade of the copper ore, decreased from 1950 to 2006 from about 0.9 percent to 0.34 percent (Figure 3-3). The decrease in the grade of an ore can have significant implications for the environment and for the mining costs since it can affect waste (tailings) and the energy and water used for extraction and concentration of the mineral, depending on the extraction technique used. Although the United States tends to have fairly competitive operating costs—the U.S. workforce is technically competent and can operate automated systems—mining operations are shifting to countries that are often less developed and have higher grade ores, lower labor costs, and lower environmental standards. As a result, the U.S. demand for minerals is increasingly being met by offshore mining and ore processing facilities. The most striking indicator of this change is the increasing dependence of the United States on imported of minerals to support the domestic economy.
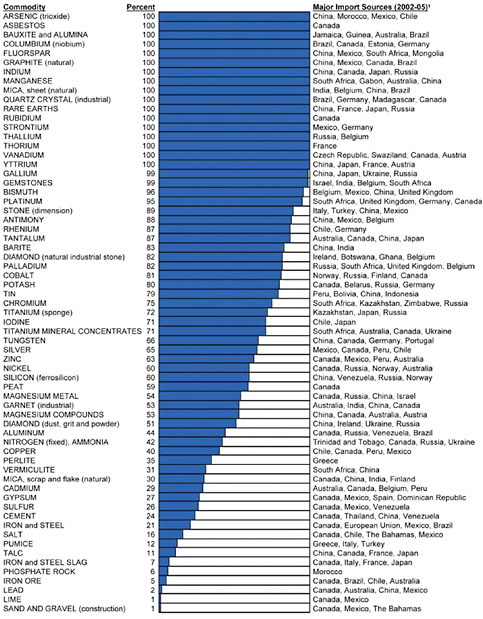
USGS data show that in 1980 the United States depended 100 percent on imports for 4 minerals and 30 to 99 percent on imports for 16 minerals. Twelve years later, in 1992, the United States was 100 percent dependent on imports for 8 minerals and 30 to 99 percent dependent on imports for 22 other minerals. In 2006, the U.S. imported 100 percent of its supply of 17 minerals and over 50 percent of its supply of 45 of the 65 minerals reported (Figure 3-4). The trend is clear: We are in increasingly dependent on importing select minerals and metals to fuel domestic economic activity.
Figure 3-4 shows that the United States obtains critical minerals from many developing countries—Chile, China, Gabon, Guinea, India, Madagascar, South Africa, Ukraine, and so on. Some of these countries have been major mineral sources for decades. Other countries that were previously remote and undeveloped are relatively new sources. As mentioned above, at issue here is not merely a dependence on foreign imports, but whether the foreign countries in question have a history of political instability, hostility, or volatility. The heavy dependence on foreign imports also magnifies the effect of other nations’ trade policies—for example, export or investment restrictions—on the U.S. supply chain.
The implications for the United States have been of concern for some time, as concluded by a study (NRC, 1990) that noted as follows: “The United States has consistently maintained that a strong domestic minerals and metals industry is an essential contributor to the nation’s economic and security interests” and that the industry “provides the material foundation for U.S. manufacturing.” The study went on to say
the United States is among the world’s largest consumers of nearly every metal, much of which is imported. Since many of the world’s mineral resources are located in areas where political instability and/or economic manipulation represent a potential threat to supply, it is essential for the United States to ensure some degree of independence
from foreign control over supply and costs through domestic participation in this industry.
Unless a strategy building on areas of U.S. comparative advantage is pursued, the current competitiveness of the domestic industry versus foreign competitors is likely to be transitory…. The competitiveness of the domestic industry must in future depend increasingly on … technology. (NRC, 1990, p. 2)
For the last several decades, there has been an ongoing debate regarding the weakening U.S. minerals and metals industry. The number of mining operations, processing facilities, and metal fabricating plants has been on the decline. Numerous studies have examined this trend and the country’s increasing dependence on foreign sources of mineral and materials commodities (GAO, 1981; Jordan and Kilmarx, 1979; Kessel, 1990; NRC, 1990; Youngquist, 1990).
The reduction in U.S. mining production has been caused by a combination of economic and social considerations. As the metal content of ores in the United States declines, the cost of mining and processing those ores increases. Increased environmental awareness and regulation have added to the operational costs of mining and have placed social pressure on mining companies to limit operations. For whatever reason a U.S. mining operation shuts down, restarting it in response to supply interruptions could be very time consuming and expensive.
The same is true of mineral processing, where domestic processing plants were also closed for economic or environmental reasons. The NRC report suggested that some of our international competitors did not impose such heavy burdens or else they subsidized the producers who had to implement them (NRC, 1990). The report recommended that in order for the domestic minerals and metals industry to survive, there must be “long-term commitment to a continuing reevaluation of the problems and opportunities facing the industry.”
This loss of domestic mineral processing capacity is pertinent to the discussion of stockpiles or reserves of materials important to national security. Should access to overseas mineral processing facilities be interrupted for an extended period, it would be neither quick nor easy to restart domestic operations even for those materials that do exist within our borders, owing to a lack of critical physical infrastructure and experienced mining professionals.
As discussed above, many of the materials the U.S. now routinely imports in large quantities were once produced domestically in quantities sufficient to meet national requirements. Table 3-1 provides data on U.S. primary production, apparent consumption, and world production for eight key commodities. In nearly every case, U.S. demand for the commodity has increased with time, while domestic production has declined, resulting in a greater U.S. dependence on foreign sources and a small U.S. presence on the supply side of the world market.
TABLE 3-1 Data on U.S. Primary Production, Apparent Consumption, World Production, and U.S. Share of World Production for Eight Commodities
|
Commodity |
U.S. Primary Production (MT) |
U.S. Apparent Consumption (MT) |
World Production (MT) |
U.S. Share of World Production % |
|
Aluminum |
|
|
|
|
|
1945 |
449,000 |
772,000 |
870,000 |
51.6 |
|
1965 |
2,498,000 |
2,850,000 |
6,310,000 |
39.6 |
|
1985 |
3,500,000 |
5,210,000 |
15,400,000 |
22.7 |
|
2004 |
2,516,000 |
6,590,000 |
29,800,000 |
8.4 |
|
Chromium |
|
|
|
|
|
1945 |
3,800 |
251,000 |
318,000 |
1.2 |
|
1965 |
0 |
893,000 |
1,490,000 |
0.0 |
|
1985 |
0 |
433,000 |
3,180,000 |
0.0 |
|
2004 |
0 |
555,000 |
5,380,000 |
0.0 |
|
Copper |
|
|
|
|
|
1945 |
1,010,000 |
1,650,000 |
2,110,000 |
47.9 |
|
1965 |
1,550,000 |
1,980,000 |
4,660,000 |
33.3 |
|
1985 |
1,060,000 |
2,140,000 |
7,990,000 |
13.3 |
|
2004 |
1,260,000 |
2,550,000 |
14,600,000 |
8.6 |
|
Lead |
|
|
|
|
|
1945 |
450,000 |
915,000 |
1,250,000 |
36.0 |
|
1965 |
385,000 |
1,000,000 |
2,700,000 |
14.3 |
|
1985 |
487,000 |
1,130,000 |
3,390,000 |
14.4 |
|
2004 |
148,000 |
1,480,000 |
3,110,000 |
4.8 |
|
Molybdenum |
|
|
|
|
|
1945 |
14,000 |
12,200 |
16,300 |
85.9 |
|
1965 |
35,100 |
23,300 |
44,700 |
78.5 |
|
1985 |
49,200 |
17,200 |
98,400 |
50.0 |
|
2004 |
41,500 |
23,900 |
141,000 |
29.4 |
|
Nickel |
|
|
|
|
|
1945 |
1,050 |
109,000 |
145,000 |
0.7 |
|
1965 |
12,300 |
156,000 |
425,000 |
2.9 |
|
1985 |
4,730 |
197,000 |
813,000 |
0.6 |
|
2004 |
0 |
212,000 |
1,390,000 |
0.0 |
|
Tungsten |
|
|
|
|
|
1945 |
2,390 |
3,060 |
10,900 |
21.9 |
|
1965 |
3,430 |
6,700 |
27,000 |
12.7 |
|
1985 |
983 |
8,210 |
46,600 |
2.1 |
|
2004 |
0 |
12,600 |
73,700 |
0.0 |
|
Zinc |
|
|
|
|
|
1945 |
694,000 |
773,000 |
1,470,000 |
47.2 |
|
1965 |
902,000 |
1,230,000 |
4,310,000 |
20.9 |
|
1985 |
261,000 |
961,000 |
6,760,000 |
3.9 |
|
2004 |
189,000 |
1,160,000 |
9,600,000 |
2.0 |
|
NOTE: Apparent consumption is a calculated figure equal to Production + Imports − Exports +/− (Stock Change). Data are provided for four specific years: 1945, 1965, 1985, and 2004. SOURCE: USGS (2005), online only: http://minerals.usgs.gov/ds/2005/140/. |
||||
RESTRUCTURING IN THE GLOBAL MINERAL SECTOR
The main emerging economies, such as are found in the BRIC countries, are developing their domestic mineral resources to meet both their internal markets and large export markets, with many of their mining companies becoming significant players in the global mineral market in their own right. Another recent trend in the global minerals industry is that with the increasing demand for minerals, Africa, with its geologically rich but largely unexplored areas, is likely to play an increasingly important role in the global minerals market. China’s increasing appetite for raw materials and its dearth of domestic resources in certain minerals make it increasingly dependent on raw material imports. To shore up the security of its resource supply lines, Beijing has started to build strategic alliances with countries throughout Africa (Alden, 2005; French, 2007; Large, 2007; Mwega, 2007). In 2005 China overtook the United Kingdom to become Africa’s number three trade partner. The United States is number one and France is number two. The $8.1 billion China lent to only three countries (Angola, Mozambique, and Nigeria) in 2006 far exceeded the $2.3 billion contributed in the same period by the World Bank (French, 2007). Its efforts have included building hospitals, schools, roads, and railways in return for access to energy and mineral resources, and as a result China’s government-owned companies are locking in exclusive mineral and petroleum rights in Africa. For example, in the Democratic Republic of Congo (DRC), a country with enormous untapped mineral wealth, China is installing concentration facilities to improve the cobalt being shipped.
To make more effective use of the assets already available to the industry and to better scale themselves to world markets, mining companies around the world engaged in a wave of merger and acquisition activity through the late 1990s and early 2000s and sought to use their assets more effectively. They expanded and diversified their operations vertically and horizontally to develop more predictable sales through the economic cycles.3 The big international metals and mining companies continue to expand and are identifying their targets very precisely, with specific goals to secure and control raw materials and obtain a larger market share. They are obtaining new capacity either by direct acquisition or by capital investment in new facilities (Box 3-1).
The global trends that are only touched on here are causing the mineral market to become more centralized and integrated. There are benefits and risks involved in this consolidation. The major risk of consolidation is that there is an associated risk that fewer players and less competition in the materials market might lead to increased prices. On the benefit side, the large, diversified mineral companies are
|
3 |
See David Humphreys, Corporate Strategies in the Global Mining Industry (2002). Available at http://www.dundee.ac.uk/cepmlp/journal/html/vol12/article12-9.html. Accessed June 2007. |
|
BOX 3-1 Recent Consolidation in the Mining Sector In 2002 the three largest diversified miners—Rio Tinto, BHP Billiton, and Anglo-American—ccounted for around 30 percent of the market capitalization of the mining sector. This compared with 15 percent in 1990. BHP Billiton is the largest international mining company today, with 38,000 employees working in more than 100 operations in approximately 25 countries. BHP Billiton, with 2006 sales of $39 billion (2002 sales were $17 billion) is the largest supplier of iron ore, the second largest coal exporter, the second largest copper mining company, the third largest nickel miner, the fourth largest uranium miner, and the sixth most important aluminum ore miner. In 2006, there were a number of significant mining and metal industry mergers and acquisitions. Falconbridge Ltd. and Inco Ltd., which had initially proposed merging, became the objects of multiple takeovers. Swiss-based Xstrata PLC took control of Canadian miner Falconbridge (one of the world’s biggest nickel and copper producters). The Brazilian company Companhia Vale do Rio Doce (CVRD), acquired Inco, one of Canada’s leading mining companies, for C$ 19 billion, The new company, CVRD-Inco, is now the world’s fifth-largest producer of nickel, copper, and iron ore. In addition, the Indian company Tata Steel Ltd. made an offer for Corus Group plc, a much larger european firm. In aluminum, Russian producers RUSAL and SUAL also merged, creating a monopoly on the Russian aluminum market. The world’s largest steel company, Arcelor Mittal, was born when Mittal Steel, led by Indian national Lakshmi Mittal, acquired the European steel company Arcelor (Aston et al., 2004; Reed, 2007), Arcelor Mittal is the first truly international steel company, and it counts among its assets remnants of several legendary U.S. steel companies, including Bethlehem Steel, Inland Steel, LTV, and Weirton Steel. At the end of 2006, U.S. mining company Phelps Dodge, the world’s second-largest copper producer, was acquired by fellow U.S. company Freeport-McMoRan Copper & Gold. |
stronger and more able to weather the market slumps that would close smaller companies. Their access to capital resources allows them to make major investments in new production capacity in the developing world. They are better able to accept the geopolitical risks of third-world exploration and development. The effects of such consolidation on supply assurance and stockpile strategy are far from clear.
CONCLUSIONS
As described in this chapter, mining and mineral processing are increasingly global enterprises. The emerging economies, including the BRIC countries, are becoming larger consumers of minerals and having more influence on the supply base as well. The worldwide capacity for mining and refining of minerals is increasingly located outside the United States, which itself is increasingly reliant on foreign sources of minerals in their various forms. In the committee’s judgment, foreign
dependence is not, per se, a cause for concern. But it may become so when combined with political instability in the source regions and greater competition for mineral resources across the globe. The decrease in the U.S. share of world consumption calls into question its historical ability to command supply in times of shortage. As will be explored at more length in Chapter 5, the committee believes that other mitigating actions, such as the possibility of scrap recycling as a source of supply, must be considered.
Historically, the committee’s judgment is that NDS policy has been driven by concern over supply interruptions rather than price spikes (indeed, the legislation governing NDS policy disallows the pursuit of economic stabilization objectives). And in the new environment characterized by greater threats from nonstate actors, the risk of supply interruptions has arguably increased. Although supply interruptions almost certainly will trigger price increases, under some circumstances price shocks may not result in expanded supply, particularly within the time horizon relevant for defense planning. The committee believes that stockpile policy should continue to give supply assurance priority over price stabilization when it comes to defense-critical strategic materials.
Although U.S. dependence on imports of many defense-critical strategic materials has increased, it is a necessary but not a sufficient reason for designating a defense-critical material as a candidate for stockpiling. Building on the criteria suggested in the 1975 GAO report, the criteria for including a material in the NDS could now include:
-
U.S. dependence on imports,
-
Concentration of supplies among a small number of regions or enterprises,
-
The potential for political instability in key supplier regions, and
-
The lack of substitutes for the defense applications in which the materials are incorporated.
Defense-critical materials that meet all or a significant subset of these criteria have been (or should be) the focus of stockpile policy, and the committee believes that changes in the global economy described above have affected a number of these criteria for a few materials. However, there is little evidence that these changes in the global economic and political environment have influenced stockpile policy and management.
REFERENCES
Alden, C. 2005. China in Africa. Survival 47 (3):147-164.
Aston, Adam, and Michael Arndt. 2004. A new Goliath in Big Steel. Business Week online, November 8.
French, H.W. 2007. Commentary: China and Africa. African Affairs 106 (422):127.
General Accounting Office (GAO). 1981. Materials Shortages and Industrial Bottlenecks: Causes, Trends, Prospects.
Jordan, A.A., and R.A. Kilmarx. 1979. Strategic Mineral Dependence: The Stockpile Dilemma. Vol. VII, The Washington Papers. Beverly Hills, Calif.: SAGE Publications.
Kessel, Kenneth A. 1990. Strategic Minerals: U.S. Alternatives. Washington, D.C.: National Defense University Press.
Large, Daniel. 2007. A ‘Chinese scramble’? The politics of contemporary China-Africa relations. African Affairs 106 (422):141-143.
Mwega, Francis M. 2007. China, India, and Africa: Prospects and challenges. In African Development Bank International Conference on Accelerating Africa’s Development Five Years into the Twenty-First Century. Tunis, Tunisia.
National Research Council (NRC). 1990. Competitiveness of the U.S. Minerals and Metals Industry. Washington, D.C.: National Academy Press.
Reed, S. 2007. Mittal & Son: An inside look at the dynasty that dominates steel, Business Week, April 16.
Singer, D.A. 1995. World class base and precious metal deposits; a quantitative analysis. Economic Geology 90 (1):88-104.
Tse, Pui-Kwan. 2007. USGS 2005 Minerals Yearbooks Vol III - China. U.S. Geological Survey.
USGS (U.S. Geological Survey). 2007. Mineral Commodity Summaries 2007. Reston, Va.: USGS.
Wilson, D., and R. Purushothaman. 2003. Dreaming with BRICs: The path to 2050. Goldman Sachs.
Youngquist, W. 1990. Mineral Resources and the Destinies of Nations. Portland, Ore.: National Book Company.


