
7
The Role of Health Care
The U.S. health care system differs from the systems of other countries in a number of ways that could conceivably lead to differences in life expectancy. Social and health care policies are generally better integrated in the other countries considered here, for example, and access to health care is not as limited by the ability to pay. Health insurance is almost universal in Europe, Canada, Australia, and Japan, whereas 50.7 million people in the United States did not have health insurance in 2009 (DeNavas-Walt et al., 2010). Another way in which European health systems may differ from the system in the United States is related to their orientation toward patient services. It is sometimes argued that European health care systems have a stronger focus on primary care as compared with a greater emphasis on specialist care in the United States. Evidence on this matter is mixed. Organisation for Economic Co-operation and Development (OECD) data indicate that the percentage of physicians (36 percent) who are specialists in the United States is the same as the average for other OECD countries (McKinsey Global Institute, 2007, Exhibit 37). However, the United States scores in the bottom group of OECD countries (6 out of 18) on a scale of the adequacy of primary care (Macinko et al., 2003). This scale is built from items relating to policy, finance, and personnel.
The adequacy of primary care is likely to be related to disease prevention. On several indicators of actual performance in preventive medicine for the older population, the U.S. performance is mixed. The United States ranks ninth among 23 OECD countries in the proportion of the population above age 65 offered an annual influenza vaccination (Organisation for Economic Co-operation and Development, 2007), although the propor-
tion actually receiving one is not exceptionally high (see Table 7-1). On the age-standardized death rate above age 50 from influenza, the United States ranks sixth among 16 OECD countries (Preston and Ho, 2010). The proportion of individuals having their blood pressure checked in the past year is higher in the United States than in four other English-speaking countries (Schoen et al., 2004, Exhibit 6). In this study, however, U.S. physicians were less likely to send out reminders for preventive care than physicians in the other countries (Schoen et al., 2004, Exhibit 6). Eighty percent of Americans have a physician they see regularly, a lower percentage than that in six other OECD countries (Schoen et al., 2007). On screening for major cancers, a form of preventive medicine, the United States ranks first among OECD countries (Howard et al., 2009).
Efforts to identify early stages of a disease—for example, through screening—are sometimes termed “secondary prevention” and are a principal responsibility of the health care system. One could take a broader view of the responsibilities of the health care system and include among them the prevention of harmful personal behaviors such as smoking, lack of exercise, and excess calorie consumption (Murray and Frenk, 2010), sometimes termed “primary prevention.” From this vantage point, as noted in previous chapters, the U.S. health care system performs poorly. This report addresses these behaviors individually, however, and this chapter focuses more narrowly on the health care system—the array of hospitals, physicians, and other health care professionals; the techniques they employ; and the institutions that govern access to and utilization of these resources. Efforts to identify early stages of a disease, for example, through screening, is sometimes called “secondary prevention” and is a principal responsibility of the medical system.
ACCESS TO HEALTH CARE
Access to health care in the United States is limited by the availability of health insurance, with 16.7 percent of the resident population lacking coverage (DeNavas-Walt et al., 2010). The young—both adults and children—are most likely to lack health insurance. Only 10 percent of the uninsured are aged 55 or older; only 2 percent of those 65 and over are uninsured, compared with 13 percent of those 55–64.
Data from the National Health and Nutrition Examination Survey (NHANES), 2003–2006, for those aged 55–64 reveal that uninsured and insured adults do not differ significantly in the prevalence of many health conditions and risk factors. The two groups are similar in levels of ever having had cancer (uninsured 10.2 percent, insured 10.5 percent) or a heart attack (4.7 and 4.6 percent), although the insured report a somewhat higher prevalence of stroke (1.9 versus 3.2 percent), diabetes (10.2 versus
TABLE 7-1 Indicators of Health Care Costs, Health Care Access, Appropriate Use of Services, and Health Care System Efficiency Across Selected Countries
|
Indicator |
United States |
Canada |
France |
Germany |
Netherlands |
United Kingdom |
Japan |
Australia |
|
Per capita health care expenditures, 2005 ($U.S.)a |
6,347 |
3,460 |
3,306 |
3,251 |
3,192 |
2,580 |
2,474 |
|
|
% of population >65 receiving flu shot, 2004b |
65 |
62 |
68 |
48 |
73 |
71 |
43 |
|
|
% primary care MD use of electronic records, 2005c |
28 |
23 |
42 |
98 |
89 |
79 |
||
|
% chronically ill skipping care because of costs, 2007c |
42 |
14 |
20 |
5 |
9 |
26 |
||
|
% records of test results not available |
22 |
18 |
12 |
9 |
17 |
14 |
17 |
|
|
% went to emergency room when not appropriate |
21 |
19 |
6 |
8 |
11 |
8 |
16 |
|
|
Administrative costs, 2004 ($U.S.)d |
465 |
131 |
238 |
172 |
132 |
57 |
52 |
|
|
Practicing MDs, 2006 (per 1,000)a |
2.4 |
2.1 |
3.4 |
3.8 |
2.5 |
2.1 |
2.0 |
|
|
Acute hospital beds (per 10,000), 2005a |
2.7 |
2.8 |
3.7 |
6.4 |
3.1 |
2.3 |
8.2 |
|
|
Prescription drugs, 2005 (grams per capita relative to U.S. = 100)e |
100 |
146 |
171 |
85 |
|
94 |
56 |
|
|
MRIs, 2006 (per 1 million)a |
26.5 |
6.2 |
5.3 |
7.7 |
6.6f |
5.6 |
40.1f |
|
|
% waited >6 months for elective surgery, 2007c |
4 |
14 |
|
3 |
2 |
15 |
|
|
|
% MD recommended treatment w/o benefits, 2007c |
20 |
12 |
|
20 |
13 |
10 |
|
|
|
Generalist MD annual remuneration, 2004 (in thousands of $U.S.)g |
161 |
107 |
92 |
[77]h |
117 |
118 |
|
|
|
NOTES: aData from Organisation for Economic Co-operation and Development (2008). Exchange rate determined using OECD measure of purchasing power parity (PPP). bData from Cylus and Anderson (2007). cData from Schoen et al. (2007). dExpenditures on health administration and insurance by private insurers and central and local authorities. eData from Danzon and Furukawa (2008). f2005 data. gData from Peterson and Burton (2007). hSpecialist income; likely an upper bound on generalist income. SOURCES: Garber and Skinner (2008), except for % test results of records not available; % went to emergency room when not appropriate; and data for Australia, which are from Commonwealth Fund National Scorecard on U.S. Health System Performance (Commonwealth Fund, 2008). |
||||||||
12.5 percent), and obesity (36.6 versus 39.5 percent). On the other hand, a recent review of the effects of lack of insurance by the Institute of Medicine (2009) concludes that uninsured men and women are much less likely to receive clinical preventive services (primarily secondary prevention) that have the potential to reduce unnecessary morbidity and premature death. Moreover, uninsured chronically ill adults are more likely to delay or forgo visits with physicians and clinically effective therapies, including prescription medications. Uninsured adults are more likely as well to be diagnosed with later-stage cancers that are detectable at earlier stages by screening or by contact with a clinician who can assess worrisome symptoms. Without health insurance, adults also are more likely to die from trauma or other serious acute conditions, such as heart attack or stroke.
The Institute of Medicine (2002) has estimated that 18,000 people aged 25–64 die each year because they lack health insurance. This calculation assumes a mortality rate for the uninsured that exceeds that of the insured by 25 percent. A recent update of this analysis found that those without health insurance had 40 percent higher mortality than the insured in the age range 17–64 (Wilper et al., 2009). An assumption of 40 percent higher mortality would result in 45,000 excess deaths in this age range attributable to a lack of health insurance. This estimate suggests that only a small number of total deaths over age 50 are likely to result from a lack of insurance: if 13 percent of those aged 50–64 are uninsured, and the excess mortality for this group is 40 percent, the excess mortality among all persons aged 50–64 due to a lack of insurance is about 5 percent.
Access to health care in the United States also is affected by the ability to pay for services not covered by insurance. Even those with insurance can find it difficult to pay the high costs of copayments and uncovered drugs. The percentage of adults in the United States who say that they have had an access problem because of costs is far higher than that in other high-income countries (see Table 7-1). In the United States, for example, 42 percent of chronically ill adults indicate that they have forgone some care because of costs in the past year, while this is true of only 5 percent of chronically ill people in the Netherlands.
EFFICIENCY AND COST OF CARE
The United States spends 16 percent of its gross domestic product (GDP) on health care, a higher figure than for any other country. Japan and France, two countries with substantially higher life expectancies, spend only 8 percent and 11 percent of their GDP on health care, respectively (Organisation for Economic Co-operation and Development, 2008). One factor in the higher U.S. costs is a high level of expenditure on administration of services. Table 7-1 shows that administrative costs per capita in the United
States are 9 times those in Japan and the United Kingdom and 3.5 times those in the Netherlands. Also contributing to the high costs in the United States is the high prevalence of major illnesses, described in Chapter 2, and the high proportion of the U.S. population diagnosed with a disease that is being treated for it (e.g., Thorpe et al., 2007). This combination produces a high usage of physician services in the United States. Survey data on physician visits for the population aged 50+ in Europe and the United States show that the United States in 2004 ranked fourth among 12 countries on the proportion of this population who had visited a physician in the past year. Some of the high treatment costs in the United States also are undoubtedly driven by physicians’ incentives under a predominantly fee-for-service health care system (Garber and Skinner, 2008). And physicians earn substantially higher salaries in the United States (see Table 7-1).
On several other indicators of efficiency that may also be related to survival—use of information technology, appropriate use of emergency rooms, and appropriate availability of medical records—the United States ranks very poorly (see Table 7-1). It is interesting to note, however, that the Netherlands, which ranks as extremely efficient on all of these measures, is one of the other countries that in the past has had relatively poor life expectancy trends.
INTERNATIONAL COMPARISONS QUALITY OF HEALTH CARE AND IMPLICATIONS FOR LIFE EXPECTANCY
Costs and efficiency aside, how does the U.S. health care system compare with those of other countries in preventing death from various diseases? Mortality rates are determined by disease incidence, detection, and treatment. Incidence reflects not just the performance of a health care system but also a variety of other characteristics affecting population health, including behavioral, social, and genetic factors. These characteristics are not unrelated to the health care system but are perhaps less directly a product of that system than disease identification and treatment. This section considers how the U.S. health care system compares with those of other countries in detecting and treating specific diseases and conditions.
International Comparisons of Detection and Treatment of Cancer
The United States compares well with other countries on both identifying and treating cancer (Preston and Ho, 2010). First, in international comparisons of the frequency of cancer screening, the United States scores consistently higher than any other country. Howard and colleagues (2009) compare U.S. data from the Health and Retirement Study (HRS) and the 2004 Medical Expenditure Panel Surveys with data on 10 countries from
the Survey of Ageing, Health and Retirement in Europe. The frequency of screening was much higher in the United States than in the European composite. The European/U.S. ratio for frequency of screening for ages over 50 ranged from 0.22 to 0.60 for mammograms, 0.36 to 0.49 for colon cancer screening, 0.55 to 0.88 for pap smears for cervical cancer, and 0.56 to 0.64 for PSA tests for prostate cancer. In most of the comparisons of screening by age, the United States had a higher frequency than any other country (Garcia, 2010; Howard et al., 2009). Preston and Ho (2010) show that the international differences in screening frequency for prostate and breast cancer were present in earlier years as well. Given this higher rate of screening, one would expect higher cancer incidence rates in the United States because a greater percentage of those with cancer are actually identified (Crimmins et al., 2010; Preston and Ho, 2010). Higher levels of screening should also lead to earlier detection and increased survival with treatment.
In terms of cancer survival, the United States compares quite well with Europe; however, some or all of this survival advantage may be a reflection of earlier detection. On the other hand, early detection itself offers survival benefits. During the late 1980s, 5-year survival rates in the United States were higher than those in all of the 18 European countries surveyed for each of the major cancers: lung, breast, prostate, colon, and rectal (Gatta et al., 2000). A more recent study examining survival rates during the period 2000-2002 led to a similar conclusion: 5-year survival was higher in the United States than in a European composite for all major types of cancer (Verdecchia et al., 2007). As can be seen in Table 7-2, when all cancers are included, 66.3 percent of American men survived for at least
TABLE 7-2 Five-Year Relative Survival Rates for Various Cancers
5 years compared with 47.3 percent of European men, and 62.9 percent of American women survived for 5 years compared with 55.8 percent of European women. The advantage among men was much larger than the advantage among women mainly because of high U.S. survival rates from prostate cancer.
Recommended levels of screening for breast and prostate cancer are controversial. Most of the controversy relates not to the survival advantages of frequent screening but to the occurrence of false positives and the side effects of biopsy and treatment. Evidence that frequent screening and early detection influence survival from breast and prostate cancer is reviewed by Preston and Ho (2010). Most of the evidence indicates that early detection of cancer followed by the typical treatment regimen can alter the clinical course of the disease and produce a survival advantage. One exception is a randomized U.S. trial of expanded prostate cancer screening that found no survival advantage in the first 8 years of the trial among the group offered expanded screening (Andriole et al., 2009). This trial, however, was conducted in a country in which 59 percent of men over age 65 are already receiving an annual PSA test (Howard et al., 2009). This factor, clearly reflected in the control group and in pretrial conditions, made it more difficult to identify a survival effect. A larger trial in Europe, where routine testing is less frequent, showed a significant survival advantage for those offered expanded screening (Schröder et al., 2009).
Early detection of cancer would not produce survival advantages unless effective methods of treatment were employed. Randomized trials of radiation and surgical removal for prostate cancer demonstrate their survival benefits relative to “watchful waiting,” a particularly common strategy in Scandinavia. Treatment appears to be unusually aggressive in the United States once prostate cancer has been detected, although the data are less abundant on treatment than on screening (Preston and Ho, 2010).
Has the combination of extensive screening and aggressive treatment reduced mortality due to prostate cancer in the United States relative to other countries? Preston and Ho (2010) compare age-standardized mortality rates from prostate cancer from 1980 to 2005 in the United States and a set of OECD countries (Australia, Austria, Canada, Finland, France, Germany, Greece, Italy, Japan, the Netherlands, Norway, Spain, Sweden, Switzerland, and the United Kingdom). The United States saw a significantly faster decline in prostate cancer mortality over this period, which included approval of PSA testing by the Food and Drug Administration in 1986 (see Figure 7-1). By 2003, the mortality rate for prostate cancer in the United States was 20.4 percent lower than the average for the other countries. One population model suggested that two-thirds of the drop in prostate cancer mortality from 1990 to 1999 in the United States was attributable to increased PSA testing and one-third to improved treatment (Etzioni et al., 2008).
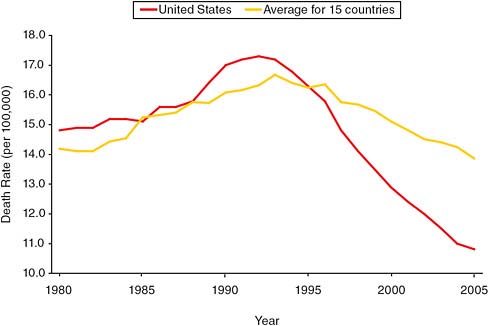
FIGURE 7-1 Age-standardized death rates from prostate cancer, 1980–2005, in the United States and 15 OECD countries.
SOURCE: Preston and Ho (2010, Figure 9-3). Reproduced with permission.
Breast cancer appears to present a similar picture (Preston and Ho, 2010). In contrast with prostate cancer, however, its incidence is affected by a number of risk factors, such as childlessness, delayed childbearing, obesity, and hormone replacement therapy. This means mortality trends cannot be interpreted unambiguously for this form of cancer in terms of health care practices.
As noted above, the United States uses mammograms to screen for breast cancer more frequently than do European countries. Probably as a result, breast cancer is caught, on average, at an earlier stage in the United States than in Europe (Sant et al., 2004). Once detection occurs, there appear to be no large differences in treatment regimens between Europe and the United States, although treatment has tended to be somewhat more aggressive in the United States, and U.S. doctors may have adopted new treatments somewhat more quickly than doctors in other countries (Preston and Ho, 2010). Studies of women diagnosed with breast cancer between 1990 and 1992 (Sant et al., 2004) and between 2000 and 2002 (Verdecchia et al., 2007) found that the 5-year survival rate in the United States was about 10 percentage points higher than that in Europe in both periods. The researchers who made these comparisons concluded that the U.S. advantage
in survival rates was due to earlier diagnosis and more aggressive treatment of the cancer once it had been detected.
As Figure 7-2 shows, the United States has also seen a more rapid (and statistically significant) drop in breast cancer mortality since 1990 relative to other OECD countries, although breast cancer mortality has been declining in all high-income countries. This decline is not likely to be due to improvements in risk factors as the risk factors for breast cancer have, if anything, worsened; obesity has risen, and women have been bearing children increasingly later in life. The one exception is the decrease in the use of hormone therapy after 2002 (see Chapter 8). Thus it appears likely that the decreases in breast cancer deaths are attributable to improved screening and treatment. Berry and colleagues (2006) conducted a careful simulation of the decline in breast cancer mortality in the United States and concluded that about two-thirds of the decline from 1990 to 2000 was attributable to increased use of adjuvant therapy and one-third to screening. Das and colleagues (2005) supported this conclusion with a study showing that those states with higher levels of screening had lower levels of cancer mortality when other factors were taken into account. As with prostate cancer, the U.S. health care system may have outperformed the health care systems of
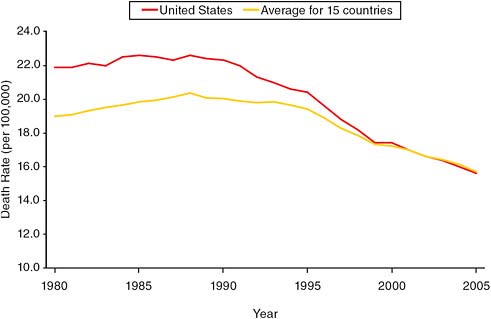
FIGURE 7-2 Age-standardized death rates from breast cancer, 1980–2005, in the United States and 15 OECD countries.
SOURCE: Preston and Ho (2010, Figure 9-4). Reproduced with permission.
other high-income countries in preventing death from breast cancer. This successful performance may be one reason why Glei and colleagues (2010) find that cancer (apart from lung cancer) has had less of an effect on life expectancy trends in the United States than in most other countries.
International Comparisons of Detection and Treatment of Cardiovascular Disease
It is more difficult to compare the effectiveness of health care systems in dealing with cardiovascular disease than to do so for cancer because there are no national registries for heart disease and stroke as there are for cancer. Still, data are available on both treatment and survival rates that allow some country-to-country comparisons.
Two major risk factors for cardiovascular disease are high serum cholesterol and high blood pressure. A relatively large percentage of people in the United States have been diagnosed with both conditions (see Chapter 2). Table 7-3 indicates the proportion of individuals aged 50+ reporting having been diagnosed with high cholesterol and receiving medication for this condition. The table shows that among those diagnosed with high cholesterol, a higher proportion of both males and females in the United States are treated for the condition than is the case in any of the other 11 countries listed, with the exception of older French women. Use of medication among
TABLE 7-3 Percentage Taking Cholesterol-Lowering Medications Among Those Reporting They Have Been Diagnosed with High Cholesterol
|
Country |
Ages 50+ |
Ages 65+ |
||
|
Males |
Females |
Males |
Females |
|
|
Austria |
56.8 |
55.4 |
66.8 |
60.4 |
|
Belgium |
53.3 |
60.1 |
64.1 |
68.0 |
|
Denmark |
63.8 |
60.2 |
80.7 |
65.2 |
|
France |
80.3 |
79.9 |
87.7 |
88.3 |
|
Germany |
58.0 |
54.3 |
69.7 |
58.7 |
|
Greece |
61.3 |
63.0 |
68.7 |
67.3 |
|
Italy |
55.7 |
53.4 |
65.3 |
56.2 |
|
Netherlands |
65.3 |
69.8 |
80.5 |
76.3 |
|
Spain |
59.7 |
58.0 |
67.1 |
62.6 |
|
Sweden |
59.7 |
58.5 |
67.6 |
68.0 |
|
Switzerland |
64.2 |
62.3 |
74.6 |
70.2 |
|
United States |
85.0 |
80.6 |
89.3 |
82.2 |
|
SOURCES: National Health and Nutrition Examination Survey (NHANES) (1999–2006) for United States; Survey of Health, Ageing, and Retirement in Europe (SHARE) (2004) for remaining countries. More information on these surveys is available from http://www.cdc.gov/nchs/nhanes.htm and www.share-project.org [accessed December 20, 2010]. |
||||
those diagnosed with high blood pressure is less variable across countries. Table 7-4 shows that, for men reporting having been diagnosed with high blood pressure, the United States is in the middle of the group of 13 countries listed in terms of frequency of receiving medication; for women, the United States ranks third. The combination among Americans of high prevalence of hypertension and relatively high drug use among those diagnosed means that they are the most likely to be using antihypertensives. It is likely that other countries have only recently begun to treat hypertension as aggressively as the United States. Wolf-Maier and colleagues (2004) used data from the 1990s to compare frequency of treatment for hypertension in the United States, Canada, and five European countries (Germany, Spain, England, Sweden, and Italy). Of those aged 35–64 who had measured high blood pressure or were receiving medication for the condition, 77.9 percent were being treated in the United States, compared with a range of 41.0–62.4 percent in the other six countries.
When judged according to survival rates, the U.S. health care system’s handling of cardiovascular events is near or slightly above average. In a study of survival rates 1 year after an acute myocardial infarction among people in seven countries (Australia, Canada, Denmark, Finland, Sweden, Great Britain, and the United States), the United States had the third
TABLE 7-4 Percentage Taking Antihypertensive Medications Among Those Reporting They Have Been Diagnosed as Hypertensive
|
Country |
Ages 50+ |
Ages 65+ |
||
|
Males |
Females |
Males |
Females |
|
|
Austria |
88.7 |
90.8 |
92.1 |
92.8 |
|
Belgium |
65.7 |
67.4 |
73.2 |
73.8 |
|
Denmark |
82.2 |
83.2 |
89.1 |
88.5 |
|
England |
77.0 |
77.1 |
84.9 |
84.9 |
|
France |
92.2 |
94.3 |
95.7 |
92.3 |
|
Germany |
90.4 |
89.6 |
93.6 |
90.2 |
|
Greece |
92.0 |
89.8 |
92.0 |
91.7 |
|
Italy |
86.1 |
90.1 |
91.4 |
92.5 |
|
Netherlands |
79.7 |
83.5 |
88.3 |
93.0 |
|
Spain |
81.9 |
86.7 |
86.0 |
90.5 |
|
Sweden |
86.5 |
88.8 |
89.4 |
94.5 |
|
Switzerland |
94.0 |
91.8 |
90.5 |
93.0 |
|
United States |
88.1 |
91.5 |
91.0 |
93.1 |
|
SOURCES: Survey of Health, Ageing, and Retirement in Europe (SHARE) (2004), Health and Retirement Study (HRS) (2004); English Longitudinal Study of Aging (ELSA) (2002). More information on these surveys is available from the following websites: http://www.share-project.org, http://hrsonline.isr.umich.edu/, and http://www.ifs.org.uk/elsa/ [accessed December 20, 2010]. |
||||
highest survival rate for men aged 40–64 and the second-highest for men aged 85–89; for women in the same age groups, the United States had the fourth-highest and highest survival rates, respectively (Moise, 2003). Preston and Ho (2010) suggest that one reason for the relatively high survival rates in the United States may be the tendency to respond to heart attacks with aggressive treatment regimens. For instance, a larger percentage of U.S. patients underwent revascularization operations relative to those in any other country.
Evidence on survival after ischemic strokes is more mixed. Generally speaking, the United States does well on short-term survival rates. In one study comparing stroke survival rates among nine countries, the United States ranked third on 7-day survival rates for ages 65–74 and second for ages 75+; on 30-day survival rates, U.S. men and women both ranked second for ages 65–75, while U.S. men ranked first and U.S. women ranked second among those 75+. However, 1-year survival rates represent a broader-gauged measure of success. When these rates were compared, the United States ranked in the bottom half of the countries surveyed (Organisation for Economic Co-operation and Development, 2003).
Again, the survival rates in the United States may be boosted by a tendency toward more aggressive treatment. For example, carotid endarterectomy, a technique used to prevent stroke by surgically removing plaque from inside the carotid artery, is used much more often by physicians in the United States than by those in any of 11 OECD countries examined in one study (Organisation for Economic Co-operation and Development, 2003).
International Comparisons of Detection and Treatment of Diabetes
Diabetes has been identified as a “tracer” condition indicating quality of health care (Nolte et al., 2006). Diabetes differs from cancer in that it requires regular monitoring and compliance. In the Nolte et al. study, the United States had a high ratio of diabetes deaths to incident cases among people younger than 40, implying that treatment of the disease is relatively poor. Unlike the survival rates for cancer and cardiovascular disease cited above, however, the incidence and survival data for diabetes are not drawn from prospective studies of a cohort but from two different data sources. The coding of deaths from diabetes also is subject to considerable variation because of the multiple morbid conditions typically present at death.
Some support for the conclusion of Nolte and colleagues is supplied by an earlier detailed investigation of diabetes treatment in the United States and the United Kingdom (Organisation for Economic Co-operation and Development, 1996). The study found that superior treatment in the United Kingdom, particularly through diabetes clinics, was associated with an additional 1.35 quality-adjusted life years for diabetics in that country.
A more recent study (Organisation for Economic Co-operation and Development, 2007) considered five measures related to diabetes treatment but rejected four of them as “not fit for international comparisons.” On the one measure that passed muster, the frequency of retinal exams among diabetics, the United States ranked fourth in frequency among 12 countries. Among older people reporting a diagnosis of diabetes, the proportion who reported being treated for the disease was virtually the same in the United States (81.3 percent based on HRS data) and in a composite of 10 European countries (81.5 percent based on Survey of Health, Ageing, and Retirement in Europe [SHARE] data) (Thorpe et al., 2007).
For the most important causes of mortality among the aged—heart disease, cancer, and stroke—the U.S. health care system appears to offer high-quality detection and treatment. The evidence is most clearcut for cancer and much less abundant for cardiovascular disease. By contrast, diabetes may represent a weakness in the U.S. health care approach and is one of the causes of mortality that has shown adverse trends in the United States relative to other countries, although these trends may be influenced by the faster growth of obesity in the United States (see Chapter 3).
Discussion
On the basis of the evidence presented here, it appears unlikely that weak performance by the U.S. health care system is responsible for the country’s poor longevity ranking at older ages. Any policy lessons to be drawn from this conclusion would, of course, need to account for the fact that the preponderance of deaths and of episodes of illness above age 50 occur at ages over 65, when individuals are covered by Medicare.
LESSONS FROM RECENT TRENDS IN LIFE EXPECTANCY IN DENMARK AND THE NETHERLANDS
As discussed earlier, the increase in life expectancy slowed at around the same time in the United States, Denmark, and the Netherlands. There is some evidence of a common cause for the slowdown in all three countries—smoking (see Chapter 5). Both Denmark and the Netherlands have now emerged from their period of stagnation and have seen improvements in life expectancy—Denmark beginning around 1995 and the Netherlands around 2002. Yet life expectancy increases remain weak in the United States. What can we learn about the causes of recent improvements in Denmark and the Netherlands?
Christensen and colleagues have suggested that Denmark’s renewed growth in life expectancy came about because of lifestyle improvements in combination with enhanced medical and surgical treatments (Christensen
et al., 2010a). Mackenbach and Garssen (2010) argue that the Netherlands emerged from the period of stagnation because of improved funding of health care, which contributed to more appropriate use of health care.
Mackenbach and Garssen (2010) report that after 2002, the mortality rate in the Netherlands dropped steadily in all older age groups with the exception of the very oldest men, those over 90. The authors eliminate a number of potential causal factors—prevalence of disease and disability, environmental factors such as air pollutants and winter temperatures, health behaviors, and poverty rates—because they did not improve during the appropriate time period. However, substantial changes occurred in health care in the Netherlands during this period. These included modest increases in the percentage of the elderly receiving influenza vaccinations, seeing medical specialists, and using prescribed drugs, as well as sharp increases in the numbers of older men and women admitted to hospitals. There was also a significant drop in the percentage of older adults who died within a year of being admitted to the hospital. These improvements in various health care factors accompanied—and were, presumably, the product of—sharp increases in health care spending in the Netherlands, where health care expenditures per person, in nominal prices, grew by more than 40 percent between 1999 and 2003. Changes in health care organization also occurred during this time. For instance, more aggressive treatment of stroke became common as specialized stroke units became available on a large scale beginning around 2000. There is evidence as well that end-of-life practices in the Netherlands changed significantly within a short time. From 2001 to 2005, euthanasia, assisted suicide, and the withholding or withdrawing of life-prolonging treatment became less common, and the alleviation of symptoms and the use of continuous deep sedation became more common. Correspondingly, the percentage of deaths in which life-prolonging treatment was withheld or withdrawn fell (Mackenbach and Garssen, 2010).
It should be noted that evidence for the conclusion drawn by Mackenbach and Garssen (2010)—that the most likely explanation for why life expectancy accelerated in the Netherlands beginning around 2002 was increased use of the health care system due to a sharp increase in government spending on health care—is mainly circumstantial. It is based on excluding other possible explanations and on how well the health care explanation fits the evidence.
The implications for the United States are not at all clear. Since U.S. health care expenditures are already substantially higher than those of the Netherlands and Denmark, increased spending or emphasis on health care at older ages in the United States would not necessarily result in an acceleration of life expectancy.
DISCUSSION
The lack of universal access to health care in the United States undoubtedly increases mortality and reduces life expectancy. It is a smaller factor above age 65 than at younger ages because of Medicare, although health impairments that begin below age 65 will often carry over into that age interval. For the main causes of death at older ages—cancer and cardiovascular diseases—available measures do not suggest that the U.S. health care system is failing to prevent deaths that elsewhere would be averted. In fact, cancer detection and survival appear to be better in the United States than in other OECD countries.
Relatively high proportions of people in the United States with diagnosed high cholesterol and high blood pressure are receiving treatment. Survival rates following heart attack and stroke are also favorable in the United States, although 1-year survival rates following stroke are not above average. Treatment of diabetes, on the other hand, may represent a weakness in the U.S. health care system.
These facts relate to the performance of the health care system after a disease has already developed; they say nothing about disease prevention. Thus it is possible that the U.S. health care system does a much poorer job at primary prevention than the systems of other countries. The panel reviewed scattered evidence on preventive medicine in the United States relative to Europe, and it is not conclusive. Certainly the high prevalence of cardiovascular disease in the United States (see Chapter 2) is consistent with a widespread failure of preventive medicine. But it is also consistent with a high prevalence of smoking, obesity, and physical inactivity among Americans, or with a medical system that may be unusually effective at identifying and treating cardiovascular disease. Until international data systems are better designed to identify cases of cardiovascular disease and to follow them through treatment, survival, and death, it is impossible to identify confidently the roots of international differences in the prevalence of and mortality from cardiovascular disease. Cancer data systems are better developed and allow a more robust comparative assessment of the U.S. health care system. Whether the comparisons observed for cancer can be generalized to other diseases is, however, unclear.


