
7
Incentives for the Deployment of Plug-in Electric Vehicles
One of the most important issues concerning the deployment of plug-in electric vehicles (PEVs) is determining what, if any, incentives are needed to promote this deployment. Determining appropriate incentives is difficult because little is yet known about the effectiveness of PEV incentive programs. Therefore, the committee first considered the price or cost competiveness of PEVs and the possibilities for reducing production costs. It next considered manufacturer and consumer incentives for purchasing or owning PEVs and then past incentive programs for other alternative-vehicle and fuel technologies. The chapter concludes with recommendations on what the committee sees as the most compelling approaches to promoting PEV deployment.
VEHICLE PRICE AND COST OF OWNERSHIP
A major consideration when purchasing or leasing a vehicle is the financial consequence. Thus, the two factors to consider are the vehicle price and the cost of ownership. Most people compare prices or monthly leasing payments and take into account any financial incentive that would reduce the vehicle price. Because vehicle manufacturers and dealers are profit-oriented businesses, vehicle prices are generally related to production costs. However, the relationship between a manufacturer’s suggested retail price and its production cost typically reflects a number of considerations and might differ across vehicles and over time. For example, on newly developed vehicles, such as PEVs, vehicle manufacturers might be motivated to incur losses or relatively low profit margins in the short run to promote sales and strengthen their business positions and profit margins over the long run. That type of marketing strategy contributed to the eventual success of the Toyota Prius (Tellis 2013). Regardless of how the vehicle price is set, price is an important consideration for most consumers when shopping for a new vehicle.
Some prospective buyers also consider more broadly the costs of owning a vehicle—in particular, the costs of fueling, maintaining, and insuring the vehicle and its resale or trade-in value. The total cost of ownership (or overall cost to the consumer) of any specific vehicle can be viewed as the effective purchase price (price adjusted for any financial incentives) plus the costs of fueling, maintaining, and insuring the vehicle, minus the resale or trade-in value.1 Although the distinction between price and total cost of ownership is important, most consumers find it difficult to estimate the latter with much confidence, partly because they are not certain at the time of purchase how long they will keep their vehicles or how many miles they will drive in them and partly because fuel costs, maintenance costs, and resale values are uncertain, particularly for newer technology vehicles like PEVs. That said, tools to help prospective buyers estimate and compare the total ownership costs of different vehicles are now available at Edmunds.com and elsewhere.
The U.S. Department of Energy (DOE) has created a website calculator where prospective buyers provide various driver-specific inputs (such as net vehicle price, normal daily driving distance, annual mileage, and breakdown of mileage between city and highway) and can calculate the cumulative cost of ownership over different time horizons under representative assumptions about other such factors as maintenance and insurance costs (DOE 2014a).2 Cumulative cost of ownership is distinct from total cost of ownership in that it is a calculation for a given time horizon and typically does not include the trade-in or resale value. Thus, by focusing on the cumulative costs of ownership over different time horizons, the DOE calculations avoid assumptions about resale values, which are highly uncertain for PEVs.
Affordability—as reflected in price and total cost of ownership—is not the only consideration that influences the types of vehicles that consumers choose. As emphasized in Chapter 3, PEV adoption also depends importantly on consumer awareness, the variety of models available, uncertainties about new technologies and resale values, and various vehicle attributes that determine its utility to the customer. Because there is still much uncertainty about PEV technolo-
_____________
1 More sophisticated definitions of the total cost of ownership are based on the present discounted values of the various components of cost (that is, they discount future costs relative to current costs).
2 The website calculator provides zip-code-specific assumptions about fuel prices that the user can override.
gies and the battery lifetimes, and because there are not as yet well-developed markets for used PEVs or their batteries, consumers are likely to perceive more uncertainty about the total costs of owning PEVs than about the total costs of owning conventional vehicles. Those uncertainties make risk-averse consumers less likely to purchase a PEV, other things being equal. They also strengthen the incentive to lease a PEV rather than purchase one.
Thus, leasing is a more frequent choice for PEVs than for conventional vehicles (see Table 3-3) because it can make monthly payments for the vehicle appear more affordable and reduce the risk of owning one. In a typical leasing arrangement, ownership of the vehicle is transferred at a negotiated sales price from the dealer to a bank or some other finance company (often the financial arm of the vehicle manufacturer). In general, the sales price is influenced importantly by the amount that the vehicle manufacturer charges the dealer for the car and by any incentive payments or guarantees that the manufacturer offers the finance company.3 The finance company collects the monthly leasing payments and generally also receives (1) incentives or other subsidies provided by federal or state governments or (2) benefits from lower negotiated sales prices resulting from government incentives provided to manufacturers or dealers. As such, potential PEV drivers who do not have enough income to qualify for the federal income tax credit could still benefit from any credit available with vehicle leasing.
PRICE AND COST COMPETITIVENESS OF PLUG-IN ELECTRIC VEHICLES
The committee used three approaches to assess the extent to which prices or costs of ownership might have affected PEV deployment to date. First, the committee compared the manufacturers’ suggested retail prices (MSRPs, which are essentially the target prices) of various PEV models with those of comparative vehicles. Second, it evaluated sales data, and, third, it considered consumer surveys. No approach provided conclusive results.
Table 7-1 lists MSRPs for three relatively best-selling PEV models, for several hybrid electric vehicles (HEVs), and for internal-combustion engine (ICE) vehicles. It excludes the Tesla Model S, which tends to be bought by relatively wealthy individuals whose purchase decisions might not be highly sensitive to price. The table allows one to compare the prices of the Chevrolet Volt and two Chevrolet Cruze models and to compare the prices of the Ford Fusion Energi and the Ford Fusion Automatic and Hybrid models; the comparisons are informative because the PEVs and comparative ICE and HEV models are built on the same platforms and therefore have similar production costs for components other than those associated with their sources of energy and drive trains.4 The table also includes the prices of the Toyota Prius, the Volkswagen Passat, and the Nissan Leaf, along with the average transaction prices for small and midsize vehicle segments, including the prices for the specialty segment. The committee emphasizes that the MSRPs shown in the table simply represent price points that manufacturers target, as distinct from the prices at which vehicles are actually sold, which are typically less than the MSRPs. Nevertheless, the MSRP comparisons provide some useful perspectives. The average transaction price data reflect the actual prices paid by the consumer.
In addition to providing information on vehicle prices, Table 7-1 includes ranges for annual fuel costs and 5-year cumulative costs of ownership. As reflected in the table notes, the estimates are based on a combination of the assumptions included in the DOE calculator and the committee’s specific assumptions about annual vehicle miles traveled, electricity costs, and gasoline prices ranging from $2.50 to $4.00 per gallon. The estimates of 5-year cumulative costs of ownership assume that purchasers pay MSRPs and receive maximum tax credits, and the estimated costs in years two through five have not been discounted.5
As indicated in Table 7-1, the MSRPs before consideration of the federal tax credits for the PEVs are all substantially higher than the MSRPs for the HEVs and ICE vehicles listed in the table. After consideration of the $7,500 federal tax credit, the adjusted MSRP for the Chevrolet Volt still substantially exceeds the MSRPs for the Chevrolet Cruze LS Automatic, the Toyota Prius, and the Volkswagen Passat and the average transaction price for the specialty small vehicle segment. It somewhat exceeds the MSRP of the Chevrolet Cruze Diesel Automatic. The MSRP for the Ford Fusion Energi, after adjusting for the $4,007 federal tax credit, exceeds MSRPs of the two other Fusion models, the Toyota Prius, and the Volkswagen Passat but is similar to the average transaction price of the specialty midsize vehicle segment. The 5-year cumulative cost of owning a Chevrolet Volt—as estimated by the DOE calculator using representative assumptions—is, respectively, about $2,300 and $3,400 higher than the comparable 5-year costs for the Toyota Prius and the Volkswagen Passat at a gasoline price of $2.50 per gallon and higher by
_____________
3 An important influence on the negotiated sales price is the finance company’s estimate of the value of the car at the end of the lease, taking into account any guarantees by the vehicle manufacturer.
4 It is common practice for a vehicle manufacturer to build multiple vehicle models on the same platform but that are in different market segments. Although the Chevrolet Cruze and Volt are in the same size segment, they are not in the same market segment (standard compact vs premium compact).
5 In theory, car payments that are spread over 5 years or less have present discounted values that equal, or closely approximate, the vehicle MSRP when the payments are discounted at the rate of interest charged in financing the car payments. And while discount rates between 0 and 6 percent would imply that the present discounted value of the 5-year stream of other costs (for fuel, tires, maintenance, insurance, inspection, and registration) was up to several thousand dollars less than five times the annual average of those costs—with relatively smaller differences for vehicles that have relatively lower annual fuel costs (such as PEVs)—the qualitative comparisons and the finding would not be affected.
| Modela | Vehicle Type | MSRPb | MSRP Less Federal Tax Creditc | Range of Annual Fuel Costd | Range for 5-Year Cumulative Cost of Ownershipd,e |
| Chevrolet Volt | PHEV | 34,185 | 26,685 | 540-636 | 40,564-41,038 |
| Chevrolet Cruze LS Automatic (6S) | ICE vehicle | 19,530 | 19,530 | 915-1,464 | 35,280-38,025 |
| Chevrolet Cruze Diesel Automatic (6S) | ICE vehicle | 25,810 | 25,810 | 990-1,485 | 41,935-44,410 |
| Ford Fusion Energi | PHEV | 34,700 | 30,693 | 657-897 | 45,153-46,353 |
| Ford Fusion Automatic | ICE vehicle | 22,400 | 22,400 | 1,002-1,605 | 38,589-41,598 |
| Ford Fusion Hybrid (FWD) | HEV | 27,280 | 27,280 | 680-1,088 | 41,855-43,895 |
| Nissan Leaf | BEV | 29,010 | 21,510 | 435 | 34,860 |
| Toyota Prius Hybrid | HEV | 24,200 | 24,200 | 581-932 | 38,284-40,033 |
| Volkswagen Passat (6S) | ICE vehicle | 20,995 | 20,995 | 1,005-1,608 | 37,195-40,210 |
| Alternative Comparators | Average Transactions Pricef | ||||
| Small vehicles (average) | 20,374 | ||||
| Small vehicles (specialty) | 23,129 | ||||
| Midsize vehicles (average) | 25,677 | ||||
| Midsize vehicles (specialty) | 29,759 | ||||
a All HEV and ICE vehicle models are ones with four-cylinder engines.
b Based on MSRP data for 2014 models from manufacturers’ websites as of July 31, 2014, except for Volkswagen Passat, which is as of August 31, 2014.
c The federal tax credit is $2,500 for PEVs that have battery capacities below 5 kWh. For PEVs that have larger battery capacities, the credit is set at $2,500 plus $417 times the amount that the battery capacity exceeds 5 kWh, up to a maximum of $7,500. The subsidy extends to the first 200,000 PEVs sold by each manufacturer. Those purchasers who would not otherwise pay at least $7,500 in federal income taxes cannot take advantage of the full $7,500 credit. See Internal Revenue Code Section 30D (IRS 2009).
d Based on 11,500 vehicle miles traveled, $2.50-$4.00 per gallon for gasoline, $3.00-$4.50 per gallon for diesel fuel, $0.125 per kWh for electricity, and DOE assumptions about normal daily use.
e Includes DOE estimate of $2,235 annual costs for tires, maintenance, insurance, licensing, and registration when vehicle is driven 11,500 miles. Excludes any cost of financing and any costs associated with home-charger installation and permitting requirements. Assumes purchaser pays MSRP and receives maximum tax credit.
f Data provided by Baum & Associates (A. Baum, personal communication, April 22, 2014).
NOTE: BEV, battery electric vehicle; FWD, front-wheel drive; HEV, hybrid electric vehicle; ICE, internal-combustion engine; MSRP, manufacturers’ suggested retail price; PHEV, plug-in hybrid electric vehicle; S, speed.
about $1,000 and $800 at a gasoline price of $4.00 per gallon. The 5-year cumulative cost of owning a Ford Fusion Energi is higher than those of all the HEV and ICE vehicles listed in Table 7-1, even at a gasoline price of $4.00 per gallon.
In contrast, the MSRP of the Nissan Leaf, after considering the $7,500 federal tax credit, is less than the MSRP of the Toyota Prius and is comparable to the average transaction price of the small vehicle segment. The 5-year cumulative ownership cost of the Nissan Leaf, as estimated using the DOE calculator, is, respectively, about $3,400 and $2,300 less than the analogous costs of the Toyota Prius and the Volkswagen Passat at a gasoline price of $2.50 per gallon and about $5,200 and $5,400 less at a gasoline price of $4.00 per gallon.
A second approach to assessing the price-competitiveness of PEVs is to evaluate data on sales volumes. The idea is that low sales volume could indicate that the vehicles are not price- or cost-competitive, although the analysis above indicates that the Nissan Leaf is highly competitive given the federal tax credit. As noted in Chapter 1, about 290,000 highway-capable PEVs were sold in the United States by the close of 2014. Although there is no generally accepted wisdom on how rapidly sales of a new product line should expand during the early introductory stage, the number of PEVs sold in the United States to date has fallen short of aspirational goals,6 despite substantial incentives.
Consumer survey data provide yet another approach for evaluating whether price is currently an obstacle to PEV deployment. The annual New Vehicle Experience Studies conducted by Strategic Vision have surveyed large samples of new-vehicle buyers and distinguished between those who actively looked at PEVs but chose not to purchase one, and those who did not even consider purchasing a PEV. In the former group, 41 percent indicated that current prices or rebates were appealing and 27 percent said that current interest or lease rates were appealing; in the latter group, 25 percent considered them appealing and 17 percent said that current interest or lease rates were appealing (Edwards 2013). The survey data also showed that 43 percent and 45 percent of BEV and PHEV buyers, respectively, considered their purchases “value for the money.” The data suggest that current pricing might not be a primary barrier to greater PEV sales among early adopters, who tend to be less price sensitive than the mainstream market, and that buyers are rejecting the vehicles for other reasons. Strategic Vision also found that 10 percent of new-vehicle buyers are actively shopping or plan to shop for a PEV and that about 33 percent are open to hearing more about what PEVs can do for them. Given that 15 million new vehicles are sold each year, the data suggests an active potential market of about 1.5 million PEVs with about two-thirds finding the pricing or lease rates appealing. Despite these results, Strategic Vision stated that it still believes that “price is a critical barrier—even for more affluent customers” (Edwards 2013, p. 45).
Finding: Under the current program of federal tax credits, the comparisons of MSRPs and cumulative ownership costs provide mixed evidence on whether price is currently an obstacle to the deployment of PEVs. However, in the absence of the tax credits or other subsidies, analogous comparisons at prevailing MSRPs would be unfavorable to the PEVs.
Finding: Sales data and consumer survey data are difficult to interpret. They are consistent, however, with the view that price is a barrier to some buyers, but that others might be rejecting PEVs for other reasons.
POSSIBILITIES FOR DECLINES IN PRODUCTION COSTS FOR PLUG-IN ELECTRIC VEHICLES
The extent to which PEVs are adopted over time will depend on reductions in their production costs, on the policies that governments implement to promote PEV deployment, and on the extent to which vehicle manufacturers decide to price PEVs more attractively by relying on relatively low markups in pricing and perhaps compensating for the loss of revenue by raising mark-ups on their portfolios of other vehicles.7 The three factors are not completely independent. Government policies toward research and development can affect battery costs, and policies, such as zero-emission requirements, can induce vehicle manufacturers to change their pricing strategies. This section focuses on likely reductions over time in the production costs of PEVs.
In general, the costs of producing PEVs will be driven down over time by a number of factors. The technologies being used for PEVs are relatively new compared with technologies used to produce ICE vehicles, which have been evolving and improving for more than a century. Thus, as discussed in Chapter 2, it is expected that research and development will lead to reductions in the costs of PEV batteries over time through technological improvements, such as higher energy densities, improved designs, and longer battery lives.8
_____________
6 For example, in early 2011 DOE projected cumulative U.S. sales of 1.22 million PEVs by 2015 (DOE 2011).
7 Manufacturers typically estimate their direct labor and material costs of production and markup prices above direct production costs by amounts sufficient to cover the fixed costs of plant and equipment, various indirect costs (including the costs of research and development, corporate operations, dealer support, and marketing), and an allowance for profits. A study based on data from the 2007 annual reports of eight major vehicle manufacturers found that the average markup factor for the automobile industry was about 1.5 (RTI/UMTRI 2009). However, manufacturers will sell vehicles at prices that the market will bear; thus, the markup on one vehicle model can be much greater than that on another vehicle model.
8 Innovations in other elements of vehicle technology are likely to lead to improved vehicle performance without necessarily generating substantial reductions in cost. Improving the aerodynamics, reducing friction, reducing the rolling resistance of tires, and reducing weight could lead to a vehicle design with, for example, better performance or more driving range, depending on what trade-offs were made in the overall vehicle design. That could lead to the need for a smaller battery, and the reduced cost of the battery would have to be weighed against the increased cost of the above-mentioned improvements because such improvements generally come at
Cost reduction might also be realized as PEV production volume increases and both the capital costs of investments in production facilities and the indirect costs of research and development, corporate operations, dealer support, and marketing are spread over more vehicles. Such scale economies will also be realized in the supplier base with increases in the demand for components, such as batteries, motors, and inverters, enabling suppliers to reduce the prices that vehicle manufacturers are charged for those components. In addition, increases in the number of vehicles and the demand for components will likely lead to greater competition among suppliers, which could intensify the downward pressure on component prices as suppliers innovate and generate better designs. And once a new vehicle technology becomes fairly firmly established, components tend to become more standardized, leading to additional reductions in production costs.
As emphasized in Chapter 2, the difference between the costs of producing PEVs and comparative conventional vehicles can be largely attributed to the high cost of high-energy batteries. Accordingly, the prospect for large-scale deployment of PEVs depends importantly on how much battery costs decline over time. Other things equal, if battery pack costs declined by as much as 50 percent over the next 5 to 10 years, consistent with optimistic projections (see discussion in Chapter 2), the cost of producing a BEV with 24 kWh nominal battery capacity (analogous to the Nissan Leaf) would decline by roughly $6,000. Similarly, the costs of producing PHEVs with 16.5 kWh and 7.6 kWh nominal battery capacities (analogous to the Chevrolet Volt and Ford Energi) would decline by about $4,100 and $1,900. And a 75 percent decline in battery pack costs (a highly optimistic forecast)—to as low as $125 per kWh of nominal battery capacity—would reduce the costs of producing the Nissan Leaf, the Chevrolet Volt, and the Ford Energi by an additional $3,000, $2,050, and $950, respectively. Such optimistic reductions in production costs would provide opportunities for the vehicle manufacturers to reduce the MSRPs for PEVs by amounts that largely offset, or more than offset, the effects of the pending expiration of the current program of federal tax credits.
A detailed analysis of how the nonbattery costs of PEVs are likely to evolve relative to those of comparative vehicles is beyond the scope of this report. Recent NRC reports on the costs of different vehicle types, however, conclude that the costs of producing PHEVs and BEVs will likely remain greater than the costs of producing ICE vehicles and HEVs for at least the next two decades (NAS/NAE/NRC 2009; NRC 2013b).
It should be noted that PEV adoption does not require PEVs to be priced at or below the prices of conventional vehicles. Some might buy PEVs because they are less expensive to fuel and perhaps less expensive to maintain. Others might value certain of their attributes that are not present (or not present to the same degree) on conventional vehicles, such as the smooth and quiet ride, better acceleration, the convenience of home fueling, less maintenance (fewer or no oil changes), and the potential for reducing vehicle emissions and petroleum usage.
Finding: Although battery costs could decline by 50 or perhaps even 75 percent over the next decade, it is not clear whether such a decline would be sufficient—by itself—to ensure widespread adoption of PEVs once the current quotas for federal tax credits are exhausted.
Finding: The decline over time in PEV production costs is likely to occur gradually, and existing quotas for federal tax credits might be exhausted for manufacturers of relatively popular PEVs before costs can be substantially reduced.
The production and purchase of PEVs is a classic chicken-and-egg problem. Manufacturers do not want to produce PEVs if no customers exist, and consumers cannot buy PEVs if vehicles are not available that meet their expectations. Therefore, regulatory requirements and incentives for manufacturers and consumers have been provided over the past few years by states and the federal government to encourage PEV production and deployment. Most manufacturer incentives and mandates are contained in federal or state regulatory programs discussed below. Most consumer incentive programs described below have involved purchase incentives, although some have included ownership and use incentives. There have also been incentives to install charging stations, the availability of which might also influence people’s willingness to purchase PEVs.
Manufacturer Incentives and Regulatory Requirements
Incentives for manufacturers to produce PEVs are contained in the federal Corporate Average Fuel Economy (CAFE) Standards and the Greenhouse Gas (GHG) Emission Standards for light-duty vehicles. California and other states have Zero-Emission-Vehicle (ZEV) programs that require the sale of PEVs in those states because PEVs are the only qualifying technology that are currently mass produced. These manufacturer incentives and regulatory requirements can have the effect of reducing the vehicle price of PEVs relative to other vehicles; they are reviewed in detail below.
Federal Regulatory Incentives for Plug-in Electric Vehicles
Fuel economy and GHG emissions from light-duty vehicles are regulated under the federal CAFE-GHG national
_____________
some incremental cost (NRC 2011a, 2013a). These innovations in technology will likely also be applied to conventional vehicles as manufacturers strive to meet fuel-economy requirements, but also at some incremental cost.
program. Under the recently updated rule, vehicle manufacturers must comply with fuel economy and GHG standards that are equivalent to about 54.5 mpg and 163 grams of carbon dioxide (CO2) per mile for the fleet average of new vehicles by model year (MY) 2025 (EPA/NHTSA 2012a). Although GHG emissions from light-duty vehicles are regulated by the U.S. Environmental Protection Agency (EPA) under the Clean Air Act and fuel economy is regulated by the National Highway Traffic and Safety Administration (NHTSA) under the CAFE program, the federal agencies have developed a single national program.9 The standards are fleet-based standards, meaning that a manufacturer can build vehicles that are certified above and below the standards as long as the fleet-wide average meets the standards. The standards also offer an array of regulatory flexibilities, including the ability to bank or buy compliance credits and incentives for various types of technologies. Although the analyses done by EPA and NHTSA for their most recent regulation for 2017-2025 developed a cost-effective compliance demonstration pathway that shows how the standards for vehicles in 2025 can be achieved almost exclusively through conventional gasoline-powered vehicles, the regulations developed by EPA and NHTSA have generous credits for PEVs that make it attractive for vehicle manufacturers to produce PEVs. However, the very nature of the separate legislative authorities under which EPA and NHTSA operate to regulate light-duty vehicles means that the manner of crediting manufacturers of alternative-fuel vehicles, such as PEVs, diverges between the CAFE and GHG standards.
The CAFE standard focuses on reducing petroleum usage in the United States. Federal law requires the CAFE program to evaluate PEVs and all other alternative-fuel vehicles by using a petroleum equivalency factor (PEF) to calculate a fuel economy compliance number for such vehicles.10 PEFs are used to convert the electric energy consumption measured in the certification test cycle of alternative-fuel vehicles, including BEVs and PHEVs, to an equivalent fuel economy number. Manufacturers use the miles per gallon equivalent (MPGe) to calculate their fleet average mpg for compliance purposes. In compliance with the law, only 15 percent of the alternative fuel (such as electricity) that is consumed during the test is counted toward the fuel economy rating of an alternative-fuel vehicle. That treatment provides a strong incentive for manufacturers to produce alternative-fuel vehicles to comply with CAFE program requirements. For example, a BEV that is rated on the certification test cycle at 230 Wh/mile (roughly equivalent to the certification test cycle value for a Nissan Leaf) is treated as equivalent to a 357 mpg gasoline-powered car (see Box 7-1).
PHEVs are treated as dual-fuel vehicles that use both electricity and gasoline. Federal regulations stipulate how the gasoline and electric energy consumption is measured in certification test cycles for PHEVs. The measured electric energy consumption is converted, as in the BEV case, to an MPGe by using the petroleum equivalency factor method. The electric MPGe and gasoline mpg must be weighted to obtain the fuel economy value used in CAFE compliance. Until 2019, PHEVs are assumed to use electric fuel 50 percent of the time and gasoline 50 percent of the time (EPA/NHTSA 2012b). Beginning in MY 2020, the weighting will be determined on the basis of the SAE J1711 fuel economy test method that uses a utility factor to estimate the fraction of driving on electricity and assumes that the vehicle owner charges once per day and drives in much the same way as today’s typical light-duty vehicle drivers. Given that method, a PHEV with 20-mile all-electric range (PHEV20) would be treated as a 90 mpg gasoline-powered car, and a PHEV with 60-mile all-electric range (PHEV60) would be treated as a 226 mpg gasoline-powered car (Al-Alawi and Bradley 2014).
The EPA GHG standards provide two temporary incentives to vehicle manufacturers to produce PEVs. The first incentive is temporary treatment of PEVs as zero emissions (that is, upstream emissions of power plants are ignored) for the portion of operation assumed to be powered by electricity. For BEVs and fuel-cell vehicles (FCVs), the MY 2017-2021 GHG standards set a value of 0 g/mile for the tailpipe CO2 emissions compliance value (EPA/NHTSA 2012b). PHEVs also receive a value of 0 g/mile based on a formula to estimate the fraction of electricity usage. For MY 2022-2025, the program allows the 0 g/mile treatment up to a cumulative sales cap for each manufacturer.11 After that cap is reached, the compliance values for BEVs and the electric portion of PHEVs are based on an estimate of the national average emissions associated with producing the electricity needed to charge PEVs. However, the cumulative sales caps appear to be generous, so it is possible that most PEVs will be treated as ZEVs.
The second manufacturer incentive under the EPA GHG standards is sales multipliers that effectively treat a single PEV sold as more than one vehicle for compliance purposes. The PEV sales multipliers start at 2.0 in MY 2017 for BEVs and FCVs and 1.6 for PHEVs and then gradually decline to 1.0 by MY 2022, when they are proposed to be completely phased out. The larger multiplier in the earlier years rewards manufacturers that are early market leaders. Allowing each PEV to count as more than one vehicle lowers the average GHG per mile for a manufacturer.
By increasing the MPGe and decreasing the grams CO2 per mile of PEVs, the federal incentives from the PEF, zero
_____________
9 The largest source of GHG emissions from light-duty vehicles is CO2 that results from the combustion of gasoline or diesel fuel, and this implies that fuel economy and GHG emissions are directly correlated, necessitating the development of a common set of standards.
10 49 U.S.C. 32904(a)(2)(B) and 49 U.S.C. 32905(a).
11 Manufacturers that sell 300,000 PHEVs, BEVs, and FCVs between 2019 and 2021 can use the 0 g/mile value for a maximum of 600,000 vehicles starting in 2022. For all other manufacturers (those who sell less than the 300,000), the 0 g/mile value can be used only up to 200,000 vehicles. After the sales cap is reached, emissions will be calculated using an upstream emission standard calculated by EPA.
BOX 7-1 Derivation of Petroleum Equivalent for a Battery Electric Vehicle
The PEF is derived by first calculating a full fuel cycle, gasoline-equivalent energy content of electricity and then dividing it by a 0.15 fuel-content factor. The PEF was developed to motivate the production of vehicles fueled with 85 percent ethanol (E85), and the 0.15 factor reflects the petroleum consumption of E85 vehicles. The gasoline-equivalent energy content of electricity (Eg) is calculated as follows:
Eg = gasoline-equivalent energy content of electricity = (Tg × Tt × C) / Tp
where
Tg = U.S. average fossil-fuel electricity generation efficiency = 0.328
Tt = U.S. average electricity transmission and distribution efficiency = 0.924
Tp = petroleum refining and distribution efficiency = 0.830
C = watt-hours of energy per gallon of gasoline conversion factor = 33,705 Wh/gal
Therefore,
Eg = (0.328 × 0.924 × 33,705)/0.830 =12,307 Wh/gal
The Nissan Leaf, which requires 230 Wh/mile, exhibits a range of 53.5 miles on the electric-energy equivalent of 1 gallon of gasoline (12,307/230 = 53.5). That is the certification test-cycle result. To provide an incentive for alternative-fuel vehicles, only 15 percent of the fuel consumed in the test cycle is counted, and the resulting MPGe for the Nissan Leaf is 12,307/(230 × 0.15) = 357 mpg for CAFE purposes.
emissions treatment, and sales multipliers allow the manufacturers to produce higher emitting and less fuel-efficient gasoline-vehicle fleets and still meet their fleet average standards. The incentives, therefore, create an internal cross subsidy that allows a manufacturer to reduce the cost of compliance for their gasoline-vehicle fleet by producing PEVs. Furthermore, because credits can be traded between manufacturers, such companies as Tesla that produce excess CAFE and GHG credits can sell their credits to other manufacturers (Energy Independence and Security Act 2007). The value of the PEV credits under EPA and NHTSA regulations is difficult to estimate but might be about a few thousand dollars per vehicle based on the costs of regulatory compliance in the absence of PEVs (EPA/NHTSA 2012b). The California and state ZEV programs (see below) also generate credits for various attributes, and the value has been estimated at up to $35,000 per vehicle for the Tesla Model S, which generates up to seven credits per vehicle sold (Ohnsman 2013).
State Zero-Emission-Vehicle Programs
The California ZEV program provides an important manufacturer requirement for PEVs. The Clean Air Act Amendments of 1969 authorized California to develop more stringent tailpipe standards than the rest of the country, and the California Air Resources Board (CARB) used the authority provided in Section 209b to adopt the original ZEV program in 1990. The ZEV program is a part of the state’s comprehensive plan to meet federal and state ambient air quality standards. Later amendments to the Clean Air Act allowed other states to opt into the California standard. Nine states—Connecticut, Maine, Maryland, Massachusetts, New Jersey, New York, Rhode Island, Vermont, and Oregon—have adopted the California ZEV program as authorized under Section 177 of the Clean Air Act as part of their plans to meet federal ambient air quality standards. The nine states and California account for 28 percent of total U.S. light-duty vehicle sales. Recently, eight states that have the ZEV program signed a joint memorandum of agreement to cooperate on developing policies to accelerate PEV deployment in their states (State ZEV Programs 2013). The agreement includes the development of a Multistate ZEV Action Plan that describes state actions to promote PEV deployment and recommends research and stakeholder partnerships to support long-term development of the PEV market (ZEV Program Implementation Task Force 2014). Additionally, many of the ZEV states participate in the Northeast Electric Vehicle Network, which works to promote PEV deployment.
For a manufacturer to receive credit for vehicle sales under the ZEV program, a vehicle must be categorized under the program as either a ZEV (a BEV or an FCV) as defined by the program or a PHEV with an all-electric range of greater than or equal to 10 miles (CARB 2013). CARB estimates that the total number of ZEVs (BEVs and FCVs) and PHEVs needed to comply for MYs 2018 through 2025 for California and the nine other states is about 228,000 in 2018 and 725,000 by 2025 (Keddie 2013). The ZEV Program Implementation Task Force (2014) predicts that by 2025, a little more than 15 percent of new vehicles sold in participating states will be either ZEVs or PHEVs.
Finding: By creating an internal cross subsidy, existing federal and state regulatory programs for fuel economy and emissions (CAFE, GHG, and ZEV) have been effective at stimulating manufacturers to produce some PEVs. The sale of credits from these programs between manufacturers has also provided an important incentive for PEV manufacturers to price PEVs more attractively.
Finding: Because the ZEV program mandates sales of a certain percentage of PEVs, its impact could be larger than the incentives under the federal CAFE-GHG national program.
Consumer Incentives
The U.S. federal, state, and local governments have all experimented with consumer incentives to encourage PEV deployment. Many other countries have also used various policy tools to encourage consumer adoption. Box 7-2 defines the different types of financial incentives that have been used, and Table 7-2 summarizes the various financial and nonfinancial incentives and the entities that have used them. The incentives that have been used to promote PEV deployment are discussed below.
The committee defined four categories of financial incentives. Purchase incentives are one-time financial benefits earned by purchase of a PEV and include tax credits, tax deductions, tax exemptions, and rebates. Ownership incentives are recurring annual or periodic financial benefits that accrue to PEV owners regardless of use and include exemptions from (or reductions in) registration taxes or fees, weight surcharges, environmental taxes, or vehicle inspections. Use incentives are ongoing financial benefits realized by driving a PEV and include exemptions from motor fuel taxes, reduced roadway taxes or tolls, and discounted or free PEV charging or parking. PEV infrastructure incentives are one-time financial benefits for deploying PEV charging stations and include tax credits, rebates, or other subsidies. A variety of these incentives have been used throughout the United States and in other countries. Educating consumers on all the incentives is challenging, and some confusion results because incentives vary by location and often come and go without much warning.
The primary consumer incentive offered by the U.S. federal government is a purchase incentive in the form of a tax credit. The tax credit amount varies depending on the capacity of the battery in the vehicles and will be phased out at the beginning of the second calendar quarter after the manufacturer produces 200,000 eligible PEVs as counted from January 1, 2010.12 To claim the credit, consumers who purchase a PEV must have sufficient tax liability and will not see the benefit until they file an annual tax return. For consumers who lease, the leasing company typically claims the credit and reflects the credit in the monthly lease rate, so leasers essentially see the benefit of the tax credit at the point of sale. Although the PEV tax credits are analogous to the HEV and diesel-vehicle tax credits in the 1990s and 2000s, which have since expired, the notable differences are that the tax credit for most PEVs is much higher than the HEV and diesel credits. Because more people lease PEVs than purchase them, a higher fraction of PEV drivers see the benefits of the credit sooner; therefore, the effect of the PEV tax credits could be greater than the effect of the now expired HEV and diesel credits. However, a recent study found that 94.5 percent of survey respondents (adult drivers from the general public in 21 major U.S. cities) were not aware of PEV incentives and suggests that the effectiveness of the PEV credits could be enhanced through greater consumer awareness and education (Krause et al. 2013).
The U.S. state governments have offered a variety of financial incentives (see Table 7-2). The DOE Alternative Fuels Data Center maintains a database that provides a comprehensive listing of state incentives.13 Several states have offered purchase incentives in the form of tax credits in addition to the one offered by the federal government. The monetary amount varies from state to state; for example, as of August 2014, available tax credits ranged from $605 in Utah to up to $6,000 in Colorado. The tax credits have also varied over time; many have been reduced or recently expired. The method for calculating the credit varies from state to state; some states simply calculate it on the basis of purchase price, and others use battery capacity and purchase price to determine the amount. Several states have also used sales-tax exemptions or rebates to make the effect of the purchase incentive more immediate for those who choose to buy rather than lease. Some of these purchase incentives are restricted to certain types of PEVs. For example, the sales-tax exemptions in Washington and New Jersey are restricted to BEVs, and the rebate in Illinois is restricted to BEVs and range-extended PHEVs. California, however, provides rebates to BEVs and PHEVs, although the amount differs ($2,500 for BEVs and $1,500 for PHEVs in 2014). Using rebates and sales-tax exemptions is consistent with recent research that compares the effectiveness of HEV tax credits, sales-tax exemptions, and rebates and finds that the sales-tax exemptions and rebates appear to be more effective than tax credits possibly because of their immediacy, transparency, and simplicity (Chandra et al. 2010; Gallagher and Muehlegger 2011).
State governments have also used ownership and use incentives to promote PEV deployment. The most common have been exemptions from registration fees or vehicle inspections and reduced roadway taxes or tolls. Local governments have also offered discounted or free PEV charging or parking. States have also provided financial incentives for installing PEV charging stations so that consumers will be
_____________
12 The federal tax credit is $2,500 for PEVs that have battery capacities below 5 kWh. For PEVs that have larger battery capacities, the credit is set at $2,500 plus $417 times the amount that the battery capacity exceeds 5 kWh, up to a maximum of $7,500.
13 See U.S. Department of Energy, “State Laws and Incentives,” http://www.afdc.energy.gov/laws/state.
Tax credits and tax deductions are taken at the end of the tax reporting period. They act to lower the final year-end taxes owed to federal or state governments. Tax credits are considered more desirable because they directly offset a taxpayer’s liability in the exact amount of the credit. For example, if the end-of-year tax liability for a person was $18,000, a tax credit of $5,000 would directly lower the total taxes owed by that same amount, to $13,000.
In contrast, tax deductions reduce the amount of reported income that is subject to taxation, rather than directly offsetting taxes owed. If persons had taxable income of $60,000 (taxed at 25 percent), they would owe $15,000. If they took a $5,000 tax deduction, their taxable income would be reduced by that amount, to $55,000, which in turn would lower their tax liability by $1,250 to $13,750. Tax deductions are often subject to rules that limit the amounts that can be deducted or that restrict higher-income taxpayers from taking the full deduction.
As financial incentives, many tax credits are available to all persons who file a tax return whereas tax deductions are available only to those persons who file a tax return that itemizes deductions. Studies show that in the United States fewer than 50 percent of all federal tax returns claim itemized deductions (Prante 2007).
Tax exemptions are recognized at the time of a transaction (for example, at the point of sale) or during a regular tax reporting period (for example, vehicle registration renewal process). By exempting an entire asset or activity from taxation, the financial benefits are often realized immediately, such as with a sales tax exemption on a vehicle purchase. Tax exemptions are not usually subject to income-based qualifications or limitations, as is the case with many tax deductions.
Rebates provided by the government can take several forms, depending on their structuring. The key distinguishing feature of a rebate is that it is earned (and often processed) at the time of a qualifying purchase. Some rebate programs require an individual to submit proof of a qualifying purchase directly to the government to receive a rebate check; other rebates are provided to the seller of qualifying goods or services so that the total purchase price to the consumer can be reduced in an equal amount. However structured, both consumers and sellers tend to prefer rebates over tax credits, deductions, or exemptions because the financial benefits are immediately realized at the time of the purchase transaction, regardless of tax rates and method of tax filing.
A fee-bate is a method of taxing or applying a surcharge or fee on certain activities or classes of assets that are deemed to have undesirable social attributes to generate sufficient revenue to provide direct rebates for other activities or assets that are deemed to be more desirable. Because this section is more narrowly focused on the types of financial incentives that can be provided rather than the method of funding those incentives, a fee-bate system and rebates are treated in the same way because they both result in a rebate.
A subsidy is a more general term used to describe methods for government-provided financial assistance. A subsidy can take the common form of tax credits, deductions, exemptions, or rebates; or, a subsidy can include direct government grants, lower than market rate loans, loan guarantees, or myriad other ways for government to provide financial support.
sure that they will be able to charge their vehicle away from home. The most common and popular nonfinancial incentive offered by the states has been access to restricted lanes, such as bus-only, high-occupancy-vehicle, and high-occupancy-toll lanes. That incentive has been used by several states over the years to promote adoption of PEVs (and HEVs).
Other countries have used incentives similar to those used by the United States, as summarized in Table 7-2. The most popular have been purchase incentives in the form of tax exemptions or rebates, ownership incentives in the form of exemptions or reductions in registration or ownership taxes or fees, and use incentives in the form of reduced roadway taxes or tolls. Some of the financial incentives have been substantial. For example, Norway offers substantial tax breaks (no purchase tax, no annual registration tax, and no value-added tax) that amount to about $11,000 over the vehicle lifetime, or about $1,400 per year (Doyle and Adomaitis 2013). Commuters also do not pay road tolls, which are worth $1,400 annually, and receive free parking, which is worth $5,000. They are also permitted to drive in bus lanes and have access to free public charging at over 450 locations in Oslo (Doyle and Adomaitis 2013). Another example is the Netherlands, which had financial incentives that equaled as much as 85 percent of the vehicle price, although these have been reduced. It is important to note that the financial incentives in the Netherlands are particularly important because electricity prices are so high that the consumer’s incentive to use electricity as a fuel is small.
One interesting purchase rebate program is the one offered by the Clean Energy Vehicle Promotion Program in Japan. It is notable because it has a clear sunset, the rebate level declines every year on the basis of a preset formula, and the rebate amount financed by the government depends on whether vehicle manufacturers meet a preset annual price target (see Figure 7-1). The administering agency, the Ministry of Economy, Trade and Industry (METI 2013) calculates
TABLE 7-2 Incentives for Plug-in Electric Vehicles (PEVs) by Country and State
| Type of Incentive | Location |
| Financial Incentives | |
| Purchase Incentives—one-time financial benefit earned by purchase of PEV | |
|
Tax credits or deductions (realized only on filing tax return) |
U.S. federal government United States: Colorado, Georgia, Louisiana, South Carolina, Utah Other countries: Australia, Austria, Belgium, Israel |
|
Tax exemptions or rebates (realized at the point of sale) |
United States: California, District of Columbia, Illinois, Massachusetts, New Jersey, Pennsylvania, Texas, Washington Other countries: Canada (Ontario [for leased vehicles], British Columbia [purchased or leased], and Quebec [leased]), China, Estonia, France, Iceland, Ireland, Israel, Japan, Luxembourg, the Netherlands, Norway, Portugal, Spain, Sweden, U.K. |
| Ownership Incentives—recurring annual or periodic financial benefit that accrues to PEV owners, regardless of use | |
|
Exemption from or reduction in registration or ownership taxes or fees |
United States: Arizona, Connecticut, District of Columbia, Illinois, Maryland Other countries: Australia (Victoria), Austria, Belgium (Flanders), Denmark, Finland, Germany, Greece, Ireland, Italy, Japan Latvia, the Netherlands, Norway, Romania, Sweden, Switzerland (varies by region), U.K. |
|
Exemption from or reduction in weight surcharges (collected annually at time of registration or renewal) |
United States: Colorado |
|
Exemption from environmental taxes |
Other countries: Denmark |
|
Exemption from vehicle inspection |
United States: Arizona, California, Colorado, Connecticut, Delaware, District of Columbia, Georgia, Idaho, Illinois, Maryland, Massachusetts, Missouri, Nevada, New Jersey, New Mexico, New York, Oregon, Pennsylvania, Tennessee, Utah, Virginia, Washington, Wisconsin |
| Use Incentives—on-going financial benefits realized by driving a PEV | |
|
Exemption from motor fuel taxes |
United States: North Carolina, Utah, Wisconsin Other countries: European Union, Japan, Norway |
|
Reduced roadway taxes or tolls |
United States: California, New Jersey, New York Other countries: Austria, Czech Republic, Japan, the Netherlands, Norway, Switzerland (varies by region), U.K. |
|
Discounted or free PEV charging |
United States: Arizona, California, Delaware, Georgia, Illinois, Indiana, Kentucky, Maryland, Michigan, Minnesota, Nevada, Virginia Other countries: Japan, Norway |
|
Discounted or free PEV parking |
United States: Free parking available at some airports, such as Long Beach Airport; at parking garages in some states and localities, such as Nevada, Sacramento, and Santa Monica; and other locations, often with free charging Other countries: Denmark, Iceland, Norway |
| PEV Infrastructure Incentives—one-time financial benefit for deploying PEV charging stations | |
|
Tax credit or rebate for installing PEV charging station |
United States (individual and business): Arizona, California, Florida, Georgia, Illinois, Indiana, Louisiana, Maryland, Michigan, New York, Oklahoma, Oregon |
|
PEV charging infrastructure deployment subsidies |
United States (individual and business): California, Colorado, Connecticut, District of Columbia, Florida, Illinois, Maryland, Massachusetts, Nebraska, New Mexico, Ohio, Texas, Utah, Washington Other countries: Canada, European Union, Israel, Japan, Korea, Norway |
| Nonfinancial Incentives | |
| Use Incentives—on-going special privileges granted to PEV drivers | |
|
Access to restricted lanes, such as bus-only, high-occupancy-vehicle, and high-occupancy-toll lanes |
United States: Arizona, California, District of Columbia, Florida, Georgia, Hawaii, Maryland, New York, North Carolina, Tennessee, Utah, Virginia Other countries: the Netherlands, Norway |
|
Reserved parking for PEVs |
United States: Arizona, California, Hawaii, Washington |
SOURCES: Based on data from Gallagher and Steenblick (2013); Brand et al. (2013); Beltramello (2012); Morrow et al. (2010); Tesla (2013); DOE (2014b); Doyle and Adomaitis (2013); EV Norway (2014); Mock and Yang (2014); IEA (2013); Jin et al. (2014).
an annual price target by assuming a linear decline between a base price in 2012 and a long-term target price in 2016. To encourage vehicle manufacturers to reduce their sales prices every year, the government provides 100 percent of the rebate if the manufacturer meets the annual target price but subsidizes only about 67 percent of the rebate if the manufacturer exceeds the annual price target.
It is difficult to draw firm conclusions about the experiences with incentive programs in other countries given the cultural, political, and geographical differences. However, countries with substantial financial incentives for PEVs, such as Norway and the Netherlands, have seen a high rate of PEV adoption. Those with little or no financial incentives for PEVs—most notably Germany, which has not offered consumer incentives and has relied on demonstration programs in four major regions—have experienced minimal sales. Financial incentives, however, are not working everywhere, most notably in China, where there has been tepid consumer uptake despite the substantial financial incentives offered. One early analysis of that puzzling situation concludes that Chinese consumers are more concerned about vehicle performance than cost at this stage (Zhang et al. 2013). Further information on the international experience is provided in Appendix C.
There has been little academic research about the effectiveness of fiscal incentives in stimulating the adoption of PEVs. However, a greater body of evidence now exists regarding fiscal incentives and HEVs. Overall, that literature suggests that financial incentives do motivate consumers to purchase more fuel-efficient vehicles (see, for example, Huang 2010; Sallee 2011; Ozaki and Sevastyanova 2011). In general, it also seems that the more immediate the incentive, the more effective it is at persuading consumers to purchase the more fuel-efficient vehicle. Sales-tax exemptions or reductions and rebates at the state level have been associated much more strongly with consumer adoption, presumably due to their immediacy and ease of transaction. The federal cash-for-clunkers program, for example, offered a purchase rebate and resulted in strong consumer response to the immediate subsidy (Huang 2010).
Finding: Given the research on fiscal incentives and HEVs, the effectiveness of the federal income tax credit to motivate consumers to purchase PEVs would be enhanced by converting it into a rebate at the point of sale.
Finding: The U.S. state and local governments offer a variety of financial and nonfinancial incentives; there appears, however, to be a lack of research to indicate which incentives might be the most effective at encouraging PEV deployment.
Finding: The many state incentives that differ in monetary value, restrictions, and calculation methods make it challenging to educate consumers on the incentives that are available to them and emphasize the need for a clear, up-to-date source of information for consumers.
Finding: Overall, the experience worldwide demonstrates that substantial financial incentives are effective at motivating consumers to adopt PEVs.
High gasoline prices motivate consumers to drive less and to purchase a more fuel-efficient vehicle, at least for some time after prices rise noticeably. As noted by Diamond (2009, p. 982),
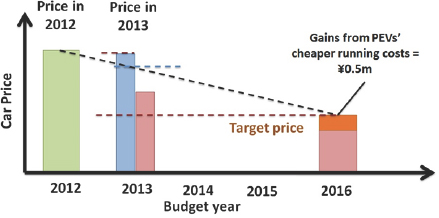
FIGURE 7-1 Japan’s clean energy vehicles promotion program. If a PEV’s price exceeds the dashed black line, the government subsidizes two-thirds of the difference. If a PEV’s price is below the dashed black line, the government subsidizes 100 percent of the difference. SOURCE: Based on data from METI (2013).
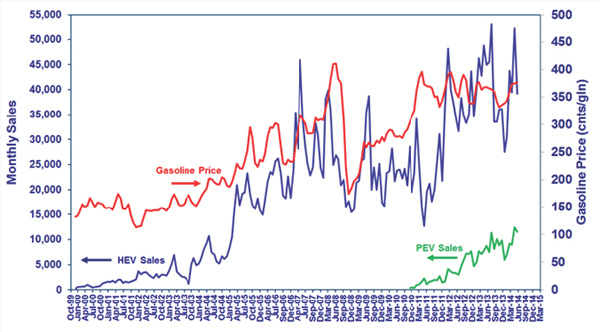
FIGURE 7-2 U.S. HEV and PEV sales overlaid with U.S. gasoline prices. NOTE: HEV, hybrid electric vehicle; PEV, plug-in electric vehicle. SOURCE: ANL (2014).
Gasoline prices serve as the most visible signal for consumers to think about fuel savings and fuel economy, so it is reasonable that relatively minor variations in gasoline prices could lead to significant changes in adoption patterns, particularly for people in the market for a new car as gas prices rise or fall.
Rapid increases in gasoline prices that increased adoption rates for HEVs provide some support for that assertion (see Figure 7-2). By the same token, low gasoline prices create a disincentive for PEV adoption. They reduce the savings in fuel costs that a consumer would realize by owning a PEV and could make the cumulative cost of PEV ownership appear less attractive than the same cost of a conventional ICE vehicle.
As of January 2015, U.S. gasoline prices were less than half of those in most European countries, including Belgium, France, Germany, Italy, the Netherlands, and the U.K. (EIA 2015). The higher gasoline prices in Europe and Asia are mostly due to considerably higher gasoline taxes, which more than double the price of gasoline per gallon. Accordingly, numerous studies in the United States and elsewhere have concluded that taxes on conventional transportation fuels that substantially raise the gasoline price create an incentive for consumers to purchase more fuel-efficient vehicles and to drive fewer conventional-vehicle miles (Diamond 2009; Morrow et al. 2010; Small 2012; Burke and Nishitateno 2013).
Broader market-based policies like carbon taxes and cap-and-trade regimes theoretically could create a disincentive for the use of conventional vehicles and an incentive for the use of PEVs. It is important to note, however, that the carbon taxes applied by a few countries (Denmark, Norway, Sweden, and Switzerland) and by the Canadian province of British Columbia on transportation fuels do not strongly affect the prices of petroleum fuels because the carbon content of gasoline and diesel fuels is much less than that of coal. California’s low-carbon fuel standard, which imposed a compliance cost of $13 per ton CO2 emissions, was assessed by Yeh and Witcover (2012) and was found to add one-tenth of a penny per gallon to the cost of gasoline in 2012. Thus, although carbon taxes and cap-and-trade regimes might be the most effective methods for reducing GHG emissions, they might not provide a meaningful incentive to purchase a PEV.
PAST INCENTIVES ON OTHER ALTERNATIVE VEHICLES AND FUELS
Over the past few decades, a number of federal and state policy initiatives have been implemented to stimulate the deployment of alternative vehicles and fuels. Air quality, climate change, and energy security concerns have motivated the initiatives. The primary alternative vehicles and fuels that have been considered in the light-duty fleet include HEVs, PEVs, and hydrogen FCVs, and methanol, ethanol, natural gas, propane, and biodiesel for use as fuels in conventional ICE vehicles.14 Key laws and regulations that are aimed di-
_____________
14 For the purposes of this report, the focus will be primarily on the lessons learned from alternative vehicles and fuels in light-duty vehicle applications.
rectly at alternative fuels or that provide incentives for alternative-fuel vehicles include the Alternative Motor Fuels Act of 1988, the Clean Air Act of 1990, the Energy Policy Act of 1992, the California ZEV program (originally adopted in 1990), the Renewable Fuel Standard (part of the Energy Policy Act of 2005 and the Energy Independence and Security Act of 2007),15 and the GHG and CAFE standards.
The public sector approach to developing, promoting, or deploying alternative-fuel vehicles includes (1) research and development, (2) demonstration projects, (3) fleet deployment, (4) niche market development, (5) public-private partnerships, and (6) various policy and financial incentives. The general approach has been based on the supposition that alternative-fuel vehicles would need to be subsidized until the point where the life-cycle costs of the vehicles and fuel would become competitive with those of gasoline-fueled vehicles; market forces would thereafter operate without subsidies, leading to broad deployment (NRC 2008, 2010a, 2013b).
In some cases in which advancements in technology were needed, government and private-sector funding of research and development led to a technology push. DOE partnered with the private sector on vehicle technologies and fuels through such activities as the Partnership for a New Generation of Vehicles (PNGV), the FreedomCAR and Fuel Partnership, and, currently, the U.S. Driving Research and Innovation for Vehicle Efficiency and Energy Sustainability (U.S. DRIVE) Partnership (NAS/NAE/NRC 2009; NRC 2008, 2010b, 2013a). Extensive work on bioenergy crops and technologies for their conversion into ethanol and, now, “drop-in” biofuels16 has also been funded (NRC 2011b).
To create a market pull for some of the technologies under development, various tax or policy mandates aimed at stimulating market demand were initiated. Financial incentives were especially needed for new technologies that were projected to be more expensive than the incumbent conventional technologies, at least in the initial and transitional phases. For example, tax credits for certain types of vehicles and tax breaks for certain fuels were put into the tax code to stimulate the adoption of the new, more costly technologies, at least for a period of time until increased production and economies of scale drove costs down to the point where the new technologies would be competitive in the marketplace. It was also thought that adoption by fleets and promotion in niche markets would, in many cases, help with this transition period by increasing sales and production and thus driving down costs, but studies evaluating the programs do not provide a clear picture of whether that strategy is useful (Leiby and Rubin 2004; McNutt and Rodgers 2004; Robertson and Beard 2004; Hwang 2009; NRC 2010b, 2013a; Greene 2012).
Methanol
There was great interest in methanol (MeOH) as a potential motor vehicle fuel in the late 1980s and early 1990s for a number of reasons (API/WRI 1990). Its high octane content could be used in some ICEs with a higher compression ratio to improve efficiency; it could also result in lower emissions than conventional gasoline-fueled vehicles and thus lead to improved air quality and better public health. From a national security point of view, it could displace imported petroleum if it was produced from biomass or from natural gas. The conversion of global sources of remote natural gas that were of low economic value was envisioned as an approach to diversify the U.S. global supply chain for light-duty vehicle fuels and replace petroleum.
Given extensive experience with the use of MeOH and ICEs in the world of competitive racing, the development of MeOH-powered vehicles did not necessitate fundamental technology breakthroughs and such vehicles were developed for the market that could operate on either high levels of methanol, such as 85 percent MeOH and 15 percent gasoline (referred to as M85), or on any combination between M0 and M85. These flexible-fuel vehicles (FFVs) were sold in the marketplace and represented a strategy for overcoming the chicken-and-egg problem of attracting investment in a methanol-fueling infrastructure before there are enough MeOH-fueled vehicles on the road and the lack of demand for such vehicles until an extensive fueling infrastructure is in place. It was anticipated that with MeOH FFVs, the vehicle owner could use the existing gasoline infrastructure while a MeOH-fueling infrastructure was built in response to vehicles deployed for fleets, incentives were implemented, and a business case for fuel investors became viable.
Despite subsidies, a broad M85 infrastructure never materialized. Furthermore, the continued improvement of gasoline-powered vehicles along with the development of reformulated gasoline resulted in gasoline-powered vehicles that could achieve the same or better emission performance as promised by MeOH and essentially eliminated the need for MeOH-fueled vehicles.
Ethanol
Similar to MeOH, ethanol (EtOH) is a fuel with a high octane content and one that could be produced from a variety of domestic resources, although it has an energy density per unit volume only two-thirds that of gasoline.17 It continues to be of interest with a focus on, as with methanol, the development of FFVs that can operate on mixtures from 0 percent EtOH and
_____________
15 Pub. L.110-140, 121 Stat. 1758. USC § 17001.
16 The term drop-in biofuel refers to the conversion of biomass into fuels, such as gasoline and diesel, that are compatible with, and can be “dropped into,” the current fueling infrastructure. This approach would avoid overcoming the barriers to developing and investing in the infrastructure necessary for a separate fueling system, such as would be required for fuels, such as ethanol, methanol, natural gas, and hydrogen.
17 The lower volumetric energy density results in a lower miles-per-gallon fuel efficiency compared with gasoline and, all else being equal, will require more frequent refueling.
100 percent gasoline to 85 percent EtOH and 15 percent gasoline (E85) to address the chicken-and-egg problem. EtOH was originally used as a gasoline additive during summer months to reduce air pollutant emissions. Later, the EtOH program was viewed as a means of displacing petroleum and using domestic resources for EtOH production. Vehicle manufacturers were given credits in CAFE regulations, and this led to a significant production of ethanol-capable FFVs. Although the program might have been a successful transition strategy for ultimately replacing gasoline with ethanol, the reality was that most of the ethanol-capable FFVs used little, if any, ethanol (NRC 2002).
In addition, the federal government invested a great deal of research and development in the development of nonfood crops (such as species of trees and grasses) that could be grown on energy plantations and whose cellulose could serve as a feedstock for conversion technologies to produce EtOH (NAS/NAE/NRC 2009; NRC 2011b). It was envisioned that, if successful, renewable fuel production system would have low net GHG emissions and enhance energy security and would not compete with land for the production of food. The development of cost-effective cellulosic-based EtOH technologies that can compete with gasoline has proven more difficult to achieve than anticipated. But there is ongoing demonstration and development of such biomass conversion technologies, and it remains to be seen how much this alternative fuel will contribute to the U.S. transportation fuel supply.
As with MeOH, an extensive system of fueling stations supplying E85 has yet to emerge, even though there are millions of EtOH FFVs on the road (most of which use gasoline) and the U.S. Congress mandated the use of a certain amount of EtOH through the Renewable Fuel Standard (NRC 2011b). To date, most EtOH is produced from corn or sugar cane and is used as a renewable-fuel replacement for petroleum with up to 10 percent EtOH blended into gasoline. In some places, mostly the Midwest, E15 can be sold and used in light-duty vehicles with a model year 2001 or later. Increasing the percentage for conventional vehicles has received opposition from some quarters because of the potentially deleterious effects of ethanol on engine components, particularly marine engines, although this is not an issue for FFVs. However, the aggressive policies and subsidies have led to about 7 percent replacement of gasoline-energy use in light-duty vehicles from less than 1 percent in 2000, and this demonstrates that sustained efforts by the federal government can have demonstrable effects in the market (Gruenspecht 2013).
Compressed Natural Gas
Another alternative-vehicle system that garnered interest in the 1990s and one that is also used worldwide are vehicles using compressed natural gas (CNG). They offer air quality advantages in urban areas and can be fueled from domestic sources of natural gas, which seemed plentiful and cheap in the 1990s as it has again in the past few years. Most of the vehicles developed were dedicated CNG vehicles that avoided the extra vehicle cost and complexity that would be needed for a dual-fuel vehicle, although some dual-fuel natural gas vehicles were offered in the market in 2012-2013, stimulated by low natural gas prices and projections of future plentiful reserves and associated low prices.
CNG is typically stored onboard the vehicle at 3,600 psi and requires high-pressure fueling stations. Incentives and mandates were provided in the 1990s to bring the vehicles to market, but because of the need for high-pressure fueling stations and bulky storage tanks on the vehicle and the shorter driving range compared with comparable gasoline-powered vehicles, they tended to be used in fleets where the vehicles returned to a central station at the end of each day and could be refueled. They were somewhat more expensive than comparable gasoline-powered vehicles, trunk space was somewhat compromised, driving range was shorter, and an extensive refueling infrastructure was not, and still is not, available. Consumers did not embrace CNG vehicles, and these vehicles have not moved beyond the niche fleet markets.
Fuel-Cell Vehicles
Another major alternative vehicle and fuel technology that has been promoted and developed to varying degrees by the public and private sector is the hydrogen-fueled FCV. It uses on-board hydrogen in a fuel cell to produce electric power to drive the vehicle. Because its only emission is water vapor, it is classified by California as a ZEV. The federal government and the private sector have provided substantial funding for research and development, for vehicle demonstrations, and for parts of the needed hydrogen infrastructure (NRC 2010b, 2013a). There has been significant technical progress and promise of driving ranges and fueling times comparable with those of conventional vehicles, but they are still a work in progress. Cost-effective production of hydrogen, deploying the necessary hydrogen infrastructure, and overcoming the chicken-and-egg barriers remain formidable challenges for these vehicles. Some vehicle manufacturers have indicated that such vehicles will be available for the market in the 2015-2016 time frame, and Hyundai began leasing a fuel-cell vehicle in California in 2014. However, the higher costs of these vehicles compared with conventional vehicles will be substantial, and thus their deployment will require subsidies and other new technologies to overcome the initial cost barrier (NRC 2008, 2013b).
Hybrid Electric Vehicles
In 1999, HEVs were introduced into the U.S. automotive market (ANL 2014). A federal income tax incentive for HEVs existed between 2000 and 2010. The original tax incentives provided a tax deduction of up to $2,000, but the Energy Policy Act of 2005 increased it to a maximum of $3,400 and con-
verted it into a tax credit. The deductions and credits were the maximums granted for the most fuel-efficient vehicles. HEVs with lesser fuel-economy received more modest tax credits. The tax credits were available for the first 60,000 vehicles sold by a manufacturer, after which time the tax credits would expire. In addition to the federal income tax credits, states offered a wide array of other consumer incentives, including income tax credits, sales-tax reductions or exemptions, access to high-occupancy-vehicle (HOV) lanes, reduced registration fees, and exemptions from emissions testing, similar to the incentives now offered for PEVs.
The effectiveness of the purchase incentives for HEVs has been extensively studied in the United States and elsewhere. As noted above, the most important finding from the literature is that, immediate purchase incentives (such as a sales-tax exemption or instant rebate) are more effective than tax credits or deductions because consumers appear to focus on up-front price and highly discount long-term cost savings (Diamond 2009; Chandra et al. 2010; Gallagher and Muehlegger 2011). With immediate incentives, buyers do not have to wonder whether they will qualify for the credit when they file taxes in the next year or estimate its value given their income bracket. With immediate incentives, the purchase price can be adjusted at the time of sale. A study of Canadian experience with tax rebates for HEVs, which were established at the point of sale, found that they were highly effective (Chandra et al. 2010).
Lessons Learned from Past Incentive Programs
The past incentive programs for alternative-fuel technologies indicate that the market for advanced technology adoption needs to be cultivated to progress beyond early adopters. Sustained efforts and economic incentives that create a profitable business case, however, can have demonstrable effects. The ethanol example is one where the regulatory mandate was successful at advancing an alternative-fuel technology; the percentage of ethanol in the domestic gasoline supply by volume increased from less than 1 percent in 2000 to 10 percent in 2011. Using fleets to encourage mainstream adoption does not appear to be particularly effective (for example, in the case of CNG vehicles). Cost reduction and technology advances will continue to evolve as product volumes increase, but in the meantime, financial incentives are needed to make a technology more cost-competitive. The hybrid example, with a U.S. adoption rate still below 4 percent, shows that even with financial incentives and substantial technology advances, moving the deployment from successful regional and niche markets to mainstream adoption remains a challenge.
Because there has not been any extensive research on regulatory or incentive programs that promote PEV adoption, it was difficult for the committee to determine which incentives would be the most effective and should be pursued. However, on the basis of its review of the barriers to PEV adoption and current and past federal and state incentive programs, the committee offers the following recommendations:
Recommendation: Federal financial incentives to purchase PEVs should continue to be provided beyond the current production volume limit as manufacturers and consumers experiment with and learn about the new technology. The federal government should re-evaluate the case for incentives after a suitable period, such as 5 years. Its re-evaluation should consider advancements in vehicle technology and progress in reducing production costs, total costs of ownership, and emissions of PEVs, HEVs, and ICE vehicles.
Recommendation: Given the research on effectiveness of purchase incentives, the federal government should consider converting the tax credit to a point-of-sale rebate.
Recommendation: Given the sparse research on incentives other than financial purchase incentives, research should be conducted on the variety of consumer incentives that are (or have been) offered by states and local governments to determine which, if any, have proven effective in promoting PEV deployment.
Al-Alawi, B.M., and T.H. Bradley. 2014. Analysis of corporate average fuel economy regulation compliance scenarios inclusive of plug in hybrid vehicles. Applied Energy 113:1323-1337.
ANL (Argonne National Laboratory). 2014. “Light Duty Electric Drive Vehicles Monthly Sales Updates.” http://www.transportation.anl.gov/technology_analysis/edrive_vehicle_monthly_sales.html. Accessed August 20, 2014.
API/WRI (American Petroleum Institute and World Resources Institute). 1990. Methanol as an Alternative Fuel Choice: An Assessment. Washington, DC: International Energy Program, Foreign Policy Institute, the Paul H. Nitze School of Advanced International Studies, Johns Hopkins University, Washington, DC.
Beltramello, A. 2012. “Market Development for Green Cars.” OECD Green Growth Papers. No. 2012-03. Paris: OECD Publishing.
Brand, C., J. Anable, and M. Tran. 2013. Accelerating the transformation to a low carbon passenger transport system: The role of car purchase taxes, feebates, road taxes, and scrappage incentives in the UK. Transportation Research Part A: Policy and Practice 49: 132-148.
Burke, P., and S. Nishitateno. 2013. Gasoline prices, gasoline consumption, and new vehicle fuel economy: Evidence
from a large sample of countries. Energy Economics 36: 363-370.
CARB. 2013. Final Regulation Order §1962.2 Zero Emission Vehicle Standards for 2018 and Subsequent Model Year Passenger Cars, Light-Duty Trucks, and Medium-Duty Vehicles. http://www.arb.ca.gov/msprog/zevprog/2011zevreg/attachb3.pdf.
Chandra, A., S. Gulati, and M. Kandlikar. 2010. Green drivers or free riders? An analysis of tax rebates for hybrid vehicles. Journal of Environmental Economics and Management 60(2): 78-93.
Diamond, D. 2009. The impact of government incentives for hybrid-electric vehicles: Evidence from US states. Energy Policy 37(3): 972-983.
DOE (U.S. Department of Energy). 2011. One Million Electric Vehicles by 2015: February 2011 Status Report. http://www1.eere.energy.gov/vehiclesandfuels/pdfs/1_million_electric_vehicles_rpt.pdf.
DOE. 2014a. “Vehicle Cost Calculator.” Alternative Fuels Data Center. http://www.afdc.energy.gov/calc/.
DOE. 2014b. “State Laws and Incentives.” Alternative Fuels Data Center. http://www.afdc.energy.gov/laws/state.
Doyle, A., and N. Adomaitis. 2013. “Norway Shows the Way with Electric Cars, but at What Cost? Reuters, March 13. http://www.reuters.com/article/2013/03/13/us-cars-norway-idUSBRE92C0K020130313.
Edwards, A. 2013. “The PEV Customer: How to Overcome Potential Sales Barriers.” Presentation to the Committee on Overcoming Barriers to Electric-Vehicle Deployment, Washington, DC, December 3.
EIA (U.S. Energy Information Administration). 2015. “Retail Premium Gasoline Prices, Selected Countries.” http://www.eia.gov/countries/prices/gasolinewithtax.cfm.
EPA/NHTSA (U.S. Environmental Protection Agency and National Highway Traffic Safety Administration). 2012a. 2017 and Later Model Year Light-Duty Vehicle Greenhouse Gas Emissions and Corporate Average Fuel Economy Standards. Federal Register 77(199): October. http://www.gpo.gov/fdsys/pkg/FR-2012-10-15/pdf/2012-21972.pdf.
EPA/NHTSA. 2012b. Joint Technical Support Document: Final Rulemaking for 2017-2025 Light-Duty Vehicle Greenhouse Gas Emission Standards and Corporate Average Fuel Economy Standards. Report No. EPA-420-R-12-901. Washington, DC.
EV Norway. 2014. “Powered by Nature: A Guide to Norway, the World’s Leading EV Market.” http://www.evnorway.no/. Accessed January 31, 2015.
Gallagher, K.S., and M. Muehlegger. 2011. Giving green to get green? Incentives and consumer adoption of hybrid vehicle technology. Journal of Environmental Economics and Management 61(1): 1-15.
Gallagher, K.S., and R. Steenblick. 2013. Technology-Push and Demand-Pull Policies to Support Electric Propulsion. OECD Report COM/TAD/ENV/JWPTE, Paris, France.
Greene, D.L. 2012. “Alternative Fuels: What Have We Learned?” Presentation at ARPA-e Transportation Behavior and New Technology Workshop, Berkeley, CA, March 16. http://arpa-e.energy.gov/sites/default/files/documents/files/Alternative%20Fuels%20-%20What%20Have%20We%20Learned.pdf.
Gruenspecht, H. 2013. “Biofuels in the United States: Context and Outlook.” Presented at the Biofuels Workshop, Institute of Medicine, National Academy of Sciences, Washington, DC, January 24. http://www.eia.gov/pressroom/presentations/howard_01242013.pdf.
Huang, E. 2010. “Do Public Subsidies Sell Green Cars? Evidence from the U.S. ‘Cash for Clunkers’ Program.” Discussion Paper #2010-17. Harvard Kennedy School, Belfer Center, Cambridge, MA. December.
Hwang, R. 2009. “U.S. Alternative Fuels Policies: Lessons Learned and Future Directions.” Presentation at Senate Briefing on Alternative Fuels. Washington, DC, February 6.
IEA (International Energy Agency). 2013. Global EV Outlook: Understanding the Electric Vehicle Landscape to 2020. http://www.iea.org/publications/globalevoutlook_2013.pdf.
IRS (Internal Revenue Service). 2009. “Qualified Vehicles Acquired after 12-31-2009.” Last reviewed or updated November 17, 2014. http://www.irs.gov/Businesses/Qualified-Vehicles-Acquired-after-12-31-2009.
Jin, L., S. Searle, and N. Lutsey. 2014. “Evaluation of State-Level U.S. Electric Vehicle Incentives.” White Paper presented to the International Council on Clean Air Transportation. http://www.theicct.org/sites/default/files/publications/ICCT_state-EV-incentives_20141030.pdf.
Keddie, E. 2013. “California’s Zero Emission Vehicle (ZEV) Regulation.” Presentation to the Committee on Overcoming Barriers to Electric-Vehicle Deployment, Irvine, CA, May 8.
Krause, R.M., S.R. Carley, B.W. Lanea, and J.D. Graham. 2013. Perception and reality: Public knowledge of plugin electric vehicles in 21 U.S. cities. Energy Policy 63: 433-440.
Leiby, P., and J. Rubin. 2004. “Understanding the Transition to New Fuels and Vehicles: Lessons Learned from Analysis and Experience of Alternative Fuel and Hybrid Vehicles.” In The Hydrogen Energy Transition: Moving Towards the Post-Petroleum Age in Transportation, edited by D. Sperling and J. Cannon, 191-212. Waltham, MA: Elsevier Academic Press.
McNutt, B., and D. Rodgers. 2004. “Lessons Learned from 15 Years of Alternative Fuels Experience—1988 to 2003.” In The Hydrogen Energy Transition: Moving Towards the Post-Petroleum Age in Transportation, edited by D. Sperling and J. Cannon, 165-179. Waltham, MA: Elsevier Academic Press.
METI (Ministry of Economy, Trade, and Industry). 2013. “Our Policy about Promoting EVs.” Presentation to the
Committee on Overcoming Barriers to Electric-Vehicle Deployment, Tokyo, Japan, December 9.
Mock, P., and Z. Yang. 2014. “Driving Electrification: A Global Comparison of Fiscal Incentive Policy for Electric Vehicles.” White paper submitted to the International Council of Clean Transportation, Washington, DC, May. http://www.theicct.org/sites/default/files/publications/ICCT_EV-fiscal-incentives_20140506.pdf.
Morrow, W.R., K.S. Gallagher, G. Collantes, and H. Lee. 2010. Analysis of policies to reduce oil consumption and greenhouse-gas emissions from the U.S. transportation sector. Energy Policy 38(3): 1305-1320.
NAS/NAE/NRC (National Academy of Sciences, National Academy of Engineering, and National Research Council). 2009. America’s Energy Future: Technology and Transformation. Washington, DC: The National Academies Press.
NRC (National Research Council). 2002. Effectiveness and Impact of Corporate Average Fuel Economy (CAFÉ) Standards. Washington, DC: The National Academies Press.
NRC. 2008. Transitions to Alternative Transportation Technologies—A Focus on Hydrogen. Washington, DC: The National Academies Press.
NRC. 2010a. Transitions to Alternative Transportation Technologies: Plug-in Hybrid Electric Vehicles. Washington, DC: The National Academies Press.
NRC. 2010b. Review of the Research Program of the FreedomCAR and Fuel Partnership, Third Report. Washington, DC: The National Academies Press.
NRC. 2011a. Assessment of Fuel Economy Technologies for Light-Duty Vehicles. Washington, DC: The National Academies Press.
NRC. 2011b. Renewable Fuel Standard: Potential Economic and Environmental Effects of U.S. Biofuel Policy. Washington, DC: The National Academies Press.
NRC. 2013a. Review of the Research Program of the U.S. DRIVE Partnership, Fourth Report. Washington, DC: The National Academies Press.
NRC. 2013b. Transitions to Alternative Vehicles and Fuels. Washington, DC: The National Academies Press.
Ohnsman, A. 2013. “Tesla Tops California Green-Car Credit Sales in Past Year.” Bloomberg Businessweek, October 16. http://www.businessweek.com/news/2013-10-16/musk-s-tesla-tops-california-green-car-credit-sales-in-past-year.
Ozaki, R., and K. Sevastyanova. 2011. Going hybrid: An analysis of consumer purchase motivations. Energy Policy 39(5): 2217-2227.
Prante, G. 2007. “Most Americans Don’t Itemize on Their Tax Returns.” Tax Foundation, July. http://taxfoundation.org/article/most-americans-dont-itemize-their-tax-returns.
Robertson, B., and L.K. Beard. 2004. “Lessons Learned in the Deployment of Alternative Fueled Vehicles.” In The Hydrogen Energy Transition: Moving Towards the Post-Petroleum Age in Transportation, edited by D. Sperling and J. Cannon, 181-190. Waltham, MA: Elsevier Academic Press.
RTI/UMTRI (Research Triangle Institute and University of Michigan Transportation Research Institute). 2009. Automobile Industry Retail Price Equivalent and Indirect Cost Multipliers: Report Prepared for the U.S. Environmental Protection Agency. RTI Project Number 0211577.002.004. Washington, DC.
Sallee, J.M. 2011. The surprising incidence of tax credits for consumers. American Economic Journal: Economic Policy 3(2): 189-219.
Small, K. 2012. Energy policies for passenger motor vehicles. Transportation Research Part A: Policy and Practice 46(6): 874-889.
State ZEV Programs. 2013. “State Zero-Emission Vehicle Programs—Memorandum of Understanding.” Signed October 24, 2013. http://arb.ca.gov/newsrel/2013/8s_zev_mou.pdf.
Tellis, G. 2013. “Toyota’s Gamble on the Prius.” Financial Times Management. Financial Times, March 4. http://www.ft.com/intl/cms/s/0/146ad23c-7230-11e2-89fb00144feab49a.html#axzz3IJ1hL64u.
Tesla. 2013. “Electric Vehicle Incentives Around the World.” http://www.teslamotors.com/incentives/japan. Accessed February 14, 2013.
Yeh, S., and J. Witcover. 2012. Status Review of California’s Low Carbon Fuel Standard. Series UCD-ITS-RP-12-33. University of California, Davis. August.
ZEV Program Implementation Task Force. 2014. Multi-State ZEV Action Plan. March. http://www.nescaum.org/documents/multi-state-zev-action-plan.pdf/.
Zhang, X., K. Wang, Y. Hao, J. Fan, and Y. Wei, 2013. The impact of government policy on preference for NEVs: The evidence from China. Energy Policy 61: 382-393.
This page intentionally left blank.


