
3
Supply of Interregional Transportation
The 1995 American Travel Survey (ATS) is the last national survey indicating how the transportation system is used for interregional travel in the United States. The modal use patterns observed in the ATS, such as high rates of automobile and airline use, reflect both the transportation service attributes preferred by surveyed travelers and the choices available to them. Examples of service attributes are price, travel time, schedule frequency and reliability, ride comfort, service proximity, and safety.1 In some interregional markets, travelers may choose among many competing service offerings; in others, their options may be few. Fast and frequent train service, for example, is available in relatively few places. Accordingly, observed modal use patterns are the outcome of traveler preferences interacting with the available transportation supply.
This chapter examines the supply of interregional transportation in the United States. The four main modes are automobiles, buses, airplanes, and trains. Each mode is described in a general way. How their services are supplied and the extent to which they are available in various parts of the country are discussed. Typical service attributes of the four modes are described, but the variability of the service offerings within each mode is also recognized. Airlines, for example, can schedule more frequent flights with smaller airplanes to accommodate travelers who demand frequent service, or they can schedule less frequent flights with larger airplanes to attract travelers seeking lower fares. The availability of the interregional transportation modes and their service offerings can vary considerably among regions of the country. Regional comparisons
________________
1 For examples of service attributes of interest to travelers, see the survey results from the Northeast Corridor Intercity Travel Summary Report (Northeast Corridor Commission 2015, 12).
of flight frequencies, average train speeds, and nonstop bus departures can sometimes show dramatic differences. The most striking variability is in passenger train service. In some corridors, particularly the Northeast, train service is frequent and scheduled at convenient times. In many others, including some that are heavily traveled, regular train service does not exist.
When the ATS was conducted 20 years ago, few could have predicted the ways in which the supply of interregional transportation would be affected by technological advances outside the transportation domain. The Internet, for example, has become commercialized, and smartphones and other portable electronic devices have been introduced on a mass scale. These developments have affected not only how travelers shop for bus, air, and train fares but also how they use and value the time spent traveling. Therefore, the descriptions of the modes conclude with a brief discussion of some of the changes that have taken place with respect to each.
AUTOMOBILES AND INTERREGIONAL TRAVEL
Widespread ownership of automobiles has undoubtedly affected how often Americans make interregional trips. In 2009, there were nearly two registered vehicles per household, up 5 percent since 1995 and 18 percent since 1977 (Table 3-1). In view of the heavy use of automobiles for commuting, shopping, and other local trip making, their utility for longer-distance travel is likely to be a secondary factor in most household decisions to obtain a car. Nevertheless, once a car is available, the added cost of using it for periodic out-of-town trips can be low.
TABLE 3-1 Vehicle Ownership and Licensing Rates from the 1969, 1977, 1983, 1990, 1995, 2001, and 2009 National Personal Transportation and National Household Travel Surveys
| 1969 | 1977 | 1983 | 1990 | 1995 | 2001 | 2009 | Percent Change, 1969–2009 | |
| Vehicles per household | 1.16 | 1.59 | 1.68 | 1.77 | 1.78 | 1.89 | 1.87 | 61 |
| Licensed drivers per household | 1.65 | 1.69 | 1.72 | 1.75 | 1.78 | 1.77 | 1.88 | 14 |
| Vehicles per licensed driver | 0.70 | 0.94 | 0.98 | 1.01 | 1.00 | 1.06 | 1.00 | 42 |
The private automobile offers many advantages for out-of-town travel. Its door-to-door service can be convenient and save time and expense by avoiding the need for mode transfers and by providing a means of local transportation at the destination. For the elderly and others who find transfer between modes physically difficult, travel by car may be the only practical way to make longer trips. For those traveling for leisure activities, driving can provide the means for viewing scenery, shopping, and visiting attractions en route. The automobile provides secure stowage of luggage and can carry or tow recreational equipment such as skis, bicycles, and campers. It provides seating space at little extra cost for multiple travelers, allows for customized scheduling of departures, and offers the flexibility for unplanned schedule changes without fare penalties. These features can be particularly important for families trying to minimize their total transportation costs.
Among the costs incurred by travelers making long-distance trips by automobile are fuel expenses, added vehicle depreciation and maintenance, toll charges, and parking fees. If the time required for travel is made longer by driving, the motorist may incur additional expenses for overnight lodging and restaurant meals. The time devoted to operating the vehicle may be viewed as burdensome and unproductive compared with travel by commercial modes. It can deter business travelers who want to conduct work en route from using the automobile. Highway traffic congestion can reduce the utility of driving by requiring the inconvenient scheduling of trips at off-peak times.
The option of driving is not available to everyone. About 14 percent of people of driving age do not have licenses, a proportion that rises to nearly 30 percent in New York State because of low licensing rates in New York City.2 Some licensed drivers are physically unable to drive long distances or feel unsafe or insecure driving outside their communities. Others lack access to automobiles. Some people cannot afford a private vehicle, and others choose to go without. According to the Census Bureau, nearly 10 percent of households do not own a car.3 However,
________________
2https://www.fhwa.dot.gov/policyinformation/statistics/2011/dl1c.cfm.
3 Estimates for 2010, 2011, and 2012, U.S. Bureau of the Census, American Community Survey, Table CP04. http://factfinder.census.gov/faces/tableservices/jsf/pages/productview.xhtml?src=bkmk.
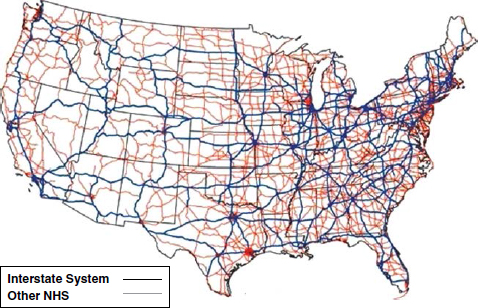
FIGURE 3-1 National Highway System. (SOURCE: Federal Highway Administration.)
some of those who lack an automobile may travel by rental car or in a vehicle owned by a family member or friend.
Regional Differences in Highway Reliability
The U.S. highway system is ubiquitous. Its high density in urbanized areas often means that multiple highway routings are available to those taking out-of-town trips. Most long-distance trips made by automobile use the Interstate highway system, which connects all of the country’s largest cities with fairly direct routings with high traffic capacity (Figure 3-1). The 47,000-mile Interstate highway system alone accommodates nearly 25 percent of all miles traveled by cars and light trucks,4 and presumably it accounts for an even higher share of miles traveled interregionally. Thousands of miles of other high-quality highways provide additional connections between the country’s metropolitan regions.
________________
4http://www.fhwa.dot.gov/policyinformation/statistics/2012/vm1.cfm.
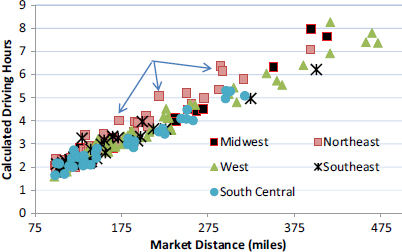
FIGURE 3-2 Nominal driving times in 200 of the most heavily traveled interregional city-pair markets. Travel times are calculated mainly on the basis of speed limits, with lower limits tending to signify urbanized areas. Northeast markets tend to have higher estimated highway driving times. (SOURCE: Google Maps.)
Estimates of the time required to drive between two metropolitan regions can be made by using trip planning software such as Google Maps and MapQuest. These programs select the most direct freeway route to calculate travel times mainly on the basis of posted speed limits and the assumption of no rest breaks or variability in travel speed due to weather or traffic conditions. In Figure 3-2, driving times from these calculators are plotted by market distance for 200 of the country’s most heavily traveled interregional city-pair markets.5 For markets of comparable distance, driving times tend be slightly higher in the Northeast, probably because of lower speed limits through high-traffic, urbanized areas. In general, however, travelers in all geographic regions have comparable access to highways that offer fairly direct connections between major cities.
Drivers seldom lack a reasonably direct highway route,6 but traffic congestion can be a deterrent to driving longer distances. Episodic congestion
________________
5 See Chapter 4 for the means used to identify the 200 markets surveyed.
6 Cases of circuitous highway routing are usually due to mountainous terrain or bodies of water (e.g., Cleveland, Ohio, and Detroit, Michigan, lack a direct routing because of Lake Erie).
occurs as a result of crashes, construction activity, and weather events. Recurrent congestion tends to be caused by high traffic volumes, which are more common on urban highways. Because most interregional trips begin and end in metropolitan areas, the potential for traffic congestion is highest at the start and end of the trip. Researchers at the Texas A&M Transportation Institute (TTI) and INRIX found that in 2014 one in four urban highway trips experienced delays from congestion and that drivers spend an average of 30 percent more time in their car when they travel during congested periods (Schrank et al. 2015, 8, 10). However, the TTI–INRIX data are for all highway trips, including local commuting. Longer-distance travelers may be able to adjust their travel times to avoid the commuting peaks.
The prospect of en route delays increases for trips in corridors that contain multiple urban areas, such as the corridor between Washington, D.C., and New York City. One way to gauge the potential for congestion-related delay is to examine annual average daily traffic (AADT) levels on the Interstate highways that connect metropolitan areas. Three examples of interregional highway corridors are given in Figure 3-3. All three have traffic volumes that are highest at their urban starting and ending points. The three markets differ in the pattern of traffic during the en route phase of the trip. In the case of I-10 between Los Angeles and Phoenix, traffic volumes are high near the two cities but drop off markedly during the more than 200 miles of connecting freeway traversing sparsely populated desert. I-75 west of Miami has relatively light traffic as it passes through 80 miles of parkland but then experiences high traffic volumes as it passes through several cities on Florida’s Gulf Coast before reaching Tampa. I-95 between Washington, D.C., and Philadelphia is an example of an interregional highway corridor that is urbanized over nearly the entire route.
Figure 3-4 shows highways experiencing congestion during peak travel times. Regional variability in highway congestion is visible. The Northeast’s I-95 corridor stands out in terms of the scope of peak congestion, which is almost uninterrupted from Boston, Massachusetts, to Washington, D.C. Large pockets of congestion can also be found in interregional corridors in the Great Lakes region, southeastern Florida, and southern and northern California. Although many of these corridors experience chronic congestion for considerable distances outside of the metropolitan areas, the congestion does not encompass the hundreds of miles of
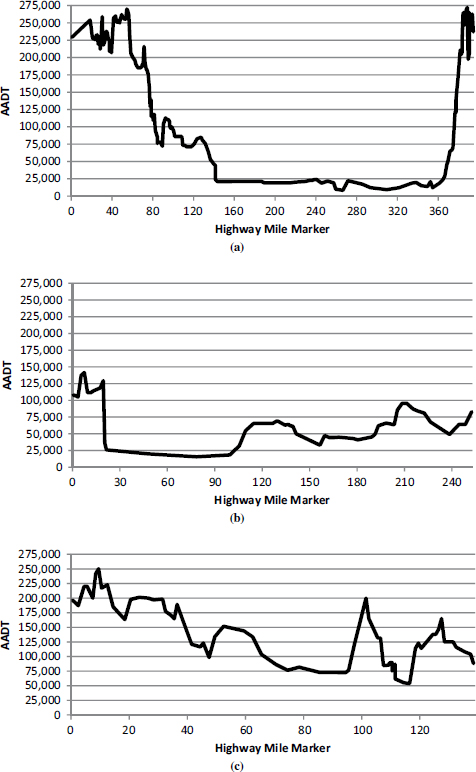
FIGURE 3-3 AADT on selected Interstate highways connecting large interregional markets, 2011: (a) Los Angeles–Phoenix, I-10; (b) Miami–Tampa, I-75; and (c) Washington–Philadelphia, I-95. (SOURCE: Compiled by the committee from data reported in the Federal Highway Administration’s Highway Performance Monitoring System for 2011.)
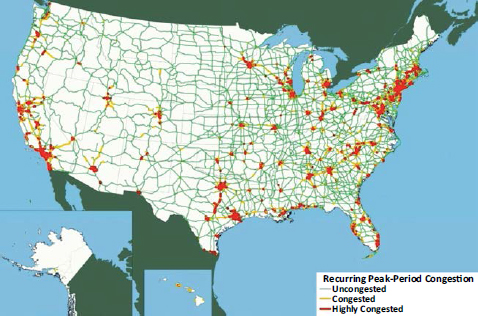
FIGURE 3-4 Peak-period congestion on the National Highway System, 2007. (SOURCE: Federal Highway Administration.)
highway corridor connecting other large cities, as experienced on I-95. Furthermore, as noted earlier, interregional drivers can control the times of the day and week they travel, and peak-period congestion may not be a good indicator of the conditions they experience en route.
The Changing Driving Experience
The building of the Interstate highway system during the second half of the 20th century made interregional driving faster, safer, and more reliable. Before the development of freeways, driving longer distances often involved traveling on meandering routes interrupted by traffic lights, through town centers, and on roads of widely varying capacity and quality. Today, the ability to drive hundreds of miles without encountering a single traffic light is taken for granted. Whereas driving on the Interstate system was once viewed as fast and dependable, growing traffic volumes may have eroded these benefits in some urbanized areas. From the perspective of the motorist traveling long distances, perhaps the most perceptible change in the freeway infrastructure over the past two decades
has been the installation of regional electronic toll collection systems and the availability of real-time information on traffic conditions and routing alternatives. By reducing backups at toll booths and providing travelers with detour options, these innovations may have countered some of the congestion impacts and even added to the freeway system’s time-saving advantages on some routes.
Vehicle advances have also been extensive over time and likely contribute to the popularity of driving for interregional travel. Among them are the introduction decades ago of dependable radial tires, quieter interiors, and air-conditioning. Over the past 20 years, electronic systems have proliferated in the automobile. They have increased its reliability and added features that can make driving less onerous for the driver and passengers (TRB 2012). Smartphones, Internet access, and video players help entertain passengers on longer trips. GPS may make driving less stressful on unfamiliar roads and during poor weather conditions. Motorists may have less fear of being stranded by mechanical failure, because modern cars are more reliable and mobile phones can be used to request emergency service. Other communications, sensing, and onboard electronics systems help drivers control the vehicle—for example, by taking evasive actions and maintaining safe following distances and lane positioning. Whether continued advances in these areas will allow fully automated driving to become possible is not yet known, but they could have far-reaching effects on longer-distance travel.7
Other technological advances could make driving a possibility for travelers who do not own or have access to a car, and perhaps for longer-distance trips. Smartphone applications such as Uber and Lyft have commercialized ridesharing. They use a smartphone’s GPS to match a person’s location with the nearest available driver. The ride is reserved, the fare calculated, and the charge automatically billed to a credit card. These services, as well as peer-to-peer car renting,8 could find application for longer trips. Rental car companies have long offered discounts on weekend rentals to attract customers who need a car for occasional out-of-town trips. Carsharing programs, in
________________
7https://www.enotrans.org/wp-content/uploads/wpsc/downloadables/AV-paper.pdf.
8 Peer-to-peer car renting refers to the process whereby car owners rent their vehicles to others for short periods of time, usually facilitated by a website and a mobile application.
which subscribers share a fleet of cars, have been introduced in most of the country’s largest cities, mostly for quick, local trips.9 Investment by major rental car companies in such programs suggests an expectation of growth in the market, possibly in the direction of the cars being used for longer periods and for more out-of-town travel.10
These technology-aided developments have expanded local transportation options and perhaps made longer-distance airline and train travel more attractive by making rides to and from terminals easier to obtain. Whether variants of these car- and ridesharing services will become viable for longer-distance driving is not yet known. They provide examples of the difficulty of predicting the supply of interregional transportation.11
AIRPLANES AND INTERREGIONAL TRAVEL
Most air travel is on scheduled airlines that operate in networks connecting hundreds of cities in the United States and abroad. Nearly all flights are routed through an airline’s hub airports, where passengers from multiple spoke airports are consolidated for connecting service to their destination cities.12 From the perspective of airlines, a hub-and-spoke network is advantageous because it creates density economies by allowing travelers from numerous markets to share flights, thereby increasing aircraft occupancy. From the perspective of travelers, the consolidation of passenger traffic at hubs allows more frequent flights. For travelers beginning or ending their trips in these cities, frequent nonstop flights will be available to and from numerous destinations, including most large and medium-size cities in their respective regions. Only in markets where there
________________
9http://tsrc.berkeley.edu/sites/tsrc.berkeley.edu/files/Carsharing%20Niche%20Market%20or%20New%20Pathway.pdf.
10 For example, in 2013 Avis purchased one of the nation’s largest carsharing programs, Zipcar. Enterprise operates a local carsharing program known as WeCar and has acquired a number of other local carsharing programs around the country, including PhillyCarShare in Philadelphia, Mint Cars On-Demand in New York City and Boston, and IGO CarShare in Chicago.
11http://tsrc.berkeley.edu/sites/tsrc.berkeley.edu/files/Ridesharing%20in%20North%20America%20Past%20%20Present%20%20and%20Future.pdf.
12 The number of city pairs created in a hub-and-spoke network is equivalent to ½(x + x2), where x is the number of spokes. Hence, a hub that has nonstop service to 50 cities can theoretically provide nonstop and one-stop service to 1,275 city pairs.
is high passenger demand will an airline schedule point-to-point service that bypasses one of its main hubs.
The main airports in the country’s largest cities tend to serve as airline hubs.13 In addition, many large metropolitan regions have multiple airports with scheduled airline service.14 The New York metropolitan area, for example, is served by LaGuardia, JFK, and Newark Airports. While Los Angeles International Airport is the main airport in Los Angeles, the metropolitan region contains many smaller airports with significant scheduled service, including airports in Burbank, Ontario, and Orange County. During the past 20 years, airlines have added service at secondary airports such as in Providence and Manchester outside Boston, Islip outside New York, and Long Beach outside Los Angeles. Because these secondary airports often have excess gate and operational capacity, airlines incur reduced costs and can charge lower fares (Dresner et al. 1996).
Secondary airports are located close to suburban populations that are the source of substantial amounts of both leisure and business travel demand. Studies of airport use patterns have consistently shown that airport proximity is important in determining which airport travelers use in a multiairport region (Windle and Dresner 1995). For shorter-haul, interregional flights, the access time saved by being closer to a suburban airport may be even more important if it makes flying faster and more convenient than use of a surface mode. Indeed, during the 1990s, the term “Southwest effect” was coined after a study by the U.S. Department of Transportation found that initiation of a service by Southwest Airlines—often at low prices and from secondary airports—not only diverted passengers from hub airports but also attracted travelers who would have driven or not traveled at all (Bennett and Craun 1993).
________________
13 For example, Dallas, Miami, and Chicago are hubs for American Airlines; Houston, Chicago, and San Francisco are hubs for United Airlines; and Atlanta, Detroit, and Minneapolis are hubs for Delta Airlines.
14 The Los Angeles–San Francisco market is served by flights between Los Angeles International Airport and San Francisco International Airport (SFO), Oakland International Airport and Burbank Bob Hope Airport, and John Wayne Airport (Orange County) and SFO. The Dallas–Houston market is served by George Bush Intercontinental Airport, Dallas–Fort Worth International Airport, Dallas Love Field, and William P. Hobby Airport (Houston).
Regional Differences in Airline Service Frequency
Unless distances are too short to make flying a time-saving option, large city pairs in the United States rarely lack scheduled airline service. Figure 3-5 shows the number of nonstop flights in 200 of the country’s most heavily traveled interregional city-pair markets on the basis of traffic data collected by the Federal Aviation Administration (FAA).15 Nonstop service is available in slightly more than half the city pairs. Most of the markets that lack service are separated by 100 to 150 miles, which is too short to generate a viable passenger demand. In cases where markets separated by short distances have scheduled air service, it is usually provided in a small commuter jet or turboprop scheduled for passengers connecting on longer-distance trips. For example, Delta Air Lines offers 18 commuter flights a day between Chattanooga and Atlanta, which are separated by less than 125 miles. Nearly all of the passengers on these commuter flights are on a connecting service.16
The interregional city-pair markets having the most flights per day usually involve large cities and distances of 200 miles or more. Airlines serving the 10 airport-pair combinations in the Los Angeles–San Francisco market offer more than 100 nonstop flights per day; travelers in the Detroit–Chicago and Dallas–Houston markets can choose from more than 60 flights per day. Boston–New York and Washington–New York are among the most densely scheduled airline markets in the country, despite abundant intercity train and bus service.
Short-haul flights may incur disproportionate schedule delays because weather and traffic conditions can make them the primary candidates for air traffic control holds.17 However, the potential for such
________________
15http://apps.bts.gov/xml/ontimesummarystatistics/src/ddisp/OntimeSummarySelect.xml?tname=OntimeSummaryBothData.
16 In the first quarter of 2012 (on the basis of a review of U.S. Department of Transportation origin–destination data from its 10 percent ticket sample), an average of two passengers per day traveled between Chattanooga and Atlanta, when connecting traffic is excluded. Other examples are Augusta, Montgomery, and Birmingham; all are less than 150 miles from Atlanta, but each has 15 or more flights per day to and from Atlanta. Chicago–Madison (122 miles, 27 daily flights), Chicago–Champaign (125 miles, 10 flights), Chicago–Fort Wayne (140 miles, 13 flights), and Dallas–Tyler (109 miles, eight flights) are other examples of short-distance markets with frequent nonstop service only because of hub-related traffic. In 2012, these markets, plus Atlanta–Chattanooga, had a combined total of 45,000 flights (125 per day), but the travelers consisted almost entirely of connecting passengers. Each flight averaged less than one nonstop passenger.
17 The reason is that short-haul flights can be released intermittently to fill gaps in the traffic stream of longer-haul flights.
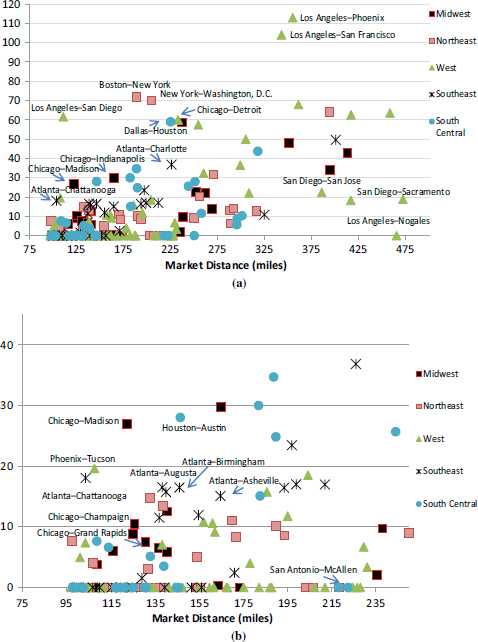
FIGURE 3-5 Number of daily airline flights in interregional markets: (a) for all 200 and (b) with longer distance and very large markets excluded. (SOURCE: http://apps.bts.gov/xml/ontimesummarystatistics/src/ddisp/OntimeSummarySelect.xml?tname=OntimeSummaryBothData.)
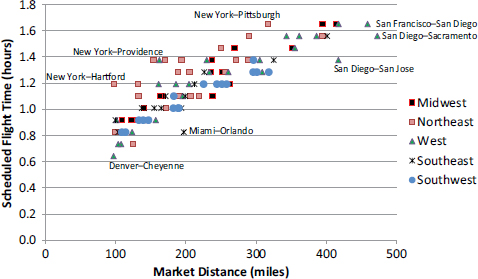
FIGURE 3-6 Scheduled flight times in interregional markets. (SOURCE: http://apps.bts.gov/xml/ontimesummarystatistics/src/ddisp/OntimeSummarySelect.xml?tname=OntimeSummaryBothData.)
delay is not uniform across the country. Figure 3-6 shows average scheduled flight times for 112 interregional markets that have airline service.18 Markets in the Northeast and Southeast tend to have longer scheduled flight times than markets of comparable distance in the South Central and West regions. A longer scheduled flight time in one market than in another having comparable distance is usually due to the addition of buffer time by the airline in anticipation of recurrent delays. New York markets, as a rule, have the longest scheduled flight times per distance traveled.19 For example, the scheduled flight time for New York–Providence is 27 percent greater than that for San Francisco–Fresno, even though the distances are about the same. Even when the schedule buffers in New York are taken into account, nearly 30 percent of flights scheduled for arrival at LaGuardia and Newark airports during 2013 were canceled or delayed by 15 minutes or more.20 Flights into and out of New York traverse the most
________________
18 The 112 markets are those among the top 200 interregional markets having airline service. Many of the 200 markets are too near each other to support airline service.
19 Most scheduled times exceed flying times as a result of this buffering.
20http://www.transtats.bts.gov/ot_delay/OT_DelayCause1.asp?pn=1.
congested airspace in the country. The congestion contributes to flight delays, and their frequency is exacerbated by severe winter and summer weather patterns that are more problematic in the eastern half of the country than in the western half. Airports with the highest on-time performance are concentrated in the West, with the notable exception of San Francisco International Airport, which suffers from episodic delays caused by fog.
While Americans fly mainly by commercial airline, some travel in private general aviation aircraft. In 2001, the last year for which general aviation passenger traffic data are available, private planes accounted for about 3 percent of person trips flown.21 Travelers used general aviation more for short-haul than for longer-haul travel. The average one-way person trip length by private aircraft was about 500 miles, compared with 1,400 miles for airline trips. Individuals who choose private flying for interregional travel presumably value the convenience of a service that can access many more airports.22 General aviation flights also offer nonstop itineraries, flexible schedules, reduced terminal time, and the potential for greater onboard productivity. Of course, travelers who fly by private airplane pay a substantial fare premium for its advantages.
The Changing Airline Industry
Smaller jets and turboprops are generally used by airlines for short-haul flights. According to FAA, airlines had been reducing flights using these smaller aircraft because of volatility in jet fuel prices starting in the early 2000s (Ryerson and Hansen 2010) and weakened business travel demand during the economic recession that followed.23 Before these developments, short-haul airline service already had several competitive disadvantages with respect to the surface interregional modes. For example, the time consumed by ground access to the airport, security screening, transiting the airport to reach gates and baggage carousels,
________________
21http://www.rita.dot.gov/bts/sites/rita.dot.gov.bts/files/publications/national_transportation_statistics/html/table_01_42.html.
22 There are about 5,000 public-use airports in the country, less than 10 percent of which have airline service.
23 Jet fuel prices increased by 57 percent from 2007 to 2012, according to the Massachusetts Institute of Technology Airline Data Project (Wittman and Swelbar 2013).
and waiting to board the airplane can add a disproportionately large share of the total travel time required for a short-haul flight. These time requirements can be large collectively and can limit a business traveler’s ability to devote travel time to work or other productive uses.
Airlines have sought to reduce the number and length of time penalties that can deter flying shorter distances. To make security screening less burdensome, airlines have been working with airports and the federal government to scale back the wait times that deterred flying after the September 11, 2001, terrorist attacks. For example, online check-in and preclearance lanes have been created, and security wait times are reported on the Internet. As is true for travel by other modes, the introduction of portable electronic devices has reduced the time penalties associated with flying. Travelers equipped with a mobile phone, tablet, or laptop can conduct work and remain connected to their workplace and family during their trip. They can also use these devices to stay productive and arrange travel alternatives in the event of severe delays or cancellations. Whether air travel is as accommodating to the use of these portable devices as are the other interregional modes is not clear, however.24 A 2011 study of the share of passengers using portable devices found that airline passengers lagged passengers in other modes.25 For example, about 35 percent of airline passengers were observed to use portable devices, compared with more than half of the passengers on intercity trains. This percentage may have risen in response to the recent relaxation of federal policy on the use of electronic devices in aircraft, despite the limits that remain on telephone calls.
The ability to make productive use of time spent traveling can be particularly important to business travelers, as explained in Chapter 2. For many leisure travelers, flying remains an expensive option for short trips in comparison with the surface modes, especially the bus and the car. Nevertheless, for price-sensitive leisure travelers, advances in computer and telecommunications technologies have had other benefits. In particular, the Internet has transformed how airlines price and market their
________________
24 According to data gathered by Schwieterman, Battaglia, et al. (2013), air travelers have been restricted in their use of electronic devices for an average of 40 minutes per flight because of prohibitions on their use before takeoff and landing.
25https://www.faa.gov/news/press_releases/news_story.cfm?cid=TW189&newsId=15254.
services. Travelers seeking low fares can readily search for and compare prices by using airline websites and third-party sites such as Expedia.com and Priceline.com. Airlines are using their websites and e-mail distribution lists to identify price-sensitive travelers and to offer them discount tickets for seats that would otherwise fly unoccupied. Online features such as electronic ticketing and remote check-in not only save time for travelers but also allow airlines to reduce administrative costs and travel agent commissions, which may translate to lower fares for some travelers.
These various examples of how airlines tailor their fare and service offerings to the interests of individual market segments illustrate why general characterizations about the service attributes of the transportation modes are unwise. Airlines, like carriers in other modes, use multiple strategies aimed at their various market segments. They can choose to supply a service that is relatively infrequent and low in price, or they can provide more costly, frequent service and charge higher fares accordingly. Even on a single flight, a price-differentiating airline can charge a range of fares and offer passengers different levels of travel comfort and convenience. Furthermore, the airline industry continually adapts to changes in the economic and demographic environment. In recent years, for example, some low-fare airlines that had operated from secondary airports have entered and added capacity to hub airports to attract more business travelers. Meanwhile, “ultra–low fare” airlines, such as Spirit and Allegiance, are offering leisure travelers heavily discounted base fares but charging many ancillary fees for checked luggage, carry-on items, and seat assignments (Wittman and Swelbar 2013).
Deregulation of the airline industry some 40 years ago gave airlines the flexibility to adjust their fares and service offerings rapidly. Airline traffic has grown substantially since then, and the federal government, state and local airport authorities, and airlines have sought to improve on-time performance and make flying more convenient and reliable generally. On the groundside, investments guided by the federal Airport Improvement Plan have been made to expand capacity at the country’s major hubs by adding runways, taxiways, gates, terminals, and service facilities.26 On the airside, a long-term air traffic control modernization
________________
26http://www.faa.gov/airports/resources/publications/reports/media/fact_2.pdf.
program known as NextGen is intended to increase the utilization and capacity of a redesigned airspace (FAA 2014). FAA has predicted that these investments will lead to air service reliability improvements in most metropolitan locations. However, the agency has noted that the role of congestion management may need to be examined in some places where large additions to physical capacity are unlikely to be made, such as the high-density airspace serving Washington, Philadelphia, and New York (FAA 2007, 16). (Of the five U.S. airports with regulatory restrictions on daily takeoff and landing slots because of perceived capacity shortages, four are located in the Northeast: Reagan National, Newark, JFK, and LaGuardia.)
Flying by private jet and other general aviation aircraft remains expensive, but business models have been introduced in recent years intended to make this choice easier for companies and individuals. Business jet fractional ownership programs charge members a onetime signup fee, a monthly management fee, and an hourly fee to use an airplane. Some of the programs sell debit-like cards that entitle holders to a certain number of flight seat hours.27 The cost for a 20-hour card can be on the order $10,000, which is equivalent to more than $500 per seat hour.28 Such rates are high relative to most airline fares but are not out of line with the highest-priced tickets paid by business travelers.29 In the belief that general aviation aircraft could have an even larger role in interregional travel over the next several decades, the National Aeronautics and Space Administration (NASA) is investigating technologies to make the aircraft easier and less expensive to operate and manufacture, including human–automation systems, new sensors and software systems, electric propulsion, and robotic composite manufacturing processes.30 NASA believes that the development of these systems could yield some early benefits for airlines and eventually lead to general aviation aircraft that are affordable for on-demand, short-haul transportation services.
________________
27http://www.sentient.com/jet-card.html.
28https://www.netjets.com/MarquisJetCard/.
29http://www.faa.gov/about/office_org/headquarters_offices/apl/aviation_forecasts/aerospace_forecasts/2014-2034/media/2014_FAA_Aerospace_Forecast.pdf.
30http://ntrs.nasa.gov/archive/nasa/casi.ntrs.nasa.gov/20140002448.pdf.
BUSES AND INTERREGIONAL TRAVEL
Interregional bus service is extensive in the United States when both scheduled and charter carriers are included. According to estimates by the American Bus Association (ABA), total miles traveled by charter buses are substantially greater—by about 50 percent—than miles traveled by scheduled carriers.31 Total charter activity is probably even greater than implied by the ABA estimates because smaller charter operators are less likely to be members of the ABA. How much of reported charter bus mileage involves itineraries of 100 miles or more is difficult to ascertain because of the diverse range of services provided by these operators. An estimated 4,100 companies operate coach-style buses.32 Most have fleets of 10 or fewer vehicles, almost all of which are used in charter service.33 About 100 companies operate fleets of 50 or more vehicles; in these cases scheduled interregional service is likely to be their main line of business.
The largest intercity bus carriers are Greyhound Lines and Coach USA.34 Greyhound Lines, long the country’s largest scheduled bus operator, does not dominate the interregional market as it did 30 years ago. The carrier’s national network extends to more than 2,400 stations, but a significant amount of scheduled bus service is provided by smaller carriers whose regional networks connect to Greyhound’s trunk lines.35 During the past decade, however, the interlining and network-based model for providing scheduled bus service has been challenged by a new business model emphasizing express service between the downtowns of large cities with few or no intermediate stops or connections to regional bus networks. These express operators have further exploited the economic advantages of low capital requirements and assets that are highly mobile by eliminating the fixed costs of stations, baggage handlers, and ticketing kiosks.
________________
31 ABA is the trade organization of the intercity bus industry. It has more than 1,000 members who operate charter, tour, fixed-route, and airport express services. Many smaller charter bus operators are members of the United Motor Coach Association.
32 John Dunham and Associates, Motorcoach Census 2011, and http://www.buses.org/files/Foundation/Motorcoach-Amtrak-Comparison.pdf.
33http://www.buses.org/files/Foundation/Motorcoach-Amtrak-Comparison.pdf; http://www.buses.org/files/Foundation/Final_Motorcoach_Census_2011_7-3-2012.pdf.
34http://www.buses.org/files/Foundation/Motorcoach-Amtrak-Comparison.pdf.
35http://www.buses.org/files/Foundation/Final_Motorcoach_Census_2011_7-3-2012.pdf.
The city-to-city express bus model has its roots in the buses operating between the Chinatowns and other immigrant communities in New York, Boston, Philadelphia, and other large cities in the Northeast starting in the late 1990s (Klein 2009). By boarding and dropping off passengers curbside rather than paying for access to bus terminals and by avoiding stops en route, the Chinatown operators could charge lower fares than traditional network carriers and make trips faster. Having learned of these services through word of mouth, students and other bargain seekers from outside the immigrant communities started using the curbside buses, some of which began posting schedules and selling tickets over the Internet. The New York City Department of City Planning (2009) estimated that more than 250 intercity buses were departing and arriving each day in Manhattan’s Chinatown district.
By the mid-2000s, the new curbside bus companies were providing service to locations outside immigrant communities (e.g., near universities and adjacent to major transit stations). Websites such as Gotobus. com expanded the customer base by making it easier to find and pay for service.36 To attract more riders, competing carriers started varying their fares and practicing the yield management strategies used by airlines. They offered deeply discounted tickets (e.g., $1 plus a $0.50 reservation fee) to early purchasers while raising ticket prices for walk-up customers as seats began to fill. At the time, the deeply discounted fares created goodwill and positive publicity for bus transportation when short-haul air travel was becoming slower and more cumbersome because of increasingly restrictive security procedures (Schwieterman et al. 2011; Schwieterman et al. 2007).
The network and corporate bus companies responded to the growth in the curbside bus market. Coach USA introduced Megabus, which had already been operating in Europe, to the U.S. market in 2006 (Schwieterman and Fischer 2010). Megabus has since grown to serve markets in more than 30 states and Canada. Greyhound added express service on its main network and established an independent line, BoltBus, which served curbside locations, sold tickets mainly on the
________________
36 Bus booking websites similar to Gotobus have since been introduced, including Wanderu and Busbud.
Internet, and offered point-to-point service much like the earlier express operators. The established carriers purchased new buses with amenities such as synthetic leather seats spaced with ample leg room, video monitors, power outlets, reserved seating, and Wi-Fi service (Klein 2015; Schwieterman et al. 2015). Like the Chinatown buses, they boarded passengers at sites adjacent to downtown transit stations and universities. They structured Internet fares to promote advance purchases, including guarantees of some $1 seats (plus a small booking fee) on all routes. Some carriers hired greeters to meet passengers at boarding areas, but in general staffing was kept lean (Schwieterman et al. 2011; Schwieterman et al. 2007). By avoiding the operation of stations and ticket kiosks, the carriers could quickly and inexpensively enter new markets, experiment with new service features (including reserved seats in the case of Megabus), and add and withdraw capacity with little risk or capital expense.
Industry analysts have observed that riders attracted to the curbside buses have trended toward a younger demographic than riders who characterized the shrinking bus industry of the 1980s and 1990s (Klein 2015; Schwieterman et al. 2007; Schwieterman et al. 2011). Annual intercity bus ridership is estimated to have declined to less than 40 million by the 1990s, which was about one-quarter of the number of travelers using buses during the 1960s (Fischer and Schwieterman 2011). By the early 2000s, patronage consisted of a low-income demographic with relatively few female passengers, many of whom had come to view bus travel as unsafe (GAO 1992). Figure 3-7 tracks the growth in daily express bus departures since 2010. Although the rate of growth has slowed in recent years, the upward trend has remained, as bus companies have expanded into more interregional markets and as consumers have gained more awareness of the new service options.
Geographic Variability in Bus Service
According to ABA, more than 2,700 counties and cities across the country have at least some scheduled intercity bus service; only about 150 communities with populations of more than 25,000 lack any service.37 Types and
________________
37http://www.buses.org/files/Foundation/Motorcoach-Amtrak-Comparison.pdf. A map of intercity bus service can be found at http://www.aibra.org/pdf/usmap.pdf.
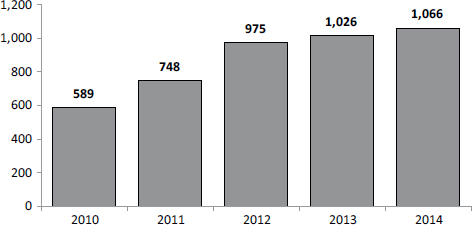
FIGURE 3-7 Number of daily bus departures by city-to-city express bus lines, 2010 to 2014. (Data provided by Chaddick Institute for Metropolitan Development, DePaul University.)
levels of bus service across markets and parts of the country are difficult to compare because of qualitative differences in service offerings, such as the number of connections and stops en route. For example, a trip by bus that involves multiple stops or that requires transfers is not necessarily comparable with a trip that can be made by a direct or express bus. Another factor complicating comparisons is the large number of bus operators providing service, including curbside operators, whose schedules are often fluid and posted only on the Internet. In such cases, accurate measurement of the amount of service being provided in the city pair can be difficult.
In Figure 3-8, the frequency of bus service is estimated for 200 of the country’s largest interregional city-pair markets on the basis of a search of Internet timetables.38 Some timetables were likely missed in the search. Only offerings of direct service were sought. Direct service was defined to include only those routings not requiring a transfer to another bus on the same carrier or a partner carrier (although single-line routes where the bus makes one or more intermediate stops were included). When service is defined in this restricted way, the variability in schedule frequency is high among the 200 city-pair markets. Nearly one-third do
________________
38 How these 200 markets were identified is explained in Chapter 4.
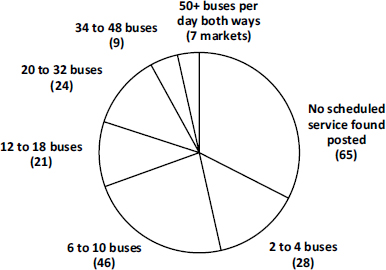
FIGURE 3-8 Frequency of scheduled (nonconnecting) bus service in top 200 interregional city-pair markets. (Data are from a review of schedules posted by operators on their websites, July 2014.)
not have any scheduled direct service, and nearly one-third have more than 12 direct service departures per day (i.e., six in each direction). A handful of markets, all in the Northeast, have more than 50 direct service buses per day, many of them providing nonstop express service.
Figure 3-9 shows the variability in direct service offerings across specific regions and markets. Some city pairs, among them New York City, have hundreds of departures per day; many other city pairs have a fraction of this total. New York’s ability to fill buses is a function of its large population and its proximity to several other large Northeastern cities. In other regions, lower traffic volumes compel bus operators to structure their service offerings in network routings that require one or more transfers, which were not counted in the direct service data in Figure 3-9. As they have expanded into less densely traveled markets, even some of the larger express bus operators have had to structure their routes by using connecting services to provide enough service frequency to attract riders. For example, Megabus has established transfer hubs in Chicago, Atlanta, Pittsburgh, and Dallas (Schwieterman et al. 2011; Schwieterman et al. 2007). In addition, Megabus recently began selling through-service tickets via these hubs; previously,
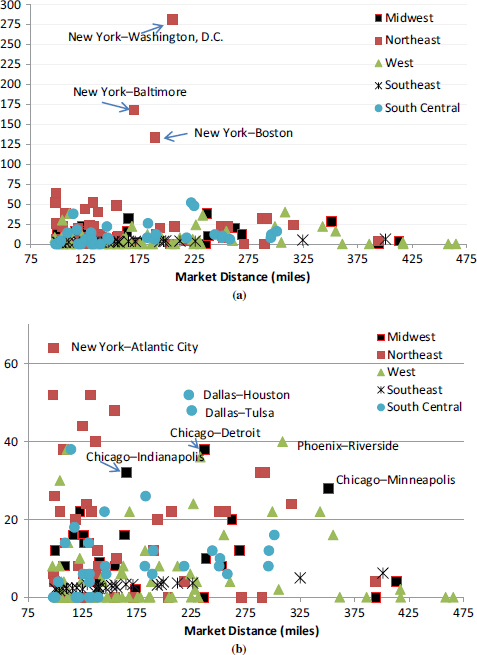
FIGURE 3-9 Frequency of scheduled weekend bus service in top 200 interregional markets by distance and region: (a) all 200 markets and (b) excluding New York–Baltimore, New York–Boston, and New York–Washington, D.C. (Data are from a review of schedules posted by operators on their websites, July 2014.)
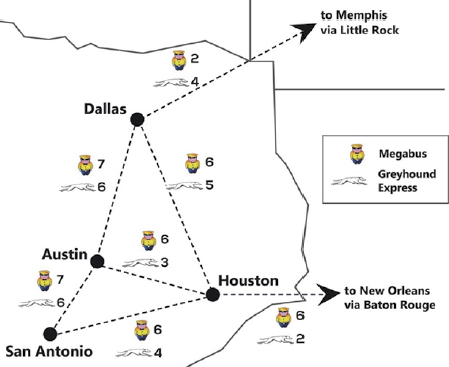
FIGURE 3-10 Megabus and Greyhound Express route structure in Texas, with the number of daily buses in each direction, July 2015. (SOURCE: megabus .com and greyhound.com.)
riders had to buy separate tickets for through travel. Figure 3-10 shows the route structures of Megabus and competitor Greyhound Express in Texas, where Austin, which has a large student population, serves as a hub for routings between the state’s other large cities.
The Changing Bus Industry
The intercity bus industry has reestablished itself as an important mode of interregional transportation largely because of new service features, many of them originally introduced by carriers competing in the express bus market. A survey conducted in 2010 and 2011 yielded the following findings concerning express bus riders (Schwieterman et al. 2011):
- City-to-city express service has generated a large amount of new travel as opposed to diverting it from other modes and conventional buses.
-
Trips that would not have been taken on other modes or bus services were estimated to account for 22 percent of passengers. Only about one-third of riders reported that they had traveled on Greyhound in the past 12 months.
- Nearly half of all passengers were 18 to 25 years old. Almost three-quarters were 18 to 35.
- Ridership was more evenly split between male and female passengers than on Greyhound. Female travelers outnumbered male travelers by a 52 to 48 percent margin; male riders on Greyhound outnumbered females by 60 to 40 percent.
- About five in six passengers of express bus service are traveling for nonbusiness purposes.
- Express bus travelers are technologically adept. More than 90 percent reported that they plan to use electronic devices en route. Nearly half reported that they intended to use onboard Internet service during the journey.
These results, and those of another recent survey by Klein (2015), are consistent with ridership data provided to the study committee by BoltBus.39 According to these data, 85 percent of the carrier’s passengers travel for nonbusiness purposes, nearly 25 percent are students, more than three-quarters are under age 35, and about 60 percent are female. BoltBus has found that 30 percent of its riders had never before made an interregional trip on a scheduled bus.40 Surveyed riders did not express a strong preference for curbside or intermodal station boarding locations, but they did emphasize the importance of being near public transit, which is how nearly two-thirds of the riders reported accessing the service.
An important feature of express bus offerings is avoidance of time-consuming intermediate stops. In view of the need for high traffic volumes, such point-to-point service is unlikely to become a standard offering in all interregional markets. Nevertheless, there is growing evidence that traditional network-based bus lines have benefited from the improving reputation of intercity buses and the service delivery innovations that express bus operators have introduced. Schwieterman,
________________
39 Presentation to the committee on February 14, 2013, by D. Hall, General Manager, BoltBus.
40 Presentation to the committee on February 14, 2013, by D. Hall, General Manager, BoltBus.
Antolin, et al. (2013) report that Greyhound has been adding express routes, modernizing stations, adding onboard amenities, and experimenting with new ways for passengers to purchase tickets electronically and off site (e.g., at convenience stores).
Many corporate and network bus lines (as well as rail carriers) have learned from the early-adopter express bus operators and now provide onboard Wi-Fi as a standard feature and exploit new technologies such as smartphone applications to inform customers about schedule changes, delays en route, and other service issues. The latter capability is important for conveying information that was traditionally provided at bus stations and by call centers. Conversely, express bus operators have become more willing to pick up and drop off passengers at intermodal terminals and to partner with regional bus carriers in ticketing passengers for connecting service (Schwieterman, Antolin, et al. 2013). Luxury operators, such as LimoLiner and Red Coach, are also creating niches for premium services on heavily traveled routes. Such developments make predictions of how intercity bus services will evolve over the next few years difficult, and even more so over the next few decades. However, the bus has definitely reemerged as a mode of interregional transportation and merits consideration in the planning of the transportation systems intended to serve the country’s interregional markets.
PASSENGER TRAINS AND INTERREGIONAL TRAVEL
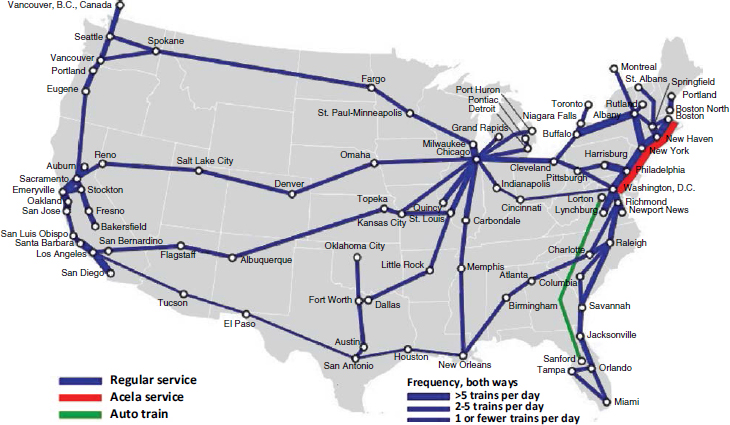
Intercity passenger rail service in the United States is supplied almost exclusively by the federally created National Railroad Passenger Corporation, or Amtrak, in contrast to the other interregional transportation modes, which have many service providers. Amtrak operates about 300 regional and long-distance trains per day over about 21,000 miles of track. Most of the trackage is owned by private freight railroads (Figure 3-11).41 Because of Amtrak’s unique role in the provision of intercity train service, a brief review of its history and route structure is helpful before the availability of train service across regions of the country is compared.
________________
41 Alaska has passenger rail service running from Fairbanks to south of Anchorage, but the service is not connected to Amtrak and its continental system.
Historical Circumstances Shaping Amtrak and Intercity Rail
Some of the country’s youngest cities, such as those in Florida and the Southwest, have experienced most of their growth during the past half century. These cities, which became prominent after the highway and aviation networks had become ubiquitous, prospered far from traditional railroad and water routes. Nevertheless, through much of the 20th century, passenger trains operated in nearly all regions of the country. They had a formative effect on many cities such as Chicago, Atlanta, Minneapolis, and Dallas. As late as the 1960s, intercity passenger train service was still provided by dozens of private railroads, nearly all of which were also transporting freight.42
By the late 1960s, passenger trains were succumbing to traffic losses to automobiles and airplanes. Ridership had fallen by more than 75 percent since 1950 alone (AAR 1980; CBO 2003, xi). Amtrak, a quasi-public corporation, was formed through federal legislation in 1970 intended to relieve the private railroads of the financial burden of providing passenger service.43 At the time, several railroads were bankrupt, including the large Penn Central, which had provided much of the rail service in the Northeast. Amtrak acquired passenger cars from the private railroads. In the case of the Penn Central, it acquired most of the bankrupt carrier’s routes in the Northeast Corridor (NEC).44 By law, the freight railroads that had divested their passenger service were required to provide Amtrak with access to their tracks at “avoidable cost” and to give Amtrak trains dispatching priority for any passenger service that was previously the responsibility of the private railroads.
After the private railroads divested their passenger service and were economically deregulated a few years later, they shed thousands of miles
________________
42Keeler (1983) and Gallamore and Meyer (2014) provide brief histories of the regulation of freight railroads, their provision of passenger service, the creation of Amtrak, and the federal government’s buyout of the Penn Central Railroad and creation of the Northeast Corridor.
43 Rail Passenger Service Act of 1970, Public Law 91-518. The act authorized Amtrak to assume by contract the intercity rail passenger service obligations of railroads who wished to be relieved of these obligations as common carriers.
44 The Railroad Revitalization and Regulatory Act of 1976 formed Conrail as a streamlined successor to the Penn Central Railroad in the Northeast.
of uneconomic branch lines to concentrate their movements over a smaller number of main lines that were maintained and upgraded specifically to accommodate expanded freight service.45 These lines were made available to Amtrak as part of the freight railroads’ legal obligation to allow the carrier to preserve preexisting passenger rail services. However, the central function of these lines was to serve freight trains, whose length and weight were growing.46 Whereas the Amtrak-owned right-of-way in the NEC could retain a passenger orientation, circumstances differed elsewhere in the country, where freight lines were physically and operationally ill suited to frequent and fast passenger trains.47 As in other parts of the country, train ridership in the Northeast had been dropping before the creation of Amtrak during the 1970s. However, Amtrak’s ownership of most of the track in the NEC prevented passenger service from receding to the skeletal levels that characterized most other rail corridors, which were increasingly dedicated to the movement of freight.
Amtrak’s Route Structure
Because the private freight railroads are obligated to provide Amtrak with track access only on routes that previously had passenger service, all other service additions must be negotiated by Amtrak. Such additions are rare, because freight railroads must be fully compensated for the loss of any capacity caused by Amtrak’s trains, now or in the future. Nevertheless, a number of states provide subsidies to Amtrak to increase the number of trains on routes where there is a preexisting access obligation. Thus, Amtrak’s route structure consists of the NEC, state-supported routes, and long-distance routes.48
________________
45 A discussion of this history is given by TRB 2015, Chapter 1.
46 Amtrak owns about 3 percent of the total track miles over which it operates.
47 Roadbed design, banking, spacing for safety margins, ballast requirements, signal improvements to allow for higher-speed railroads, and numerous other factors must be changed when passenger and freight service are mixed at high levels of frequency (Dingler et al. 2009).
48 In addition, Amtrak engages in related ancillary businesses, including operating commuter railroad services under contract; providing rail infrastructure access to commuter agencies and freight railroads; and performing rail services for other rail operators, both commuter agencies and freight railroads, on a reimbursable basis.
Northeast Corridor
About 80 percent of the 457-mile NEC rail right-of-way linking Washington, New York, and Boston is owned by Amtrak.49 Short sections (10 to 50 miles) are owned by Metro-North Commuter Railroad and the states of Connecticut and Massachusetts. Through investments made over the past four decades, Amtrak has completed the electrification of the NEC lines and introduced higher-speed service on its Acela trains.50
The NEC crosses eight states and the District of Columbia. It is used by Amtrak as well as eight commuter51 and four freight railroads, which creates a complex financial and operating environment. The approximately 150 Amtrak trains that operate per day over segments of the NEC transport more than 10 million passengers per year (Northeast Corridor Commission 2015). The corridor’s commuter and intercity services transport more than 750,000 people each day, including the more than 35,000 per day transported by Amtrak.52
The following are Amtrak’s major NEC markets:53
- Washington–New York (including service to Newark, Philadelphia, Wilmington, and Baltimore—226 miles): 37 trains per weekday in each direction at average travel times of 2 hours 45 minutes for Acela service (16 trips per day each direction) and 3 hours 30 minutes for conventional service (21 trips per day each direction). A subset of this market—New York–Philadelphia—is served by an additional 10 “Keystone” weekday trains in each direction.
________________
49 Amtrak owns or controls approximately 401 miles of the 457-mile NEC.
50 Acela is capable of reaching speeds up to 150 miles per hour, and Amtrak’s conventional trains in the NEC can attain speeds up to 125 miles per hour.
51 Commuter rail operators, subsidized by state and federal funding, include Massachusetts Bay Transportation Authority (providing service into Boston), Shore Line East (providing service from eastern Connecticut to New Haven with connections to New York), Metro-North Railroad (providing service to New York from New Haven and intermediate points to New York City), Long Island Rail Road (providing service into Penn Station, New York, from Long Island), NJ Transit (providing service into Penn Station from New Jersey), Southeastern Pennsylvania Transportation Authority (providing service between Trenton, New Jersey, and Wilmington, Delaware, to Philadelphia), Maryland Mass Transit Administration (providing service to Washington Union Terminal from Perryville, Baltimore, and western Maryland), and Virginia Railway Express (providing service from suburban Virginia locations into Washington Union Terminal).
52http://www.nec-commission.com/reports/nec-and-american-economy/.
53 The service data given below were obtained from Amtrak’s website timetables for July 2014.
- Boston–New York (including service to Stamford, New Haven, and Providence—231 miles): 19 trains per weekday at average travel times of 3 hours 30 minutes for Acela service (10 trains) and 4 hours 45 minutes for conventional service (nine trains).
- Washington–Boston (457 miles): 18 trains per weekday at average travel times of 6 hours 45 minutes for Acela service (10 trains) and 8 hours for conventional trains (nine trains).
All Amtrak trains operating exclusively in the NEC are priced by using yield management, since the major competitors with Acela for high-yield business travelers are the airlines operating between Boston’s Logan, Washington’s Reagan National, and New York’s LaGuardia Airports. With its ability to exercise control over its right-of-way in the NEC, Amtrak has greater opportunity in this corridor than elsewhere in its system to compete with other interregional modes by increasing train frequencies and reducing schedule times. Nevertheless, even on the electrified and passenger-oriented NEC lines, the capacity for interregional service is constrained by the congestion resulting from having to share track with eight commuter railroads and freight trains operating over portions of the corridor. Track-sharing arrangements, some originating in legislation, limit Amtrak’s ability to charge access fees that cover the costs associated with maintaining and renewing the NEC facilities. Of course, allocating many of these costs and isolating the beneficiaries of specific infrastructure investments are difficult in a corridor serving local, interregional, and longer-distance traffic. Amtrak’s own ability to contribute to the maintenance and renewal of the NEC lines is constrained by the abundant bus and airline service in the corridor, which creates a competitive limit on how high the railroad can raise its fare levels. Amtrak’s capacity to make targeted investments in the corridor is further limited by having to use part of its NEC passenger revenues to help sustain its system operations more generally.
State-Supported Trains
Amtrak’s legal right to access freight railroad tracks has prompted a number of states to provide financial support for Amtrak to increase passenger train frequencies and reduce travel times in corridors where Amtrak has access rights. State-supported service exists in California, Virginia,
New York, North Carolina, Wisconsin, Illinois, Washington, and Oregon, and several routes are supported by more than one state. In total, Amtrak operates 28 state-supported services in 17 states. About 15 million riders used these trains in 2013. In view of the growth in state-supported funding for passenger service, in 2008 Congress mandated the development of a standardized policy for Amtrak reimbursement, applicable to all train services less than 750 miles in length outside of the NEC.54 According to the policy, individual states must support approximately 83 percent of Amtrak’s operating costs. State-supported routes and their subsidy levels are discussed further in Chapter 5.
Long-Distance Trains
Amtrak operates 15 long-distance routes (Figure 3-11). This service generally includes dining and sleeper car service over travel distances of up to 2,800 miles. The routes contain many station pairs that are in the 100- to 500-mile range, but the service is not designed for these markets and the scheduling of trains often does not produce the most convenient departure and arrival times for interregional travelers. Furthermore, service frequency is limited because most routes have only one train per day in each direction.
Geographic Variability in Rail Service
Amtrak’s route structure leads to considerable geographic variability in interregional train service. In particular, the “regional” routes designed to serve 100- to 500-mile markets are concentrated in the Northeast, Midwest, and West. The Northeast alone accounts for 12 of the 20 regional routes, followed by five in the West, two in the Midwest, and one in the South Central region. All but one (Boston–Brunswick, Maine) of the Northeast regional routes serve New York City, while Chicago has the same dominant role for regional service in the Midwest. Of the five regional routes in the West, some of them state-subsidized, two are in northern California, one is in southern California, one operates between northern and southern California, and one is in the Pacific Northwest (Oregon and Washington State).
________________
54 Section 209, Passenger Rail Investment and Improvement Act of 2008.
One state-subsidized train in the South Central region operates between Dallas and Oklahoma City.
The geographic concentration of regional trains creates substantial market variability in train service. Among the 200 most heavily traveled interregional city-pair markets,55 118 do not have any passenger train ser-vice, and 33 others are served by only one long-distance train per day in each direction. Figure 3-12 plots daily train service in the 200 markets. Regional schedules vary in the frequency of service. In the NEC, more than 75 trains operate daily between New York, Philadelphia, Baltimore, and Washington, and nearly 50 others operate between New York, Providence, and Boston. In Philadelphia alone, nearly 100 trains stop per day to connect to markets farther north, south, and west. Numerous medium-size cities, such as Wilmington, Providence, and Trenton, which are situated along the routes connecting Boston, New York, Philadelphia, and Washington, benefit from these passing trains. As a consequence, 33 of the 49 markets with the most frequent train service in the United States are located in the Northeast.
After the NEC, the interregional corridor with the most frequent train service is Los Angeles–San Diego, which is served by about two dozen trains per day. Farther to the north, eight to 10 trains per day stop in the Seattle–Portland corridor. Several daily trains connect through Chicago to provide service to Saint Louis (10 trains per weekday) and Detroit (six trains per weekday). Outside of the core service locations, passenger trains in the West, Midwest, Southeast, and South Central regions provide minimal service.
In general, the markets served by frequent trains enjoy the fastest service. Effective speeds (calculated on the basis of train schedules) between New York and Washington average between 60 and 85 miles per hour when Amtrak’s Acela and regional trains are included. Indeed, the only interregional markets with average train speeds exceeding 60 miles per hour are all located in the NEC (on the basis of timetables and straight-line mileage for distance measurements) (Figure 3-13). Because Amtrak uses freight rail networks in all other regions of the country, its other
________________
55 See Chapter 4 for an explanation of how the 200 markets were identified.
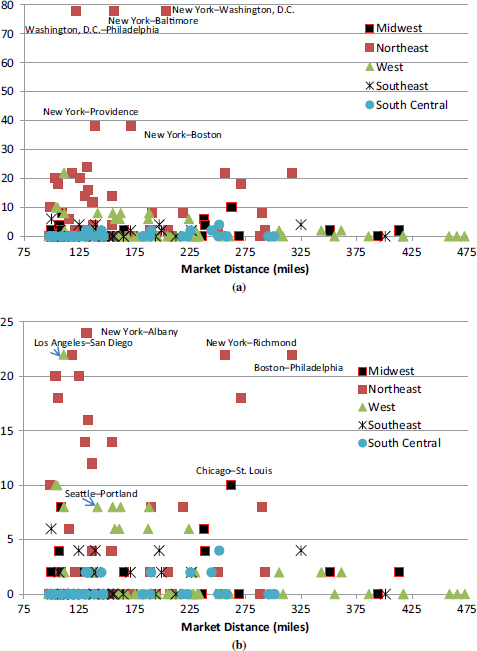
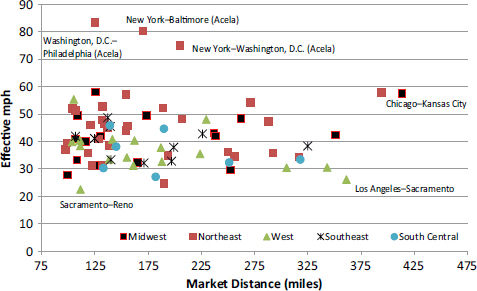
FIGURE 3-13 Effective travel speed (straight line, scheduled travel time) by rail in the top 200 markets. (SOURCE: Amtrak website, accessed July 14, 2014.)
trains operate at consistently lower speeds. In some markets, schedule speeds (calculated as above) average less than 30 miles per hour.
Evolving Role of Passenger Rail
Passenger rail is a potential beneficiary of the ongoing revitalization of many center cities in the United States, particularly those that have retained downtown train stations. The largest cities in the Northeast, as well as a number of cities in other regions such as Chicago, Saint Louis, Seattle, and San Diego, have strong downtowns with extensive public transit systems. These conditions can give interregional trains a distinct advantage for short-distance travel, especially for business travelers and others living in or visiting center cities. Whether intercity rail service itself can be a significant factor along with intercity buses in stimulating the revitalization of more downtowns is likely to depend on many factors, including changing patterns of urbanization; demographic and economic trends; transportation policy and funding; and the proximity of service to other cities in the region that have similarly situated train stations, comparable urban densities, and high-quality public transit.
The marketing of regional rail service continues to emphasize the comfort of train travel compared with that of automobiles, buses, and airlines. In general, trains offer passengers more seating space and allow greater freedom of movement (within and between cars), which can make travel time more productive and relaxing. Although passengers may have to wait at boarding areas, they do not have to wait in security lines similar to those at airports. Trains also allow riders to make uninterrupted use of their cell phones and other electronic devices. Amtrak’s Acela service provides Wi-Fi and power outlets. Amtrak has partnered with states to make these amenities available on all regional trains.56
Outside the NEC, the prospect of significantly expanding passenger rail service—such as by scheduling more frequent and faster trains on existing routes or adding new routes—is complicated by Amtrak’s need to use the freight rail network. Negotiated service expansions must often include infrastructure improvements such as new sidings, curve straightening, and new signal systems, as well as contributions to their maintenance. Such infrastructure upgrades can add significantly to the public subsidy burden. Accordingly, the question arises as to whether improving the freight rail infrastructure is more costly than building a new rail right-of-way to accommodate passenger service, particularly for any higher-speed services that would require major infrastructure upgrades. In the case of the state-subsidized routes, the general approach has been to make small, incremental investments in service expansions that can be more easily accommodated operationally and financially by all parties. This incremental approach has been pursued mainly in corridors where the freight railroads are asked to accommodate a few additional and slightly faster passenger trains per day. The applicability of this approach to a state contemplating a much larger service expansion is questionable. As discussed in Chapter 5, California has elected to forgo an incremental approach in favor of connecting its northern and southern cities with a new rail corridor that will be built specifically for high-speed trains.
________________
56 Amtrak estimates that Internet Wi-Fi is now available on all short-distance routes and is accessible to 85 percent of the railroad’s ridership http://www.amtrak.com/journey-with-wi-fi-train-station).
This chapter has examined the attributes and availability of the transportation modes used for interregional travel in various regions of the country. Three modes of transportation are widely available: automobiles, airplanes, and buses. Passenger rail is used for some interregional trips, but its availability and quality are limited in most places.
The most widely available mode is the automobile. The country’s highway system and automobile fleet are extensive. Travelers with access to an automobile can use it to make interregional trips with door-to-door service, unrestricted departure times, and low cost for each additional passenger. These attributes are unique to the automobile. Their appeal depends on the individual circumstances of the traveler and the potential disutility of driving caused by the risk of traffic delays en route, the requirement of finding parking at the destination, and lost productivity during the time spent driving. The data examined in this chapter suggest that the potential for encountering travel delays is greatest at the start and end of interregional trips because of high traffic volumes in urbanized areas. In parts of the country where interregional corridors pass through many urbanized areas, the potential for delays increases. New technologies, such as electronic toll collection systems and GPS navigation systems with real-time traffic monitoring, are changing the driving experience in ways that may counter some of the automobile’s disadvantages for interregional trip making.
Intercity buses use the same ubiquitous highway network as automobiles and can provide services to a wide range of origins and destinations. They can also encounter traffic conditions that make service slow and unreliable in some markets. However, buses are constrained in where they can go and how frequently they can provide scheduled service because of their need to attract sufficient passenger traffic. Traditional regional bus networks rely on traffic flows from connecting and multistop service to fill buses and offer service frequency. In the nation’s most densely traveled interregional corridors, bus operators are offering frequent, nonstop express service between high-demand downtown locations. When pickup and drop-off points are served by public transit, the bus can have an even wider market reach.
Express bus service is available in many parts of the country but has proved to be particularly well suited to corridors with characteristics
similar to those in the Northeast. There, large cities are closely spaced, and downtowns have a strong commercial and residential presence and are well served by transit systems providing local access to bus lines. The advent of express service, made possible in part by the ability of operators to publicize schedules and sell tickets over the Internet, has contributed to the revitalization of the bus as a viable mode of interregional transportation.
In most city-pair markets of more than 200 miles, travelers have the option of flying. The price and availability of service depend on a number of factors, including the ability of scheduled airlines to fill flights with nonstop passengers as well as travelers connecting from more distant cities. Because many of the country’s largest cities contain hub airports where airlines concentrate their connecting service, schedule frequencies can be high in many interregional travel markets. Secondary airports in many cities also offer lower-fare service attractive to leisure travelers. Flying is naturally suited to regions where cities are spaced farther apart, such as in the West, where many interregional corridors span more than 300 miles. Some closely spaced populous cities, such as those in the NEC separated by about 200 miles, have frequent airline service because of large volumes of time-sensitive business travelers. In this corridor, however, airline service is constrained by airway congestion, and it competes with frequent intercity rail and bus service. Travel by private general aviation aircraft is an expensive but viable option for some business travelers, and it has been expanded in recent years by business models such as fractional ownership programs. Whether general aviation can play a larger transportation role in the future is unknown, but such a role is envisioned by some researchers and technologists.
Finally, the supply of fast and frequent passenger rail service is concentrated in a few interregional markets. Most of the country’s interregional trains operate in the NEC, where Amtrak owns most of the rail right-of-way. Elsewhere in the country, service is generally sparse and slow, and often nonexistent. A major deterrent to the expansion of passenger rail service outside the NEC is the ownership and heavy use of the only available rights-of-way by railroads transporting freight. In most of these markets, major corridor investments, including the building of new corridors, would be required to introduce substantially faster
trains with service frequencies that can compete with airlines and other interregional modes. In general, the potential for such expansions is not promising because of the safety and operational conflicts presented by heavy freight traffic. The building of new corridors would almost certainly be required to accommodate high-speed service.
REFERENCES
Abbreviations
| AAR | Association of American Railroads |
| CBO | Congressional Budget Office |
| FAA | Federal Aviation Administration |
| GAO | Government Accountability Office |
| TRB | Transportation Research Board |
AAR. 1980. Yearbook of Railroad Facts. Washington, D.C.
Bennett, R. D., and J. M. Craun. 1993. The Airline Deregulation Evolution Continues: The Southwest Effect. Office of Aviation Analysis, U.S. Department of Transportation, May.
CBO. 2003. The Past and Future of U.S. Passenger Rail Service. Sept. http://www.cbo.gov/sites/default/files/cbofiles/ftpdocs/45xx/doc4571/09-26-passengerrail.pdf.
Dingler, M., Y.-C. Lai, and C. P. L. Barkan. 2009. Impact of Operating Heterogeneity on Railway Capacity. http://railtec.illinois.edu/CEE/images/pdf/Events/TRB09/Dingler%20et%20al_%202009%20TRB.pdf.
Dresner, M., C. Lin, and R. Windle. 1996. The Impact of Low-Cost Carriers on Airport and Route Competition. Journal of Transport Economics and Policy, Vol. 30, No. 3, pp. 309–328.
FAA. 2007. Capacity Needs in the National Airspace System: An Analysis of Airports and Metropolitan Area Demand and Operational Capacity in the Future. May. http://www.faa.gov/airports/resources/publications/reports/media/fact_2.pdf.
FAA. 2014. NextGen Priorities Joint Implementation Plan: Executive Report to Congress. https://www.faa.gov/nextgen/media/ng_priorities.pdf.
Fischer, L. A., and J. P. Schwieterman. 2011. The Decline and Recovery of Intercity Bus Service in the United States: A Comeback for an Environmentally Friendly Transportation Mode? Environmental Practice, Vol. 13, pp. 7–15.
Gallamore, R., and J. Meyer. 2014. American Railroads: Decline and Renaissance in the Twentieth Century. Harvard University Press, Cambridge, Mass.
GAO. 1992. Availability of Intercity Bus Service Continues to Decline. RCED-92-126.
Keeler, T. 1983. Railroads, Freight, and Public Policy. Brookings Institution, Washington, D.C.
Klein, N. J. 2009. Emergent Curbside Intercity Bus Industry: Chinatown and Beyond. In Transportation Research Record: Journal of the Transportation Research Board, No. 2111, Transportation Research Board of the National Academies, Washington, D.C., pp. 83–89.
Klein, N. J. 2015. Get on the (Curbside) Bus: The New Intercity Bus. Journal of Transport and Land Use, Vol. 8, No. 1, pp. 155–169.
New York City Department of City Planning. 2009. Chinatown Bus Study. Transportation Division. http://www.nyc.gov/html/mancb3/downloads/cb3docs/chinatown_final_report.pdf.
Northeast Corridor Commission. 2015. Northeast Corridor Intercity Travel Summary Report. Sept. http://www.nec-commission.com/wp-content/uploads/2015/09/2015-09-14_NEC-Intercity-Travel-Summary-Report_Website.pdf.
Ryerson, M. S., and M. Hansen. 2010. The Potential of Turboprops for Reducing Aviation Fuel Consumption. Transportation ResearchPart D: Transport andEnvironment, Vol. 15, No. 6, pp. 305–314.
Schrank, D., B. Eisele, T. Lomax, and J. Bak. 2015. 2015 Urban Mobility Scorecard. Texas A&M Transportation Institute and INRIX, Aug. http://mobility.tamu.edu/ums/report/.
Schwieterman, J. P., B. Antolin, P. Largent, and M. Schulz. 2013. The Motor Coach Metamorphosis: 2012 Year-in-Review of Intercity Bus Service in the United States. Chaddick Institute for Metropolitan Development, DePaul University, Chicago, Ill.
Schwieterman, J. P., B. Antolin, G. Scott, and M. Sellers. 2015. Adding on Amenities, Broadening the Base: 2014 Year-in-Review of Intercity Bus Service in the United States. Chaddick Institute for Metropolitan Development, DePaul University, Chicago, Ill. http://las.depaul.edu/centers-and-institutes/chaddick-institute-for-metropolitan-development/Documents/2014%20Chaddick%20Intercity%20Bus%20Study.pdf.
Schwieterman, J. P., A. Battaglia, B. MacHarg, and M. Schulz. 2013. The Personal Tech Tidal Wave: The Surging Use of Electronic Devices on Intercity Buses, Planes, and Trains 2012–2013. DePaul University, Chicago, Ill., June. http://las.depaul.edu/centers-and-institutes/chaddick-institute-for-metropolitan-development/research-and-publications/Documents/The_Personal_Tech_Tidal_Wave_final_versi.pdf.
Schwieterman, J. P., and L. Fischer. 2010. The Intercity Bus: America’s Fastest Growing Transportation Mode: 2010 Update on Scheduled Bus Service. Chaddick Institute for Metropolitan Development, DePaul University, Chicago, Ill.
Schwieterman, J. P., L. Fischer, C. Ghoshal, P. Largent, N. Netzel, and M. Schulz. 2011. The Intercity Bus Rolls to Record Expansion: 2011 Update on Scheduled Motor Coach Service in the United States. Chaddick Institute for Metropolitan Development, DePaul University, Chicago, Ill.
Schwieterman, J. P., L. Fischer, S. Smith, and C. Towles. 2007. The Return of the Intercity Bus: The Decline and Recovery of Scheduled Service to American Cities, 1960–2007. School of Public Service Policy Study, DePaul University, Chicago, Ill.
TRB. 2012. Special Report 308: The Safety Promise and Challenge of Automotive Electronics: Insights from Unintended Acceleration. Transportation Research Board of the National Academies, Washington, D.C.
TRB. 2015. Special Report 318: Modernizing Freight Rail Regulation. Transportation Research Board, Washington, D.C.
Windle, R., and M. Dresner. 1995. Airport Choice in Multiple-Airport Regions. Journal of Transportation Engineering, Vol. 121, No. 4, pp. 332–337.
Wittman, M. D., and W. S. Swelbar. 2013. Evolving Trends of U.S. Domestic Airfares: The Impacts of Competition, Consolidation, and Low-Cost Carriers. Small Community Air Service White Paper No. 3, Report No. ICAT-2013-07. Massachusetts Institute of Technology International Center for Air Transportation, Cambridge. http://dspace.mit.edu/bitstream/handle/1721.1/79878/ICAT-2013-07.pdf.


