
6
Mathematical Research Priorities
Arising From the Electric Grid
INTRODUCTION
This chapter describes mathematical and computational problems where advances are expected to have significant positive impact on the electric grid. Many of the report’s recommendations appear here. Previous chapters have described rapid changes to the grid that call for reexamining its architecture and operating procedures. Those changes included dramatic increases in the numbers of physical variables that must be measured and monitored; intermittent generation from renewable, distributed energy sources; and smart grids that extend control to loads as well as generation. The charge of this committee has been to identify the mathematical research that is necessary in order to enable effective management of these changes. How, then, do mathematics and computation enable what is feasible, and what limitations will remain? What are some research challenges for mathematics where timely progress will enable new technologies? Is the power industry poised for a sweeping transformation comparable to that which occurred in the telecommunications industry? Anticipating where bottlenecks occur in mathematical and computational tools will help answer these questions.
The role of optimization in the power grid industry features prominently in this report because optimization algorithms have become a central aspect of wholesale electricity markets, and the limitations of these algorithms slow progress in accomplishing more. Procedures for these markets would be significantly improved if there were a robust, efficient solution to the alternating current optimal power flow (ACOPF) problem discussed throughout this report. But finding such a solution requires either fundamental advances in general algorithms for nonlinear, nonconvex optimization problems or insights that rely on the network structure of the power grid.
The electricity markets pose challenges that go beyond improvements in optimization algorithms. The committee’s formulation of the optimization algorithms is based on imposed security constraints ensuring that equipment operates within design limits and that the network does not fail. In current practice, these constraints are set conservatively and there is little testing to learn where the constraints can be relaxed to achieve significantly better performance. The availability of finer resolution data that measure the state of the network on time scales comparable to the ubiquitous 60-Hz ac frequency creates opportunities to do better. Learning how to exploit these opportunities has only begun, in part because they demand a conceptual framework for the control and operation of the grid that incorporates more of the grid’s dynamics than is currently the case.
Innovation in the electricity industry requires more than the solution of technical problems. The industry has many commercial stakeholders with vested interests overseen by a complex set of regulatory authorities. The section below, “Synthetic Data for Facilitating the Creation, Development, and Validation of New Power System
Tools for Planning and Operations,” addresses the balance between security and financial incentives to keep data confidential on the one hand and open on the other to satisfy researchers’ needs for access to data. The path proposed here is to create synthetic data sets that retain the salient characteristics of confidential data without revealing sensitive information. Because developing ways to do this is in itself a research challenge, the committee gives one example of recent work to produce synthetic networks with statistical properties that match those of the electric grid.
Ideally, one would like to have real-time, high-fidelity simulations for the entire grid that could be compared to current observations. However, that hardly seems feasible any time soon. Computer and communications resources are too limited, loads and intermittent generators are unpredictable, and accurate models are lacking for many devices that are part of the grid. The section “Data-Driven Models of the Electric Grid” discusses ways to use the extensive data streams that are increasingly available to construct data-driven simulations that extrapolate recent observations into the future without a complete physical model. Not much work of this sort has yet been done: Most attempts to build data-driven models of the grid have assumed that it is a linear system. However, there are exceptions that look for warning signs of voltage collapse by the monitoring of generator reactive power reserves. The potential payoff for work in this direction depends on the results and should be regarded as high risk, high reward at this point. If it does turn out that large parts of the grid can be reduced to low-dimensional models, this information would be very useful for making short-term forecasts of grid behavior.
SYNTHETIC DATA FOR FACILITATING THE CREATION, DEVELOPMENT, AND VALIDATION OF NEW POWER SYSTEM TOOLS FOR PLANNING AND OPERATIONS
Data of the right type and fidelity are the bedrock of any operational assessment or long-range planning for today’s electric power system. In operations, assessment through simulation and avoidance of potentially catastrophic events by positioning a system’s steady-state operating point based on that assessment is the mantra that has always led to reliability-constrained economical operation. In the planning regime, simulation again is key to determining the amount and placement of new generation, transmission, and distribution. The data used to achieve the power industry’s remarkable record of universal availability of electricity has been relatively simple compared to future data needs, which will be characterized by a marked increase in uncertainty, the need to represent new disruptive technologies such as wind, storage, and demand-side management, and an unprecedented diversity in policy directions and decisions marked by a tension between the rights of states and power companies versus federal authority. The future grid is likely to be characterized by a philosophy of command and control rather than assessment and avoidance, which will mean an even greater dependence on getting the data right.
The U.S. electric power system is a critical infrastructure, a term used by the U.S. government to describe assets critical to the functioning of our society and economy. The Patriot Act of 2001 defined critical infrastructure as “systems and assets, whether physical or virtual, so vital to the United States that the incapacity or destruction of such systems and assets would have a debilitating impact on security, national economic security, national public health or safety, or any combination of those matters.” Although the electric grid is perhaps the most critical of all the critical infrastructures, much of the data needed by researchers to test and validate new tools, techniques, and hypotheses is not readily available to them because of concerns about revealing too much data about critical infrastructures.
This lack of easily available high-quality, realistic power grid data has become a thorny issue in a number of research communities that seek to address mathematical problems arising in power engineering, advance the state of the art in computation and simulation, and test new market designs that may result in better economic efficiencies. Some researchers with good access to power utilities enjoy the ability to test ideas on real data, but even here they are usually unable to publish full results from such tests in the open literature. Many other researchers do not even have such access, and are instead forced to rely on public repositories. Examples of such repositories include the family of steady-state power flow case files that ship with the free (and very useful) Cornell University MATPOWER suite (Zimmerman et al., 2011); the free power flow and transient stability cases used with some textbooks (PowerWorld Corporation, “Glover Overbye Sarma,” http://www.powerworld.com/gloveroverbyesarma. accessed March 23, 2016); power flow and transient stability cases from the University of Illinois (ICSEG, 2015); and cases available at the University of Washington Power Systems Test Case Archive or at the University of
Edinburgh’s School of Mathematics’ Power Systems Test Case Archive (NetworkData). Market data are even harder, if not impossible, to obtain.
The alternative to using public data is to enter into a nondisclosure agreement (NDA) with a consenting utility to use its data for testing ideas. The use of NDAs to obtain data, while useful in many instances, limits the important ability of the broader scientific community1 to check the reproducibility of results and to use important findings to advance their own work. This reproducibility principle has been a standard for scientific advancement since the time of Aristotle. In fact, the International Council for Science has made the following recommendations (among others):
Science publishers and chief editors of scientific publications should require authors to provide explicit references to the datasets underlying published papers, using unique persistent identifiers. They also should require clear assurances that these datasets are deposited and available in trusted and sustainable digital repositories. Citing datasets in reference lists using an accepted standard format should be considered the norm (ICSU, 2014, p. 2).
However, while openness and transparency are desirable, the mechanisms for achieving open access will necessarily vary by discipline. There are legitimate constraints on open access to some research data and, in some cases, to the research findings themselves. Whatever the case, transparency should be the norm, to be deviated from only with good reason. In those latter cases the use of synthetic data—that is, data that are not derived from real measurements but rather are synthesized from real measurements—could be an option provided the data sets are sufficiently rich enough to support new findings that would have been discovered by using real data while masking certain information such as private information (health, census, and the like), sensitive economic information, or specific parameters and topologies associated with a critical infrastructure. Overcoming the challenges in generating and using synthetic data is one way to resolve some of the restrictions associated with critical infrastructure data.
Other fields have had to deal with this data problem.2 The U.S. Bureau of the Census, for example, has set up a number of secure national data centers (the Federal Statistical Research Data Centers, or FSRDCs) at various universities, nonprofit organizations, and government entities across the country. Researchers wishing to use highly granular Census data can apply for permission to access the data on-site at one of the FSRDCs. This provides scientific access to highly valuable data while respecting confidentiality concerns. Fienberg (2006) summarized the technical goals of disclosure limitation techniques as follows: (1) inferences should be the same as if the researcher had complete original data; (2) researchers should have the ability to reverse disclosure protection mechanisms, not for individual identification but for inferences about parameters in statistical models; (3) there should be sufficient variables to allow for proper multivariate analyses; and (4) researchers should not only have the ability to assess the fit of the models but also be provided with most summary information, such as residuals (to identify outliers). The core guiding principle should be to generate released data that are as close as possible to illuminating the research frontier. These principles hold just as much for microdata as for synthetic data. From a scientific perspective, then, any field that may advance from analysis of, and experiments using, high-quality data is significantly limited in the absence of such data.
The electric industry perspective is that actual electric grid data are too sensitive to freely disseminate, a claim that is clearly understandable and justifiable. Network data are especially sensitive when they reveal not only the topology (specific electrical connections and their locations) but also the electrical apparatuses present in the network along with their associated parameters. Revealing these data to knowledgeable persons reveals information an operator would need to know to ensure a network is reliable as well as the vulnerabilities an intruder would like to know in order to disrupt the network for nefarious purposes.
There is also some justifiable skepticism that synthesized data might hide important relations that a direct use of the confidential data would reveal. This makes the development of a feedback loop from the synthetic data to the confidential data essential to develop confidence in the products resulting from synthetic data and to ensure their continuous improvement. A natural question is therefore what, if anything, can be done to alter realistic data
___________________
1 Including the disciplines of engineering and science engaged in invention and discovery of new methods and techniques of design.
2 See, for example, the work by Agrawal and Srikant (1994), which exemplifies the work on privacy for preserving data mining.
so as to obtain synthetic data that, while realistic, do not reveal sensitive details. An interesting methodology used to mask grid data is described in Borden et al. (2012). ARPA-E recognized this problem in a 2015 Funding Opportunity Announcement (DE-FOA-0001357), Generating Realistic Information for Development of Distribution and Transmission Algorithms (GRID DATA).
Industry’s hesitation to reveal too much data might also indicate a view of what problems need to be solved that differs from the committee’s view. For example, one may consider the ACOPF problem as a multilayered engineering problem, where producing a workable solution is the challenge, and that requires data of a certain fidelity. From that perspective, one could conclude that a mathematical representation, absent simplifying assumptions, cannot readily be solved. But the committee believes that different mathematical approximations to the general ACOPF problem can provide value, such as for carrying out what-if analyses that help guide engineering decisions. With that view, data sets of less-than-perfect fidelity can provide important value as long as they reflect characteristics of real-world data.
It is clear that the availability of realistic data is pressing, critical, and central to enabling the power engineering community to rely on increasingly verifiable scientific assessments. In an age of Big Data such assessments may become ever more pressing, perhaps even mandatory, for effective decision making.
Recommendation 4: Given the critical infrastructure nature of the electric grid and the critical need for developing advanced mathematical and computational tools and techniques that rely on realistic data for testing and validating those tools and techniques, the power research community, with government and industry support, should vigorously address ways to create, validate, and adopt synthetic data and make them freely available to the broader research community.
Random Topology Networks
This subsection describes a specific problem as an example of the type of mathematical research required to generate synthetic data. There has been extensive research recently on characterizing statistical properties of networks in varied domains. The idea here is to apply such analysis to the electric grid and then to generate fictional networks that share all the properties of the real ones. If the analysis is valid, ensembles of real and synthetic networks could be generated where real and synthetic networks are indistinguishable.
It has been shown that electric power grids have distinct topological characteristics (Hines et al., 2010). Wang et al. (2010a) systematically investigated both the topological and electrical characteristics of power grid networks based on available, real-world power grid system data. First, power grids have salient “small-world” properties, since they feature much shorter average path length (in hops) and much higher clustering coefficients than that of Erdos-Renyi random graphs with the same network size and sparsity. Second, their average node degree does not scale as the network size increases, which indicates that power grids are more complex than small-world graphs; in particular, the node degree distribution is well fitted by a mixture distribution coming from the sum of a truncated geometric random variable and an irregular discrete random variable. In Wang et al. (2010b) the deviation of the node degree distribution of power grids from a pure geometric distribution is investigated, with the result that the deviation substantially affects the topological vulnerability of a network under intentional attacks when nodes with large degrees become first targets of an attack. Another important characteristic of a power grid network is its distribution of line impedances, whose magnitude exhibits a heavy-tailed distribution that is well fitted by a clipped double-Pareto-lognormal distribution (Wang et al., 2010a).
Using recent advances in network analysis and graph theory, many researchers have applied centrality measures to complex networks in order to study network properties and to identify the most important elements of a network (see, for example, Wang et al., 2012). Real-world power grids experience changes continuously. The most dramatic evolution of the electric grid in the coming 10 to 20 years will possibly be seen from both the generation side and the smart grid demand side. Evolving random topology grid models would be significantly enhanced and improved and made even more useful if, among other things, realistic generation and load settings with dynamic evolution features, which can truly reflect the generation and ongoing load changes, could be added.
DATA-DRIVEN MODELS OF THE ELECTRIC GRID
Operating the electric grid is a collective enterprise of a large industry with well over a century of experience. Models, data, and controls all play their part, but their interactions are hardly seamless, because the mathematics on which they draw reflects theoretical communities that have each gone their own way, in some cases duplicating work as a result of different and even conflicting terminology. This section discusses the opportunities in a coherent amalgamation of these multiple mathematical perspectives. To set the stage, consider three problems from other areas that bear upon the interactions of models and data: (1) planning spacecraft trajectories, (2) discovering the causes of cancer, and (3) predicting weather. The first of these is (almost) solved entirely with the classical dynamical model, namely, Newton’s laws. There may be small stochastic influences from the solar wind and so forth and bits of control theory used to compute midcourse corrections, but these are minor compared to the dynamics. For cancer and other diseases, statistical analysis of data is primarily used to sort out what appears to be the relative contributions of different causative factors. It is therefore surprising when dynamic models contribute to developing treatment protocols, as in the synergistic effects of multiple drugs in the HAART treatment of HIV infections. Weather prediction lies in between, and data assimilation methods that intertwine data and models have led to marked improvements in forecasts. Note here that theory and simulation have been used to argue that forecasts beyond short and medium forecasts will never be feasible owing to the chaotic nature of atmospheric dynamics. Moreover, ensemble forecasting methods are used to estimate the uncertainty of forecasts by analyzing the effects of small changes in initial data or parameters of simulations.
Where does the power grid fit on this graph one of whose axes is the accuracy of models and the other is the statistical analysis of (large) data sets? Grid models are complex and make approximations that are not always completely understood. Loads are the biggest modeling uncertainty: They are constantly changing on multiple time scales and are hardly controlled in today’s grid. Still, dynamical models are essential to planning and operation of the grid, as evidenced by the transient stability load model mentioned in Chapter 3 that has 100 or so parameters. Improvements in model fidelity and confidence in their predictive capabilities will lead to more efficient and reliable power systems. Although the mathematical challenges are enormous, there are good reasons to be optimistic that substantial progress can be made with integrative methods that draw on dynamical systems theory, control theory, and machine learning. This subsection sketches some of the things that might be done.
Normal operation of the grid maintains system frequency and voltage through an elaborate set of controls designed to maintain stability. Even though system models have a vast number of degrees of freedom as a dynamical system, most of these are expected to be highly damped so that highly reduced and coarse-grained models can faithfully capture many of the dynamics related to more stressed operation, some large-scale oscillations, and other instabilities. Of course, sometimes the full model details are needed to represent quite stressed situations, such as motor stalling and recovery behavior during and after faults. Excepting these more unusual situations, the system can be engineered so that the more reduced models are adequate and can seek to do so even more in the future. Important questions are (1) How much of a reduction is possible? and (2) How can a reduced model be produced effectively? Analogous questions have been posed in the context of attractors for autonomous dynamical systems. There, nonlinear time-series analysis (Kantz and Schreiber, 2004) methods have been developed that use trajectory data to measure characteristics such as dimension, entropy, and Lyapunov exponents of the attractors. Heuristically, one thinks of trajectories in a high-dimensional phase space evolving onto attractors that may be fractal sets of much lower dimension.3 Tubes of nearby trajectories evolve to become squashed in some directions and elongated in others. Finite-time Lyapunov exponents quantify this geometry, which results in a cloud of initial conditions flowing to become almost a multidimensional ribbon. In the language of machine learning, the flow map F advances trajectories by a time t as an approximation of a low-rank map. Singular value decomposition of the Jacobian of F gives a linearized view of the squashing that occurs near this trajectory. One of the objectives for nonlinear time-series analysis is to reconstruct this structure from trajectories.
For observations of an ongoing system, the only way to obtain information about the phase space geometry near a given location on an attractor is to pick out trajectory segments in the region of interest. The time between
___________________
3 There are several different definitions of dimension, but the differences are unimportant here.
recurrences to typical regions increases at an exponential rate as the dimension of the system attractor increases. Consequently, attractor reconstruction for a system is feasible only when the dimension of the attractor is small. The recurrence time will be astronomical for attractors whose dimension is larger than, say, five or six. Because the power grid has changing inputs and is so high dimensional with loosely coupled parts, it seems to be an unlikely candidate for this type of analysis. On the other hand, it is controlled to operate at steady state, and stable states typically bifurcate when a single mode becomes unstable. This observation has been used to develop methods that anticipate voltage collapse and take control actions to prevent the collapse from occurring (Dobson and Chiang, 1989). Further development of these methods that take account of stochasticity in the system is a hot research area at this time, especially in the context of ecological regime shifts and tipping points for climate change. Additionally, “sandpile” models rooted in statistical physics are a useful tool in studying cascading failures in networks. In both of these instances, theory points to models of sufficient generality that they serve as a guide for what to look for in data, even in the absence of quantitative circuit models of the grid.
Apparently, little research has been done to monitor the transmission grid and analyze its dynamics from the perspective of nonlinear time-series analysis. This is hardly surprising because the grid is always changing: Its asymptotic behavior as an autonomous dynamical system on time scales of days and longer is of less interest than its predictability on time scales of minutes and hours. Indeed, the unit commitment auctions of the system operators “reset” the grid as a dynamical system daily. Moreover, the data for fine-scale monitoring of nonlinear dynamics of the grid is only now becoming available with the widespread use of synchrophasors. Monitoring methods have primarily relied on a linear perspective in which transients typical of linear systems are fit to data. Further work to identify modes that are close to marginal stability could provide the basis for establishing monitors that trigger alarms signaling the need for intervention to prevent the instability and provide quantitative estimates of its immediacy. Going farther, the methods might also lead to faster control procedures that are based on simulations of reduced models.
Consider a control problem in which parameters of a dynamical system must be optimized to achieve maximal performance, but the system is so large that detailed simulation is too slow for most purposes. Even in these circumstances, the system may behave as if it has much lower dimension, either as an “emergent” property of the network or because it was engineered to be that way. Then, a machine learning algorithm may be able to learn the relationship between the control variable settings and the performance level for the dynamical system. In particular, using data collected about the inputs and corresponding performance levels for various control parameter settings, a machine learning method should be able to create a function that predicts what the performance level is for a new control parameter setting. The expert system does not need to know anything about the dynamical system in order to make these predictions, it simply uses past data from the simulations. This way, the machine learning model is interpolating between known solutions from the dynamical system simulation. It may also be feasible to experimentally achieve the same end by stimulating the system itself. By injecting small disturbances into the grid from a known stable state, the transient response of the system gives information about the decay rates of the slowest modes in the system. For optimal control, the modes that are most vulnerable can be targeted. When known solutions are unavailable for interpolation, one can resort to additional large-scale simulation to plan responses when similar conditions occur in the future. The frequency with which observed states recur is closely related to attractor dimensions, so creating a low-dimensional grid will facilitate successful monitoring and future analysis.
Nonlinear time-series analysis methods can be applied to data without using a dynamical model; however, the goal is clearly to fit models to the data. Experience with other systems indicates that initial attempts to do so will produce disappointing results. Even when trajectories are obtained from simulation of a deterministic vector field, identifying the parameters that gave rise to the trajectory is a problem that does not yet have a good solution. One approach is to use optimization algorithms to minimize a residual between the trajectory and data as initial conditions and parameters are varied. Sensitivity to initial conditions within chaotic attractors is one reason why the problem is hard: Nearby trajectories separate at exponential rates, so identifying a trajectory by its initial condition requires exponentially increasing accuracy as the length of the trajectory grows. One consequence is that the residual function has very large gradients and higher derivatives, so its minima are not easily found with methods that are based on fitting quadratic functions (Phipps et al., 2006). This is an additional reason to set a time horizon on quantitative efforts at grid forecasting.
The analogy between grid simulation and weather prediction appears appropriate. The atmosphere is turbulent, and atmospheric models have chaotic attractors. Data assimilation is used with operational weather forecast models to repeatedly update initial conditions; these updates will be used in subsequent forecasts, because model trajectories will increasingly depart from observations as time goes on. The dimension of the atmospheric attractor appears to be large, so highly reduced models do not appear to work well for forecasting.
Are these also characteristics of the transmission grid? It is not fully known, but the future grid can be engineered so that it is more predictable and amenable to this kind of analysis. Machine learning techniques, together with dynamical systems analysis and control theory, provide foundations for pursuing high-fidelity, real-time simulations of the grid that can be usefully fit to large volumes of phasor measurement unit (PMU) data. In particular, machine learning can be applied to develop models for aspects of the systems like time-varying loads for which physical models are lacking. An additional research challenge with this approach is to correctly incorporate the many discrete events that can occur during a large-scale disturbance, such as those due to protection systems or to motors stalling.
Recommendation 5: Integration of theory and computational methods from machine learning, dynamical systems, and control theory should be a high-priority research area. The Department of Energy should support such research, encouraging the use of real and synthetic phasor measurement unit data to facilitate applications to the power grid. Establishment of experimental test-beds would be a valuable additional resource.
THE ROLE OF CONTROL THEORY IN THE CHANGING ELECTRIC ENERGY SYSTEMS
Automated controllers are critical to reliable power system operation over a wide range of operating conditions (equipment status and input/output ranges). The control architecture is one of the most uncertain aspects of evolution of the power system. At one extreme, system operators will adapt to increasingtly distributed, intermittent energy producers without relinquishing centralized control. At the other extreme, microgrids4 will be created that can both operate independently and be attached to a regional grid. In normal operation, the microgrids would be responsible for their own control. For emergencies and during periods when low-cost power is available, there would be protocols for how power is delivered from the regional grid to the microgrid. Intermediate scenarios that rely on distributed control architectures are also possible. Whichever control architectures are adopted, they are expected to rely more on automation and to make more use of sensors and advanced communication technologies.
As conditions vary, set points of controllable equipment are adjusted by combining an operator’s insights about the grid response and the results of optimization given an assumed forecast. If done right, system operators do not have to interfere with the automation: Their main task is to schedule set points given the forecasts. Fast dynamic transitions between new equilibria are stabilized and regulated by the primary controllers. Beyond this primary control of individual machines, there are two qualitatively different approaches to ensuring stable and acceptable dynamics in the changing power industry:
- The first approach meets this goal of ensuring stable and acceptable dynamics via coordinated action of the system operators. Planners will attempt to embed sensing, communications, and controllers sufficient to guarantee system stability for the range of operating conditions of interest. This is an ambitious goal that faces theoretical challenges. For example, maintaining controllability and observability with increased numbers of sensors and controllers is a challenge given the current state of primary control. It seems feasible that current technologies will allow meeting performance objectives, which are now constrained by requirements for synchronization and voltage stabilization/regulation. As mechanically switched transmission and distribution equipment (phase angle regulators, online tap changers, and so
___________________
4 According to the Department of Energy (DOE), “A microgrid is a local energy grid with control capability, which means it can disconnect from the traditional grid and operate autonomously” (see DOE, “How Microgrids Work,” June 17, 2014, http://www.energy.gov/articles/how-microgrids-work).
-
forth) is replaced by electronic devices—flexible ac transmission systems, high-voltage dc transmission lines, and the like—the complexity of the control infrastructure for provable performance in a top-down manner is likely to become overwhelming. In particular, variable-speed drives for efficient utilization of power are likely to interfere with the natural grid response and the existing control of generators, transmission, and distribution equipment.
- The second approach is the design of distributed intelligent Balancing Authorities (iBAs) and protocols/ standards for their interactions. As discussed in Chapter 1, automatic generation control is a powerful automated control scheme and, at the same time, one of the simplest. Each area is responsible for coordinating its resources so that its level frequency is regulated within acceptable limits and deviations from the scheduled net power exchange with the neighboring control areas are regulated accordingly. A closer look into this scheme reveals that it is intended to regulate frequency in response to relatively slow disturbances, under the assumption that primary control of power plants has done its job in stabilizing the transients.
It is possible to generalize this notion into something that may be referred to as an iBA, which has full responsibility for stabilization and regulation of its own area. Microgrids, distribution networks, portfolios (aggregates) of consumers, portfolios of renewable resources, and storage are examples of such areas. It is up to the grid users to select or form an iBA so that it meets stability and regulation objectives on behalf of its members. The operator of a microgrid is responsible for the distributed energy resources belonging to an area: The microgrid must have sufficient sensing, communications, and control so that it meets the performance standard. This is much more doable in a bottom-up way, and it would resemble the enormously successful Transmission Control Protocol/Internet Protocol (TCP/IP). Many open questions remain about creating a more streamlined approach to ensuring that the emerging grid has acceptable dynamics. For example, there is a need for algorithms to support iBAs by assessing how to change control logic and communications of the existing controllers to integrate new grid members.
The contrast between these two approaches reflects the tension between centralized and distributed control. Because experiments cannot be performed regularly on the entire grid, computer models and simulations are used to test different potential architectures. One goal is to design the system to be very, very reliable to minimize both the number and size of power outages. The problem of cascading failures looms large here. The large blackouts across the northeastern United States in 1965, 2003, and 2007 are historical reminders that this is a real problem. Since protective devices are designed to disconnect buses of the transmission network in the event of large fault currents, an event at one bus affects others, especially those connected directly to the first bus. If this disturbance is large enough, it may trigger additional faults, which in turn can trigger still more. The N – 1 stability mandate has been the main strategy to ensure that this does not happen, but it has not been sufficient as a safeguard against cascading failures. The hierarchy of control for the future grid should include barriers that limit the spread of outages to small regions.
PHYSICS-BASED SIMULATIONS FOR THE GRID
How can mathematics research best contribute to simulation technology for the grid? Data-driven models, described in “Data-Driven Models of the Electric Grid” earlier in this chapter, begin with a functioning network. Moreover, they cannot address questions of how the grid will respond when subjected to conditions that have never been encountered. What will be the effects of installing new equipment? Will the control systems be capable of maintaining stability when steam-driven generators are replaced by intermittent renewable energy resources? Simulation of physics-based models is the primary means for answering such questions, and dynamical systems theory provides a conceptual framework for understanding the time-dependent behavior of these models and the real grid. Simulation is an essential tool for grid planning, and its design requires extensive control, as discussed in the preceding section. In normal steady-state operating conditions, these simulations may fade into the background, replaced by a focus on optimization that incorporates constraints based on the time-dependent analysis. Within power systems engineering, this type of modeling and simulation includes TS analysis.
Effective physics-based modeling of the grid has three components: (1) the formulation of models, (2) the implementation of algorithms and software that produce simulations of the models, and (3) a theoretical and conceptual context for determining which simulations should be performed and for interpreting the results of these simulations. All three components pose mathematical and computational challenges, which the committee discusses in this section.
The modeling challenges begin with reducing models for the different devices that sit at the buses (nodes) of the networks by amalgamating multiple devices. The models can be at different scales, and the derivation of coarser-scaled models from ones at finer scales is an important part of the modeling. As new types of electronic devices are incorporated into the network, new device models are needed. Responsibility for creating, testing, and disseminating these models is diffuse and contributes to uncertainty about the fidelity of grid models. The committee returns to this issue in Chapter 8.
A second modeling issue that requires further attention is the mixture of discrete and continuous components in the grid. One modeling challenge for such hybrid systems is to incorporate the discrete logic into simulation algorithms in a seamless way. Numerical integration algorithms for continuous time systems approximate solutions in discrete steps. When discrete components like circuit breakers trip, it is necessary to detect that this happened within a step, compute more precisely the time at which it occurred, and compute the state of the system after it occurred. The effect of the event can even change the model in significant ways, as when a short circuit changes network topology. When multiple events occur at almost the same time, the model must resolve whether there are interactions between the events, minimally determining which occurred first, and whether this prevented the subsequent events from happening. In systems with the possibility of cascading failures, there is a trade-off between the complexity of the model logic and computational efficiency. In commercial transient stability packages this relatively common situation is often handled by splitting the integration time step. Increasing reliance on electronic control components makes this issue of hybrid simulation even more common.
A third modeling issue that requires more attention is the way stochastic and uncertain phenomena are represented in the models. The theory of stochastic differential equations (SDEs) treats models in which stochastic fluctuations are always present and their main effects come from the accumulation of large numbers of tiny events. The classical problem for these methods is Brownian motion of a particle responding to the impacts of molecular motions in a fluid. The grid manifestly sees unpredictable events that do not fit the context of SDEs. Lightning strikes, weather changes that affect wind and solar generation, and the switching of loads all have sufficient magnitude that it may be more appropriate to treat them as additional discrete events, albeit events whose magnitude and timing are unpredictable. Measuring probability distributions that characterize their uncertainty and incorporating these distributions into models is a significant modeling challenge.
Numerical methods for solving initial value problems for ordinary differential equations (ODEs) provide the algorithmic foundation for grid simulations. The theory and implementation of these methods is a mature subject that, like optimization, comes with many different algorithms that are the algorithms of choice for different subclasses of problems. However, grid simulations involve additional issues that create still further challenges. One immediate issue is that some grid problems like N – 1 stability require prodigious numbers of simulations, so the state of computational performance results in discouraging limits on what can be accomplished relative to our goals. This issue is even more concerning when considering N – 1 – 1 and N – k analysis. Especially in software packages that make it easy to assemble models from standard components, inadequate attention is often given to computational speed.
Models of even “standard” resistance, inductance, and capacitance electric circuits are differential algebraic equations (DAEs) rather than ODEs. In DAEs, some of the equations express fixed relationships among the variables. Ohm’s law for a linear resistor (V = IR) is a familiar example of an algebraic equation. Sometimes, but not always, the algebraic equations can be “solved” to eliminate variables and produce a reduced system of ODEs. When reduction fails, the fundamental existence and uniqueness theorem for solutions of initial value problems may also fail. One remedy for this failure is to formulate more elaborate “multiphysics” models, which greatly increase the computational resources needed to solve the systems. Yet another difficulty is that reduction of a system may require differentiation of the algebraic equations.5 Numerically, special algorithms are required to
___________________
5 Such DAEs with higher indexes appear frequently in mechanics.
ensure that the algebraic equations themselves continue to be satisfied rather than just their derivatives (Hairer and Wanner, 1996). Research is needed to automatically detect when DAEs encounter these issues and take corrective action suited to the physics of the models. Failure of existence and uniqueness of DAEs introduces a new kind of uncertainty into debugging models for the grid because unexpected results can come from either model properties or programming errors.
Figure 1.4 in Chapter 1 depicts the time scales relevant to the grid. Many initial value solvers are limited in the time steps they can use by the fastest time scales present in a system. This prompts the creation of reduced models that retain only the time scales of immediate interest. When there are multiple time scales of interest in a problem, these time scales can interact to produce qualitative phenomena on intermediate time scales not represented explicitly in a model. There is a large literature on specialized “stiff” solvers that can operate on slower time scales of a system when the fast time scales are at quasi-steady states that form “slow manifolds” for the system. However, much less is known about the numerical analysis of systems with interacting time scales, and software libraries may lack algorithms that deal with special problems that arise in these circumstances. Transient stability and longer- term dynamics simulations have largely avoided such issues by ignoring these faster dynamics or by using multirate methods (Crow and Chen, 1994). Electromagnetic transient packages using implicit integration methods with time steps of microseconds can directly handle these situations, albeit with more stringent computational requirements.
Fast switching behaviors of digital devices further complicate accurate simulation of the grid. On the time scales of interest, these devices yield models that are not smooth and fall outside the domain for which most of the analysis of numerical solvers is performed. Coupled with the challenges of incorporating stochastic phenomena, the mathematical foundations for simulation algorithms become problematic. Nonetheless, simulation remains important, and research to improve these foundations for complex systems like the electric grid is needed. It is also important to develop further tools that enable more effective use of grid models and the interpretation of simulation results. The example of transient stability analysis will illustrate some of the issues.
A system cannot be expected to be at a desired operating state immediately following a fault. However, if the postfault state lies in the basin of attraction for this desired operating state, no additional control action is needed to clear the fault. This can be tested for individual postfault states, but the entire basin of attraction needs to be characterized for design purposes and making real-time control decisions. Basin boundaries may well be complicated fractal sets, so locating them is a problem. The exhaustive search of phase spaces that compute trajectories from a fine mesh of initial conditions is the obvious strategy to locate the basins and their boundaries. Such searches are feasible only for phase spaces of very small dimension, because the number of points in a mesh grows exponentially with dimension. Similarly, exploring the effects of varying parameters in a model by simulations using meshes of different parameter values is possible only when varying a small number of parameters. When studying models that could have more than a hundred thousand variables, different strategies are called for.
Progress in dynamical systems theory has repeatedly begun with the distillation of mathematical questions and conjectures that isolate critical issues in their simplest manifestations from the more complicated contexts in which they arose. An important example for the power grid that illustrates this strategy draws on the classification of bifurcations of vector fields. For equilibria of dynamical systems that depend on a single parameter, bifurcation theory identifies saddle-node and Hopf bifurcations as the only types of generic bifurcations. The theory yields normal forms, which are studied to discover the qualitative properties of each type of bifurcation. Further, the theory gives explicit procedures for locating the bifurcations within more complicated models. Identifiable features of the dynamics can be used to infer the occurrence of these bifurcations from time-series data. Computational tools based on this theory locate parameters where voltage collapse occurs in models of electrical grids and identify warning signs of incipient collapse in real-time monitoring of the grid. This example illustrates how advances in dynamical systems theory have resulted from intensive study of simple examples.
Many of the issues described above have been dealt with individually in varied contexts, but the prospect of developing software that treats them in an integrated manner on systems of the scale of the power grid is daunting. It may never be feasible to implement detailed real-time simulations of the entire grid that capture its dynamics accurately. Nonetheless, smaller models, whether they come as reductions of larger models, coarse graining, or selection of subgrids, will give important insights that can be further tested through the investigation of data-driven models described in the section “Data-Driven Models of the Electric Grid,” earlier in this chapter.
Recommendation 6: The Department of Energy should support research to extend dynamical systems theory and associated numerical methods to encompass classes of systems that include electric grids. In addition to simulation of realistic grid models, one goal of this research should be to identify problems that exemplify in their simplest forms the mathematical issues encountered in simulating nonlinear, discontinuous, and stochastic time-dependent dynamics of the power system. The problems should be implemented in computer models and archived in a freely available database, accompanied by thorough documentation written for both mathematicians and engineers. Large grid-sized problems that exemplify the difficulty in scaling the methods should be presented as well.
DATA-DRIVEN APPROACHES FOR IMPROVING PLANNING, OPERATIONS, AND MAINTENANCE AND FOR INFORMING OTHER TYPES OF DECISION MAKING
The amount of data about the power system has been growing at a staggering rate, including PMU data, data from other types of sensors in the transmission and distribution systems and from sensors at the generators, and customer behavior information that includes smart meters, data about events that might influence demand (including media and social media data), weather data, and so forth. While there is certainly a growing interest in the use of these data, they are clearly not being used to their full potential, and their further application would be extremely valuable. Several examples are provided below, in addition to those listed in Chapter 4.
Creating Hybrid Data/Human Expert Systems for Operations
When a serious problem occurs on the power grid, operators might be overloaded with alarms, and it is not always clear what the highest priority action items should be. For example, a major disturbance could generate thousands of alarms (Kezunoic and Guan, 2009). Certainly much work has been done over the years in helping operators handle these alarms and more generally maintain situation awareness, with Panteli and Kirschen (2015) providing a good overview of past work and the current challenges. However, still more work needs to be done. The operators need to quickly find the root cause of the alarms. Sometimes “expert systems” are used, whereby experts write down a list of handcrafted rules for the operators to follow. These could be useful, but a data-driven approach could easily provide a better set of guidelines. In particular, data about past alarms can be used to automatically learn what the optimal set of rules should be for the operators to follow in order to find the root cause of the problem. The data can also be combined with expert knowledge to produce a data-driven model that looks as much as possible like the expert model. One way to do this is to use the expert model within a Bayesian prior; if enough data disagree with the expert knowledge, the expert knowledge will be overwhelmed and the model will agree with the data. Tools from machine learning, particularly tools for interpretable or comprehensible machine learning, could naturally be employed for these tasks. For instance, expert systems are often written in a logical structure of IF-THEN rules (IF Alarm 1 activates THEN do action A, ELSE IF Alarms 2 and 3 activate THEN do action B, and so on). There are ways to learn these types of logical structures from data, called “decision tree,” “decision list,” or “rule list” machine-learning algorithms.
Machine-Learning Models for Hazard Modeling and Reliability
Sensor data from power equipment are not being used to their fullest extent in ensuring reliability. Consider, for instance, a wind turbine or a transformer with several sensors on it, each emitting signals every few seconds or minutes. Most often, any signal going outside its design range will issue an alarm. This considers a single threshold for each sensor separately and is an incredibly limited way to use data. For instance, if there are trends in the sensor data, the trends will be invisible until the signal reaches the threshold. Worse, patterns that are coupled across the signals are completely ignored by considering each signal separately. For instance, several signals increasing sharply in value should potentially trigger an alarm but would not do so under the current system unless one of the signals crosses a threshold—and by then it may be too late to stop the problem. These patterns can come in many forms, and detection of these patterns can help in predicting future problems. This was discussed in Chapter 4.
Visualization Tools for Understanding Data
The power grid generates a tremendous amount of data, a trend that is growing with the rapid deployment of PMUs, smart meters, and other intelligent electronic devices. Trying to understand these potentially high-dimensional data manually is next to impossible. Power system visualization seeks to help people make sense of these data both by applying algorithms to better extract the information contained in the data, and then to display it graphically. One example was the use of clustering, presented in Chapter 4, associated with the analysis and visualization of transient stability results, a technique that could be readily extended to PMU data.
Much work has been done in this field; an overview is given in EPRI (2009). However, there is still much to be done. For example, it would be useful to have visualization tools that can project high-dimensional data to a relevant two- or three-dimensional subspace. Examples of such techniques include graph projection, where nodes of a graph in high dimensions are projected onto a plane in a way that aims to preserve distances between nodes. These techniques could be useful for knowledge discovery in high-dimensional data from equipment such as sensor data, but also for data about customers. One might like to cluster customers by usage patterns, or by factors that may be relevant for offering incentives.
Detecting Who Has No Power
Power companies do not always know who is out of power if there are no sensors at the locations of individual customers. People may assume the power company already knows about the outage and do not report the problem. It may be possible to deduce who is out of power based on the data from customers who are reporting outages, coupled with other data—for instance, from social media (Twitter, Facebook). It may also be possible to send one or more drones to gather information on outages. This may require an algorithm for image segmentation or image clustering.
Machine Learning for Long-Term Planning
Some of the key problems in the future power grid are behavioral: Will customers adopt certain energy-efficient behaviors if they are given rebates? What will be the demand tomorrow given the weather forecast and in light of, say, that tomorrow is Superbowl Sunday? Can we forecast whether a given customer is likely to purchase an electric vehicle? Knowing this would be useful for long-term planning of needs, like charging stations or generation. Similarly, who is likely to purchase photovoltaics or wind turbines? These can be cast as classic machine learning classification, or regression, problems, as described in the section on hybrid human/data expert systems. Machine learning techniques are natural for situations where there is no physical model (no dynamical system, for instance). Machine learning methods make very few assumptions about the data (usually the assumption is that the data are all drawn randomly from an unknown distribution) but are nonetheless able to predict well future data drawn from the same distribution. These methods can handle high-dimensional data and are easy to implement since there are many publicly available software packages.
Unfortunately all of these very clear ways that power companies could immediately see value from their data are not generally being realized: The data are becoming “data tombs.” There could be many reasons for this. Perhaps it is difficult to compute the value of predictive modeling tools, as opposed to optimization tools. If a better solution to the day-ahead unit commitment problem is found, the value of the optimization improvement would be apparent. On the other hand, the value of data showing improvements in detecting who is out of power, determining which pieces of equipment are more likely to fail, or predicting who will purchase an electrical vehicle is not as easy to measure. (However, determining the value of such methods is not difficult.) As another possible reason, power companies do not generally hire data scientists—that is, people with the expertise to process these data and harvest them for useful information. If it is unclear what the value would be of mining these data: A company may not be able to envision what it could be useful for.
Recommendation 7: The Department of Energy should support research on data-driven approaches applied to power systems, including operations, planning, and maintenance. This would include better machine
learning models for reliability; comprehensible classification and regression; low- dimensional projections; visualization tools; clustering; and data assimilation. A partial goal of this research would be to quantify the value of the associated data.
OPTIMIZATION
Convex Relaxation in Grid-Related Optimization
As noted in the subsection Grid-Related Continuous Optimization in Chapter 4, a wish to avoid or finesse nonconvexity has led recently to enormous interest in the idea of solving the ACOPF problem through semidefinite (convex) relaxation; this approach is explored in Lavaei and Low (2012) and Low (2014a,b). Semidefinite programming (SDP) may be viewed as a generalization of linear programming: In SDP, a symmetric positive semidefinite matrix is sought that minimizes an affine function. SDP is of great interest for two related reasons: An SDP problem can be solved in polynomial time, and extensive work beginning in the 1990s showed that some NP-hard problems can be solved approximately via a sequence of SDP problems. For a survey of SDP and other convex optimization problems, see Anjos and Lasserre (2012). A frequently used formulation of the ACOPF is a quadratically constrained quadratic program (QCQP), generically expressed as
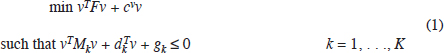
where v ∈Rn. In this formulation, v is the vector of variables, F is an n × n symmetric matrix, c is a vector, and, for 1 ≤ k ≤ K, Mk, dk, and gk are, respectively, an n × n symmetric matrix, a vector, and a scalar. Provably polynomial-time algorithms exist for this problem only in the all-convex case, when F and all Mk are positive-semidefinite.
Problem (1) is difficult in large part because of its quadratic nature, that is, the appearance of terms of the form vivj. One way to simplify (1) is to define a matrix W as Wij = vivj, which leads to a new optimization problem that is linear in the matrix W and the vector v—namely, a computationally tractable linear program, albeit with a larger number of variables. For example, the objective function of (1) becomes
![]()
However, the new problem with variables v and W is not equivalent to (1) unless the relation Wij = vivj is enforced for every i and j or, in matrix notation, if W is the rank one matrix W = vvT. Unfortunately and not surprisingly, this constraint makes the problem nonconvex. So this constraint is relaxed into the less restrictive condition that W is symmetric and positive semidefinite. This condition is a relaxation of W = vvT because it is weaker: Every W of the form W = vvT is rank one and positive semidefinite, but every symmetric positive-definite matrix is not rank one.
If Ŵ is a solution to the relaxed problem, in general this is not a solution of the original problem (1), unless Ŵ has rank one. In this case, Ŵ is an optimal solution of (1), and the objective value corresponding to Ŵ is the exact optimal value for (1). Even when Ŵ is not rank one, the semidefinite relaxation always provides a lower bound on the value of the objective in (1).
In Lavaei and Low (2012) and Low (2014a,b), justification is given for expecting that the SDP relaxations of many practical ACOPF problem instances will have rank one optimal solutions. As of 2015, community opinion is not unanimous; see Bienstock (2013) for additional discussion.
The SDP relaxation just given is not the only convex relaxation for ACOPF and may not necessarily be the tightest (or, especially, the fastest: large SDPs can be challenging). Numerous authors have proposed a variety of other relaxations, such as a QC (quadratic convex) relaxation (Coffrin et al., 2015).
A related set of ideas that may also be useful for grid-based optimization problems is polynomial optimization, which is just what its name suggests: minimizing the value of a polynomial subject to inequality constraints
involving other polynomials. Like QCQP, this problem is known to be NP-hard, but, in the spirit of SDP-based approximation algorithms, it can be solved by developing a hierarchy of convex (semidefinite) relaxations, in which nonnegative polynomials are represented as sums of squares of polynomials. This representation allows efficient tests based on semidefinite programming of whether there is a unique global optimum.
Because of the substantial potential gains from convex relaxation and polynomial optimization formulations, these topics have recently become hot. Numerical evidence thus far suggests that relaxations are exact in many cases, and that network topology plays a critical role in determining whether a relaxation is exact. Further research is needed before these issues are well understood.
A key usage of ACOPF is in market operation. One of the challenges in the current optimal power flow solution techniques is that their dc-only solutions, where voltage constraints are linearized, do not always accurately represent the future voltage-constrained systems. As the development work on a full-blown ACOPF proceeds, it may be determined that a combination of ACOPF and a dc approximation will be required to converge to an optimal solution. Not only would this provide a better representation of the physics of the system, but it should be included in considerations of market design, particularly related to the consideration of uncertainty. Electricity markets can be quite complex, including an interplay between physics, economics, and uncertainties of many forms. Foundational research is needed to develop enhanced market structures to “future-proof” the grid to these uncertainties.
A final challenge in accelerating progress in grid-related optimization is the very serious lack of realistic test problems. Because service operators compete with one another, they are not willing to make data available that would allow more complete testing of alternative methods. This concern, in the form of proposing the development of synthetic data, appears in the preceding section, “Data-Driven Approaches for Improving Planning, Operations, and Maintenance and for Informing Other Types of Decision Making.” Without realistic and representative problems for testing, it will be impossible to develop reliable optimization methods and software.
Recommendation 8: Orders-of-magnitude improvement in nonlinear, nonconvex optimization algorithms are needed to enable their use in wholesale electricity market analysis and design for solving the ac optimal power flow (ACOPF) problem. Such algorithms are essential to determine voltage magnitudes. Therefore the Department of Energy should provide enhanced support for fundamental research on nonlinear, nonconvex optimization algorithms.
Robust and Chance-Constrained Optimization
A valid criticism of the approach implicit in stochastic optimization (see the subsection on stochastic optimization in Chapter 4) focuses on the generation of the set of scenarios S to be studied. In order for the formulation to prove effective, a very large number of scenarios might be needed; furthermore, their respective probabilities might have to be accurately estimated. In following this methodology, however, there is the chance that the computed solution might prove nonrobust in the sense that a realization of the second-stage data not captured by the scenarios could entail high cost or, worse, infeasibility, even if the realization is “close” to a scenario. As an alternative, one could model the second-stage loads dk (the subscript indicates the bus, and the variables dk are uncertain quantities).
(1r) For each bus k, there is an estimate ![]() for the “average” second-stage load at k and an estimate δk for the maximum error in estimation. Thus, it is assumed
for the “average” second-stage load at k and an estimate δk for the maximum error in estimation. Thus, it is assumed ![]() for each k.
for each k.
(2r) A maximum total error is assumed, e.g., a constraint of the form ![]() , for some given parameter Γ > 0.
, for some given parameter Γ > 0.
Let D be the (infinite) set of second-stage load vectors indicated by (1r), (2r). The analogue of the formulation in the subsection on stochastic optimization of Chapter 4 now becomes
![]()
so that p is feasible during the first stage; Lgyg ≤ pg ≤ Ugyg for all g; and all variables yg take value 0 or 1. Here, given is used a vector p = {pg: g ∈ G}, ρ(p) is defined as the max-min second-stage cost assuming that each generator g is used to output pg in the first stage. Formally, for a vector ![]() of second-stage loads, let
of second-stage loads, let
![]()
so that (p, ![]() ) is feasible in the second stage under loads
) is feasible in the second stage under loads ![]() and all variables
and all variables ![]() take value 0 or 1, the minimum cost that can be attained in the second stage under first-stage outputs p and second-stage loads
take value 0 or 1, the minimum cost that can be attained in the second stage under first-stage outputs p and second-stage loads ![]() .
.
Then
![]()
In other words, if outputs p are chosen during the first stage, ρ(p) is the worst-case cost expected in the second stage under all possible loads of the form (1r), (2r), assuming that at the start of the second stage one observes the realization of loads and reacts optimally. Note that the function ρ(p) is implicitly defined through (3) and (4). These definitions further highlight that, as was the case with the formulation equation (3) of Chapter 4, (2) is a bilevel optimization problem. Solution techniques for this problem would likely entail, again, some form of decomposition and an indirect use of duality (if the functions f(k) are convex), such as Benders’ decomposition, so as to approximate the lower envelope of the function ρ(p). Sampling from the set D could prove useful in this regard—vectors are sampled satisfying (1r), (2r) and used to generate valid cutting planes, in advance of a formal application of Benders’ decomposition.
The above example highlights various features of robust optimization: The data error model is fairly agnostic, and a fictitious adversary is assumed to be able to draw data from that model so as to exploit any weakness in the choice of decision variables. Hence the problem acquires a min-max nature (in the case above, a third “min” layer is used to model the recourse decisions in stage 2). The conservatism of the model is managed through appropriate choices of the parameters Γ and δk. In more accessible applications of robust optimization it is possible to pose the min-max problem as a single “compact” (polynomial-size) convex optimization problem. Robust optimization has become a mature methodology with significant theoretical underpinnings (see Ben-Tal and Nemirovski, 2000, and Bertsimas et al., 2011) and computational successes; its strongest suit is the agnostic nature of the models.
A particular version of robust optimization worth pointing out arises in the context of chance constraints. Returning to equation (2), note that an implicit constraint in the choice of the first-stage outputs p is that they must prove feasible for the second stage regardless of the second-stage loads. If the δk quantities are chosen very large, the solution might end up being overly conservative. If, on the other hand, they are chosen too small, the computed solution p might entail an unacceptable risk of infeasibility. An alternative would be to use “reasonably small” δk values and, in addition, to impose a constraint of the form
![]()
where the probabilities are computed assuming that second-stage demands have a probability distribution with means ![]() and standard deviations δk. Here ε is a small parameter. This model allows demand errors to exceed the limit δk; however, constraint (5) states that outright infeasibility is rare. One could impose (5) either in addition to the robust model (1r), (2r) for demands or as a substitute. This is an example of a chance constraint; see Nemirovski and Shapiro (2006) for background. As a further elaboration of chance constraints one can generate a robust variant of (5) so as to lessen sensitivity to parameter choices. This yields so-called ambiguous chance-constrained models; see Erdogan and Iyengar (2006).
and standard deviations δk. Here ε is a small parameter. This model allows demand errors to exceed the limit δk; however, constraint (5) states that outright infeasibility is rare. One could impose (5) either in addition to the robust model (1r), (2r) for demands or as a substitute. This is an example of a chance constraint; see Nemirovski and Shapiro (2006) for background. As a further elaboration of chance constraints one can generate a robust variant of (5) so as to lessen sensitivity to parameter choices. This yields so-called ambiguous chance-constrained models; see Erdogan and Iyengar (2006).
To illustrate the application of these models in this setting, consider constraint (5). A reasonable version for this constraint would be one where second-stage demands are independently and normally distributed. However, this assumption introduces two kinds of possible errors: (1) errors in estimating the means and standard deviations and (2) model errors (in particular, the normality assumption could be incorrect). In order to guard against
such errors, the normality assumption is maintained but now it is assumed that an adversary picks the means ![]() and the standard deviations δk (in other words, these are no longer fixed values that are part of the problem). To formalize this approach, suppose that the total number of second-stage loads is N and let
and the standard deviations δk (in other words, these are no longer fixed values that are part of the problem). To formalize this approach, suppose that the total number of second-stage loads is N and let ![]() and
and ![]() denote two sets contained in RN. Then replace (5) with the stronger requirement
denote two sets contained in RN. Then replace (5) with the stronger requirement
![]()
In this constraint, ![]() is the probability under the multinormal distribution where load k is normally distributed, with mean
is the probability under the multinormal distribution where load k is normally distributed, with mean ![]() and standard deviation δk. Thus, the adversary’s power is somewhat constrained, but the planner must still choose a sufficiently robust solution. Clearly, using (6) guards against misestimation of the means and standard deviations of demand. In fact, experimental evidence suggests that (6) also protects against model error, in particular the normality assumption and possibly even the independence assumption (provided that correlations are weak). A recent use of this methodology in the power transmission setting is found in Bienstock et al. (2014).
and standard deviation δk. Thus, the adversary’s power is somewhat constrained, but the planner must still choose a sufficiently robust solution. Clearly, using (6) guards against misestimation of the means and standard deviations of demand. In fact, experimental evidence suggests that (6) also protects against model error, in particular the normality assumption and possibly even the independence assumption (provided that correlations are weak). A recent use of this methodology in the power transmission setting is found in Bienstock et al. (2014).
CHALLENGES IN MODELING THE ELECTRIC GRID’S COUPLING WITH OTHER INFRASTRUCTURES
A reliable electric grid is crucial to modern society in part because it is crucial to so many other critical infrastructures. These include natural gas, water, oil, telecommunications, transportation, emergency services, and banking and finance (Rinaldi et al., 2001). Without a reliable grid many of these other infrastructures would degrade, if not immediately then within hours or days as their backup generators fail or run out of fuel. However, this coupling goes both ways, with the reliable operation of the grid dependent on just about every other infrastructure, with the strength of this interdependency often increasing. For example, PNNL (2015) gives a quite comprehensive coverage of the couplings between the grid and the information and communication technology (ICT) infrastructure. The coupling between the grid and natural gas systems, including requirements for joint expansion planning, is presented in Borraz-Sanchez et al. (2016). The interdependencies between the electric and water infrastructures are shown in Sanders (2014) with a case study for the Texas grid presented in Stillwell et al. (2011). While some of these couplings are quite obvious, others are not, such as interrelationships between the grid and health care systems in considering the vulnerability of the grid to pandemics (NERC, 2010). The rapidly growing coupling between electricity and electric vehicle transportation is presented in Kelly et al. (2015).
From the perspective of this report, focusing on the analytic foundations for the next-generation electric grid, it is perhaps best to present these infrastructure interdependencies utilizing the framework of complex adaptive systems (CASs). “Seen from this perspective, which has important benefits for modeling and analysis, each component of an infrastructure constitutes a small part of the intricate web that forms the overall infrastructures. All components are influenced by past experiences” (Rinaldi et al., 2001). The grid itself is a CAS, with the bulk of the report focused on its specific research needs. Including other infrastructures could increase complexity, but would remain a CAS. The degree to which the coupled infrastructures need to be accounted for in the foundational electric grid research considered here is problem specific and depends on many different factors. Hence consideration of coupled infrastructures is implicit in what is proposed in this report. For example, as shown in Kelly et al. (2015), electric vehicles can interact with the grid on time scales ranging from short-term transient stability (referring back to Figure 1.4), when the impact of battery dynamics is considered to decades, when their impact is factored into long-range generation and transmission system planning. The same could be said for the ICT (PNNL, 2015). In contrast, the coupling with water would not apply on the millisecond time frame but would be important over days if generation dispatches needed to be curtailed and over decades for planning (Sanders, 2014, and Stillwell et al., 2011). Hence for some problems, coupled infrastructure consideration would relate directly to Recommendations 5, 6, and 7. An example of how the natural gas infrastructure couples to the electric infrastructure in optimizations is given in Borraz-Sanchez et al. (2016), directly relating to Recommendation 8. Coupled infrastructure simulations will benefit from the synthetic data libraries called for in Recommendation 9, and from the software called
for in Recommendation 10, both of which are in Chapter 8. Finally, the consideration of the coupling of the grid with other infrastructures plays a large role in Recommendation 11, also from Chapter 8.
Understanding the effects of these connections between different infrastructures will require answering even more complex versions of the mathematical and computational questions discussed throughout this report, whose applicability goes far beyond the grid. Chapter 3, “Existing Analytic Methods and Tools,” and Chapter 4, “Mathematical Research Areas Important for the Grid,” summarize some of the most important mathematical and analytical tools that can be applied to such systems, where progress would carry over to other infrastructures.
For example, models that represent coupling between the grid and gas, water, transportation, or communication will almost certainly include hierarchical structures characterized by a mixture of discrete and continuous variables whose behavior follows nonlinear, nonconvex functions at widely varying time scales. This implies that new approaches for effectively modeling nonlinearities, formulating nonconvex optimization problems, and defining convex subproblems would be immediately relevant when combining different infrastructures.
One of the foundations of this report is that mathematics can be used to describe and solve problems from significantly different application domains. In this spirit, the discussion in Chapter 7, “Case Studies,” concerning high-impact, low-frequency events stresses the importance of interdisciplinary modeling, noting that these events have commonalities that could be addressed by research in the mathematical and computational areas discussed in this report.
REFERENCES
Agrawal, R., and R. Srikant. 1994. Fast algorithms for mining association rules in large databases. Pp. 487-499 in VLDB ’94 Proceedings of the 20th International Conference on Very Large Data Bases. Morgan Kaufmann Publishers, San Francisco, Calif.
Anjos, M.F., and J.B. Lasserre (eds.). 2012. Handbook on Semidefinite, Conic, and Polynomial Optimization. International Series in Operations Research and Management Science. Springer, New York, N.Y. http://www.springer.com/us/book/9781461407683.
Ben-Tal, A., and A. Nemirovski. 2000. Robust solutions of linear programming problems contaminated with uncertain data. Mathematical Programming 88(3):411-424.
Bertsimas, D., D.B. Brown, and C. Caramanis. 2011. Theory and applications of robust optimization. SIAM Review 53(3):464-501.
Bienstock, D. 2013. Progress on solving power flow problems. OPTIMA Mathematical Optimization Society Newsletter 93, December. http://www.mathopt.org/Optima-Issues/optima93.pdf.
Bienstock, D., M. Chertkov, and S. Harnett. 2014. Chance-constrained DC-OPF. SIAM Review 56(3):461-495.
Borden, A.R., D.K. Molzahn, P. Ramanathan, and B.C. Lesieutre. 2012. Confidentiality-preserving optimal power flow for cloud computing. Pp. 1300-1307 in 2012 50th Annual Allerton Conference on Communication, Control, and Computing. doi:10.1109/Allerton.2012.6483368.
Borraz-Sanchez, C., R. Bent, S. Backhaus, S. Blumsack, H. Hijazi, and P. van Hentenryck. 2016. Convex optimization for joint expansion planning of natural gas and power systems. 49th Hawaii International Conference on System Sciences (HICSS).http://public.lanl.gov/rbent/hicss2016.pdf.
Coffrin, C., H.L. Hijazi, and P. Van Hentenryck. 2015. “The QC Relaxation: Theoretical and Computational Results on Optimal Power Flow.” Optimization Research Group, Australian National University. http://arxiv.org/pdf/1502.07847.pdf.
Crow, M.L., and J.G. Chen. 1994. The multirate method for simulation of power system dynamics. IEEE Transactions on Power Systems 9(3):1684-1690.
Dobson, I., and H.-D. Chiang. 1989. Towards a theory of voltage collapse in electric power systems. Systems and Control Letters 13(3):253-262.
EPRI (Electric Power Research Institute). 2009. Technology Assessment of Power System Visualization. Product Abstract 1017795. December. http://www.epri.com.
Erdogan, E., and G. Iyengar. 2006. Ambiguous chance constrained problems and robust optimization. Mathematical Programming Series B 107:37-61.
Fienberg, S.E. 2006. Privacy and confidentiality in an e-commerce world: Data mining, data warehousing, matching and disclosure limitation. Statistical Science 21(2):143-154.
Hines, P., S. Blumsack, E. Cotilla Sanchez, and C. Barrows. 2010. The topological and electrical structure of power grids. Pp. 1-10 in 2010 43rd Hawaii International Conference on System Sciences (HICSS). doi:10.1109/HICSS.2010.398.
ICSEG (Illinois Center for a Smarter Electric Grid). 2015. “Power Flow Cases.” http://publish.illinois.edu/smartergrid/power-cases/. Accessed September 15, 2015.
ICSU (International Council for Science). 2014. “Open Access to Scientific Data and Literature and the Assessment of Research by Metrics” (ICSU Report on Open Access). News from the 31st ICSU General Assembly. http://www.icsu.org/general-assembly/news/.
Kantz, H., and T. Schreiber. 2004. Nonlinear Time Series Analysis. 2nd ed. Cambridge University Press, U.K.
Kelly, J.C.,T. Ersal, C.-T. Li, B.M. Marshall, K. Soumya, G.A. Keoleian, P. Huei, I.A. Hiskins, and J.L. Stein. 2015. Sustainability, resiliency, and grid stability of the coupled electricity and transportation infrastructures: Case for an integrated analysis. Journal of Infrastructure Systems 21(4).
Kezunoic, M., and Y. Guan. 2009. Intelligent alarm processing: From data intensive to information rich. 42nd Hawaii International Conference on System Sciences, 2009. HICSS ‘09. doi:10.1109/HICSS.2009.268.
Lavaei, J., and S.H. Low. 2012. Zero duality gap in optimal power flow problem. IEEE Transactions on Power Systems 27(1):92-107.
Low, S. 2014a. Convex relaxation of optimal power flow, Part I: Formulations and equivalence. IEEE Transactions on Control of Network Systems 1:15-27.
Low, S. 2014b. Convex relaxation of optimal power flow, Part II: Exactness. IEEE Transactions on Optimal Control of Network Systems 1:177-189.
Nemirovski, A., and A. Shapiro. 2006. Convex approximations of chance constrained programs. SIAM Journal on Optimization 17:969-996.
NERC (North American Electric Reliability Corporation). 2010. High-Impact, Low-Frequency Event Risk to the North American Bulk Power 2992 System. June. http://www.nerc.com/pa/CI/Resources/Documents/HILF%20Report.pdf.
Panteli, M., and D.S. Kirschen. 2015. Situation awareness in power systems: Theory, challenges and applications. Electric Power Systems Research 122:140-151.
Phipps, E., R. Casey, and J. Guckenheimer. 2006. Periodic orbits of hybrid systems and parameter estimation via AD. Lecture Notes in Computational Science and Engineering 50:211-224.
PNNL (Pacific Northwest National Laboratory). 2015. The Emerging Interdependence of the Electric Power Grid and Information and Communication Technology. PNNL-24643. August. http://www.pnnl.gov/main/publications/external/technical_reports/PNNL-24643.pdf.
Rinaldi, S.M., J.P. Peerenboom, and T.K. Kelly. 2001. Identifying, understanding and analyzing critical infrastructure interdependencies. IEEE Control Systems Magazine, December. pp. 11-25.
Sanders, K.T. 2014. Critical review: Uncharted waters? The future of the electricity-water nexus. Environmental Science and Technology 49:51-66.
Stillwell, A.S., C.W. King, M.E. Webber, I.J. Duncan, and A. Hardberger. 2011. The energy-water nexus in Texas. Ecology and Society 16(1).
Wang, Z., A. Scaglione, and R.J. Thomas. 2010a. Generating statistically correct random topologies for testing smart grid communication and control networks. IEEE Transactions on Smart Grid 1(1):28-39.
Wang, Z., A. Scaglione, and R.J. Thomas. 2010b. The node degree distribution in power grid and its topology robustness under random and selective node removals. 2010 IEEE International Conference on Communications Workshops (ICC). doi:10.1109/ICCW.2010.5503926.
Wang, Z., A. Scaglione, and R.J. Thomas. 2012. Electrical centrality measures for power grids. Chapter 12 in Control and Optimization Theory for Electric Smart Grids (M. Ilic and A. Chakrab, eds.). Springer,New York, N.Y.
Zimmerman, R.D., C.E. Murillo-Sanchez, and D. Gan. 2011. MATPOWER: Steady-state operations, planning and analysis tools for power systems research and education. IEEE Transactions on Power Systems 26(1):12-19.


