


Below is the uncorrected machine-read text of this chapter, intended to provide our own search engines and external engines with highly rich, chapter-representative searchable text of each book. Because it is UNCORRECTED material, please consider the following text as a useful but insufficient proxy for the authoritative book pages.
66 4 Project Data Analyses 4.1 Overview of Analysis Approach and Model System This chapter presents the statistical analyses of crash and crash-related data that were carried out during NCHRP project 17-23. This research represents the major portion of the projectâs efforts, and is a significant contribution to current scientific knowledge about motor vehicle crashes and factors that affect them. As will be seen, analyses were carried out in a number of different research areas. In very general terms, the strategy for the overall research effort was based a high-level framework identifying the relationships between driver speed choice behavior, crash occurrence and or crash severity. These relationships are summarized in the following diagram: Figure 4-1 â A System of Sequential Regression Models The ultimate goal of the projectâs research strategy was to clarify these various relationships and make them specific. The boxes in this diagram are intended to represent generic relationships between their inputs and outputs. Indeed, as will be seen below, during the course of the research a number of different specific models were developed and investigated for each of the boxes. Similarly, the inputs and outputs shown in the diagram should be understood as generic variable types; again, the different models developed during the project varied considerably in their specific inputs and outputs, with data availability frequently being the most significant constraint in determining which variables to include. As can be seen from the diagram, the intent of the project was not to develop a single model that attempts to capture all the logical connections between crashes and their causes, but rather a system of inter-related models, each of which captures some part of the causal relations linking contributing factors and crash consequences. The inter-relationships between models mean that the outputs of one model in the system may be input to another model. For example, it is logical to think that the average speed and speed variability output by the speed choice model should be included among the inputs to the crash occurrence model; and that the average speed should be Traffic Detector Data HSIS Data Speed = f(Speed Limit, Road Geometry, etc. â¦) Crash Freq. = g(Speed, Speed Limit, Road Geometry, etc. â¦) Crash Severity = h(Speed, Speed Limit, Road Geometry, Veh. & Occ. Chars., etc. â¦) NASS CDS Data
67 one of the inputs to the injury and crash severity model. Similarly, the crash occurrence model produces some measure of the incidence of crashes by type, and this should logically feed into the model that predicts a more detailed distribution of injury and crash severities. With respect to the speed choice model, many of the factors that influence a roadwayâs traffic speed characteristics have been known for some time. The speed choice modeling work conducted in this project was designed to build on this prior understanding, but to place particular emphasis on the role of speed limits as they affect roadway speed characteristics. Moreover, the analysis work was planned to focus not only on average vehicle speeds, but also on vehicle speed variability, in order to be able to address the issues raised by the âvariance killsâ and similar hypotheses. Different models that were developed used different definitions of variability, depending on the nature of available measurements. With respect to the crash occurrence model, one of the projectâs objectives was to investigate the influence of average speed and speed variability on the likelihood of crashes, either in total or distinguished by crash or injury severity. The hypothesis was that speed limits affect crash occurrence primarily through their effect on driver speed choices. The project was also interested in a variety of driver, roadway and environmental characteristics that may also affect crash likelihood. The crash severity model differs from the crash occurrence model in that it predicts the distribution of crashes (or equivalently crash counts or rates) by crash or injury severity, given that a crash has already occurred. This model is not concerned with predicting the probability of crashes per se. Other factors that may influence the distribution of injury and crash severities are average speed (from the speed choice model), environmental characteristics, and vehicle characteristics, among others. The process generally followed by the project was to identify, investigate and/or prepare datasets suitable for the estimation of the various model types; and then to specify, estimate and assess one or more models from each dataset. It should be remembered that statistical relationship does not imply causality. Good model estimation results do not mean that the modeled phenomenon is caused by the âexplanatoryâ variables, only that there is a statistical connection between them. Care must be taken to avoid drawing unwarranted conclusions about causality from modeling results. Terms such as âeffectâ or âimpactâ should be understood in the sense of association rather than causation. As mentioned before, the availability of suitable data was the element that most determined the types of models that could be developed and the projectâs approach for developing them. Very specifically, the general lack of disaggregate speed data (i.e., speed measurements of individual vehicles, or of small groups of vehicles at very short time aggregations) for a wide variety of roadway segments over time (both before and after the speed limit changes) strongly influenced the nature of the speed choice models that were developed, and this in turn had repercussions on the development of the other models. In other cases, data were available to support the estimation of particular models, but the estimated models themselves were for various reasons judged to be unsatisfactory.
68 These data limitations, and the modeling problems that they created, ultimately constrained the extent to which the project could fill in and elaborate on the complete framework diagrammed above. It did not prove possible, using only the statistically valid models that resulted from the individual analyses, to construct a full model system incorporating all the hypothesized causal chains between speed limits and crash occurrence and severity. Nonetheless, as will be seen, the individual models that resulted from the development and assessment process, and the portions of the model system that they cover, do provide significant insights into the effects of speed limit changes, and into the factors that are associated with crash occurrence and severity. These insights, in turn, can be brought to bear on the central question of the project â the safety effects of speed limit changes on high-speed roads. This is done in Chapter 5. The remainder of this chapter discusses in turn speed choice models (section 4.2), crash occurrence models (section 4.3), and crash and injury severity models (section 4.4). The chapter closes with a summary and discussion of the technical conclusions drawn from these analyses (section 4.5). 4.2 Speed Choice Models The average speed chosen by drivers in a particular set of circumstances, and the variability of speed around this average, are key factors that influence crash probability and severity. Driver speed choice behavior is affected by posted speed limits, as well as by a wide variety of other factors related to the driver, the vehicle, the roadway and the roadway environment. There are various types of data about driver speed choice behavior: the self-reported or observed behavior of individual drivers, results from theoretical models of speed choice behavior, and observations of the aggregate speed characteristics of a traffic stream. A number of different analyses of speed-related driver behavior were conducted, using most of these data types and applying a variety of analysis methods. These analyses included: ⢠An investigation of the determinants of highway driving speeds reported by respondents in the 2000 Motor Vehicle Occupant Safety Survey (section 4.2.1); ⢠A study of the average speed and speed variability on freeways in Orange County, California (section 4.2.2); ⢠An analysis of speed choices on highways in Austin, Texas (section 4.2.3); ⢠An ARIMA intervention analysis of the speed impacts of speed limit changes on highways in Washington State outside the northwest region (section 4.2.4); and ⢠Development of a theoretical model of rational speed choice, and numerical investigation of some of its properties (section 4.2.5). Discussions of a number of other project speed choice analyses have been relegated to the appendices. These include analyses for which the limitations of the available data did not allow satisfactory conclusions to be drawn, and detailed technical descriptions of the methods used in some analysis components. Speed choice analysis material in the appendices includes:
69 ⢠A description of the procedures used to estimate speed variables from Orange County traffic detector data (Appendix C); ⢠An analysis of speed choice in Washington State (Appendix D); ⢠An explanation of the methods applied to generate the synthetic datasets that were used to estimate the rational speed choice model (Appendix E). 4.2.1 Highway Driving Speeds Reported in the MVOSS The 2000 Motor Vehicle Occupant Safety Survey (MVOSS) was conducted between November 2000 and January 2001, using random digit dialing and telephone interviews of persons age 16 or older residing in all 50 U.S. states and Washington D.C. (Boyle and Schulman 2001). The survey questions emphasized traffic safety issues, including crash exposure, travel choices (such as usual driving speed, driving frequency, seat belt use), and attitudes towards driving and current speed limits. Responses were obtained from 6,072 persons, and included basic demographic information about the respondent, as well as information about the type of vehicle that the respondent usually drove. The project analyzed the 2000 MVOSS to obtain information about variables that may be important in influencing driver speed choice. 4.2.1.1 Data Preparation After removing observations that lacked responses for key variables, the sample was reduced to complete records for 4,136 persons. Household income, which was categorized by value range in the original dataset, was converted into approximately continuous values using individual range mid-values. Basic information about the data available from this survey is shown in Table 4-1. Table 4-1 â Summary Statistics of 2000 MVOSS Data Variables Descriptions Mean Respondent Characteristics Age Respondent age (years) 42.35 Income Household income (in year 2000 US $) 54,851 Male 1 = male; 0 = female 0.5051 Hispanic 1 = Hispanic or Latino; 0 = otherwise 0.0897 Married 1 = married; 0 = otherwise: divorced, widowed, etc. 0.6368 College Educated 1 = possess a college education or higher; 0 = otherwise 0.6002 Employed 1 = employed or self-employed; 0 = otherwise 0.7123 Indicator for Central City 1 = living in a central city; 0 = otherwise 0.2671 Vehicle Characteristics Indicator for Passenger Car 1 = usually drive a passenger car 0.6057 Indicator for Van 1 = usually drive a van or minivan 0.0916 Indicator for Pickup 1 = usually drive a pickup truck 0.1655 Indicator for SUV 1 = usually drive an SUV 0.1142 Indicator for Heavy Truck 1 = usually drive a heavy truck 0.0138
70 Variables Descriptions Mean Indicator for Other Vehicle 1 = usually drive other vehicles (i.e., not above vehicle types) 0.0039 Responses Driving Frequency 0 = drive a few days a month or a year (2.38%); 1 = drive a few days every week (9.37%); 2 = drive every day or almost every day (88.25%) 1.859 Seatbelt Frequency 0 = use seat belt rarely or never (1.80%); 1 = use seat belt some of the time (4.10%); 2 = use seat belt most of the time (9.52%); 3 = use seat belt all of the time (82.53%) 2.707 Seatbelt Law Support 0 = do not favor seat belt law at all (12.20%); 1 = favor seat belt law some (20.23%); 2 = favor seat belt law a lot (67.57%) 1.554 Speed Limit Support 0 = speed limits are too low (14.45%); 1 = speed limits are about right (77.37%); 2 = speed limits are too high (8.18%) 0.937 Opinion of Other Drivers 0 = other drivers are poor drivers (21.59%); 1 = other drivers are fair drivers (43.14%); 2 = other drivers are good drivers (30.09%); 3 = other drivers are excellent or very good drivers (5.19%) 1.189 Pressure to Exceed Speed Limit 0 = never feel pressure to exceed the speed limit (18.35%); 1 = rarely feel pressure to exceed the speed limit (30.32%); 2 = often feel pressure often to exceed the speed limit (34.91%); 3 = very often feel pressure to exceed the speed limit (16.41%) 1.506 Pass More 1 = I pass others more often than they pass me (31.98%) 0.3198 Pass Same 1 = I pass others as often as others pass me (2.66%) 0.0266 More Pass 1 = others pass me more often than I pass them (59.61%) 0.5961 Neither Pass 1 = neither (3.88%) 0.0388 Speed on Highway Usual driving speed on highways (miles per hour) 64.48 Stopped by Police 1 = have been stopped by police in the last 12 months while driving 0.1893 Recent Traffic Ticket 1 = have received a ticket by police in the last 12 months while driving 0.1003 Drinking Days Number of drinking days in the past 30 days 3.6649 Number of Drinks Average # drinks per drinking day 1.609 Drinking and Driving Days Number of drinking-and-driving days in the past 30 days 0.5091 Injured in Crash 1 = have been injured in a crash (as a driver, occupant or non-occupant) 0.2953 Injured as Driver 1 = have been injured as a driver at some point in the past 0.2542 Number of Injury Events Number of times having been injured in a crash (as a driver, occupant or non-occupant) 0.4444 It can be seen that several of the MVOSS variables involve responses to questions about personal preferences (e.g., support for seat belt laws) and sensitive behaviors (e.g., number of drinking days per month and speed choice). For a variety of reasons, the responses given to such questions may not accurately reflect the respondentâs actual opinion or behavior. (Corbett [2001] and Bradburn and Sudman [1979] discuss these issues and their treatment in survey design.) Such effects can bias the reported survey results (e.g., biasing downward the estimates of
71 drinking and driving, and upward the estimated level of support for speed laws14) and affect conclusions drawn from analyses of the data. The possibility of such biases must be kept in mind when using this data source. 4.2.1.2 Model Estimation and Analysis Table 4-2 presents estimation results for an ordinary linear regression model of the reported usual highway driving speeds as a function of some of the explanatory variables available in the MVOSS dataset. The table presents an initial model that includes all the variables considered, as well as a final model that incorporates only those variables for which the coefficient estimates were found to be statistically significant at the p=0.10 level. As can be seen, individualsâ the usual highway driving speeds that individual report are predicted to increase with household income, drinking amount and frequency, recent traffic violations and recent experiences with roadway police. Male drivers, drivers with a college education, frequent drivers and drivers in central cities also tend to drive at higher speeds. Age and employment status are estimated to reduce chosen driving speeds. Note that the MVOSS asks respondents about the total income of their household rather than their individual income or wage. Interestingly, the modelâs linear plus quadratic household income terms show that the influence of household income on speed choice reaches a maximum at around $130,000 per year (in year 2000 dollars). One may hypothesize that higher values of travel time, due to higher wages and income, result in higher speed choices. Of course, such travel time values may also result in higher values of life, thus offsetting value of time effects to some extent. Figure 4-2 illustrates relationships between driver characteristics (including gender, household income and residence location) and the predicted usual highway driving speed. Table 4-2 â Linear Regression Model of Usual Driving Speed Initial Model Final Model Variables Coeff. Std.Err. P-value Coeff. Std.Err. P-value Constant 64.0581 1.0677 0.0000 63.3613 0.7546 0.0000 Male 0.8307 0.2361 0.0004 0.8541 0.2198 0.0001 Age -0.0846 0.0402 0.0355 -0.0419 7.839E-03 0.0000 Age Squared 0.0004 4.241E-04 0.3051 Hispanic -0.7401 0.3778 0.0501 -0.7340 0.3752 0.0504 Married 0.3063 0.2501 0.2206 College Educated 1.1610 0.2324 0.0000 1.1627 0.2288 0.0000 Employed -0.6430 0.2769 0.0202 -0.7075 0.2589 0.0063 Income 5.076E-05 1.269E-05 0.0001 5.203E-05 1.233E-05 0.0000 Income Squared -2.020E-10 8.358E-11 0.0156 -2.090E-10 8.210E-11 0.0109 Indicator for Central City 1.3391 0.2430 0.0000 1.3134 0.2405 0.0000 14 For example, 82.5% of MVOSS respondents reported that they used their vehicle shoulder belt all of the time, and 9.5% reported that they used the belt most of the time. In contrast, NHTSAâs (2001) National Occupant Protection Use Survey staff found that only 69% to 76% of adults (across several age categories) were wearing shoulder belts at 12,000 intersections during daylight hours in the year 2000.
72 Indicator for Van -0.2913 0.3771 0.4399 Indicator for Pickup -0.3052 0.3138 0.3307 Indicator for SUV -0.0861 0.3485 0.8048 Indicator for Heavy Truck -0.4012 0.9354 0.6680 Indicator for Other Vehicle -1.8403 1.7131 0.2827 Driving Frequency 1.5182 0.2791 0.0000 1.4622 0.2775 0.0000 Seatbelt Frequency 0.1495 0.1584 0.3451 Seatbelt Law Support -0.3040 0.1653 0.0660 Speed Limit Support -1.3052 0.2392 0.0000 -1.3743 0.2369 0.0000 Opinion of Other Drivers -0.0023 0.1304 0.9859 Pressure to Exceed Speed Limit 0.3690 0.1134 0.0011 0.3594 0.1123 0.0014 More Passed -4.5112 0.2541 0.0000 -4.5226 0.2515 0.0000 Neither Pass -2.4872 0.5673 0.0000 -2.5151 0.5635 0.0000 Pass Same -1.9408 0.6644 0.0035 -1.8567 0.6620 0.0050 Stopped by Police 0.9788 0.3818 0.0104 0.9598 0.3773 0.0110 Recent Traffic Ticket 0.8391 0.4901 0.0869 0.8827 0.4855 0.0690 Drinking Days 0.0285 0.0188 0.1304 0.0328 0.0175 0.0604 Number of Drinks 0.2796 0.0656 0.0000 0.2881 0.0648 0.0000 Drinking and Driving Days 0.0375 0.0528 0.4776 Injured in Crash 0.8872 0.5734 0.1218 Injured as a Driver -0.7707 0.5630 0.1710 Number of Injury Events -0.0924 0.1511 0.5409 Nobs. 4136 4136 R-sqrd. 0.2278 0.2258 Adj. R-sqrd. 0.2218 0.2224 Note: Some coefficient estimates were omitted to simplify the presentation here. See Kweon and Kockelman (2003a) for further details. 64 65 66 67 68 69 70 71 10 20 30 40 50 60 70 80 90 100 Age (years) S pe ed o n H ig hw ay s (m ph ) female $50k centcity female $50k non-centcity female $100k centcity female $100k non-centcity male $50k central city male $50k non-centcity male $100k central city male $100k non-centcity Figure 4-2 â Usual Driving Speed vs. Driver Characteristics Note: The reference individual is non-Hispanic, married, college-educated, and employed, and exhibits average values of all other explanatory variables included in the final model of Table 4-2.
73 The MVOSS also included questions regarding respondentsâ attitudes about the appropriateness of the current level of speed limits (i.e. whether they were too low, too high or about right). It was found that 76.6% of the respondents were satisfied with current speed limits, 16.2 % felt they were too low, and 7.2% thought they were too high. The project analyzed the responses to these questions as well, and developed an ordered probit model of opinion regarding higher speed limits as a function of respondent characteristics. This analysis is presented in Appendix B. Other results and conclusions derived from the MVOSS dataset can be found in Kweon and Kockelman (2003a). 4.2.2 Speed Choice on Orange County Freeways Using the Traffic Accident Surveillance and Analysis System (TASAS) database maintained by the California Department of Transportation, Golob and Recker (2002) acquired crash data for 9,341 crashes (around 78% of the total) on six freeways (I-5, SR-22, SR-55, SR-57, SR-91 and I- 405) in Orange County in 1998. Golob and Recker then merged the data on each crash with traffic data from the nearest two upstream and two downstream single-loop traffic detector stations during a period from 30 minutes before to 15 minutes after the reported crash time. Each detector station produced measurements of count and occupancy data by direction and lane, accumulated and output at 30-second intervals. Golob and colleagues have used essentially this dataset to create a typology of traffic crashes related to traffic flows and detector occupancies, weather and lighting conditions (Golob and Recker 2002; Golob and Recker 2003; Golob, Recker, and Alvarez 2003a; and Golob, Recker, and Alvarez 2003b). Their work relies on cluster analysis, and speeds play only a minor role. These researchers kindly granted the project access to the dataset that they compiled. The dataset was particularly interesting for the purposes of this project because of its inclusion of relatively detailed traffic data near the location of and around the time of reported crashes. 4.2.2.1 Data Preparation The project focused on injury and fatal crashes in January 1998. From the database for these crashes, traffic data from detector stations within 2,000 feet (almost one-half mile) upstream of each crash site15 was extracted. Traffic data for the 30 minutes prior to the reported crash time was considered. However, since the actual time of a crash is usually not precisely known, traffic data recorded in the 2.5 minutes prior to reported crash times was discarded, consistent with Golob and Recker (2002), who did so as well. In this way, data on 55 crashes were obtained. Although the dataset did not include vehicle speeds, these can be estimated from the outputs of a single-loop detector through a calculation that involves a parameter known as the g-factor, which is the inverse of the mean effective length of vehicles activating the detector. A vehicleâs effective length accounts for its true vehicle length plus an additional length due to the fact that a loopâs detection zone extends beyond its actual physical extent. G-factors can be empirically 15 A distance of 2,000 feet was chosen since, at speeds of 60 mi/h, vehicles could reach the crash site within 30 seconds. It is expected that traffic conditions so close to the crash sites will be a reasonable reflection of traffic conditions at the crash site itself.
74 determined for a given loop detector and traffic mix, but this level of information was not available to us. A reasonable value for the mean effective vehicle length was assumed based on g-factor values reported in Jia et al. (2001), and the average speed of vehicles using each lane in each 30-second interval was thereby estimated. Speed standard deviations were estimated by assuming that speed distributions are stationary across each set of five successive 30-sec intervals and assessing the variation in these 30-sec samples. In reality, speed profiles change over time, and so these assumptions lead to standard deviation estimates that are biased upwards. However, there is no other way to uncover speed variation information for individual vehicles when the individual vehicle data are lost during the 30-sec data accumulation by the detector algorithms. This is the best that the project feels can be done with such data.16 A detailed description of the projectâs methods for computing average speed and speed standard deviation is provided in Appendix C. Using short-duration measurements from radar guns, the project also obtained and analyzed individual vehicle speed data for several highways in Austin, Texas, as described in Section 4.2.3. The computation of speed standard deviation results in the loss of the first two observations for each lane at each station. As a result, the data for the models of speed and speed variation consisted of 53 sequential 30-second observations from loop detector stations within 2000 feet upstream of the 55 crash sites. After removing approximately 2% of observations affected by incomplete traffic recordings, 2,858 30-second observations from loop detector stations were left. Each such observation was assumed to apply over the road segment on which the station was located. Since the project was interested in within-lane as well as segment-specific speed information, two sets of data were compiled: one that was segment specific and reflected conditions across all lanes at a detector station, and the other that was lane-specific. The latter contained over 12,000 observations, and included each stationâs detector outputs for each of three or more lanes per direction. To identify lane-specific data, variables indicating the number of lanes and the lane position (e.g., inside, next to inside, middle lane) were appended. The crash dataset provided information on lighting and other environmental conditions. While the speed limits of all the segments were 65 mi/h, there was some variation in their design speeds, as provided in the California HSIS dataset. Table 4-3 presents summary statistics for the segment-specific variables that were used in the analyses, while Table 4-4 presents these statistics for the lane- specific variables. Table 4-3 â Summary Statistics of Segment-Level Variables in the Orange County Dataset Variables Description Min. Max. Mean Std. Dev. SDSXNSPD Std. deviation of speed across & within lanes (30-sec) 0 123.28 10.83 10.02 SDLNS Std deviation of speed across lanes (30-sec) 0 107 7.88 9.88 VBARSXN Average vehicle speeds across lanes (30-sec) 0 123.06 42.89 22.05 TMTLCRSH The time of crash minus the time of the observation (sec) 120 1680 900.08 458.94 FOURLN 1 if the roadway has 4 lanes per direction, 0 otherwise 0 1 0.44 0.50 16 The project reviewed much literature on the aggregation of traffic data (e.g., Pushkar et al. 1994, Wang and Nihan 2000, Coifman et al. 2001, Coifman 2001, and Hellinga 2002). No better solution was found than the one that the project developed.
75 ABVFOUR 1 if the roadway has more than 5 lanes per direction, 0 otherwise 0 1 0.39 0.49 DUSKDAWN 1 if crash occurred during dusk or dawn, 0 otherwise 0 1 0.02 0.14 DARKSTRL 1 if crash occurred at night with street light, 0 otherwise 0 1 0.19 0.39 DARKNOSL 1 if crash occurred at night without street light, 0 otherwise 0 1 0.30 0.46 WET 1 if crash occurred when the roadway was wet, 0 otherwise 0 1 0.35 0.48 OBSTRUCT 1 if crash occurred when there was an obstruction on the roadway, 0 otherwise 0 1 0.02 0.14 CONSTRUC 1 if crash occurred in construction zone, 0 otherwise 0 1 0.13 0.34 CRTIME3 if TMTLCRSH <= 3 min then TMTLCRSH else 0 (min) 0 180 8.50 35.18 CRTIME5 if TMTLCRSH <= 5 min then TMTLCRSH else 0 (min) 0 300 27.77 74.43 CRTIME10 if TMTLCRSH <= 10 min then TMTLCRSH else 0 (min) 0 600 115.31 187.41 DSGN_SPD Design speed (mi/h) 60 70 69.82 1.35 VOLUME Sum of traffic counts across lanes (30-sec) 0 83 32.18 19.94 DENSITY #vehicles per lane per mile .00 144.47 23.88 21.58 VC_RATIO The ratio of traffic volume to the segment capacity .00 1.25 .47 .30 Nobs. = 2,858 Table 4-4 â Summary Statistics of Lane-Level Variables in the Orange County Dataset Variables Description Min. Max. Mean Std. Dev. SDLNSPD Std. deviation of speed within one lane (30-sec) 0 87.78 6.60 6.99 VBAR Average vehicle speeds (30-sec) 0305.05 42.72 28.71 VC_RATIO The ratio of traffic volume of a lane to the its capacity 0 1.25 0.46 0.29 VOL Traffic count for all lanes in 30-sec period 0 30 7.68 6.02 OCC Occupancy in a 30-second period 0 1 0.20 0.29 TMTLCRSH The time of crash minus the time of the observation (sec) 120 1680899.34 458.89 RGHTSIDE 1 if the lane is the far right side lane, 0 otherwise 0 1 0.23 0.42 NXT2RGSD 1 if the lane is the next-to-right-side lane, 0 otherwise 0 1 0.23 0.42 MIDDLELN 1 if the lane is the middle lane, 0 otherwise 0 1 0.13 0.34 NXT2INSD 1 if the lane is the next-to-inside lane, 0 otherwise 0 1 0.24 0.43 INSIDELN 1 if the lane is the inside lane, 0 otherwise 0 1 0.24 0.43 FOURLN 1 if the roadway has 4 lanes per direction, 0 otherwise 0 1 0.41 0.49 ABVFOUR 1 if the roadway has more than 5 lanes per direction, 0 otherwise 0 1 0.47 0.50 DUSKDAWN 1 if crash occurred during dusk or dawn period, 0 otherwise 0 1 0.02 0.13 DARKSTRL 1 if crash occurred at night with street light, 0 otherwise 0 1 0.19 0.39 DARKNOSL 1 if crash occurred at night without street light, 0 otherwise 0 1 0.32 0.47 WET 1 if crash occurred when roadway was wet, 0 otherwise 0 1 0.37 0.48 OBSTRUCT 1 if crash occurred when there was roadway obstruction,0 otherwise 0 1 0.01 0.11 CONSTRUC 1 if crash occurred in construction zone, 0 otherwise 0 1 0.14 0.34 CRTIME3 if TMTLCRSH <= 3 min then TMTLCRSH else 0 (min) 0 180 8.50 35.17 CRTIME5 If TMTLCRSH <= 5 min then TMTLCRSH else 0 (min) 0 300 27.71 74.34 CRTIME10 if TMTLCRSH <= 10 min then TMTLCRSH else 0 (min) 0 600115.73 187.69 DSGN_SPD Design speed (mi/h) 60 70 69.83 1.30 DENSITY #vehicles per lane per mile 0237.42 22.87 26.99 Nobs. = 12,243
76 4.2.2.2 Model Estimation and Analysis Using the Orange County data described above, ordinary and weighted least squares regression analyses of average speed and speed variation on the subject freeways were conducted. The tables showing regression results (Tables 4-5 through 4-8) contain both initial model and final model results. Initial models included all explanatory variables of any interest; final models retained only those variables remaining statistically significant at the p=0.10 level. Elasticity estimates are also shown for final results.17 These analyses indicate that higher speeds correspond to higher speed variability (as measured by the estimates of speed standard deviation, both within and across lanes), even after controlling for a host of factors; these relationships are apparent from the coefficients of VBAR in Table 4-5 and Table 4-7. Working with these 30-second observations, vehicle speeds or speed variation were not found to increase near the time of crash. However, much can happen in 30 seconds: a crash due to speed variation may require just two extreme vehicle speeds, the data for which can be obscured by the tens of vehicles that cross a set of lane detectors in a 30-sec interval. Table 4-5 â Linear Regression Model of Speed Variation Within Lanes Initial Model Final Model Variables Coef. S.e Std. Coef. P-value Coef. S.e. Std. Coef. P-value Elasticity CONSTANT -8.151 2.950 .006 -8.369 2.944 .004 FOURLN .873 .180 .086 .000 1.050 .117 .103 .000 0.0277 ABVFOUR -.250 .195 -.024 .199 DUSKDAWN -1.771 .342 -.053 .000 -1.751 .342 -.053 .000 -0.2563 DARKSTRL 3.059 .157 .202 .000 3.063 .157 .202 .000 0.2803 DARKNOSL .456 .121 .040 .000 .446 .120 .039 .000 0.0249 WET 1.014 .121 .093 .000 .990 .120 .091 .000 0.0399 OBSTRUCT 5.738 .478 .120 .000 5.856 .469 .123 .000 0.8642 CONSTRUC 1.257 .184 .074 .000 1.212 .180 .072 .000 0.1337 VBAR 0.0550 .004 .213 .000 0.0.46 .004 .212 .000 0.3537 RGHTSIDE 1.446 .216 .118 .000 1.593 .182 .130 .000 0.1299 NXT2RGSD 1.066 .169 .092 .000 1.167 .149 .100 .000 0.0951 MIDDLELN 1.001 .171 .071 .000 1.080 .160 .077 .000 0.1214 NXT2INSD -.617 .171 -.053 .000 -.504 .147 -.043 .001 -0.0403 INSIDELN -.587 .211 -.050 .005 -.441 .177 -.037 .013 -0.0351 DSGN_SPD .139 .042 .032 .001 .139 .042 .032 .001 1.4707 CRTIME3 4.196E-04 .002 .003 .783 CRTIME5 -4.823E-04 .001 -.007 .508 CRTIME10 3.674E-04 .000 .014 .161 DENSITY 9.462E-03 .003 .046 .003 9.551E-03 .003 .047 .003 0.0331 R-sqrd. .119 .118 Adj. R-sqrd. .117 .117 Nobs. 12,243 12,243 Dependent Variable: SDLNSPD Weighted Least Squares Regression - Weighted by VOL 17 An elasticity expresses the percentage change in a dependent variable resulting from a 1% change in an associated explanatory variable.
77 Interestingly, the DSGN_SPD variable consistently has the strongest association with all response variables studied: all elasticities were estimated to be above 1.0 even after controlling for average observed speeds in the speed variance models. Design speed is a proxy for sight distance, degree of horizontal curvature, and other design attributes on segments where design governs the safe driving speed. Design speed may also be a proxy for an upper bound on speed limits. Although speed limit data were not available in this dataset, it is reasonable to conjecture that all segments had similar posted limits since they were located on similar high-type facilities. Results in Table 4-6 suggest that higher speeds tend to occur on four-lane and five-lane (one- way) freeways more than on three-lane freeways. This is consistent with Highway Capacity Manual (TRB 2000) formulae, which indicate that free-flow speeds (FFS) rise with the number of lanes (up to a total of 5 lanes in one direction). In the Orange County model results, vehicles travel an average of 2.2 mi/h faster on four-lane compared to three-lane freeways, and vehicles on five-lane freeways travel an average 3.8 mi/h faster than those on three-lane freeways. (The corresponding estimates for basic freeway segments in HCM Chapter 23 are 1.5 and 3.0 mi/h.) While higher speeds correspond to greater speed variation, and more lanes correspond to higher speeds, the largest standard deviation in speeds is estimated to occur on four-lane sections, as implied by the coefficients on the indicator variables FOURLN and ABVFOUR in Table 4-5. It can also be seen from Table 4-5 that the highest standard deviations tend to occur in the far right-side (RGHTSIDE) lane. This makes sense, given the speed changes that many vehicles must make in right-side auxiliary lanes (particularly if on- and off-ramps are of the parallel rather than tapered type); moreover, many special, slow vehicles (such as overloaded trucks and vehicles pulling trailers) choose the far-right lane. As shown in Table 4-6, the lowest speeds tend to occur in the next-to-right-side (NXT2RGSD) lane. This may be because those lanes host a great many weaving maneuvers between on and off ramps, particularly if they lie alongside an auxiliary lane joining such facilities. As one might expect, the inside lanes have the highest average speeds (Table 4-6). The inside lane is chosen for overtaking/passing other vehicles and may be a special (e.g. HOV) lane. In addition, speeds are lowest at night on freeways where lighting is not provided; as expected, they are highest during the daytime (Table 4-6). These regression results also suggest that higher traffic density corresponds to lower average speeds (Table 4-6) and to lower overall speed standard deviations (Table 4-7), but also to higher speed standard deviations within each lane (Table 4-5). The higher within-lane speed variation result may be due to drivers having less opportunity to change lanes when traffic densities are high, while the opposite result for across-lane speed variability may result from congested conditions that create an overall stability in speeds across lanes. This result may suggest more within-lane crashes when densities are high (due to higher speed variations within lanes). Higher densities mean tighter gaps for lane changes, suggesting a potential for more crashes across lanes as well, even though speeds are relatively similar across lanes.
78 Table 4-6 â Linear Regression Model of Average Speed Within Lanes Initial Model Final Model Variables Coef. S.e. Std. Coef. P-value Coef. S.e. Std. Coef. P-value Elasticity CONSTANT 30.021 7.446 .000 29.790 7.437 .000 FOURLN 2.126 .455 .054 .000 2.156 .452 .055 .000 0.0088 ABVFOUR 3.837 .491 .097 .000 3.811 .481 .096 .000 0.0054 DUSKDAWN .566 .864 .004 .512 DARKSTRL -3.477 .396 -.059 .000 -3.516 .390 -.060 .000 -0.0497 DARKNOSL -4.730 .301 -.107 .000 -4.748 .294 -.108 .000 -0.0409 WET -4.781 .302 -.113 .000 -4.723 .288 -.112 .000 -0.0294 OBSTRUCT -9.096 1.203 -.049 .000 -9.094 1.203 -.049 .000 -0.2073 CONSTRUC -0.0514 .464 -.001 .912 RGHTSIDE -1.093 .544 -.023 .045 -1.098 .544 -.023 .043 -0.0138 NXT2RGSD -2.162 .426 -.048 .000 -2.164 .426 -.048 .000 -0.0273 MIDDLELN 1.689 .432 .031 .000 1.686 .432 .031 .000 0.0293 NXT2INSD 3.551 .431 .078 .000 3.541 .431 .078 .000 0.0438 INSIDELN 5.254 .530 .115 .000 5.247 .529 .115 .000 0.0646 DSGN_SPD .623 .106 .037 .000 .626 .106 .037 .000 1.0233 CRTIME3 -2.257E-03 .004 -.004 .557 CRTIME5 -2.777E-04 .002 -.001 .880 CRTIME10 1.687E-04 .001 .002 .799 DENSITY -.617 .005 -.780 .000 -.617 .005 -.781 .000 -0.3303 R-sqrd. .626 .626 Adj. R-sqrd. .625 .625 Nobs. 12,243 12,243 Dependent Variable: VBAR Weighted Least Squares Regression - Weighted by VOL Table 4-7 â Linear Regression Model of Variation in Average Within-Lane Speed Across All Lanes Initial Model Final Model Variables Coef. S.e. Std. Coef. P-value Coef. S.e. Std. Coef. P-value Elasticity CONSTANT 42.769 6.640 .000 42.086 6.561 .000 FOURLN -.228 .331 -.016 .492 ABVFOUR -8.178 .358 -.574 .000 -7.931 .256 -.557 .000 -0.2233 DUSKDAWN -4.047 .772 -.089 .000 -3.902 .730 -.086 .000 -0.4783 DARKSTRL .604 .355 .029 .089 .691 .342 .033 .044 0.0552 DARKNOSL 1.314 .286 .082 .000 1.315 .284 .082 .000 0.0681 WET .216 .276 .014 .433 OBSTRUCT -.889 1.075 -.014 .408 CONSTRUC -1.466 .418 -.063 .000 -1.492 .416 -.064 .000 -0.1401 VBARSXN -.135 .010 -.347 .000 -.136 .009 -.351 .000 -0.7403 DSGN_SPD -.305 .097 -.052 .002 -.296 .096 -.050 .002 -2.6231 CRTIME3 3.158E-03 .003 .016 .360 CRTIME5 -4.306E-04 .002 -.005 .794 CRTIME10 2.310E-04 .001 .006 .698 DENSITY -.169 .009 -.479 .000 -.170 .009 -.481 .000 -0.4934 R-sqrd. .368 .368 Adj. R-sqrd. .365 .366 Nobs. 2,858 2,858 Dependent Variable: SDLNS Weighted Least Squares Regression - Weighted by VOLUME
79 While design speeds do not vary much across the set of sites (almost all18 are 70 mi/h), higher design speeds are associated as expected with higher average speeds (Table 4-9), but also with higher speed standard deviations (Table 4-5). This is an interesting result: while the data are 30 sec aggregations of individual vehicle data, and the calculations applied to estimate speed variations involve some heroic assumptions, higher design speeds may be associated with more and more severe crashes through greater variation in speed choices and higher speeds. The results of Table 4-8 suggest that traffic on five-lane freeways experiences higher overall (across- plus within-lane) speed variation than traffic on three- and four-lane freeways. This may be because drivers have more freedom to choose their preferred speeds on freeways with more lanes. Road conditions and environmental variables were also found to be statistically significant explanatory variables in these models. The coefficients associated with the variable WET in Table 4-5 and Table 4-6 suggest that people drive more slowly on wet roads and with higher variations in speeds. However, the variable WET was estimated to reduce total standard deviation in speeds. The presence of obstructions tends to reduce speeds substantially but to increase speed variation. These results seem very reasonable. Table 4-8 â Linear Regression Model of Total Speed Variation Across and Within Lanes Initial Model Final Model Variables Coef. S.e. Std. Coef. P-value Coef. S.e. Std. Coef. P-value Elasticity CONSTANT -7.878 7.439 .290 -7.692 7.342 .295 FOURLN .213 .371 .013 .566 ABVFOUR 9.724 .401 .587 .000 9.610 .294 .580 .000 0.1970 DUSKDAWN -.405 .865 -.008 .639 DARKSTRL 2.500 .398 .104 .000 2.474 .383 .103 .000 0.1439 DARKNOSL .204 .320 .011 .524 WET -1.938 .309 -.111 .000 -1.999 .294 -.115 .000 -0.0546 OBSTRUCT 2.752 1.204 .036 .022 2.545 1.166 .033 .029 0.2261 CONSTRUC -3.065 .468 -.114 .000 -2.999 .454 -.111 .000 -0.2049 VBARSXN 7.995E-02 .011 .177 .000 0.0779 .010 .172 .000 0.3085 DSGN_SPD .178 .108 .026 .101 .179 .107 .026 .094 1.1542 CRTIME3 1.606E-03 .004 .007 .678 CRTIME5 2.963E-04 .002 .003 .873 CRTIME10 -5.369E-04 .001 -.012 .421 DENSITY -5.754E-02 .010 -.140 .000 -0.059 .010 -.144 .000 -0.1246 R-sqrd. .414 .413 Adj. R-sqrd. .411 .411 Nobs. 2,858 2,858 Dependent Variable: SDSXNSPD Weighted Least Squares Regression - Weighted by VOLUME 18 Rather remarkably, there were no 65 or 75 mi/h design speed sections in this dataset.
80 Table 4-9 â Linear Regression Model of Average Speed Across All Lanes Initial Model Final Model Variables Coef. S.e. Std. Coef. P-value Coef. S.e. Std. Coef. P-value Elasticity CONSTANT -70.530 13.668 .000 -71.188 13.649 .000 FOURLN 1.928 .684 .053 .005 1.719 .482 .048 .000 0.0045 ABVFOUR .204 .741 .006 .783 DUSKDAWN 1.938 1.596 .017 .225 DARKSTRL -4.522 .729 -.085 .000 -4.750 .717 -.089 .000 -0.0698 DARKNOSL -8.464 .567 -.205 .000 -8.254 .544 -.200 .000 -0.0785 WET -4.980 .562 -.129 .000 -4.811 .529 -.125 .000 -0.0332 OBSTRUCT -8.353 2.217 -.050 .000 -8.708 2.161 -.052 .000 -0.1953 CONSTRUC 1.401 .864 .023 .105 DSGN_SPD 2.081 .196 .137 .000 2.096 .196 .138 .000 3.4125 CRTIME3 -5.525E-03 .007 -.011 .438 CRTIME5 -3.259E-03 .003 -.013 .340 CRTIME10 6.444E-04 .001 .007 .601 DENSITY -.705 .012 -.776 .000 -.709 .012 -.781 .000 -0.3781 R-sqrd. .591 .590 Adj. R-sqrd. .589 .589 Nobs. 2,858 2,858 Dependent Variable: VBARSXN Weighted Least Squares Regression - Weighted by VOLUME Binomial models (coding as 1 a crash occurrence within some short time period) were also estimated to investigate the likelihood of crash occurrence as a function of the variables available in the Orange County dataset. However, crash occurrence could not be statistically related to any of the available variables. This may have been because the data aggregation obscured individual speed choices, and because the actual crash times may have differed by several minutes or more from those recorded by police officers. Thus, the time-till-crash variables (for 3, 5 and 10 minutes preceding the reported crash times) were not nearly as helpful as had originally been expected, in any of the models. 4.2.3 Speed Choice in Austin, Texas To complement the models of speed choice and speed variation that appear elsewhere in this section, a limited set of individual vehicle speed observations were collected using a radar gun on a variety of high-speed highways in Austin, Texas. As in Section 4.2.2, weighted least squares (WLS) models were developed to assess the effects of flow, number of lanes, and other variables on average speed and speed standard error.19 However, the measures of average speed and speed standard error were based here on individual vehicle measurements by the radar device, rather than on time aggregations of 30-second loop detector data. This was, in fact, the only dataset containing individual vehicle measurements that was available to the project. 19 Standard error is an estimate of the true standard deviation, involving division of observed squared deviations from the mean by n-1, where n is the number of speeds observed in the observation interval.
81 4.2.3.1 Data Preparation The data used for this analysis were collected from 16 high-speed roadway sites around the greater Austin region. Care was taken to make observations at a diverse set of sites, varying in their speed limit, number of lanes, freeway versus non-freeway status, and urban versus rural character. The observers noted as many vehicle speeds as would register on their radar gun over roughly 120 time intervals20 at each site, resulting in 1,766 observations. The interval lengths varied from 5 to 20 seconds, depending on the traffic flow at the site. Vehicle counts in each interval were totaled, and equivalent flow rate values (in units of vehicles per hour per lane) were generated. Table 4-10 provides summary statistics for the dataset of speed observations and site characteristics. It is evident that the dataset contains a good mix of explanatory variables. However, one major limitation is that the data come from a cross-section of roadways for which the speed limits did not change during the time of observation. It is not known with certainty whether, in a static situation such as this, a speed limitâs effect will be similar to its effect in a more dynamic situation where speed limits may vary over time. 4.2.3.2 Model Estimation and Analysis Weighted least squares (WLS) regression models were chosen for both the average speed and speed standard error models. The number of records read from the radar gun was used as the observation weight, because the variation in average speed should theoretically vary inversely with count, and the variation in the speed standard error should vary approximately inversely with the count. While this first relationship is well known (i.e. Var(mean(X)) = Var(X)/n), the variation in standard error calculations is less well known. This relationship can be seen as follows: Given that 2 1 ( ) Ë 1 n i i x x s n Ï = â = = â â and assuming that the x values (speeds in this context) are normally distributed, it is well known that 2 2)1( Ï sn â â¼ 2 1ânÏ where the subscript n-1 denotes the number of degrees of freedom of this chi-squared distribution. Then ( ) 2 2 2 22 2 1( ) ( ) 1 nV s E s E s E n Ï ÏÏ ââ ââ = â = â â ââ âââ â ( ) 2 2 2 2 11 n E n ÏÏ Ï â= â â The square root of a chi-squared distribution with n degrees of freedom is a chi distribution with the same degrees of freedom, denoted here as Ï n (Weisstein 2005). 20 For sites 14 through 16, fewer time intervals were observed.
82 It is also known that ( ) ( )12 1 2 1 2 n n E n Ï â âÎ +â ââ â = â âÎâ ââ â where Î(â ) denotes the gamma function (a factorial if the argument is integer). When n is reasonably large, the chi distribution is nearly the same as Normal distribution, with mean converging to 1 2 n â (Bland 2004), so ( ) 1 2n E nÏ â â Thus ( )V s ( )2 22 2 11 nEnÏÏ Ï â= â â ( ) 22 2 2 11 1 2 2 1 n n n Ï ÏÏ â ââ â â â =â ââ ââ ââ â The appropriate weight for a WLS regression of speed standard errors using radar gun data is therefore approximately ( )1n â . Table 4-11 provides WLS estimation results for both models. Five explanatory variables, including speed limit, were statistically significant in the final average speed model. Figure 4-3 presents a scatterplot of average speeds versus speed limits for all observations; a positive correlation clearly exists between these two variables. However, it can be seen from the estimation results that a change in speed limit is associated with a less than equivalent change in the average speed. For example, a 10 mi/h increase in speed limit is associated with a roughly 6.5 mi/h increase in average speed, other things equal. With respect to other explanatory variables, freeways (with more restricted access control) are estimated to exhibit an average speed 4 mi/h higher than uncontrolled access facilities, everything else constant. Wet pavement is predicted to reduce average speeds by about 3 mi/h. Higher flow rates and the presence of a downstream intersection within one-quarter mile both reduce the estimated average speed. (None of the sites had nearby upstream intersections, so the possible effects of these on speed averages or standard errors could not be analyzed.) The adjusted R2 measure of model fit is 0.64, which appears quite satisfactory but may be biased upwards since the least squares assumption of independent error terms is violated by the repeated observations. Five statistically significant explanatory variables also remain in the final specification of the WLS regression model for speed standard error. Although the presence and coefficients of the significant explanatory variables all appear reasonable, the overall quality of model fit is minimal (R2 values under 0.02). Interestingly, the results suggest that a 10 mi/h increase in speed limit reduces the standard error of speeds, but only by 0.2 mi/h. Freeways and rural facilities exhibit higher speed variations, everything else constant. The presence of a nearby downstream intersection and a greater number of lanes are predicted to increase the standard error in observed speeds, as one may expect (due to behavioral shockwaves and additional flexibility in speed choice, respectively). Wet pavement and flow rates are predicted to have no statistically significant effect on speed variation. Finally, lighting conditions are insignificant in both models; this is likely because observations were made during daylight and dusk, but not at night.
83 Although the models developed here are somewhat limited by their reliance on a relatively small dataset collected in a single region during a single month, and by the fact that the analysis does not account for the panel nature of the data, these findings are still valuable because of their use of individual vehicle speed measurements, and helpful in providing a sense of how speed limits influence speed conditions on high-speed roads. Speed Limit (mph) 8070605040 Av er ag e Sp ee d (m ph ) 90 80 70 60 50 40 30 Figure 4-3 â Average Vehicle Speeds vs. Speed Limits in Austin, Texas Table 4-10 â Summary Statistics for Austin Speed Data Variable Statistics Variable Name Variable Description Min Max Mean Std. Dev. INTERVAL Detection interval (sec) 5 20 12.39 4.82 AVGSPD Average speed observed during each interval (mi/h) 35.1 82 57.32 6.91 SPDVAR Standard error of speeds during interval (mi/h) 0.55 14.98 4.24 1.82 DAYTIME 1 if observed during daylight; 0 at dusk 0 1 0.864 0.343 URBAN 1 if the section is in an urban area; 0 otherwise 0 1 0.339 0.474 DRY 1 if the pavement is dry; 0 otherwise 0 1 0.864 0.343 INTERSXN 1 if there is a downstream intersection within 0.25 mile; 0 otherwise 0 1 0.241 0.428 #LANES Number of lanes total (in both directions) 4 8 5.403 1.600 FLOW Equivalent hourly lane flow volume (veh/h/lane) 180 2880 1107 463.7 SPDLIMIT Speed limit (mi/h) 50 70 60.43 6.061 FREEWAY 1 if the section is on a (controlled access) freeway; 0 if on a highway 0 1 0.581 0.494
84 Table 4-11 â WLS Model Results for Austin Speed Data Y = Average Speed Y = Speed Standard Error Initial Model Final Model Initial Model Final Model Variable coef. t. stat. coef. t. stat. coef. t. stat. coef. t. stat. (Constant) 14.606 9.54 15.196 12.05 5.455 8.21 4.703 8.67 DAYLIGHT -0.252 -0.7 --- --- -0.175 -1.12 --- --- URBAN 0.442 1.01 --- --- -0.519 -2.74 -0.346 -2.44 DRY 2.841 8.96 2.702 10.45 -0.217 -1.58 --- --- INTERSXN -2.386 -8.44 -2.369 -8.96 0.493 4.02 0.517 4.75 #LANES -0.167 -1.36 --- --- 0.17 3.19 0.118 2.78 FLOW -9.92E-04 -4.07 -1.01E-03 -4.32 -9.58E-05 -0.91 --- --- SPDLIMIT 0.677 24.13 0.651 32.7 -3.08E-02 -2.53 -2.09E-02 -1.94 FREEWAY 3.547 10.8 3.793 16.08 0.418 2.93 0.295 2.36 R-sqrd. 0.646 0.645 0.018 0.016 Adj. R-sqrd. 0.644 0.644 0.014 0.013 Note: Nobs = 1,766; WLS weights = counts 4.2.4 Speed Limit Change Intervention Analysis in Washington State Washington State is one of the nine states included in the Highway Safety Information System (HSIS), a multi-state database sponsored by the Federal Highway Administration that contains crash, roadway inventory and traffic volume information. States are selected to be part of the HSIS on the basis of the diversity, quantity and quality of the data that they regularly collect, and their ability to merge data of different types and disparate sources. Washington State became part of the HSIS in 1995. In addition, Washington State DOT (WSDOT) operates an extensive set of permanent traffic recorders (PTRs), and maintains historical archives of detailed traffic data measurements from these stations. These two factors made Washington State a particularly interesting source of crash-related data for project analyses. 4.2.4.1 Data Preparation The project obtained WSDOT traffic data for areas outside of the northwest Washington region including Seattle from Jim Hawkins (in the Stateâs Transportation Data Office, Highway Usage Branch) and his staff. Using crash milepost data, the 1996 HSIS crash observations were
85 situated with respect to the stateâs 149 PTR locations21 in order to identify a set of detector stations from which to request data. Since the WSDOT traffic data take significant time and effort for staff to assemble, the project wanted to limit its request to relevant stations. Table 4-12 shows how many crashes can be linked to PTR stations within given distances of the crash site. Among the 42,141 crashes in the 1996 HSIS dataset, 23.4% (9,849 cases) occurred within 3 miles of a PTR, 17.2% occurred within 2 miles, 3.7% occurred within 1 mile and 5 % occurred within 0.5 mile of a PTR. Within each of four distance categories, about 45% are injury crashes and just 0.5% are fatal crashes. A 2-mile distance was chosen as the criterion to use in requesting PTR data because a 1-mile distance reduces the percentage of crash coverage by detectors from 17% to less than 4%. Table 4-12 â Distribution of Crashes by Distance to Nearest WSDOT Detector Station Injury Crashes Urban Distance (mi) Fatal Crashes All Crashes Rural 4395 (44.6%) 8015 (81.4%) 3 48 (0.5%) 9849 (23.4%) 1834 (18.6%) 3244 (44.8%) 5912 (81.6%) 2 36 (0.5%) 7245 (17.2%) 1333 (18.4%) 1854 (45.4%) 3384 (82.8%) 1 15 (0.4%) 4085 (3.7%) 701 (17.2%) 975 (46.5%) 1752 (83.5%) 0.5 8 (0.4%) 2098 (5%) 346 (16.5%) About 32% of the crashes in the 1996 HSIS occurred on âruralâ roads; the remaining 68% occurred on âurbanâ roads.22 About 8% of the crashes occurred on roads with a posted speed limit of 70 mi/h, just 1% on 65 mi/h roads, 26% on 60 mi/h roads and 15% on 55 mi/h roads; the remaining 52% occurred on roads with speed limits less than or equal to 50 mi/h. In 1996, roughly 150 of the PTR directional stations had at least one crash within 2 miles, but 12 of these stations were located on roads with speed limits under 50 mi/h and thus were not suitable for the purposes of this study. Among the remaining 138 stations, 54% were on rural roads and 46% were on roads with a 60 mi/h speed limit; 34% of the stations were on urban roads with a 60 mi/h speed limit. Although many rural sites seem to be represented, those with the most injury crashes tend to be urban. For example, among the 50 stations associated with the highest number of injury crashes, only two are on rural roads. This is due to the high traffic volumes that urban roads carry, not necessarily because they are more dangerous. Based on this examination, the project requested and obtained data for six of the 149 PTR stations: 21 101 of these are classification sites, and 48 are weigh-in-motion (WIM) sites. When one considers that separate directions on divided highways act as distinct stations (e.g., stations R047W and R407E for west and east directions of flow), there are 163 total stations. 22 WSDOT traffic detector data files do not distinguish urban or rural road type. The station classification comes from matching those sites with the HSIS datasetâs urban/rural classification of Washington mileposts.
86 ⢠P4N&S, which is at Boulevard Road in Olympia, in the Puget Sound region; ⢠P06, which is in Camas, in the southwest region of the state; ⢠D1N&S, which is at 112th Avenue in Bellevue in the Puget Sound region; ⢠D10, which is near 76th Avenue in the Puget Sound region; ⢠P10, which is in Ritzville, in the eastern region of the state; and ⢠P03, which is in Wapato, in the south central region of the state. Additional characteristics of these sites are provided in Table 4-13, and their locations are shown in Figure 4-4. The PTR records for these stations were obtained for a data period covering the three complete calendar years of 1995, 1996 and 1997. This period spans the date of the NMSL repeal in Washington State on March 16, 1996. Table 4-13 â Site Characteristics of Six WSDOT Traffic Detector Stations PTR* Number Route Num. Milepost Urban/Rural Pre-Speed Limit Post-Speed Limit P4N&S 5** 106.7 Urban 55 60 P06 14 11.9 Urban 55 55 D1N&S 405** 9.26 Urban 55 60 D10 520 4.0 Urban 50 50 P10 90** 218.83 Rural 65 70 P03 97 66.3 Rural 55 55 * Permanent Traffic Recorder ** Indicates an interstate highway. Figure 4-4 â WSDOT Detector Stations Providing Data for the Analysis P4N&S P06 D1N&S D10 P10 P03 Seattle Olympi
87 The resulting dataset consisted of speed and traffic volume data for the four stations, in a day-by- day time-series format, over the three-year data period. These data are summarized in the following table. Table 4-14 â Summary Speed Data Statistics at Four Washington Detector Stations Site Variable Mean Std. Dev. Min. Max. Average Speed (mi/h) 56.53 2.50 29.77 63.74 P03 Northbound Speed Variance (mi2/h2) 27.86 17.78 17.80 255.17 Average Speed 56.01 1.91 40.54 61.35 P03 Southbound Speed Variance 34.76 18.46 21.51 251.42 Average Speed 58.03 1.45 50.23 61.80 P4N Northbound Speed Variance 22.21 6.16 16.60 108.14 Average Speed 58.02 1.58 37.44 61.80 P4S Southbound Speed Variance 22.50 9.29 16.60 206.82 Average Speed 56.38 1.09 41.22 58.30 P06 Eastbound Speed Variance 23.08 7.20 18.38 186.38 Average Speed 60.24 1.11 44.90 61.90 P06 Westbound Speed Variance 25.82 5.71 21.41 144.28 Average Speed 67.02 1.97 55.26 70.83 P10 Eastbound Speed Variance 32.28 8.76 20.55 113.24 Average Speed 67.93 2.04 53.35 71.88 P10 Westbound Speed Variance 34.70 8.95 1.37 119.88 4.2.4.2 Model Estimation and Analysis A before-after study based on a statistical test of differences in averages, such as Studentâs t test, might seem to be an appropriate approach to analyze these data. However, the presence of serial correlations, non-stationarity and seasonality in the observations is likely to invalidate the results of this or similar elementary statistical tests, which are generally based on an assumption of independent observations (Box and Tiao, 1975). For this reason, the project decided to analyze the data using time-series intervention analysis (known as ARIMA23 intervention analysis), recognizing the speed limit change as an intervening event. The pre-intervention period for this study was defined to be the portion of the data period prior to the speed limit change. It thus covered the period from January 1, 1995 through March 15, 1996, and contained 439 days of traffic data. The post-intervention period was March 16, 1996 though December 31, 1997, and contained 656 days of data. On average, 12% of the 1095 observations (days) were missing due to detector malfunctions24 (with a range of 9 to 16 %); these data were treated as âmissingâ in the estimation. 23 ARIMA is an acronym for auto-regressive integrated moving average. 24 A detector was considered to be malfunctioning if a volume of zero was recorded for an entire day, or if a particular date was entirely missing from the raw data records.
88 Figure 4-5 â Eastbound Average Speed at the P10 station in 1995-1997 Figure 4-6 â Eastbound Speed Variance at the P10 station in 1995-1997 The key assumption in this intervention analysis is that the ARIMA process that characterizes the pre-intervention series remains unchanged in the post-intervention period, so that any observed change can validly be attributed to the intervention (Yaffee and McGee, 2000). However, even a quick examination of the data reveals them to be non-stationary. For example, the average speed and speed variability at station P10 (shown in Figure 4-5 and Figure 4-6) tend to increase with time. Transforming the data by computing differences between successive values may render them more nearly stationary. Moreover, the data appear to exhibit strong seasonality since, for example, variations in average speed and speed variance are clearly more substantial during the winter. Therefore, seasonal differencing (e.g., differencing every 365th pair of observation values) may also be needed. Both approaches were examined, as described below. Jan 1995 1996 1997 Dec JanDec Jan Dec SL Change Jan 1995 Dec JanDec Jan Dec SL Change 1996 1997
89 To account for an intervention, ARIMA intervention analysis adds an impulse function to the basic ARIMA process. The characteristics of the impulse function reflect those of the interventionâs effect (e.g., its duration and nature of onset), where a priori reasoning or visual examination of the data can sometimes suggest a functional form to represent these effects. Step functions (for a permanent effect) and pulse functions (for a temporary effect) are two commonly used forms (Box et al., 1994). Since the speed limit was raised at two of these four sites on March 16, 1996 and the higher limit remained in effect until the end of the data period, a permanent intervention effect was assumed and a step response function was applied to represent it. This was accomplished by including in the model an indicator variable for speed limit change. Examination of a datasetâs autocorrelation function (ACF) and partial ACF (PACF) can sometimes suggest appropriate values for the p, d and q parameters of the ARIMA processâ autoregressive (AR), integrating (I) and moving average (MA) components, respectively. However, for these particular data the ACF and PACF failed to suggest clear p, d or q parameter values, so all of the standard ARIMA specifications (with p=0, 1, and 2, d=0 and 1, and q=0, 1, and 2) were estimated. Seasonal differencing with several values around 365 was also attempted, but did not perform well. . All ARIMA estimations were performed using the SAS system software. Diagnostics were performed on all estimated models. At each station and direction, several models generally appeared to be appropriate and similar to one another in their performance, so that it was difficult to distinguish a single âbestâ model for each case. However, the estimates of the speed limit change effects were similar in all cases, so the range of values estimated in the various models are provided in Table 4-15 below. Table 4-15 â ARIMA Model Estimates of Effect of Speed Limit Change on Speed Average and Variance PTR Number Urban/ Rural Limit Change Direction Effect on Speed Average (mi/h) Effect on Speed Variance (mi2/h2) Northbound â* -10.782 P03 Rural 0 Southbound â -15.314 Eastbound 1.594 5.056 P10 Rural + 5 mi/h Westbound 1.241 5.671 Eastbound 0.783 â P06 Urban 0 Westbound 0.447 â Northbound 1.227 - P4N&S Urban + 5 mi/h Southbound 1.312 - * âââ indicates no statistically significant effects. Note: All values are statistically significant at the 0.05 significance level (and most are significant at the 0.001 level). R-squared values are in parentheses. Considering the two sites that experienced 5 mi/h speed limit increases, average speed there increased by amounts ranging from roughly 1.2 to 1.6 mi/h. Speed variance increased by about 5 mi2/h2 at the rural site (PTR P10); on the other hand, no statistically significant effect of the speed limit change on speed variance was found at the urban site (PTR P4N&S).
90 In contrast, the two stations (PTR P03 and P06) that did not experience speed limit changes exhibited virtually no changes in average speed and speed variance at the time of the speed limit change. The urban site whose limit was unchanged (PTR P06) may have experienced a slight spillover effect, in which its average speed increased as a result of speed limit increases at other sites, but this was on the order of just 0.6 mi/h. It is possible that urban locations are more prone to speed limit change spillover effects due to their denser networks, which provide more trip routing options and more opportunities to use multiple highways in a single trip. Thus, urban- area drivers may become more accustomed to the higher speed limits and drive similarly on other highways whose limits have not changed. However, the effect seems slight. Along with the ARIMA intervention models, simple linear regression models with linear time trend variables and an indicator variable for the speed limit change were also specified and estimated using ordinary least squares (OLS). The results are presented in Table 4-16. Although all estimated values appear to be statistically significant at the 0.05 significance level, their standard errors are biased downward, so their actual significance is less than indicated. While some of the estimates are similar to the results of the time series models, they are generally lower in value. Moreover, the estimated effects on speed variances at the PTR P03 site appear quite unreasonable (-10.8 mi2/h2 and -15.3 mi2/h2 in the northbound and southbound directions, respectively, at a site where no speed limit change took place). Of course, an OLS approach neglects the serial correlation in the data, resulting in inefficient estimators and biased estimates of their standard errors. For these reasons the results of the ARIMA intervention analysis are preferred. Table 4-16 â OLS Model Estimates of Effect of Speed Limit Change on Speed Average and Variance PTR Number Urban/ Rural Limit Change Direction Estimated Effect on Speed Average Estimated Effect on Speed Variance Northbound â -10.8 P03 Rural 0 Southbound â -15.3 Eastbound 1.59 5.1 P10 Rural +5 mi/h Westbound 1.24 5.7 Eastbound 0.78 â P06 Urban 0 Westbound 0.45 â Northbound 1.23 â P4N&S Urban +5 mi/h Southbound 1.31 â In addition to OLS and ARIMA regression models, simple before-after statistical comparisons of the Washington State PTR data were performed. The project conducted t-tests of differences in means with heteroscedastic variance to compare average speeds, and F-tests to compare speed variances. The results suggested that all sites experienced statistically significant changes (at the 0.001 significance level) in both their speed average and speed variance. However, the estimated effects are small in value, ranging from 0.6 to 2.4 mi/h for average speeds, and from -0.5 to +2.0 mi2/h2 for speed variances. As noted above, these statistical tests assume independent observations, which is not the case here due to serial autocorrelation. Thus, the ARIMA results remain preferred.
91 In summary, a variety of time-series model results for four distinct highway sites in the State of Washington suggest that those sites experiencing speed limit changes exhibited increases in their average speeds and speed variances, while those without such changes exhibited practically no change. The increase in observed average speeds was just 2 mi/h for a 5 mi/h speed limit change. The rural site experiencing a speed limit change appeared to be more affected than the urban site experiencing a change. This latter conclusion may apply more generally to other sites, particularly if congestion in urban area imposes limits to chosen speeds and their variation. 4.2.5 Analysis of Rational Speed Choice Using Simulated Data In addition to the empirical analyses of actual speed data, a theoretical model of how rational drivers choose their driving speeds was also developed. This work is described here. It is reasonable to hypothesize that a driver chooses his or her speed to minimize a generalized cost of travel. In this context, the generalized cost consists of travel time costs, crash costs, legal costs (from traffic fines if caught speeding) and vehicle operating costs. All of these cost components depend, to some extent, on the chosen speed. McFarland and Chui (1987) made a similar hypothesis, in an attempt to estimate the value of travel time using telephone interview survey data (along with numeric assumptions drawn from previous studies). Since the speed-related contribution of vehicle operating costs can be expected to be rather negligible compared to the other three costs,25 it was decided to exclude that component from additional consideration. Several functional forms were considered for each of the cost components. For crash and legal costs, linear, quadratic, and logit specifications were considered. The quadratic form was chosen because it is simple to handle yet reasonably accommodates non-linear relationships, particularly when the domain is limited. The following is the final minimization formulation that was specified by the study: )()()(min SpeedLCSpeedCCSpeedTC Speed ++ where 110)( âÃÃ+= SpeedWagebbSpeedTC tt ])([ ][)( 2 10 2 210 SSPDSpeedaa SSPDSpeedbSSPDSpeedbbSpeedCC cc ccc âÃ+à âÃ+âÃ+= , )()]([ ])()([)( 10 2 210 SLSpeedSLSpeedaa SLSpeedbSLSpeedbbSpeedLC ll lll >ÃâÃ+à âÃ+âÃ+= I . 25 According to equations for operating costs of medium passenger cars in 1982 (McFarland and Chui, 1987), vehicle operating costs increase roughly 0.13 and 0.23 cents per mile driven per mile per hour, when speeds rise from 50 to 60 mi/h and from 60 to 70 mi/h, respectively. Reed (2001) also chose to exclude vehicle operating costs from his analysis, for the same reason.
92 Here t indexes travel time cost parameters, c indexes crash cost parameters, l indexes legal cost parameters, i indexes an individual driver, TC is a travel time cost, CC is a crash cost, LC is a legal cost associated with speeding, Wage is an hourly wage, SSPD is the safest speed, SL is the speed limit and )(â I is an indicator function (equaling 1 if the parenthesized condition is true and zero otherwise). The safest speed (SSPD) was treated as exogenous; it was viewed as a design speed for straight highway sections, potentially ranging from 70 to 120 mi/h26 and corresponding to 55 to 75 mi/h speed limits. (An extension of this approach might estimate it as a function of geometric design and other variables.) This specification is an unconstrained non-linear minimization problem. One standard approach for solving such problems is to derive a system of equations based on the problemâs optimality conditions, and to solve these; the roots of the equation system are candidate solutions of the original optimization problem. In this case, the equation derived from the first-order necessary condition with respect to Speed is: ( )[ ] ( )[ ] ( ) ( ) ( )[ ] ( ) ( ) ( )[ ] ( )[ ] ( ) ( )[ ] [ ] ( ) 0 2 2 100 100 2100 ;0)( 1 2 210 2 10 21 10 2 2101 2 210 102121 =âà â+â++â+à â¥â¦ â¤â¢â£ â¡ ââ âââââ ââ+ â¥â¦ â¤â¢â£ â¡ >â âÃâ+à â+â++>à â+â++>à â+Ãâ++Ãâ =â â SSPDSpeedr SSPDSpeedbSSPDSpeedbbSSPDSpeedrr SSPDSpeed Speed SSPDSpeedbSSPDSpeed Speed b SLSpeed Speed SLSpeedaa SLSpeedbSLSpeedbbSLSpeeda SLSpeedbSLSpeedbbSLSpeed SLSpeedaaSLSpeedbb Speed Wageb Speed fxnobj c ccccc cc ll llll lll llllt I I I Second-order sufficient conditions ensure that a solution of this equation also minimizes the objective function of the minimization problem. Unfortunately, a closed form analytical solution of this equation could not be obtained, either by hand or using the MAPLE 8 symbolic mathematics system by Maplesoft. In order to advance farther in this analysis of rational speed choice, a different approach was pursued. Rather than trying to solve the optimization problem for any arbitrary values of the various coefficients and variables, synthetic datasets were generated in which each record consisted of specific values for each of the parameters and variables used in the model. The data generation process involved both deterministic and random number generation, and ensured that a reasonable range of values for each parameter and variable was covered: the range of parameter values was compared to a range of estimates found in past studies. 26 Very high âsafe speedsâ (up to 120 mi/h) are potentially possible on straight segments, where sight distances may be great (under lighted conditions) and centrifugal forces are not present.
93 Two large datasets were generated in this way. (Appendix D provides more details regarding the generation and characteristics of these synthetic datasets.) The MATLAB mathematical software package (MathWorks Inc. 1992) was then used to numerically find the optimal speed corresponding to each specific set of parameter and variable values. After the results were checked for validity and reasonableness, a statistical analysis was conducted of the relationship between the optimal speeds that were developed from this procedure and the key explanatory variables. Table 4-17 presents estimates of linear models of optimal speed as a function of some of the key explanatory variables, estimated from the two sets of generated data. Both regressions result in very high R-squared values (0.97 and 0.98), and the estimated coefficients are all significant as well as consistent across the two models. The estimated coefficients of speed limit variables are within reasonable bounds according to empirical findings of past studies: past studies suggest that speed changes are less than speed limit changes, and often less than half of the speed limit changes (e.g. Ossiander and Cummings 2002; Jernigan and Lynn 1991; Upchurch 1989). Although the results of Table 4-17 do not originate from empirical data, they do suggest that a simple linear specification for speed choice may serve well in predicting choices that emerge from highly complicated choice processes. Moreover, if the assumed parameter values are reasonably realistic, these results suggest that safe speeds, for which design speeds may be a good proxy, are more important in determining actual speed choice than are speed limits: the coefficients on SSPD exceed those on SL by 25% to 80%. While the coefficients of these two explanatory variables differ, they do appear to complement one another in a dramatic way: an increment of 1 mi/h in both these speeds is predicted to result in an almost 1.0 mi/h increase in chosen speed. This result is quite interesting and reasonable and, at the same time, is not obvious from the model specification. The results also suggest that wage may have a relatively minor effect; however, the predicted magnitude (roughly 0.1 mi/h for every $100 change in hourly wage) seems unrealistically small. Table 4-17 â Linear Regression Model of Simulated Rational Speed Choice Dataset Dataset 1 Dataset 2 Variables Coef. Std. Err. t-stat Coef. Std. Err. t-stat Constant -3.1001 0.025421 -121.949 -3.4503 0.011746 -293.750 WAGE 0.001004 0.000175 5.743 0.0007099 8.73E-05 8.135 SSPD 0.5525 0.000143 3870.436 0.6235 6.6E-05 9448.173 SL 0.4422 0.000324 1366.037 0.3735 0.00015 2495.995 Nobs. 495,000 1,856,250 R-sqrd. 0.972 0.981 Adj. R-sqrd. 0.972 0.981
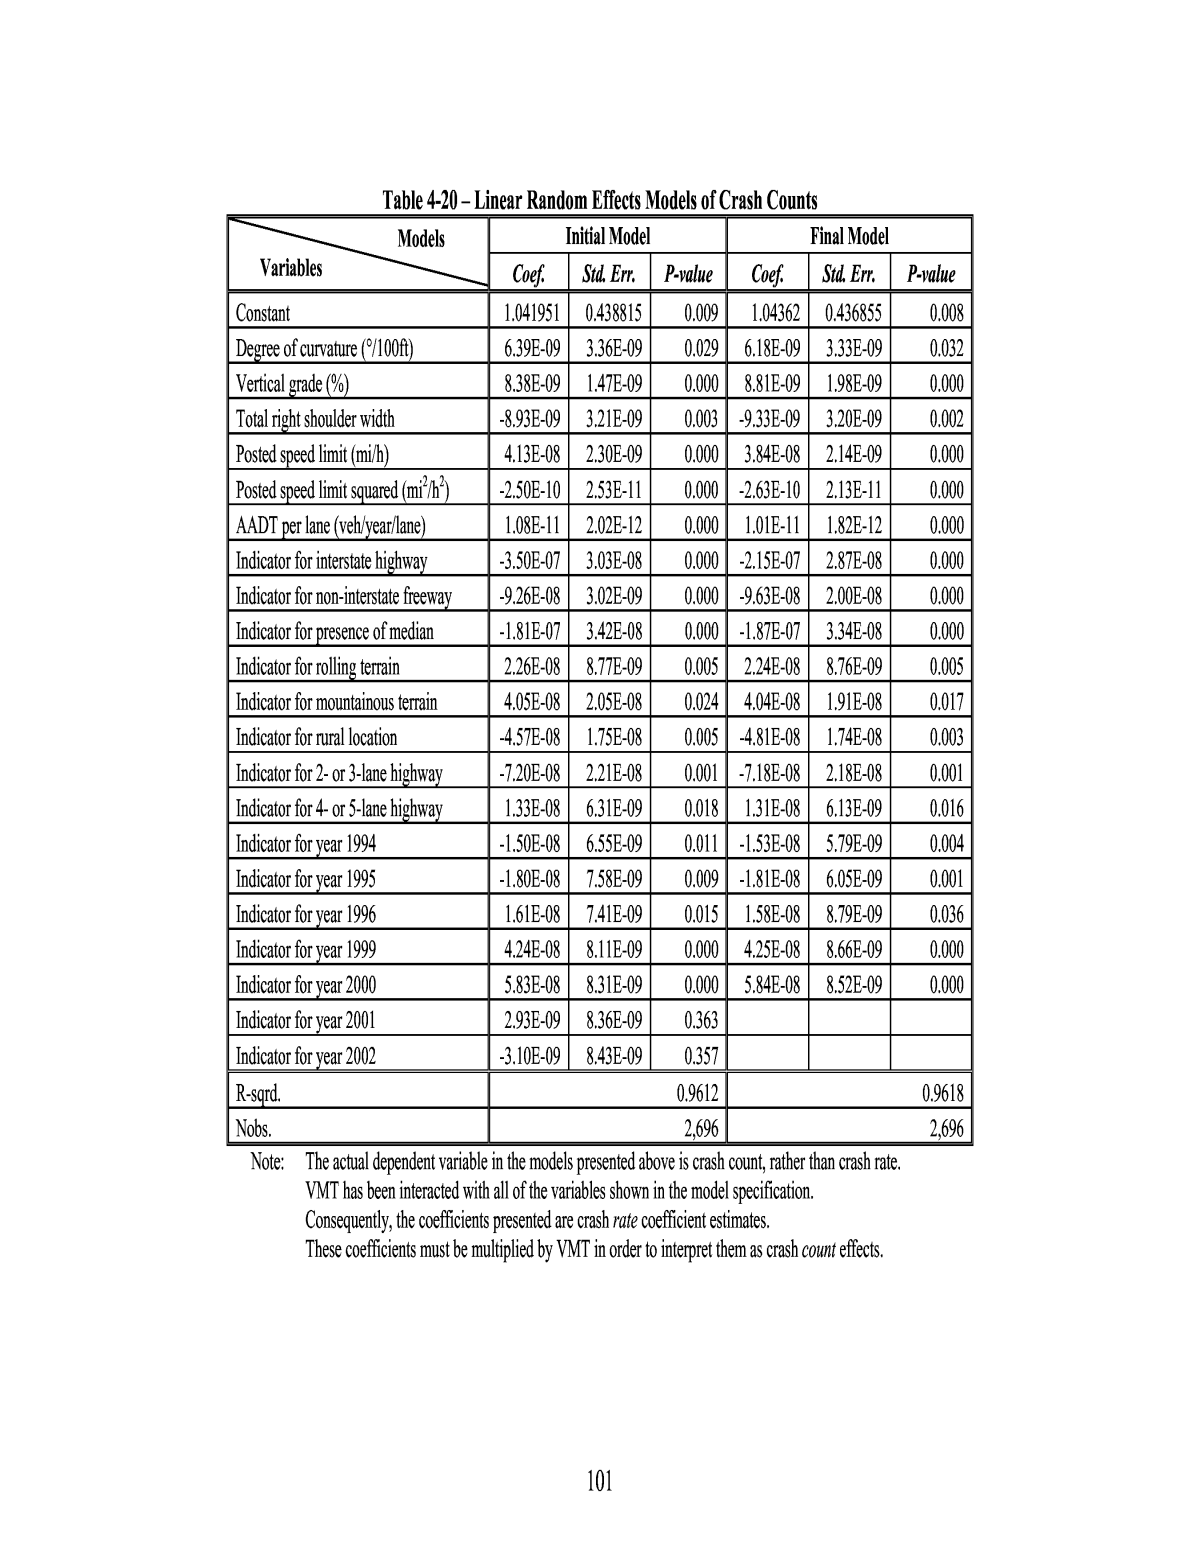
94 4.3 Crash Occurrence Models This section describes the projectâs analyses of crash occurrence models. Crash occurrence is quantified in a number of different ways in these analyses: in some cases as crash counts and in others as crash rates with respect to VMT. Similarly, some models consider all crashes regardless of severity, while others investigate crashes by type or severity. The work relied heavily on HSIS data for Washington State; these data were complemented by information from other sources. As will be seen, some analyses made use of the HSIS data in their original (i.e. disaggregate) form; however, analyses using aggregated forms of the HSIS data proved much more productive. The following analyses are described below: ⢠A model of crash occurrence based on a panel dataset of clustered HSIS data for Washington State (section 4.3.1); and ⢠A before-after model of crash occurrence changes based on clustered HSIS data (section 4.3.2). Again, the project performed additional analyses of crash occurrence models that, for a variety of reasons, were not considered to give satisfactory results. Discussions of these analyses are included for completeness, but have been relegated to the appendices. The analyses include: ⢠A model of crash occurrence based on segment-level (unclustered) HSIS data for Washington State (Appendix F ); ⢠A simple exploratory analysis of speed limit change impacts using the segment-level HSIS data (Appendix G); 4.3.1 Crash Occurrence Models Using Clustered HSIS Panel Data HSIS data concern short homogeneous roadway segments and so are highly disaggregate. While disaggregate data can be advantageous for some purposes, crash data on disaggregate roadway segments tends to consist of many observations with zero or a low number of crashes, and this characteristic of the data conflicts with the assumptions of many âconventionalâ statistical methods and analyses. Accordingly, it was decided to convert these same data into a more aggregate form using data clustering procedures. These procedures combine a large number of disaggregate data points into a much smaller number of clusters, where each cluster groups together a set of data points that are in some sense similar to each other and different from the points belonging to other clusters. Attributes of the cluster are computed from the attributes of the data points that belong to it. Aggregation makes the resulting dataset more suitable for statistical analyses such as least squares regression and its generalizations.
95 4.3.1.1 Data Preparation The crash datasets used in this analysis were collected from Washington State through the Highway Safety Information System (HSIS). The HSIS data contain information on vehicle occupantsâ demographics, roadway design features including speed limits;27 vehicle characteristics; environmental conditions at the time of crash; and basic crash information such as crash severity, time, location and type. HSIS data were extracted for the years 1993 through 1996 and 1999 through 2002, which bracket the repeal of the National Maximum Speed Limit.28 The HSIS indicates that a total of more than 760,000 vehicle occupants were involved in 263,970 reported crashes, resulting in more than 2,400 fatalities on Washington State highways in this period. Because of the projectâs focus on high-speed roads, any straight segments having speed limits less than 50 mi/h were excluded from the dataset. However, curved sections with speed limits less than 50 mi/h on otherwise high-speed roads were retained in the dataset in order to increase the variability in the independent variables. Rather than analyzing individual crashes and the factors associated with their occurrence, the approach here was to define clusters of roadway segments with relatively homogeneous characteristics, and to relate the clustersâ aggregate crash performance to their characteristics. Clustering was originally performed using statistical procedures that automatically group a set of observations into clusters by minimizing some measure of dispersion of the variables of interest within clusters, and maximizing the dispersion between clusters. However, the clusters that resulted from this procedure had no intuitive interpretation, so it was decided to define clusters manually, in terms of meaningful and reasonable thresholds for the variables of interest. Regardless of the clustering procedure, cluster analysis eliminates some of the discreteness and variability in the data, and may allow the use of simpler statistical techniques. Segments were assigned to clusters based on their design attributes (number of lanes, roadway classification, terrain, presence of median, degree of curvature, vertical grade, and right shoulder width).29 Threshold values of each variable used for clustering are shown in Table 4-18. 27 The HSIS speed limit information is routinely provided off cycle from the other data, so correct speed limit information was obtained from Washington DOTâs Bob Howden. 28 Data for 1997 and 1998 were not available because complete HSIS data records for those years were unfortunately not kept. 29 AADT per lane also is an important variable that may be of value for clustering (so that high-demand roadways are not grouped with low-demand roadways). However, it is far from certain that a panel of clustered segments would remain stable in this attribute over time. Therefore, this variable was not used for clustering purposes here.
96 Table 4-18 â Variable Thresholds for Cluster Definitions in the Crash Count Model Variable Thresholds #groups # lanes 2 & 3; 4 & 5; 6,7 & 8 lanes 3 Presence of median yes/no 2 Rural location yes/no 2 Interstate highway yes/no 2 Terrain type level; rolling; mountainous 3 Non-interstate freeway yes/no 2 Degree of curvature (DC) DC=0°; 0°<DCâ¤10°; DC>10° 3 Right shoulder width (RSW) RSW=0; 0<RSWâ¤20; RSW>20 ft 3 Vertical grade (VG) VG=0; 0<VGâ¤5; VG>5 % 3 Total possible clusters 3Ã2Ã2Ã2Ã3Ã2Ã3Ã3Ã3=3,888 Since the intent was to isolate the effect of speed limit, roadway segments that experienced design changes affecting any of the cluster definition features during the period 1993-2002 were removed from the dataset. Out of 100,457 total segments in the base year (1998), 41,348 met the requirements of unchanged design features30 through 2002. These observations account for 59% of total miles, 65% of VMT and 63% of total crashes. Aggregate cluster crash counts and VMT were computed by summing the corresponding values of the included segments. Resulting totals were divided to create aggregate cluster crash rates. Aggregate values of explanatory variables were computed from the corresponding variable values of the included segments, weighing the individual values by the corresponding segment VMT. These calculations were performed on the data for each year of the analysis period. The clustering procedure was applied based on segment attributes in 1993. The resulting cluster membership of each segment was maintained and applied to the segment observations for subsequent years, from 1994 through 1996 and from 1999 through 2002. Aggregate cluster attributes were computed for each year. The result is a panel dataset of segment clusters. Summary statistics for the cluster dataset are shown in Table 4-19. Before clustering, there were 41,348 segments, the average crash count was 0.24 crashes (per year per segment), and the average segment length was just 0.09 miles. The clustering process created 337 clusters for each year, resulting in average crash counts of 26 crashes (per year per cluster) and average segment lengths of 10 miles (per cluster). The average VMT per lane was 283,654 vehicle-miles (per year per segment) before clustering, and rose to 31,033,070 after clustering. Clearly, clustering makes the data much more continuous in nature, thus permitting application of more standard â and easier to interpret â linear models. 30 The original intent was to include all relevant HSIS segments. However, since segments are homogeneous by definition, a change in a segmentâs attributes during the data period would cause it to be split into a series of shorter segments, and this caused problems matching segments in different years. The project attempted to create a fixed set of segments based on all attribute changes that occurred over the data period. Unfortunately, this still could not guarantee the correct identification of matching segments because of roadway realignments and data recording errors. It was therefore decided to use only those segments having attributes that remained unchanged over the entire period. By the same logic, it was also decided to remove any segments showing a purported speed limit increase of 20 mi/h or more, since these were most likely to be incorrect records. A total of 2,876 such segments were removed from further analysis.
97 Table 4-19 â Summary Statistics of Variables for 337 Segment Clusters Over Eight Years Variable Mean Std. Dev. Min Max Dependent Variables Number of total crashes 26.02 90.54 0 1469 Number of PDO crashes 14.32 50.32 0 799 Number of injury crashes 11.35 41.78 0 656 Number of fatal crashes 0.354 1.598 0 29 Number of occupants injured 18.41 69.67 0 1112 Number of occupants killed 0.4013 1.789 0 34 Independent Variables Segment length (miles) 9.975 56.12 0.05 931.8 Degree of curvature (°/100ft) 1.728 3.415 0 20.32 Vertical grade (%) 2.236 2.237 0 10 Total right shoulder width 9.678 9.189 0 50 Posted speed limit 55.19 8.326 25 70 AADT per lane 5949 3796 509 21470 Indicator for interstate highway 0.2404 0.4274 0 1 Indicator for non-interstate freeway 0.3531 0.4780 0 1 Indicator for presence of median 0.5608 0.4964 0 1 Indicator for rolling terrain 0.4748 0.4995 0 1 Indicator for mountainous terrain 0.1780 0.3826 0 1 Indicator for rural 0.5312 0.4991 0 1 Indicator for 2 or 3 lane highway 0.4006 0.4901 0 1 Indicator for 4 or 5 highway 0.4481 0.4974 0 1 Indicators for years 1994 â 2002 Nobs. = 2,960 (337 clusters x 8 data years) 4.3.1.2 Model Specification Panel datasets, such as the one described above, offer a number of advantages compared to less structured data. Panel data permit identification of variations across individual roadway segments and over time. Accommodation of observation-specific effects also mitigates omitted- variables bias, by implicitly recognizing segment-specific attributes that may be correlated with explanatory variables. However, models that are applied to analyze such datasets must take account of their panel nature. Two of the standard model types that are appropriate for panel data are fixed and random effects models. The specification of the fixed effects (FE) linear model is as follows (Greene 2002): itiitit xy εαβ ++â²= for Ni ,,2,1 L= and Tt ,,2,1 L= (1) where iα is the fixed effect specific to roadway segment i, and itε is an error term that varies across both segments and time periods. The fixed effect iα is a constant term that is determined separately for each segment and does not vary over time; its value can be estimated using the following formula (Greene 2002):
98 iii xy βα Ë FEâ²â= (2) where iy is the average response variable value for segment i (number of crashes, in this case) over the T time periods, ix is the vector of average values of the explanatory variables for segment i over the T time periods, and Î²Ë FEâ² is the least squares dummy variable (LSDV) estimator. The specification of a random effects (RE) linear model is as follows (Greene 2002): itiitit uxy εβ ++â²= (3) where iu is the random effect specific to roadway segment i, and other variables are defined as above. There is one random effect for each segment and it remains constant over time; however, each segmentâs individual iu is assumed to be a realization from an underlying distribution of effects that is common to all segments. Linear fixed effects models can be estimated using a least squares dummy variable (LSDV) model. Linear random effects models can be estimated using a generalized least squares (GLS) approach, by assuming an appropriate distribution for the random effects. Usually, RE estimates are more efficient than FE estimates since they are obtained by making use of both within-group and between-group variations (rather than only within-group variations). However, when there is correlation between omitted unobserved variables and included explanatory variables, the RE estimates become biased while the FE estimates remain unbiased (Hsiao, 2003). The question arises as to which model should be used in practice. If FE models are used, there will be a loss of 1N â degrees of freedom in estimating the segment-specific effects. If RE models are used, it must be assumed that the segment-specific effects are uncorrelated with other, included variables. The Hausman test for such correlation can be performed using the following chi-squared statistic (Greene 2002): [ ] [ ] [ ]REFEREFEKW ββÏÎ²Î²Ï ËËËËË1 12 ââ²â²ââ²=â= â (4) where [ ] [ ] [ ]REFEREFE VarVarVar Î²Î²Î²Î²Ï ËËËË ââ²=ââ²= (5) where FEÎ²Ë â² is the LSDV estimator for the FE panel model, and REÎ²Ë is the GLS estimator for the RE panel model. Greene (2002) notes that Hausmanâs assumption for calculating Ï is that the covariance of a random effect estimator and its difference from a fixed effect estimator is zero. Hsiao (2003) argues that an FE model is more appropriate when the intent is to infer results for individuals in the sample, while an RE model is preferred for inferences relating to the larger population. However, in practice the choice of specification generally depends more on whether
99 correlations exist between omitted variables and the included explanatory variables. Both the FE and RE model forms were estimated here, and Hausmanâs test was applied to evaluate the possibility of error-term correlation with explanatory variables. 4.3.1.3 Model Estimation and Analysis A model of crash rates vs. traffic intensity would involve the VMT variable (the product of segment length and WSDOT AADT estimates for each segment) on both sides of the equation (in the denominator of the crash rate variable and in the numerator of traffic intensity/density variable). Since this can create spurious correlations, the VMT variable was moved to the right- hand side of the model specification, interacting it with the other explanatory variables. As a result, crash count (rather than rate) is the dependent variable: ( ) itititit XVMTCount εβ +Ã= (6) where Count refers to crash count (number of crashes per year per segment), and the Xâs are variables such as speed limit, degree of curvature, lane-use density (AADT per lane), right shoulder width, presence of median, vertical grade, and indicators of roadway classification and rural location, as well as a constant term. Both FE and RE linear models were estimated for total crashes. Hausman test results suggested that there was no significant correlation between the RE model random error terms and the included variables, so the RE estimates were preferred here for reasons of statistical efficiency. Furthermore, the RE models are preferred because most of design features are time invariant, and thus cannot be estimated using FE models. The final estimation results for the RE model are shown in Table 4-20. The R-squared goodness of fit statistic suggested that 96% of the variation in crash count occurrence was accounted for by the modelâs explanatory variables.31 In interpreting this table, it is important to note that, although VMT was interacted with all of the variables shown in the model specification, the coefficient estimates shown in the table have not been multiplied by VMT. Consequently, the reported values are estimates of the crash rate coefficients. In order to interpret the results in terms of their crash count implications, the coefficients must be multiplied by VMT. The effect of a speed limit change on overall crash frequency can be directly estimated from these results. As can be seen from the standardized coefficients in Table 4-20, speed limit is an important factor that positively impacts crash frequency. However, the presence of the squared speed limit with a negative coefficient moderates the simple linear effect to some extent. The combination of these two terms implies that 3.29% more crashes would be expected if speed limits were to increase 10 mi/h (from 55 mi/h to 65 mi/h), when all other control variables are 31 The R-squared is quite high, thanks in large part to the inclusion of a âsizeâ term (VMT) on the right-hand side of the equation. If crash counts were normalized with respect to this size term, the dependent variable would become a crash rate, and the regression of the segmentsâ crash rates on all other control variables would result in an R-squared of 0.18.
100 held at their average values.32 Very roughly, this model suggests that a 10 mi/h speed limit increase is associated with a 3% increase in overall crash frequency. Holding all factors fixed (including roadway design and traffic intensity), the relationship between total crash rate and speed limit is concave, with a maximum around 73 mi/h. Because of the quadratic specification, the curve eventually falls, but extrapolation beyond 70 mi/h goes outside the range of observed data and is not credible. The results of Table 4-20 also suggest that roadway design plays an important role in predicting crash occurrence. For example, more crashes are expected on sharper horizontal curves as well as on steeper vertical curves. Crash rates are also predicted to rise with increasing traffic intensity (measured as AADT per lane). This is probably due to the greater interaction among vehicles that occurs under more congested conditions. The presence of a median also significantly reduces crash frequency. Table 4-21 defines three example segments that were used to investigate the modelâs predictions regarding speed limits and crash rates. The three segments are drawn from clusters with relatively low, medium and high speeds, respectively, and have attributes that are typical for the cluster. All are tangent sections on non-interstate highways, in 1993, with respective speed limits of 45, 50, and 55 mi/h. Table 4-21 provides additional details on the characteristics of these segments. The model was applied to predict the crash rate effects of speed limit increases of up to 15 mi/h from the segmentsâ original speeds. Figure 4-7 provides a graphical summary of these predictions. It can be seen that the predicted relationship is slightly concave: crash rates rise with increasing speed limit, but at a decreasing rate. The figure gives a sense of the overall magnitude and shape of the predicted effect of speed limits on crash rates. As can be seen, the effect is not dramatic, but it is practically and statistically significant. Note that, because of the concavity of the relationship, the magnitude of the effect tapers off at higher speeds. A summary of results for speed limit and all other control variables is presented following the discussion of crash severity models, in Table 4-26. This table allows one to appreciate the effects of various design and use variables on crash severity as well as crash frequency. Note that these conclusions apply only to the sample sections considered here, and should not be interpreted to apply to other roadways in other circumstances. 32 In this context, an average roadway section refers to a section with 2°/100ft degree of curvature, 2% vertical grade, on a four-lane divided rural interstate highway, with 10 ft shoulder width, and carrying 6,000 AADT per lane and 31,033,070 VMT in the year 1996.
101 Table 4-20 â Linear Random Effects Models of Crash Counts Initial Model Final Model Models Variables Coef. Std. Err. P-value Coef. Std. Err. P-value Constant 1.041951 0.438815 0.009 1.04362 0.436855 0.008 Degree of curvature (°/100ft) 6.39E-09 3.36E-09 0.029 6.18E-09 3.33E-09 0.032 Vertical grade (%) 8.38E-09 1.47E-09 0.000 8.81E-09 1.98E-09 0.000 Total right shoulder width -8.93E-09 3.21E-09 0.003 -9.33E-09 3.20E-09 0.002 Posted speed limit (mi/h) 4.13E-08 2.30E-09 0.000 3.84E-08 2.14E-09 0.000 Posted speed limit squared (mi2/h2) -2.50E-10 2.53E-11 0.000 -2.63E-10 2.13E-11 0.000 AADT per lane (veh/year/lane) 1.08E-11 2.02E-12 0.000 1.01E-11 1.82E-12 0.000 Indicator for interstate highway -3.50E-07 3.03E-08 0.000 -2.15E-07 2.87E-08 0.000 Indicator for non-interstate freeway -9.26E-08 3.02E-09 0.000 -9.63E-08 2.00E-08 0.000 Indicator for presence of median -1.81E-07 3.42E-08 0.000 -1.87E-07 3.34E-08 0.000 Indicator for rolling terrain 2.26E-08 8.77E-09 0.005 2.24E-08 8.76E-09 0.005 Indicator for mountainous terrain 4.05E-08 2.05E-08 0.024 4.04E-08 1.91E-08 0.017 Indicator for rural location -4.57E-08 1.75E-08 0.005 -4.81E-08 1.74E-08 0.003 Indicator for 2- or 3-lane highway -7.20E-08 2.21E-08 0.001 -7.18E-08 2.18E-08 0.001 Indicator for 4- or 5-lane highway 1.33E-08 6.31E-09 0.018 1.31E-08 6.13E-09 0.016 Indicator for year 1994 -1.50E-08 6.55E-09 0.011 -1.53E-08 5.79E-09 0.004 Indicator for year 1995 -1.80E-08 7.58E-09 0.009 -1.81E-08 6.05E-09 0.001 Indicator for year 1996 1.61E-08 7.41E-09 0.015 1.58E-08 8.79E-09 0.036 Indicator for year 1999 4.24E-08 8.11E-09 0.000 4.25E-08 8.66E-09 0.000 Indicator for year 2000 5.83E-08 8.31E-09 0.000 5.84E-08 8.52E-09 0.000 Indicator for year 2001 2.93E-09 8.36E-09 0.363 Indicator for year 2002 -3.10E-09 8.43E-09 0.357 R-sqrd. 0.9612 0.9618 Nobs. 2,696 2,696 Note: The actual dependent variable in the models presented above is crash count, rather than crash rate. VMT has been interacted with all of the variables shown in the model specification. Consequently, the coefficients presented are crash rate coefficient estimates. These coefficients must be multiplied by VMT in order to interpret them as crash count effects.
102 Table 4-21 â Three Example Scenarios for Crash Model Application Variable description Scenario I Scenario II Scenario III Degree of curvature (°/100ft) 7.0 4.2 2.1 Vertical grade (%) 4 3 3 Total right shoulder width (ft) 6.5 10.5 12.2 AADT per lane (veh/year/lane) 6,000 2,000 5,000 Indicator for interstate highway No no no Indicator for non-interstate freeway No yes yes Indicator for presence of median No yes yes Indicator for rolling terrain No no no Indicator for mountainous terrain No yes yes Indicator for rural location No yes yes Indicator for 2 or 3 lane highway Yes yes no Indicator for 4 or 5 highway No no yes VMT 8,760,000 2,920,000 7,300,000 Before change 45 50 55Speed Limit (mi/h) After change 60 65 70 Note: Data come from observations in the year 1993. Crash rate vs. speed limit (1993) 0 20 40 60 80 100 120 140 160 45 50 55 60 65 70 75 Speed limit (mi/h) C r a s h e s p e r 1 0 0 M i l l i o n V M T Scenario I -- 45mi/h Scenario II -- 50mi/h Scenario III -- 55mi/h Figure 4-7 â Crash Rates vs. Speed Limit in Three Example Scenarios
103 4.3.2 Model of Crash Count Changes Using HSIS Before-After Data When a modelâs dependent variable is influenced not only by the explanatory variables but also by omitted variables that are correlated with them, the estimated effects of the explanatory variables may be biased. (Variables may be omitted because of a specification error, or because data for the variable were not observed or collected and so are not available for use.) In a crash occurrence model, for example, if a segmentâs crash performance is affected not only by its speed limit but also by unobserved factors (such as sight distance, pavement quality or clear zone width) that are themselves correlated with the speed limit, the estimated effect of the speed limit may be biased because the speed limit coefficient also accounts for the effects of the omitted variables. A standard way to avoid this problem in datasets that contain repeated observations of one or more individual units (i.e. time series or panel datasets) is by modeling the differences between the observations of each unit. To the extent that omitted attributes of the units do not change between observations, this differencing procedure will cause their effects to drop out of an additive model, leaving only the true effects of the included variables. To this end, a dataset of HSIS segments with constant geometric characteristics was prepared and used in a type of before-after analysis of speed limit change effects. This analysis investigated the relationships between changes in crash occurrence and changes in speed limits, conditional on roadway geometry. 4.3.2.1 Data Preparation Out of 100,457 Washington State HSIS segment observations between 1993 and 2002, 41,348 met the requirement of constant geometry, and had a speed limit above 50 mi/h on tangent segments. A clustering procedure similar to the one described in section 4.3.1 produced a dataset of 714 clusters over eight years. (Note that the number of clusters is larger here because the procedure used in the preceding section required the speed limits of segments in a cluster to remain unchanged over the data period, whereas here the speed limit changes are precisely the factors of interest.) The variables and values used for clustering are shown in Table 4-22. The resulting summary statistics of all aggregate cluster variables are shown in Table 4-23. Table 4-22 â Group Definitions for Clustering Analysis in Crash Count Change Model Group description #groups # lanes 2 & 3; 4 & 5; 6,7 & 8 lanes 3 Presence of median yes/no 2 Rural location yes/no 2 Interstate highway yes/no 2 Terrain type Level; rolling; mountainous 3 Non-interstate freeway yes/no 2 Degree of curvature DC=0°; 0°<DCâ¤10°; DC>10° 3 Right shoulder width RSW=0; 0<RSWâ¤20; RSW>20 ft 3 Vertical grade VG=0; 0<VGâ¤5; VG>5 % 3 Speed limit: before â after 25â25; 30â30; 35â35; 35â40; 40â40; 40â45; 40â50; 40â55; 45â45; 45â50; 50â50; 50â55; 50â60; 55â55; 55â60; 55â65; 55â70; 65â65; 65â70 mi/h 19 Total possible clusters 3Ã2Ã2Ã2Ã3Ã2Ã3Ã3Ã3Ã19=73,872
104 Table 4-23 â Summary Statistics of Variables for 714 Segment Clusters Variables Mean Std Dev Min Max Change in crash count per year (after vs. before periods) 2.357 8.785 -9.468 121.7 Total crashes per year before SL change 11.09 43.98 0 714.2 Total crashes per year after SL change 13.38 51.22 0 835.9 Segment length (miles) 4.741 26.12 0.05 521.2 VMT before SL change 41612543 189219976 6765 3574365968 VMT after SL change 66215980 299987109 13212 5750583800 Degree of curvature (°/100ft) 1.611 3.306 0 20.32 Vertical grade (%) 2.290 2.254 0 10.00 Indicator for full or partial access control 0.543 0.498 0 1.00 Indicator for interstate highway 0.195 0.396 0 1.00 Indicator for non-interstate freeway 0.349 0.477 0 1.00 Indicator for presence of median 0.534 0.499 0 1.00 Indicator for rolling terrain 0.522 0.500 0 1.00 Indicator for mountainous terrain 0.157 0.364 0 1.00 Indicator for rural 0.555 0.497 0 1.00 Total right shoulder width (ft) 9.023 8.750 0 50.00 Indicator for 2- or 3-lane highway 0.494 0.500 0 1.00 Indicator for 4- or 5-lane highway 0.385 0.487 0 1.00 AADT per lane before SL change 4315 3263 162 17693 AADT per lane after SL change 4610 3541 203 17887 AADT per lane for the whole period 4490 3404 186 17753 SL before change (mi/h) 53.24 7.539 25 65.00 SL after change (mi/h) 55.71 9.065 25 70.00 Number of observations 714 clusters 4.3.2.2 Model Specification As before, in order to avoid spurious correlations created by the presence of the VMT variable on both sides of the equation, this variable was moved to the modelâs right-hand side, interacting it with all variables used in the former specification. This again leaves crash count (rather than rate) as the dependent variable. Identical specifications were used for the situations before (b) and after (a) the speed limit change: ( ) iaiaiaia XVMTCount εβ +â²Ã= (7a) ( ) ibibibib XVMTCount εβ +â²Ã= (7b) where i designates a segment, Counti is the crash count on segment i before (b) and after (a) the speed limit change, and the Xis are segment i's design, use and speed limit variables. The β terms are estimates of the direct impacts that roadway design, use and other explanatory factors have on crash rates. When these terms are multiplied by VMT, the resulting product then estimates the effect of the corresponding variable on crash counts.
105 As explained above, changes in crash counts were modeled here in order to avoid potential biases caused by correlations between speed limits and omitted variables. The assumption is that the segmentsâ omitted variables would enter the specification additively if they were included, and that their values did not change during the data period. Given the specification of Equations 7, crash count changes for each cluster of roadway segments can be modeled as follows: ( ) iibibiaiaibiai ba XVMTXVMTCountCountCount ηβ +âÃâ²=â=â (8) where ib i a i εεη â= . For segments experiencing no speed limit changes, the before period covers from January 1, 1993 through March 31, 1996, while the after period covers from April 1, 1996 through December 31, 2002 (skipping years 1997 and 1998, for which Washington HSIS data were not available). For segments experiencing speed limit changes at other times in 1996, the actual date was used to separate the crashes and VMT into before and after periods. Segments experiencing speed limit changes during other years of the panel data period were not used in this analysis, since clustering would require aggregation of data that was felt to be too distinct. Ordinary least squares regression of crash count changes on the variables listed in Table 4-23 produced, among other results, the OLS residuals associated with each cluster observation. Since crash counts, and thus changes in crash counts, can be expected to rise with VMT, the possible presence of heterscedasticity was of concern, and was examined. Heteroscedasticity does not affect the consistency of OLS estimators, so the individual residuals could be used as consistent estimates of the corresponding error terms. Whiteâs test was applied to these to test for error term heteroscedasticity. The null and alternative hypotheses of Whiteâs test were: H0: 22 ÏÏ =i for all i (where 2iÏ is the error term variance for observation i); H1: 22 ÏÏ â i for all i. Regression of the squared OLS residuals on the same set of explanatory variables X resulted in an R2 of 0.1086. This value resulted in a Whiteâs test chi-squared test statistic33 of 73.88 vs. a 95% critical value of 22.36. Thus the test rejects, as expected, the null hypothesis that the error terms are homoscedastic. 4.3.2.3 Model Estimation and Analysis The second regression for squared error terms produced estimates of the squared disturbances, which are estimates of the error term variances in the first regression. These estimates were then used as weights in a feasible generalized least squares (FGLS) regression, across segment clusters, of changes in counts of different crash types and in numbers of injured persons and fatalities (equation 8). Regression results for the model of total crash counts are shown in Table 4-24. The R-squared goodness of fit statistic suggests that 96.2% of the variation in total crashes (after dividing by VMT) was explained. 33 Under the null hypothesis, nR2 is asymptotically distributed as chi-squared with K degrees of freedom, where n is the number of observations (714) and K is the number of regressors in the second regression (14).
106 Note that the coefficient estimates shown in Table 4-24 apply not just to the crash count changes modeled by Equation 8, but also to the original crash count specification in Equation 7. As presented, the coefficients in Table 4-24 apply to crash rates (per vehicle mile traveled). They must be multiplied by the VMT level (or the change in VMT levels) in order to apply to crash counts (or to changes in crash counts). Table 4-24 â FGLS Model of Changes in Total Crash Counts per VMT Variables Coef Std Error P-value Constant 0.852 0.201 0.000 Degree of curvature 6.71E-09 1.16E-09 0.000 Vertical grade 8.34E-09 4.67E-09 0.037 Total right shoulder width -1.09E-08 2.46E-09 0.000 Speed limit 3.81E-08 1.83E-09 0.000 Speed limit squared -2.62E-10 4.45E-11 0.000 AADT per lane 1.09E-11 5.77E-12 0.030 Indicator for presence of median -2.22E-07 2.49E-08 0.000 Indicator for interstate highway -9.88E-08 2.15E-08 0.000 Indicator for non-interstate freeway -1.86E-07 3.64E-08 0.000 Indicator for rolling terrain 4.91E-08 1.16E-08 0.000 Indicator for mountainous terrain 1.31E-08 3.73E-09 0.000 Indicator for rural -4.11E-08 1.19E-08 0.000 Indicator for 2- or 3-lane highway -7.05E-08 4.24E-09 0.000 Indicator for 4-, or 5-lane highway 1.07E-08 5.02E-09 0.017 Adj. R-sqrd. 0.962 Number of observations 714 clusters Note: The coefficients in this table should be multiplied by VMT in order to refer to crash count effects. As presented, they serve as crash rate coefficient estimates. According to these results, crash rates rise in a concave fashion with speed limits, in a fashion and with coefficients very similar to those obtained in section 4.3.1âs models. Of course, since the requirement of unchanging design attributes eliminated many sites from consideration, this analysis is based on far fewer data points than the analysis described in section 4.3.1 (which essentially found a slight increase in crash counts and rates with speed limit, up to a point). This model can also be used to directly estimate the crash rate increase associated with a 10 mi/h speed limit increase. Given an average road segment in the dataset, the total crash rate is estimated to rise by 2.90% following a speed limit increase from 55 to 65 mi/h. This estimate is very close to the 3.29% increase found, using a different model specification, in section 4.3.1.3. Again, roughly speaking the result is that a 3% increase in total crash rates is associated with a 10 mi/h increase in speed limit. From these before-after results, several design attributes appear to have a statistically significant effect on changes in crash rates. For example, segments with horizontal curves tend to experience more crashes than tangent segments, everything else constant. Presence of a grade tends to increase crash rates, while the presence of a median helps to reduce crash rates. As
107 before, roadways with 4 or 5 lanes experience the highest crash rates, while roadways with 2 or 3 lanes are estimated to have the lowest crash rates. More traffic (or AADT per lane) is associated with a higher crash rate. Based on calculations involving the parameter estimates and average control variable values of Table 4-24, speed limits, right shoulder width, degree of curvature and presence of a median are the most important factors affecting crash frequency. For example, a 10 ft increase in shoulder width is expected to result in a total crash rate reduction of 4.49%. And the addition of a median, other things equal, is expected to reduce crash rates by a sizable 9.0%. These values are similar to those for the models of crash counts (Table 4-20). A summary of results from both sets of crash count models is presented following the discussion of crash severity models (using the HSIS segment-based datasets), in Tables 4-26 and 4-27. In general, the estimates are highly similar across models. Tables 4-26 and 4-27 allow one to appreciate the effects of variables on crash severity as well as crash frequency. In addition to the models of total crash counts discussed previously, the project also estimated models of crash count by crash and injury severity. These latter models proved to be unsatisfactory, most likely because the dependent variables do not satisfy the distribution assumptions of least squares regression. Similarly, the project also specified and estimated models in which speed limits were interacted with other explanatory variables. Most of the interaction terms in these models were not statistically significant, and the squared speed limit term was dropped due to collinearity. Comparing the model of crash count changes discussed in this section with the model of crash counts discussed in the preceding section, it can be seen that the estimated coefficients are consistent in terms of sign, but vary somewhat in magnitude. Some variables, such as shoulder width and squared speed limit, are statistically significant in the basic crash count model but not in the crash count change model. However, the crash count change model addresses the issue of potential correlations between speed limits and omitted variables. For this reason, the results of the present model of crash count changes are preferred to those of the basic crash count model. 4.4 Injury Severity Models Injury severity models are concerned with predicting the distribution of injuries by severity, given that a crash has already occurred and persons are involved. To investigate the factors affecting injury severity, the project applied standard (homoscedastic) ordered logit as well as heteroscedastic ordered logit regression models for analysis of two key datasets: ⢠The Washington occupant-based database (section 4.4.1), and ⢠The National Automotive Sampling Systemâs Crashworthiness Data System (NASS CDS) (section 4.4.2). The first of these two datasets is particularly rich in roadway design attributes. Moreover, it ties clearly to the crash frequency models (as developed in section 4.3). The latter offers a much more comprehensive sample of crashes, by relying on a national data base. It also controls for vehicle weight (and type), which is a valuable addition to such models. Both models offer very similar results with respect to the impacts of speed limits. However, both are cross-sectional in
108 nature and may not provide the most appropriate picture of actual driver responses to (and thus crash injury outcomes following) changes in speed limits. The ordered logit (OL) specification is an appropriate approach when the outcome being modeled can be naturally represented by an ordered sequence of discrete values. For example, the occupant of a crash may experience no injury, minor injury, severe injury or death. Heteroscedasticity recognizes variance in the latent error term, allowing for more behavioral flexibility. The datasets and the model results are discussed below. 4.4.1 Heteroscedastic Ordered Logit Model of Crash Severity Using HSIS Data 4.4.1.1 Data Preparation This analysis used the disaggregate Washington State occupant-based crash datasets from 1993 to 1996. Descriptions and summary statistics of all variables can be found in Table 4-25. Table 4-25 â Summary Statistics for the HSIS Crash Severity Dataset Description of Variables of Interest Min Max Mean Std. Dev Injury severity: 1=no injury; 2=possible injury; 3=non-disabling injury; 4=disabling injury; 5=fatal 1 5 1.462 .8044 Roadway Design Features Horizontal curve length (ft) 0 12683 391.9 784.5 Degree of curvature (°/100ft) 0 23.97 .8028 1.722 Vertical curve length (ft) 0 6700 523.4 547.1 Vertical grade (%) 0 11.11 1.724 1.577 Total right shoulder width (ft) 0 52 11.52 8.011 Number of lanes 2 9 4.310 2.132 Presence of median (1=median, 0=no median) 0 1 .5628 .4960 Speed limit (mi/h) 25 65 54.67 6.053 Road Use, Location & Terrain Annual Average Daily Traffic (AADT) per lane 47.5 48251 11970 9366 Indicator for rural: 1=rural; 0=otherwise 0 1 .3700 .4828 Indicator for rolling terrain: 1=rolling terrain; 0=otherwise 0 1 .1932 .3948 Indicator for mountainous terrain: 1=mountainous terrain; 0=otherwise 0 1 .0290 .1679 Road Class & Access Control Indicator for interstate: 1=interstate; 0=otherwise 0 1 .4104 .4919 Indicator for limited access: 1=limited access; 0=otherwise 0 1 .6313 .4825 Road Surface Condition & Light Condition Indicator for dry road surface condition: 1=dry; 0=otherwise 0 1 .6380 .4806 Indicator for snow road surface condition: 1=snow; 0=otherwise 0 1 .0395 .1948 Indicator for ice road surface condition: 1=ice; 0=otherwise 0 1 .0700 .2551 Indicator for wet road surface condition: 1=wet; 0=otherwise 0 1 .2525 .4344 Indicator for daylight: 1=daylight; 0=otherwise 0 1 .6919 .4617
109 Seat Position Indicator for driver: 1=driver; 0=other passengers 0 1 .6955 .4602 Indicator for front passenger: 1=front passengers; 0=otherwise 0 1 .1926 .3943 Indicator for rear passenger: 1=rear passengers; 0=otherwise 0 1 .0957 .2942 Restraint Use & Residential Distance to Where Crashes Occurred Indicator restraint use: 1=no restraints used; 0=otherwise 0 1 .0686 .2528 Indicator for residents within 15 miles; 1=residents within 15 miles; 0=otherwise 0 1 .7023 .4573 Driver Gender, Alcohol Consumption & Others Indicator for female: 1=female; 0=otherwise 0 1 .4099 .4918 Indicator for if the driver had been drinking (HBD) prior to a crash: 1=HBD; 0=otherwise 0 1 .0642 .2451 Number of vehicles involved 1 10 2.075 .8301 Indicator for year 1993: 1=year 1993; 0=otherwise 0 1 .2342 .4235 Indicator for year 1994: 1=year 1994; 0=otherwise 0 1 .2531 .4348 Indicator for year 1995: 1=year 1995; 0=otherwise 0 1 .2440 .4295 Indicator for year 1996: 1=year 1996; 0=otherwise 0 1 .2687 .4433 Number of Observations 197376 4.4.1.2 Model Specification The ordered logistic model is formally specified as follows (Greene, 2000): iii XY εβ +â²=* (1) where ni K,2,1= designates an observation (occupant), *iY is a latent continuous measure of injury severity for occupant i , iX is a vector of occupant i characteristics relevant in explaining the injury severity, β is a vector of parameters to be estimated, and iε is an unobservable error term, assumed to be identically and independently distributed as a logistic random variable. The observed, discrete severity level variable iY can be computed using the following equation: * 1 * 1 2 * 2 3 * 3 4 * 4 1 if 0 no injury 2 if possible injury 3 if non-disabling injury 4 if disabling injury 5 if fatal i i i i i i Y Y Y Y Y Y µ µ µ µ µ µ µ µ ⧠⤠=⪠< â¤âªâª= < â¤â¨âª < â¤âª >âªâ© (2) where 1µ is a threshold value fixed at 0, and 2µ , 3µ and 4µ are threshold parameters to be estimated. The probabilities corresponding to each discrete crash severity can be obtained via the following equation:
110 ( ) ( ) ( ) ( ) * 1 1 1 ( ) ( )i j i j i j i i j i j i j i P Y j P Y P ε X β P ε X β F X β F X β µ µ µ µ µ µ â â â = = < ⤠Ⲡâ²= ⤠â â ⤠â â² â²= â â â (3) where ( )F â represents the standard logistic distribution function, and 1,2, ,5j = K . For injury severity levels (Yi) of 1 or 5, extreme thresholds 0µ and 5µ apply in this equation. These are negative and positive infinity, respectively, representing the two tails of the logistic distribution. The log-likelihood function can be constructed as follows. ( ) ( ){ }5 1 1 1 ln n j i j i i j LogL F X β F X βµ µ â = = â¡ â¤â² â²= â â â⣠â¦ââ (4) The log-likelihood in Equation (4) is maximized with respect to all parameters ( β , 2µ , 3µ and 4µ ) to obtain maximum likelihood estimates (MLE) of the parameters. If error terms are heteroscedastic, the assumption of constant error term variance fails. The error term distribution then becomes ( )2~ 0,i iFε Ï , and the log-likelihood function becomes: 5 1 1 1 ln n j i j i i j i i X β X β LogL F F µ µ Ï Ï â = = ⧠â«â² â²â¡ â¤â ââ â â â⪠âª= â⨠â¬â¢ â¥â â â ââ â â â ⪠âªâ£ â¦â© âââ (5) Here 2iÏ is parameterized in terms of a set of variables iZ and an associated parameter set γ . A log-linear specification is commonly used to ensure positive 2iÏ . Thus, the following was used: ( ) ( ) 11 exp( )F x x â= + â (6) ( )( )22 expi iZÏ Î³= (7) Note that a standard OL model, which assumes homoscedasticity, restricts γ to 0 and 2iÏ to 1 for all occupants.34 In contrast, HOL models allow the unobserved factors to vary, providing greater flexibility and realism. As an example of the modeling advantages provided by this flexibility, consider modeling the injury severity properties of speed limits. Roadways with higher speed limits usually are built to higher design standards, which may help protect occupants in a crash; but higher speeds add energy to crashes, resulting in more severe injuries, everything else constant. The combination of these two effects may result in greater uncertainty regarding crash outcomes. In this way speed limits may contribute to higher variance of the unobserved error terms in the ordered logit models, a feature permitted by the HOL specification. 34 If the variance of the random error component were not specified, a second threshold value would require specification. If the modelâs constant term were set to zero, no threshold terms would be specified. Such specifications permit statistical identification of model parameters.
111 4.4.1.3 Model Estimation and Analysis An HOL regression model was estimated using the Washington State occupant data for years 1993 through 199635, and results are shown in Table 4-26. The table includes an initial model as well as a final model, in which explanatory variables not exhibiting statistical significance at the 0.1 level have been removed via a process of step-wise deletion (Greene, 2002). Variables of every type were informative in the final model. Injuries on sharper horizontal curves were found to be more severe, while injuries on steeper vertical curves were found to be less severe.36 Other things equal, crashes on access controlled highways tend to be less severe. Linear and squared speed limit terms serve as key explanatory variables in the heteroscedastic models. Both linear and squared speed limit terms are highly statistically significant in the base model of latent injury severity (Y*), and a linear speed limit term is statistically significant in the model of variance. The positive signs suggest that higher speed limits tend to be associated with higher variations in the latent injury severity measure. However, there is a concave effect, due to the negative coefficient on the square speed limit term. Taking all this into account, the probability of disabling injury and death are estimated to be highest when the speed limit is 79 mi/h. A similar result is found when using the NASS occupant data, as discussed below in section 4.4.2. Note, however, that these values should not be taken literally, since they involve extrapolation beyond the range of the estimation dataset. These results were used to predict percentage changes in the probability of experiencing different injury severities following a speed limit change, given that a crash occurs. Results are shown in Table 4-27 for a number of before/after speed limits, including some (e.g. 50 mi/h to 70 or 75 mi/h) that would not often occur in practice. For more typical speed limit increases, increases in the fatality probability in the range of 20 to 30% are predicted. This does not mean that the total number of predicted fatalities will increase by 20 to 30%; rather, it means that that if a crash occurs, the probability of a resulting fatality increases by that amount. To compare these results with the crash occurrence models presented previously, consider a segment of highway having the same âaverageâ characteristics as discussed in section 4.3.1. For a speed limit increase from 55 mi/h to 65 mi/h, the basic crash count model presented in section 4.3.1 predicts a 3.29% increase in the crash rate. According to Table 4-27, if the speed limit increases from 55 to 65 mi/h, the probability of fatal injury would rise 24%; the corresponding probability changes for other injury severity levels would be 8.46% (disabling injury), 4.77% (non-disabling injury), -0.14% (possible injury) and 5.23% (no injury). 35 An HOProbit model was run as well, and the estimator associated with speed limit was also positive in the model of error-term variance, but it was not statistically significant. Because the speed limit variable did not appear in the final model's variance specification, the maximum crash severity was estimated to occur at 63 mph. In order to remain consistent with the NASS work that follows here, the HOL specification was chosen. 36 The dataset includes segments with various grades, but does not indicate if a crash occurred on the uphill or downhill direction. It may be that vehicles going uphill are slowed enough that the reduction in severity more than compensates for the downhill severity increases that one might expect a priori. Actual speed data was not available.
112 Table 4-26 â Heteroscedastic Ordered Logit Regression Model of Occupant Injury Severity â Washington HSIS Data Initial Model Final Model Coeff. Std.Err. t-ratio P-value Coeff. Std.Err. t-ratio P-value Latent Injury Severity Measure Intercept -4.583E+00 6.292E-01 -7.283 0.000 -3.765E+00 2.455E-01 -15.34 0.000 Roadway Design Features CURV_LENGTH -1.798E-05 1.168E-05 -1.539 0.124 -1.733E-05 8.462E-06 -2.048 0.041 DEG_CURVE 7.465E-03 6.347E-03 1.176 0.240 1.059E-02 3.821E-03 2.771 0.006 VCUR_LENGTH -3.920E-05 1.758E-05 -2.230 0.026 -2.855E-05 1.195E-05 -2.389 0.017 PCT_GRADE -6.597E-03 5.414E-03 -1.218 0.223 -7.276E-03 3.140E-03 -2.317 0.021 RSHLDRWIDTH 3.065E-04 1.273E-03 0.241 0.810 NUMLANES -4.686E-03 6.960E-03 -0.673 0.501 MEDIAN 1.110E-01 4.233E-02 2.622 0.009 6.228E-02 2.154E-02 2.891 0.004 SPDLMT 9.714E-02 1.338E-02 7.261 0.000 8.327E-02 8.930E-03 9.325 0.000 SPDLMTSQ -7.933E-04 1.252E-04 -6.339 0.000 -6.826E-04 8.993E-05 -7.590 0.000 Road Use, Location & Terrain AADTPERLANE 9.389E-06 2.387E-06 3.933 0.000 7.033E-06 1.089E-06 6.460 0.000 RURAL 1.222E-01 3.588E-02 3.406 0.001 9.028E-02 2.056E-02 4.392 0.000 MOUNTAINOUS -2.227E-01 8.410E-02 -2.648 0.008 -1.610E-01 3.992E-02 -4.034 0.000 ROLLING -2.399E-03 2.321E-02 -0.103 0.918 Road Class & Access Control INTERSTATE -4.995E-02 3.874E-02 -1.289 0.197 -3.744E-02 1.799E-02 -2.081 0.037 LIMTEDACCESS -1.451E-01 4.191E-02 -3.461 0.001 -1.046E-01 2.282E-02 -4.583 0.000 Road Surface Condition & Light Condition SNOW -3.686E-01 8.812E-02 -4.183 0.000 -2.812E-01 4.373E-02 -6.432 0.000 ICE -5.964E-02 3.804E-02 -1.568 0.117 -4.667E-02 2.777E-02 -1.681 0.093 WET 7.373E-02 2.158E-02 3.416 0.001 5.639E-02 1.285E-02 4.389 0.000 DAYLIGHT -9.105E-02 2.392E-02 -3.807 0.000 -6.978E-02 1.341E-02 -5.205 0.000 Seat Position DRIVER -2.338E-02 1.852E-02 -1.263 0.207 PASSENGERREAR -4.087E-01 8.264E-02 -4.946 0.000 -2.990E-01 2.658E-02 -11.25 0.000 Restraint Use & Residential Distance to Crash Site RESTUSE 1.733E+00 3.219E-01 5.384 0.000 1.322E+00 6.558E-02 20.16 0.000 RESID15M 2.648E-01 5.294E-02 5.002 0.000 2.015E-01 1.618E-02 12.46 0.000 Driver Gender, Alcohol Consumption & Others FEMALE 7.484E-01 1.391E-01 5.379 0.000 5.732E-01 2.910E-02 19.69 0.000 DRINKING 7.727E-01 1.464E-01 5.276 0.000 5.881E-01 3.623E-02 16.23 0.000 YEAR1994 7.292E-02 2.546E-02 2.863 0.004 4.235E-02 1.377E-02 3.075 0.002 YEAR1995 3.506E-02 2.352E-02 1.491 0.136 YEAR1996 -8.752E-02 3.008E-02 -2.909 0.004 -8.162E-02 1.255E-02 -6.504 0.000
113 Heteroscedastic Ordered Logit Regression Model of Occupant Injury Severity (Contâd) Initial Model Final Model Coeff. Std.Err. t-ratio P-value Coeff. Std.Err. t-ratio P-value Variance of Latent Injury Severity Measure CURV_LENGTH 1.566E-05 5.280E-06 2.965 0.003 1.877E-05 4.803E-06 3.908 0.000 DEG_CURVE 4.214E-03 3.107E-03 1.356 0.175 VCUR_LENGTH 4.167E-05 7.787E-06 5.352 0.000 4.053E-05 7.509E-06 5.398 0.000 PCT_GRADE -2.738E-03 2.622E-03 -1.044 0.296 RSHLDRWIDTH 1.617E-03 7.274E-04 2.223 0.026 1.641E-03 5.253E-04 3.124 0.002 NUMLANES -2.785E-02 3.887E-03 -7.165 0.000 -2.931E-02 2.537E-03 -11.55 0.000 MEDIAN -1.715E-02 1.766E-02 -0.971 0.332 SPDLMT 1.563E-02 7.301E-03 2.140 0.032 5.618E-03 9.207E-04 6.102 0.000 SPDLMTSQ -9.421E-05 7.295E-05 -1.291 0.197 AADTPERLANE -1.742E-05 7.868E-07 -22.14 0.000 -1.717E-05 6.750E-07 -25.44 0.000 RURAL 7.714E-02 1.257E-02 6.135 0.000 8.026E-02 1.206E-02 6.654 0.000 MOUNTAINOUS 1.910E-02 2.876E-02 0.664 0.507 ROLLING 1.259E-02 1.065E-02 1.182 0.237 INTERSTATE 7.069E-03 1.923E-02 0.368 0.713 LIMTEDACCESS 3.103E-02 1.416E-02 2.191 0.028 2.351E-02 1.258E-02 1.869 0.062 SNOW -5.448E-02 2.274E-02 -2.396 0.017 -5.375E-02 2.251E-02 -2.388 0.017 ICE -2.759E-02 1.621E-02 -1.702 0.089 -2.639E-02 1.612E-02 -1.637 0.102 WET -7.445E-02 9.099E-03 -8.183 0.000 -7.395E-02 9.070E-03 -8.153 0.000 DAYLIGHT -1.915E-02 8.552E-03 -2.239 0.025 -1.879E-02 8.545E-03 -2.199 0.028 DRIVER 1.854E-02 9.373E-03 1.978 0.048 1.123E-02 7.630E-03 1.472 0.141 PASSENGERREAR 3.962E-02 1.586E-02 2.497 0.013 3.474E-02 1.542E-02 2.253 0.024 RESTUSE 1.600E-01 1.166E-02 13.73 0.000 1.590E-01 1.163E-02 13.67 0.000 RESID15M -8.052E-02 9.355E-03 -8.607 0.000 -8.041E-02 9.203E-03 -8.738 0.000 FEMALE -1.225E-01 8.098E-03 -15.12 0.000 -1.238E-01 8.062E-03 -15.36 0.000 DRINKING 2.060E-01 1.405E-02 14.66 0.000 2.066E-01 1.404E-02 14.71 0.000 YEAR1994 -2.909E-02 1.101E-02 -2.643 0.008 -2.456E-02 9.225E-03 -2.663 0.008 YEAR1995 -3.736E-02 1.141E-02 -3.275 0.001 -2.793E-02 8.043E-03 -3.473 0.001 YEAR1996 -2.963E-03 1.166E-02 -0.254 0.799 Thresholds Mu( 1) 1.442E+00 2.672E-01 5.398 0.000 1.099E+00 5.220E-02 21.05 0.000 Mu( 2) 3.988E+00 7.390E-01 5.397 0.000 3.038E+00 1.447E-01 21.00 0.000 Mu( 3) 7.145E+00 1.325E+00 5.394 0.000 5.442E+00 2.618E-01 20.79 0.000 #Observations 197349 197349 Log-L at Convergence -166823 -166829 Log-L at Constant -176596 -176596 LRI 0.05534 0.05531
114 Table 4-27 â Effect of Speed Limit on Occupant Injury Severity â Washington HSIS Data Percentage Change in Probability Speed Limit Before Change Speed Limit After Change No Injury Possible Injury Non- incapacitating Injury Incapacitating Injury Killed 50 mi/h 70 mi/h 0.40% -10.08% -2.47% 18.25% 54.94% 55 mi/h 65 mi/h 5.23% -0.14% 4.77% 8.46% 24.18% 55 mi/h 70 mi/h 2.56% -7.95% -4.01% 9.19% 32.95% 60 mi/h 70 mi/h 3.14% -5.52% -3.98% 3.58% 17.63% 60 mi/h 75 mi/h 6.63% -8.45% -7.55% 2.22% 22.97% 65 mi/h 70 mi/h 2.22% -2.87% -2.61% 0.67% 7.06% 65 mi/h 75 mi/h 5.68% -5.89% -6.23% -0.65% 11.92% Note: Probabilities are calculated while evaluating all other variables at their average values. In this context, an average roadway section refers to a section with 2°/100ft degree of curvature (392ft), 2% vertical grade (523ft), on a four-lane divided rural interstate highway, with 10 ft shoulder width, and carrying 6,000 AADT per lane in the year 1996. The crash occurred on a dry road section during daylight hours. The average occupant is a male driver using a restraint, legally sober and driving within 15 miles of his residence. Table 4-28 â Effect of Speed Limit on Injury Rates with the Three Scenarios in Section 4.3.1.3 â Washington HSIS Data Change in injury rates (per 100 million VMT) Speed Limit Before Change Speed Limit After Change No Injury Possible Injury Non-incap. Injury Incapacitating Injury Killed 45 mi/h 60 mi/h 2.65 1.83 7.18 4.56 1.19 50 mi/h 65 mi/h 5.23 0.94 4.39 3.45 1.06 55 mi/h 70 mi/h 3.25 0.09 3.23 2.93 0.94 Note: Crash rates are calculated while evaluating all other variables at their average values. In this context, an average roadway section refers to a section with 2°/100ft degree of curvature (392ft), 2% vertical grade (523ft), on a four-lane divided rural interstate highway, with 10 ft shoulder width, and carrying 6,000 AADT per lane in the year 1996. The crash occurred on a dry road section in daytime. The results are quite stable, however, and these percentages are very similar for other roadway characteristics.37 4.4.2 Heteroscedastic Ordered Logit Model of Injury Severity Using NASS CDS Data In contrast to the data used in the preceding section, data here come from roadways of all speeds across the U.S. The data do not contain as many design variables as the Washington State HSIS, but do include vehicle weight and type. Vehicle type is a proxy for a variety of structural factors that can affect crash dynamics and their repercussions on vehicle occupants. Moreover, the kinetic energy released in a crash is directly proportional to a vehicleâs weight. Vehicle weight information, however, is not recorded in most crash datasets, so this application is rather unusual. Model specifications are the same as those in section 4.4.1, and the speed-limit results are very similar. However, observational weights are used here, to reflect underreporting of crashes and a more nationally representative distribution of the NASS sample data. Moreover, two- and one- vehicle crashes are analyzed separately. These data and their model results are discussed below. 37 Note: Tables 4-27 and 4-28 only present the percentage changes in probability (or crash rate) based on the estimated models. The numbers in the two tables are for illustration only. Moreover, in the datasets there is no speed limit above 70 mi/h, so the 75 mi/h cases are an extrapolation.
115 4.4.2.1 Data Preparation The estimation dataset was developed using the National Automotive Sampling Systemâs Crashworthiness Data System (NASS CDS) for the years 1998 through 2001. The NASS CDS collects crash data in 24 areas (also called primary sample units, or PSUs) in 17 states in the U.S. All crashes included in the NASS CDS are police reported, involved property damage and/or personal injury, and resulted in at least one towed passenger car or light truck or van. Data are sampled in a stratified fashion, first among PSUs, then among police jurisdictions, and lastly among reported crashes (NHTSA 2000b). The crashes in the dataset represent just 0.05 percent of all police-reported crashes in the U.S, which is less than most other nationally collected crash datasets. However, the dataset is reasonably representative, in the sense that it considers all but the most minor crash severities, on all roads, and in a representative sample of geographic units. Note that the analysis described here considered all crashes in the dataset, and did not filter out those occurring on roads with speed limits below 55 mi/h. Each observation in the sample data is given a population expansion factor called a Ratio Inflation Factor (RIF), which is the inverse of the probability of selecting that crash from crashes nationwide. These weights are estimated by NASS researchers based on a three-stage sampling method. It is important to note that CDS data, like those in most crash datasets, are not totally unbiased with respect to crash severity. More severe crashes are more likely to be reported and thus recorded. The RIFs are supposed to reflect a crashâs probability of selection and so to account for selection biases, but some uncertainty remains. Moreover, different PSUs have different criteria for reporting their crash data (such as a minimum crash cost or severity). This causes some geographic heterogeneity in the data. Nonetheless, among all available datasets, the NASS CDS is very appropriate for this study because of its comparatively unbiased (i.e., national in nature) sample. Moreover, it offers detailed information on vehicle weight, which is a valuable variable to consider. Information on vehicles and occupants was merged in order to produce an occupant-based dataset. There were 18,609 complete occupant observations for two-vehicle crashes and 7,628 for one-vehicle crashes. These represented 53.6 percent and 77.8 percent of the NASS CDS sample data for such crash occupants, respectively. The dependent variable, injury severity, was missing in 6,036 occupant observations, accounting for many of the invalid observations. Other variables missing in significant numbers included occupant age and gender, seat belt usage, vehicle curb weight, occupant seat type, and weight of the collision partner. Less severe injuries and passenger cars as collision partners were slightly under-represented in the data analyzed here. Bucket seat types were over-represented in both models. Furthermore, because the NASS CDS does not provide curb weights for medium and heavy-duty trucks, these were assumed to weigh 25,000 lbs. Any overall bias in this assumption will be reflected in the indicator variable used for medium and heavy trucks in the model specification. Table 4-29 provides the definitions and summary statistics of variables in the estimation dataset.
116 4.4.2.2 Model Specification The injury severity model developed here is based on a heteroscedastic ordered logit (HOL) model specification (Alvarez and Brehm, 2002), as described in section 4.4.1.2. However, since the NASS data differ from the Washington case, there are a few distinctions. One is the use of observation-level weight factors, which results in the following likelihood function: 1 1 1 ijwJ n j i j i j i i i x x L F F µ β µ β Ï Ï â = = â ââ ââ â â â= ââ ââ â â ââ ââ â â â â â ââ (5) Here ijw is the weight or expansion factor for the thi observation (i.e., occupant) experiencing injury severity level j . (Sample unit expansion factors are provided in the NASS CDS dataset, and these recognize that certain crashes are relatively underreported.38) For the model used in this analysis of the NASS data, the variance is parameterized as a function of speed limit, vehicle type and vehicle curb weight (rather than all potential variables, as done in the analysis in section 4.4.1 of the Washington data [which lack vehicle weight information]). Incorporation of speed limit as an explanatory variable in the variance specification is based on O'Donnell and Connorâs (1996) similar use of travel speed (or an officerâs estimate of the vehicleâs speed, before the collision, and thus a variable that is missing in most crash observations used here). Vehicle type and weight are included because they represent many unobserved vehicle features (such as stiffness and structure) and can offer new insights (since they are rarely controlled for). Another distinction is that the NASS CDS occupant-level observations were characterized by number of involved vehicles; and severity models for single-vehicle and multi-vehicle crashes were run separately, to observe whether that distinction had any effect on predicted outcomes. Indeed it did, as discussed below. 4.4.2.3 Model Estimation and Analysis Table 4-30 provides HOL and OL estimation results for one-vehicle and two-vehicle collisions separately. Linear and squared speed limit terms serve as key explanatory variables in these models. It can be seen that both the linear and squared speed limit terms are highly statistically significant for *y (the latent injury severity measure), but that individually they do not have statistically significant effects on its variance. This does not necessarily mean that speed limits have no overall effect on crash severity variance, but only that the speed limit-related variables in the particular specification considered here are not individually significant. In fact, they have practically significant effects that are evident in the estimates of crash severity. In the case of one-vehicle crashes, the probability of injury and death are estimated to be highest when the speed limit is 60 mi/h. However, in two-vehicle crashes, roads with higher speed limits have a higher proportion of fatal crashes. Taking into account the relative proportion of one- and 38 Strictly speaking, the observation weights are crash-based. Applying these weights to observations of occupant injury severity is not completely correct, but is nonetheless considered a reasonable approximation.
117 two-vehicle crashes, the overall effect of increasing speed limits is to deteriorate safety performance by increasing the probability of more severe crashes. Zhang et al. (2000), Krull et al. (2000) and Khattak et al. (2002) all found that higher speed limits are associated with more severe injuries. The present work shows results consistent with theirs. The overall effect of speed limit changes on injury severity estimates is shown in Table 4-31. Focusing on typical speed limit increases, the percentage changes in proportion of fatal injuries are estimated to range from 31% (for a 65 to 70 mi/h speed limit increase, in the case of an âaverageâ NASS observation) to 110% (for a 55 to 70 mi/h speed limit increase). These same estimates range from 12% to 55% for the results obtained with the HOL model of Washington HSIS data, as shown in Table 4-27. The model estimated using NASS data predicts uniformly much higher incapacitating injury and fatality impacts than the one estimated from HSIS data. This may be due to the NASS database including roadways of all levels of speed limit, rather than focusing only on high-speed roadways. By covering a greater range of roadway types, the model may be less accurate in predictions at extreme speed limit levels, such as high speed cases. Considering that the crash rate itself increases with a speed limit increase (a 2.9% to 3.3% increase is associated with a 10 mi/h speed limit increase; see section 4.3), overall fatality rates are predicted to rise by slightly higher percentages than those shown in Tables Table 4-27 and Table 4-31. The association between speed limit and injury severity dominates the overall result. However, as alluded to earlier, both databases for the severity analyses are cross-sectional in nature and therefore cannot really replicate the severity consequences of speed limit changes. As discussed in section 4.2.3, driver responses to speed limit changes are relatively moderate (e.g., 3 mi/h for a 10 mi/h speed limit change) when compared to a cross-sectional examination of speeds on roadways whose limits have not changed (e.g., 6 mi/h for a 10 mi/h limit increase). If actual speed choice responses are half those one would expect from an examination of cross- sectional data, it is very possible that the actual percentage changes in severe crash outcomes would be less than half those predicted (in Table 4-27 and Table 4-31) due to the convex nature of the (estimated) severity relationship and speed limits.
118 Table 4-29 â Summary Statistics of HOL Injury Severity Model Data â NASS CDS Data One-vehicle Crashes Two-vehicle Crashes Variable Variable Description Weighted Mean Weighted Std. Dev. Weighted Mean Weighted Std. Dev. Vehicle Weight and Type #CURBWGT Curb weight of the vehicle, in 100 lbs 31.675 7.204 30.395 7.226 #CURBWGTSQD Square of vehicle curb weight, in 10000 lbs2 1055 536 976 522 #VEHAGE Vehicle age, in years 7.298 6.545 6.656 5.011 CAR 1 if the vehicle is a CAR; 0 otherwise Base variable for vehicle type #MINIVAN 1 if the vehicle is a minivan; 0 otherwise 0.039 0.193 0.087 0.282 #SUV 1 if the vehicle is an SUV; 0 otherwise 0.214 0.410 0.081 0.273 #PICKUP 1 if the vehicle is a pickup; 0 otherwise 0.127 0.333 0.093 0.291 *PNVEHWGT Curb weight of the collision partner, in 100 lbs --- --- 49.155 58.019 *PNVEHWGTSQD Square of the collision partner curb weight, in 10000 lbs2 --- --- 5782 16258 PNCAR 1 if the collision partner is a car; 0 otherwise Base variable for partner vehicle type *PNMINIVAN 1 if the collision partner is a minivan; 0 otherwise --- --- 0.113 0.316 *PNSUV 1 if the collision partner is an SUV; 0 otherwise --- --- 0.081 0.273 *PNPICKUP 1 if the collision partner is a pickup; 0 otherwise --- --- 0.165 0.372 *PNMDTHDT 1 if the collision partner is a medium or heavy-duty truck; 0 otherwise --- --- 0.076 0.265 Seating and Seat Belts BUCKET 1 if the seat is a integral bucket; 0 otherwise Base variable for seat type FOLDINGBUCKET 1 if the seat is a bucket with folding back; 0 otherwise 0.263 0.440 0.253 0.435 BENCHSEAT 1 if the seat of the occupant is a integral bench; 0 otherwise 0.072 0.258 0.077 0.267 SEPBENCH 1 if the seat is a bench with separate cushion; 0 otherwise 0.098 0.297 0.104 0.305 FOLDINGBENCH 1 if the seat is a bench with folding cushion; 0 otherwise 0.165 0.371 0.126 0.332 OTHERSEAT 1 if the seat is pedestal or box mounted; 0 otherwise 0.029 0.169 0.044 0.205 NOBELT 1 if the occupant does not use any belt; 0 otherwise Base variable for seat belt usage LAPSHOU 1 if the occupant uses lap and shoulder belt; 0 otherwise 0.550 0.497 0.545 0.498 OTHEBELT 1 if the occupant uses shoulder only or lap only belt; 0 otherwise 0.204 0.403 0.316 0.465
119 Summary Statistics of the HOL Injury Severity Model Estimation Dataset (Contâd) One-vehicle Crashes Two-vehicle Crashes Variable Variable Description Weighted Mean Weighted Std. Dev. Weighted Mean Weighted Std. Dev. Roadway Design and Environmental Factors GOODWEATHER 1 if the weather is good; 0 otherwise Base variable for weather BADWEATHER 1 if the weather is adverse, including snowy, rainy, foggy and smoky; 0 otherwise 0.215 0.411 0.190 0.392 LIGHT 1 if the light condition is daylight; 0 otherwise Base variable for light condition DARK 1 if the light condition is dark or dawn; 0 otherwise 0.543 0.498 0.265 0.441 #SPDLIMIT Speed limit of the site, in mi/h 44.568 14.415 40.546 10.236 #SPDLIMITSQD Square of the site speed limit, in mi/h2 2194.052 1364.361 1748.772 887.773 NODIVISION 1 if the roadway is two-way yet not divided; 0 otherwise Base variable for road division NONPOSITIVEDIV 1 if the roadway is divided by vegetation, water, trees, embankments, ravine ; 0 otherwise 0.144 0.351 0.222 0.415 POSITIVEDIV 1 if the roadway is divided by manufactured barriers; 0 otherwise 0.125 0.331 0.091 0.287 ONEWAY 1 if the roadway is a one-way road; 0 otherwise 0.070 0.254 0.050 0.217 STRAIGHT 1 if the roadway is straight; 0 otherwise Base variable for horizontal curve CURVRIGHT 1 if the roadway curves right; 0 otherwise 0.161 0.367 0.060 0.237 CURVLEFT 1 if the roadway curves left; 0 otherwise 0.266 0.442 0.052 0.222 LEVEL 1 if the roadway is level; 0 otherwise Base variable for grade UPHILL 1 if the roadway is uphill; 0 otherwise 0.152 0.359 0.171 0.377 DOWNHILL 1 if the roadway is downhill; 0 otherwise 0.303 0.460 0.144 0.351 Occupant Characteristics #AGE Occupant age, in year 27.856 15.952 31.910 18.924 MALE 1 if male; 0 otherwise Base variable for gender FEMALE 1 if female; 0 otherwise 0.384 0.486 0.514 0.500 FRONTLEFT 1 if seated in the driver seat (front left); 0 otherwise Base variable for seat position FRONTRIGHT 1 if seated in the front passenger seat (front right); 0 otherwise 0.208 0.406 0.202 0.401 SECONDLEFT 1 if seated in the second row, left seat; 0 otherwise 0.076 0.264 0.081 0.272 SECONDRIGHT 1 if seated in the second row, middle or right seat; 0 otherwise 0.066 0.249 0.048 0.214 OTHERPOSITION 1 if seated in position other than the above and front left; 0 otherwise (including the third row and outside the pickups) 0.008 0.091 0.010 0.102 Crash Information OTHERIMPACT 1 if the vehicle angle impact other vehicles (or object, for one-vehicle crashes); 0 otherwise Base variable for crash type HEADON 1 if the vehicle crash head-on (or with front end, for one-vehicle crashes); 0 otherwise 0.094 0.291 0.462 0.499 REAREND 1 if the vehicle crash with its rear end; 0 otherwise 0.006 0.076 0.098 0.297 LEFTSIDE 1 if the vehicle is impacted on its left side; 0 otherwise 0.332 0.471 0.190 0.393 RIGHTSIDE 1 if the vehicle is impacted on its right side; 0 otherwise 0.549 0.498 0.169 0.374 * This variable is also used in the heteroscedasticity specification of two-vehicle crashes. # This variable is also used in the heteroscedasticity specifications of two-vehicle and one-vehicle crashes.
120 Table 4-30 â Ordered Logit and Heteroscedastic Ordered Logit Regression Models of Injury Severity â NASS CDS Data One-vehicle Crashes Two-vehicle Crashes HOL OL HOL OL Variable Coef. t-stat. Coef. t-stat. Coef. t-stat. Coef. t-stat. Latent injury severity measure Constant -1.257 -28.144 -2.003 -25.287 12.413 90.678 2.532 64.278 CURBWGT 0.039 17.478 0.038 9.905 -0.614 -135.635 -0.156 -92.983 CURBWGTSQD -4.42E-04 -13.745 -3.87E-04 -7.032 7.27E-03 132.061 1.81E-03 77.166 VEHAGE -8.78E-03 -25.449 -1.47E-02 -23.688 6.87E-02 49.261 1.86E-02 50.019 MINIVAN -0.016 -0.418 0.204 3.591 0.967 29.696 0.327 41.795 SUV -0.180 -43.351 -0.233 -31.328 0.916 35.100 0.321 46.125 PICKUP 0.134 14.792 0.399 24.678 -0.057 -1.753 0.085 11.271 PNVEHWGT --- --- --- --- 0.027 5.888 0.026 32.190 PNVEHWGTSQR --- --- --- --- 2.79E-04 4.503 -1.74E-04 -18.109 PNSUV --- --- --- --- 1.048 55.575 0.258 47.445 PNMINIVAN --- --- --- --- 0.535 26.467 0.084 13.061 PNPICKUP --- --- --- --- 0.400 24.668 0.247 61.330 PNMDTHDT --- --- --- --- -23.010 -8.076 5.186 12.177 FOLDINGBUCKET 0.077 20.112 0.130 18.270 -0.363 -28.260 -0.130 -35.419 BENCHSEAT -0.198 -19.462 -0.396 -21.163 0.082 1.989 0.066 6.362 SEPBENCH 0.214 27.583 0.405 27.795 1.475 56.098 0.448 65.532 FOLDINGBENCH -0.183 -20.939 -0.281 -17.518 -0.437 -13.074 -0.123 -14.306 OTHERSEAT -0.109 -2.510 -0.271 -4.303 -0.023 -0.470 -0.019 -1.614 LAPSHOU -0.728 -204.374 -1.320 -211.569 -2.160 -133.069 -0.627 -141.222 OTHEBELT -0.530 -135.598 -0.953 -135.285 -2.464 -146.551 -0.687 -144.914 BADWEATHER -0.487 -94.221 -0.923 -99.753 -1.539 -117.098 -0.397 -116.589 DARK -0.044 -14.733 -0.061 -11.013 0.714 50.964 0.214 55.364 SPDLIMIT 2.75E-02 45.976 5.62E-02 50.903 -1.76E-01 -45.570 -3.52E-02 -33.491 SPDLIMITSQD -2.16E-04 -32.746 -4.27E-04 -35.555 2.62E-03 56.719 6.23E-04 50.764 NONPOSITIVEDIV 0.283 49.693 0.510 48.301 -0.287 -21.877 -0.078 -21.339 POSITIVEDIV -0.045 -7.380 -0.123 -11.308 -2.486 -106.320 -0.733 -116.048 ONEWAY 0.167 22.520 0.220 16.245 -0.648 -19.070 -0.240 -27.043 CURVRIGHT 0.169 30.310 0.225 22.272 1.177 46.756 0.359 56.700 CURVLEFT 0.257 59.929 0.446 57.642 1.815 72.514 0.516 82.097 UPHILL 0.051 8.743 0.097 9.008 -0.546 -34.548 -0.141 -33.562 DOWNHILL -0.084 -18.375 -0.136 -15.999 1.111 58.967 0.300 60.230 AGE 8.85E-03 75.534 1.65E-02 75.763 2.39E-02 63.381 7.20E-03 75.162 FEMALE 0.315 131.189 0.604 137.466 1.223 110.979 0.331 108.757 FRONTRIGHT -0.094 -49.763 -0.164 -48.749 0.115 9.844 0.012 3.643 SECONDLEFT -0.376 -42.366 -0.697 -42.843 -1.587 -40.238 -0.438 -43.700 SECONDRIGHT -0.362 -40.971 -0.680 -41.975 -1.655 -30.764 -0.491 -36.499 OTHERPOSITION -0.093 -1.224 -0.159 -1.533 -0.950 -14.921 -0.060 -3.543 HEADON -0.352 -19.637 -0.632 -19.486 -0.561 -22.059 -0.197 -28.856 REAREND 0.266 2.148 0.590 2.258 -1.067 -33.997 -0.320 -38.966 LEFTSIDE -0.129 -7.222 -0.140 -4.341 -0.987 -36.935 -0.299 -42.057 RIGHTSIDE -0.043 -2.398 -0.026 -0.781 -0.648 -24.467 -0.171 -24.703
121 Results of Ordered Logit and Heteroscedastic Ordered Logit Models (Contâd) One-vehicle Crashes Two-vehicle Crashes HOL OL HOL OL Variable Coef. t-stat. Coef. t-stat. Coef. t-stat. Coef. t-stat. Latent injury severity measure variance AGE -2.55E-03 -2.815 --- --- 4.48E-04 0.827 --- --- VEHAGE 3.06E-03 1.119 --- --- 5.26E-03 2.556 --- --- CURBWGT -4.77E-02 -7.726 --- --- 5.81E-02 13.945 --- --- CURBWGTSQD 6.18E-04 6.703 --- --- -7.91E-04 -16.608 --- --- MINIVAN 0.323 3.973 --- --- 7.29E-04 0.017 --- --- SUV 0.134 2.825 --- --- 7.00E-03 0.172 --- --- PICKUP 0.298 5.511 --- --- 0.153 3.609 --- --- SPDLIMIT 8.12E-03 1.692 --- --- 6.53E-03 1.536 --- --- SPDLIMITSQD -6.06E-05 -1.154 --- --- 1.06E-05 0.210 --- --- PARTNERVEHWGT --- --- --- --- -4.80E-03 -1.068 --- --- PNVEHWGTSQD --- --- --- --- 6.87E-05 1.194 --- --- PNSUV --- --- --- --- -5.04E-02 -1.509 --- --- PNMINIVAN --- --- --- --- -0.125 -3.235 --- --- PNPICKUP --- --- --- --- 0.256 7.810 --- --- PNMDTHDT --- --- --- --- -2.931 -1.117 --- --- Thresholds 0µ 0.000 --- 0.000 --- 0.000 --- 0.000 --- 1µ 0.356 23.699 0.650 34.465 4.214 30.234 1.143 71.598 2µ 1.058 28.502 1.926 54.505 7.835 30.974 2.102 84.575 3µ 2.595 25.975 4.659 41.637 21.331 26.034 5.406 45.741 Nobs. 7,564 19,056 LRI 0.241 0.238 0.262 0.256 Table 4-31 â Effect of Speed Limit on Occupant Injury Severity â NASS CDS Data Percentage Change in Probability Speed Limit Before Change Speed Limit After Change No Injury Possible Injury Non- incapacitating Injury Incapacitating Injury Fatality 55 mi/h 70 mi/h -17.2 -2.0 16.3 55.2 110 60 mi/h 70 mi/h -12.4 -2.4 9.9 34.5 67.6 65 mi/h 70 mi/h -6.7 -1.8 4.3 16.1 31.0 Note: Probabilities are calculated while evaluating all other variables at their weighted average values. 4.5 Summary of Analysis Results As the chapter makes clear, the project undertook a large number of traffic safety analyses using a broad range of methods and drawing on a wide variety of data sources. This section summarizes the main technical conclusions regarding the work results, and relates these back to the general framework (described in section 4.1) that guided the development and pursuit of the projectâs research strategy.
122 4.5.1 Speed Choice Models These models were intended to illuminate the relationships between speed limits and driver speed choices, as these are reflected in average vehicle speeds and speed variability. The initial analyses of average speed and speed variability used data from traffic detectors in northwest Washington State (Appendix D). Recall that the traffic detector data used in these analyses were only available at five-minute time aggregations, and that an extensive set of assumptions had to be made in order to develop measures of speed variance from it. In addition, the highway characteristics at all the detector sites were quite similar, making it difficult to identify the effect of specific highway features on speed choice. Because of these factors and perhaps others, the estimated speed choice models proved to be unreliable: application of the model resulted in speed predictions of under 40 mi/h or over 80 mi/h at many sites. The ARIMA intervention analyses of speed limit changes in Washington State (section 4.2.4) had the advantage of being able to use data that included actual (rather than estimated) vehicle speed measurements, although these were accumulated to produce average hourly values. It was based on a comparison of four sites, including two urban and two rural, as well as two that experienced speed limit changes and two that did not. The analysis showed that a 5 mi/h speed limit increase at two sites had the effect of raising average speeds there by around 2 mi/h, and raising the speed variance by significant but different amounts at the two sites. Over the same period, the sites that did not experience a speed limit change exhibited essentially no changes in their traffic speed characteristics. Due to the small sample size, however, it is difficult to justify the application of these results more generally. Analyses of the Southern California crash and traffic datasets compiled by Golob and Recker (section 4.2.2) were useful in highlighting basic design, environmental and traffic factors that correlate with freeway section traffic speed characteristics (average speed and speed variance) within and between lanes. However, since all of the analyzed sections had a 65 mi/h posted speed limit, the analysis was not able to identify the effect of different speed limits on traffic speed characteristics. The analysis of individual vehicle speed data obtained from a small cross-section dataset of radar gun speed measurements on roadways in Austin, Texas (section 4.2.3). This was the only source of individual vehicle speed data available to the project. The analysis identified a number of engineering, environmental and traffic characteristics that influence average speed and speed variance. Comparing different roadway sections in the analysis, it was found that a 10 mi/h difference in speed limits was associated with a roughly 6.5 mi/h difference in average vehicle speeds. A particular highlight of this analysis was its demonstration that the impact of speed limits on vehicle speed variances is, at most, very small. Again, the small sample size limits the broad applicability of these results. It should also be noted that the analyses mentioned in the preceding two paragraphs did not include any segments on which the speed limit changed during the data collection. This limits the extent to which the results obtained (for fixed speed limits) can be extrapolated to situations involving speed limit changes.
123 In this regard, it is interesting that the before-after analysis of vehicle speeds on roads that experience a speed limit change suggests a much more moderate response to the change than does a cross-sectional analysis of speeds on roadways with different limits. The before-after analysis of Washington State roadways, for example, suggests that a 10 mi/h speed limit increase is associated with a 3.4 mi/h average speed increase, whereas the cross-sectional analysis of Austin vehicle speed measurements on segments with different speed limits indicates a 6.5 mi/h difference in average speeds on roadways having a 10 mi/h speed limit difference. The prediction from cross-sectional data is roughly twice as high as that obtained from before-after data. Differences in methods of data collection and processing may also account for part of the discrepancy between the two sets of results: the Washington data was available in the form of speed averages computed from PTR measurements, while the Austin data consisted of radar gun measurements of individual vehicle speeds. 4.5.2 Crash Occurrence Models The results of the project analyses of speed limit effects on crash rates (or counts) suggested only slight impacts. However, these results are not considered to be highly robust. The original analysis was based on disaggregate HSIS crash data from Washington State (Appendix F). Data on total crashes as well as crashes and injuries by severity were analyzed using a variety of generalizations of the basic Poisson regression model, including negative binomial, zero-inflated Poisson and negative binomial, and fixed and random effects Poisson and negative binomial models. However, none of the estimation results for these models could be considered satisfactory as regards their specification validity, intuitiveness and statistical performance. For this reason, the projectâs subsequent analyses of crash occurrence models were based on datasets obtained by clustering HSIS segments over several years of data. The first such analysis estimated fixed and random effects linear regression models of aggregate cluster crash counts against a number of engineering, environmental and traffic use variables (section 4.3.1). This analysis found that, other things equal, the relationship between speed limit and total crash rate is concave, with a maximum around 70 mi/h. (This was the highest observed speed limit, and the model was not extrapolated beyond that value.) However, the effect of speed limits on crashes was weak and, because of the concavity, became even weaker at higher speed limits. A model of crash count changes was specified and estimated using a dataset of clustered Washington State HSIS segment data over a multi-year period that included the NMSL repeal (section 4.3.2). The results of this analysis were generally consistent with those of the preceding crash count analysis. 4.5.3 Injury Severity Models Recall that crash and injury severity models apply when crashes have occurred, and are used to estimate the associated distribution of crash or injury severities.
124 The project used the HSIS data (for Washington State) and the NASS CDS to estimate ordered logit models of injury severity (sections 4.4.1 and 4.4.2). Both models are consistent in that they predict sizeable percentage increases in the rates of incapacitating and fatal injuries following a 10 mi/h or higher speed limit increase. However, the magnitudes of the predicted increases are quite different. For typical speed limit increases, the model developed from Washington State data on high speed roads predicts an increase in fatalities in the range of 7%-39%, while the model estimated from NASS CDS data on all roads predicts increases in the range of 31%-110%. Of the two models, it is likely that the one developed from Washington State HSIS data is more applicable to the analysis of speed change impacts on high-speed roads because the estimation dataset contained only data on such roads. In contrast, the NASS CDS dataset included observations from roads of all types, and data on lower-speed roads may influence model results for high-speed roads, exaggerating the predicted impact of speed limit changes on them. It should also be noted that predictions of injury severity distribution changes following speed limit changes, such as those mentioned above and shown in Tables Table 4-27and Table 4-31, require the application of both speed choice models and injury severity models. The speed choice model was based on cross-sectional data and, as was discussed above, it seems that models estimated from such data may tend to overestimate the speed change impact by a factor of roughly 2 when compared to the results of actual before-after studies on individual roadways. This implies that the predictions of injury severity changes following a speed limit change may be based on estimated average speed differences that are too high. This would, of course, also result in an overestimate of the injury severity impact, perhaps by a factor of more than 2. Focusing on the HSIS-based model, it is natural to ask how its predictions of fatality rate changes following speed limit increases compare with actual experience following the NMSL relaxation and repeal. As has been stressed repeatedly in this report, comparison of aggregate crash statistics is an unreliable method of assessing speed limit change impacts because of the large number of other factors that can (and frequently do) differ between the statistics being compared. This explains why the results of such studies have frequently been inconclusive or contradictory, as discussed in the Chapter 2 literature review. However, it is nonetheless interesting to note that a few studies have found significant increases in fatality rates on high-speed roads following the NMSL relaxation from 55 to 65 mi/h on rural interstates. Using Illinois data, Rock (1995) identified a 40% increase in fatalities on rural highways. Ledolter and Chanâs (1996) similar work with quarterly Iowa data from 1983 to 1991 estimated a 57% increase in fatal crashes on rural interstate highways following the speed limit increase. Brownstone (2002), considering national state-level data by highway type, found that fatality rates on rural interstates increased by 30% following the NMSL relaxation. The corresponding prediction of the HSIS-based model is 24%. Strictly speaking, these values cannot validly be compared, but it is striking that, although the value that we found is slightly lower than those found in the research cited here, these results are all in the same general range. While this is definitely not a validation of the HSIS-based model, it is fair to say that its predictions are roughly consistent with the NMSL relaxation fatality impacts found by the researchers cited above.
