
Appendix A
Evaluation of the Predictive Ecological
Model for the Edwards Aquifer
Habitat Conservation Plan:
An Interim Report as Part of Phase 2
Committee to Review the Edwards Aquifer Habitat Conservation Plan
Water Science and Technology Board
Division on Earth and Life Studies
![]()
THE NATIONAL ACADEMIES PRESS
Washington, DC
www.nap.edu
THE NATIONAL ACADEMIES PRESS 500 Fifth Street, NW Washington, DC 20001
Support for this study was provided by the Edwards Aquifer Authority under Cooperative Agreement No. 13-666-HCP. Any opinions, findings, conclusions, or recommendations expressed in this publication do not necessarily reflect the views of any organization or agency that provided support for the project.
International Standard Book Number-13: 978-0-309-44489-7
International Standard Book Number-10: 0-309-44489-6
Digital Object Identifier: 10.17226/23577
Additional copies of this report are available for sale from the National Academies Press, 500 Fifth Street, NW, Keck 360, Washington, DC 20001; (800) 624-6242 or (202) 334-3313; http://www.nap.edu.
Copyright 2016 by the National Academy of Sciences. All rights reserved.
Printed in the United States of America
Suggested citation: National Academies of Sciences, Engineering, and Medicine. 2016. Evaluation of the Predictive Ecological Model for the Edwards Aquifer Habitat Conservation Plan: An Interim Report as Part of Phase 2. Washington, DC: The National Academies Press. doi: 10.17226.23577.
![]()
The National Academy of Sciences was established in 1863 by an Act of Congress, signed by President Lincoln, as a private, nongovernmental institution to advise the nation on issues related to science and technology. Members are elected by their peers for outstanding contributions to research. Dr. Marcia McNutt is president.
The National Academy of Engineering was established in 1964 under the charter of the National Academy of Sciences to bring the practices of engineering to advising the nation. Members are elected by their peers for extraordinary contributions to engineering. Dr. C. D. Mote, Jr., is president.
The National Academy of Medicine (formerly the Institute of Medicine) was established in 1970 under the charter of the National Academy of Sciences to advise the nation on medical and health issues. Members are elected by their peers for distinguished contributions to medicine and health. Dr. Victor J. Dzau is president.
The three Academies work together as the National Academies of Sciences, Engineering, and Medicine to provide independent, objective analysis and advice to the nation and conduct other activities to solve complex problems and inform public policy decisions. The National Academies also encourage education and research, recognize outstanding contributions to knowledge, and increase public understanding in matters of science, engineering, and medicine.
Learn more about the National Academies of Sciences, Engineering, and Medicine at www.national-academies.org.
![]()
Reports document the evidence-based consensus of an authoring committee of experts. Reports typically include findings, conclusions, and recommendations based on information gathered by the committee and committee deliberations. Reports are peer reviewed and are approved by the National Academies of Sciences, Engineering, and Medicine.
Proceedings chronicle the presentations and discussions at a workshop, symposium, or other convening event. The statements and opinions contained in proceedings are those of the participants and have not been endorsed by other participants, the planning committee, or the National Academies of Sciences, Engineering, and Medicine.
For information about other products and activities of the National Academies, please visit nationalacademies.org/whatwedo.
COMMITTEE TO REVIEW THE EDWARDS AQUIFER HABITAT CONSERVATION PLAN
DANNY D. REIBLE, Chair, Texas Tech University, Lubbock
JONATHAN D. ARTHUR, Florida Department of Environmental Protection, Tallahassee
M. ERIC BENBOW, Michigan State University, East Lansing
ROBIN K. CRAIG, University of Utah, Salt Lake City
K. DAVID HAMBRIGHT, University of Oklahoma, Norman
LORA A. HARRIS, University of Maryland Center for Environmental Science, Solomons
TIMOTHY K. KRATZ, University of Wisconsin, Madison
ANDREW J. LONG, U.S. Geological Survey, Tacoma, Washington
JAYANTHA OBEYSEKERA, South Florida Water Management District, West Palm Beach
KENNETH A. ROSE, Louisiana State University, Baton Rouge
LAURA TORAN, Temple University, Philadelphia, Pennsylvania
GREG D. WOODSIDE, Orange County Water District, Fountain Valley, California
Staff
LAURA J. EHLERS, Study Director
BRENDAN McGOVERN, Senior Program Assistant
ACKNOWLEDGMENTS
This report has been reviewed in draft form by individuals chosen for their diverse perspectives and technical expertise. The purpose of this independent review is to provide candid and critical comments that will assist the institution in making its published report as sound as possible and to ensure that the report meets institutional standards for objectivity, evidence, and responsiveness to the study charge. The review comments and draft manuscript remain confidential to protect the integrity of the deliberative process. We wish to thank the following individuals for their review of this report: James J. Anderson, University of Washington; Alan Hastings, University of California, Davis; Jesse C. Jarvis, University of North Carolina, Wilmington; Kenneth A. Moore, Virginia Institute of Marine Sciences; and Steve Railsback, Lang, Railsback & Associates.
Although the reviewers listed above have provided many constructive comments and suggestions, they were not asked to endorse the conclusions or recommendations nor did they see the final draft of the report before its release. The review of this report was overseen by Patrick L. Brezonik, University of Minnesota, and R. Rhodes Trussell, Trussell Technologies, Inc. They were responsible for making certain that an independent examination of this report was carried out in accordance with institutional procedures and that all review comments were carefully considered. Responsibility for the final content of this report rests entirely with the authoring Committee and the institution.
INTRODUCTION
An ad hoc committee of the National Academies of Sciences, Engineering, and Medicine is in the process of reviewing the many different scientific initiatives under way to support the Edwards Aquifer Habitat Conservation Plan (HCP). The Committee to Review the Edwards Aquifer Habitat Conservation Plan is focusing on the adequacy of information to reliably inform assessments of the HCP’s scientific initiatives, ensuring that these initiatives are based on the best-available science. Relationships among proposed conservation measures (including flow protection measures and habitat protection and restoration), biological objectives (defined by the HCP as specified flow rates), and biological goals (such as maintaining populations of the endangered species) are central to the HCP, and are being evaluated during the Academies review. The study spans from 2014 to 2018 and will result in three reports. At the conclusion of Phase 1, the Committee issued its first report (NRC, 2015), which focused on hydrologic modeling, ecological modeling, water quality and biological monitoring, and the Applied Research Program. The Committee will issue its second report in late 2016 and its third and final report in 2018.
This interim report is part of Phase 2 activities and will be incorporated, as an appendix, into the second report. This interim report focuses on the ecological modeling only and is being provided prior to the issuance of the second report in order for the Committee’s comments (which take the form of conclusions and recommendations) to be considered while the ecological modeling team is still in place. The final version of the ecological model is scheduled for completion by December 2016, roughly the same time as the issuance of the second committee report. The statement of task for Phase 2 of the Academies study is in Box A-1. This interim report addresses the first item and partially the third item in the statement of task, as they relate to the ecological modeling. At the time of this writing, the ecological models were not developed enough to address Task 3 completely, but such an evaluation will appear in the final Phase 2 report.
This review of the ecological modeling is based on many sources, including presentations made to the Committee and written reports. Presentations documenting the progress of the ecological modeling were given to the Committee in February 2014, May 2014, October 2015, and February 2016. The model development team also provided a report titled “Predictive Ecological Modeling for the Comal and San Marcos Ecosystem Project” (BIO-WEST, 2015) just prior to the February 2016 meeting. Members of the model development team have also made themselves available to answer questions from the Committee outside of committee meetings, including as recently as March 2016. The Committee wants to acknowledge the cooperation and openness of the model development team and
the Edwards Aquifer Authority (EAA) to the Committee’s questions and inquiries, as this greatly helped the review process.
This review is organized around the four general topics of (1) modeling objectives and usage, (2) model configuration, (3) model calibration and testing, and (4) model coupling. First, a summary of progress to date is presented for the fountain darter (FD) and submersed aquatic vegetation (SAV) modeling. Then, for the first three topics above, the SAV and FD modeling are discussed separately because these topics apply to the FD and SAV modeling as standalone models. The remaining topic on coupling discusses how the SAV and FD models can be developed to enable them to be run so that the SAV model informs (provides inputs to) the FD model. The final section provides a summary and some overarching thoughts about the progress of the ecological modeling.
PROGRESS TO DATE
The modeling effort has made good progress, and scientifically sound frameworks for both the SAV and FD modeling are in place. However, like all ecological and other types (e.g., groundwater) of modeling, the progression through the development, testing, and usage steps of model-
ing is iterative. Testing often leads to further development as model-data disagreements lead to changes in the model, which is then modified and tested again. Thus, additional effort remains if the ecological model is to be an effective tool for predicting FD and SAV responses to actions that are designed to achieve the HCP’s biological goals and objectives.
Trying several alternatives for the SAV modeling was a strategically and scientifically sound decision. Existing SAV models are not designed to address the specific questions of the HCP, and thus trying multiple approaches to the modeling is appropriate to increase the likelihood of success. Using an individual-based approach for the FD modeling was also sound, since such an approach enables more direct and intuitive representation of how spatial and temporal variation in environmental factors important to FD (including flow) will affect FD growth, mortality, reproduction, and movement and the resulting population dynamics. Ecological models like the SAV and FD models can be difficult to fully document, but based on the December 2015 report (BIO-WEST, 2015), the Committee believes that the model development team is on a good track for providing sufficiently detailed description of the models. Although the SAV and FD models are on the right trajectory, it is too early to provide a conclusive statement about the credibility of the models and their eventual usefulness for the HCP-based analyses because many of the details are not fully worked out yet. This is not unexpected, as part of the Committee’s approach in this review is to provide input during the development process so it can be considered while the modeling is ongoing.
MODELING OBJECTIVES AND USAGE
The goal of the modeling is clear: develop predictive models to evaluate HCP actions on SAV and FD populations [Section 6.3.3 of the HCP (EARIP, 2012); pages 1-2 of BIO-WEST (2015)]. The objectives to achieve this goal have also been well stated in presentations as well as in the modeling report (BIO-WEST, 2015). In this situation, the developers have a very clear purpose for developing the models, and that seems to be well understood by the development team. Part of the objectives is to use these models in exploratory and scenario analyses designed to assess HCP actions. This would include model simulations designed to quantify how different scenarios of spring flows and conservation measures under the HCP would affect SAV biomass and distribution and consequently FD population dynamics. The issues discussed in the sections below relate to the steps taken and decisions made by the model developers in their quest to achieve these objectives.
General Comments
1. A simple one-time transfer of the models from the developers to the EAA should be avoided because this can result in inefficient, and even possibly erroneous, use of the FD and SAV models.
The knowledge, assumptions, and decisions made by the modeling team during model development are important for subsequently using the models in an effective manner. Also, key questions can be more fully addressed, and additional questions can be addressed, by having the ability to make structural changes in the models, rather than being limited to parameter changes or to a small subset of possible changes determined by the development team before a model hand-off. For example, one can envision wanting to know the range of model predictions to altered flows and thus want to allow for variations of the FD movement rules. It is likely that there will be limited options for the user to change the parameters in the movement rules for FD or say, to try different growth formulations for SAV. Further, the user interface will likely limit the user to select from preprogrammed flow time series options (e.g., different years). It will not be long before the users will want to try other flow time series or variations on drought conditions in order to understand the full range of possible SAV and FD responses. Even if the final version of the model makes many parameters and inputs accessible to the user, there will be interest and demands that require structural changes to the models. One example could be relating FD growth to flow (uncoupled in the present model version), which can be easily done, but requires changing the equations themselves within the NetLogo® code. This might be an easy task for the model developers and other experienced modelers, but could be perceived as off limits (thereby limiting the usefulness of the models) or easily done incorrectly by less experienced people unfamiliar with the code.
The situation with these ecological models is the same as with the groundwater, hydraulic, and other models being used by EAA: the FD and SAV models are iteratively improved, and their use requires certain ongoing expertise to be available. A small pool of people is needed to curate the FD and SAV models to ensure they are used effectively and with the proper flexibility to allow examination of questions and incorporation of new data. This pool can involve in-house expertise as well as access to the model developers.
Models such as the SAV and FD models can generate variables (e.g., FD abundances) that can be over-interpreted, such that some caution and “management of expectations” is needed to ensure that the models are used to address appropriate questions and the results are properly interpreted. Factors such as flow can be explicitly or implicitly included in ecological models; both allow for investigation of how changes in the factor affect
FD or SAV, but both also require careful evaluation of how the factor is actually used within the model. For example, if an input is labelled “flow,” simply changing its value and interpreting the results may not reveal what would happen if flow changed in the actual system. Similarly, if there is no input labelled “flow” this does not mean flow effects cannot be examined; for example, changing vegetation coverage in the FD model implies some impact of flow, even if flow is not explicitly included. In this way changing the available inputs that are affected by flow (the implicit approach) allows for scenarios of changed flow regimes to be evaluated. Managed expectations also apply to model output. It is unlikely that simulation runs, while spatially explicit, will provide maps that will directly mimic the actual environment. Interpreting the model output is sometimes appropriate as native units (abundance of FD; biomass of SAV) and in other situations should be interpreted as changes in abundance or biomass from a baseline simulation (a percent change).
Fountain Darter
2. The focus on using the FD model to predict the responses of FD abundance to alternative HCP flow control packages is useful, but there are other uses of such mechanistic models that should be considered.
Two of the most powerful uses of the FD model beyond predicting total abundance are to (1) provide a systematic analysis of what life stages, processes, timing, and spatial areas are important to FD population dynamics; and (2) include explanations of why model responses are predicted (not just the final predictions of abundance). The plan for model usage seems to underplay these uses. The idea of running different flow time series through the model is a good starting point, but stopping there would not utilize the full benefits of having this type of model. Also informative would be to tease apart what aspects of the HCP flows cause the population responses, such as simulating the FD response to synthetic flow time series that systematically vary the pattern, peaks, and troughs of the flows. In addition, all key simulations should be accompanied with explanations as to why the population responses occurred within the model. What changed in FD growth, mortality, reproduction, and movement, by life stage, between the simulations that used two different flow time series? A convenient way to summarize the relatively complicated output of individual-based models is to use life tables and to estimate summary measures from the life tables such as the finite population growth rate (λ) for that year (λ values are reported for some FD model results already), and to perform follow-up simulations that specifically vary what was identified as key changes but to do so in an experimental design. Suppose the altered HCP flows resulted in a 15 per-
cent increase in the FD population adult abundance over the 10 years of the simulation. One should then use the outputs and additional simulations to identify what aspects of the altered flows (e.g., a particular year or sequence of years), and which FD processes and life stages, contributed to the increased population abundance.
A model such as the FD model can also be used very effectively in an “inverse” mode. Simulations can be performed to identify which processes and life stages are sensitive to changes in flows, and then these viewed seasonally and spatially to see how they match up with HCP actions. Actions that affect highly sensitive processes and stages can be considered, at least in the virtual world, of having a higher likelihood of impact at the population level. Limiting model usage to simulating population abundance trajectories for flows with and without HCP actions would underutilize the management potential of the FD model.
Submersed Aquatic Vegetation
3. The goal of creating an SAV model that simulates dispersal and predicts how flow affects SAV has not yet been met.
The objectives of the SAV modeling are to predict the percent SAV coverage under different flow regimes, and to then use these predictions as input (habitat) to the FD model. However, mechanisms connecting flow to SAV coverage in the SAV model are presently limited to how changing depth (as a result of flow) affects light availability. Unlike the FD model, the SAV model is a mass-based model (not individual-based), with both implemented on the same spatial grid. At this point in model development, the focus in the development of the SAV model has been on how light impacts SAV biomass. Indeed, if light availability is the single forcing under consideration, a simple cellular automata approach may yield similar predictions with a lower level of complexity. A fundamental shift in emphasis to understanding how flow affects SAV seems to better align with the objectives of how this model will interface with the FD model and with assessing the ecological responses to HCP actions.
Developing rules to approximate dispersal within SAV models is an ongoing challenge in the SAV modeling field. The difficulty is specifying sufficient rules that incorporate dependence of dispersal on the appropriate environmental and biological factors and result in SAV composition and biomasses that realistically change in time and space. Here, with multiple species being simulated, the potential for considering plasticity in the responses to flow is also compelling. The model development team is currently grappling with the challenges of modeling dispersal, and the interim report includes some compelling and creative ideas for simulating
this process. Spending time considering how flow affects these processes is critical. It will also be important for the modelers to carefully consider how the dispersal model interfaces with the biomass-growth model for SAV. As described, the dispersal model could easily be considered as a separate modeling exercise, but its effectiveness will be improved by ensuring that it is appropriately matched to the approach for simulating SAV growth.
Certainly expanding on the plans to incorporate scouring impacts seems valuable, including very low-flow impacts in the lake systems (increased epiphytes or temperature). Every decision in these models should be carefully examined against the overarching question regarding how flow affects SAV, and in this way additional processes will be identified that connect flow to SAV dynamics. Essentially, the processes included and the characteristics of the model formulations serve as hypotheses regarding how the ecologists working in this system might consider the impacts of flow on SAV. The strength of modeling is that many of these hypotheses may be evaluated in a simulation setting as a first cut to determine whether they are critical to understanding the impacts of flow on SAV.
MODEL CONFIGURATION
Model configuration includes the specification of the spatial and temporal scales of the model, the state variables to be tracked, and what processes are included and how they are represented.
General Comments
4. The temporal and spatial scales of the SAV and FD models are reasonable but the representativeness of selected reaches and the variance properties associated with the use of QUAL2E outputs as model inputs should be clearly documented.
The temporal and spatial scales of the FD and SAV models should be defined based on the key aspects of the driving variables (e.g., flows), the rates of the processes to be simulated, and the questions to be addressed. In addition, the temporal and spatial scales need to be compatible. For the FD model, an hourly time step and 1 m2 cells are reasonable decisions, although the spatial resolution seems relatively fine compared to the time step. Fish trying to forage, avoid predators, or prevent localized overcrowding can move potentially many cells in one hour. The movement algorithm needs to be capable of dealing with realistic distances moved in a time step. For the SAV model, daily time steps and 1 m2 cells are reasonable, although permitting colonization only once per month may not capture lateral growth of these clonal plants. Using daily averaged values of flow as a
forcing for the SAV model is likely adequate for simulating depth and light availability, but may not permit incorporation of additional mechanisms related to flow, such as uprooting or dispersal.
Model inputs include the hydraulics and water quality outputs from the QUAL2E model, with the FD model also receiving inputs from the SAV modeling. Collapsing the resolution of the two-dimensional (2-D) grid of QUAL2E from 0.25 m2 to 1 m2 cells was a reasonable decision by the development team; care should be taken in how the predictions of the QUAL2E are aggregated. The QUAL2E modeling also has a fast time step so its results can be summarized to match the hourly time step of the FD. Whenever aggregations are done, it is advisable to keep track of the loss of variance in the transferred variables (e.g., hourly variations around a daily average flow; value of four cells to one value for the larger cell) and whether different aggregation schemes (snapshot versus averaging versus daily minimum) affect the values of the transferred variables.
The spatial domain of the FD model is not simply the area that encompasses the number of FD individuals (abundance) expected in their entire geographic range. Rather, the FD model simulates individuals in certain reaches (subregions) of the system affected by the HCP. How well these subregions, simulated independently, represent the area inhabited by the entire FD population should be confirmed. (This issue of the representativeness of regions was discussed extensively in Chapter 4 of NRC, 2015.) For the SAV model, simulations at the reach scale are useful for predictions of HCP-related effects and also for model validation purposes.
Fountain Darter
5. The use of an individual-based approach imbedded within a 2-D spatial grid for full life-cycle simulations of FD population dynamics is a scientifically sound framework for the questions being asked, but there remain some important steps to link the FD dynamics to their habitat.
The parallel development of the FD and SAV modeling has advantages in that adjustments can be made in each to ensure both models are configured to allow accurate transfer of habitat information from the SAV to the FD models. It is planned that the FD model will require the output of the SAV model, but the SAV modeling is not affected by the dynamics of FD. Currently, the FD model is not using results of the SAV modeling as inputs of habitat; rather the FD model is using inputted field data-derived habitat maps that abruptly update every six months (uncoupled mode). This is a reasonable temporary fix in order for the development of the FD model to continue while the SAV modeling gets refined. However, because the uncoupled approach uses observed SAV maps, habitat in the FD model
is not directly linked to flow. Therefore, the uncoupled version, in its present form, cannot be used to examine HCP-related scenarios involving changes in flow. The coupling of the SAV and FD models is discussed below.
6. The representation of the processes of FD growth, mortality, reproduction, and movement presently in the model are well-founded but may be too simple and not sufficiently linked to changes in habitat and flow to answer some of the important management questions.
Growth is presently represented as fixed in the FD model. That is, stage durations determine the progression from one life stage to the next, and these durations do not vary within or between simulations. Thus, the approach implicitly includes growth rate of individuals, but body length and weight are not tracked as state variables. Sometimes this approach is misinterpreted as assuming that food is not limiting. The degree of food limitation is determined by how the durations are estimated; if estimated from the field and food was limiting in the field conditions, then the durations reflect highly averaged but still food-limited conditions. However, the fixed-stage duration approach does make the strong assumption that the availability of food does not vary much from the conditions under which the durations were determined. The present version of the FD model assumes that individuals will obtain the food needed to achieve the growth rates dictated by the durations, and these growth rates do not vary much in space, seasonally, based on the specific habitat being inhabited, or based on flow. Thus, the ability for growth of individual FD in the model to respond to variation in environmental and habitat conditions, including HCP-related actions, is very limited. The biological realism of this limitation, and how it affects the usefulness of the model, should be evaluated.
Mortality is represented as stage-specific rates plus additional rates dependent on temperature and movement. The movement-related mortality rate is triggered when the number of movement time steps (24 per day) that an individual spends in open water or without options to move to other less crowded vegetated cells is exceeded (see Movement paragraph below). When an individual dies, it is removed from the simulation. This representation of mortality related to movement being density-dependent is critical because it is the only source of density-dependent control on the FD population within the model. It only operates at relatively high FD abundances (so no depensatory mortality is represented), and it only occurs when SAV habitat is limited relative to FD densities. The role of flow is, at best, an indirect effect through flow affecting SAV; however, such dependence of SAV on flow is not presently in the FD model.
Reproduction is relatively fixed in the FD model, with maturity dictated by the fixed stage durations until the adult stage and fecundity fixed at
19 eggs per batch per female. The aspect of reproduction that can vary is based on vegetated cells. This is because, if a female is attempting to spawn, the individual must be in a vegetated cell and must not have spawned for at least a month. When these two conditions hold, there are fixed probabilities by month that the individual will spawn and release 19 eggs. Eggs remain in the cell into which they were released as they progress to larvae and then to juveniles; juveniles and adults can move. Reproduction has the potential to be related to habitat and to be density-dependent. For example, if SAV is severely limiting as habitat for FD, then female individuals that could spawn based on the other constraints may not spawn because of the limited availability of vegetated cells. It is not clear how this would occur in the model (e.g., would individuals move to vegetated cells for reproduction?) and whether such severely limiting habitat conditions are realistic.
Movement is a rule-based neighborhood search approach, and it is only triggered under locally crowded conditions. NetLogo® follows individuals in continuous space, and after an individual moves and its position is updated to its new continuous location, the cell that the individual is located in is then determined. The cell location determines the environmental conditions an individual will experience for the next time step. The present version uses a cell-by-cell movement rather than using conditions to determine the x and y velocities of individuals and then updating their continuous locations. The present movement algorithm also uses up to 24 evaluations in a day, which can be confused as being hourly. However, this is not the case because conditions affecting movement do not change hourly but rather change daily (depth, velocity, temperature) or seasonally (vegetation type). The time-stepping of movement within the day is to deal with individuals moving for a day among very small cells (1 m2) and to allow some exploration by the individual of the local area. An alternative would be to update movement only once per day but to allow an individual to “see” a larger neighborhood than one cell in the four (or eight) directions.
The movement rules are driven by maximum FD densities that are assigned to the vegetation types for each cell that then change seasonally. Movement is triggered when the FD densities in a cell exceed the maximum densities. Some movement between adjacent cells, even if the present cell is not too crowded, is included: if an adjacent cell is also less than maximum density, then there is a 50/50 chance to move there or stay in the presently occupied cell. In the other case of overcrowding in a cell, the individual attempts to move to a neighboring vegetated cell and only can if that cell is not crowded. If all vegetated adjacent cells are also crowded, then the individual would move to an adjacent water cell if there are any. The number of times the individual is in water cells is accumulated and used to determine death (too many time steps in water cells leads to death). An individual can also die if no uncrowded or water cells are available to move into for enough time steps.
Use of a rule-based movement implemented on a cellular (cell to cell moves) scale can realistically represent movement. The difficulties arise when the temporal and spatial scales are not well matched. The approach taken with the FD model to address this potential issue of a coarse (daily) time step with a fine (1-m2) spatial resolution is to allow for 24 moves within each day. Information on the typical distances moved by individuals and plotting of the Lagrangian trajectories of individuals under different vegetation and flow conditions should be presented to confirm the realism of the simulated movement behavior. Another potential difficulty with a cellular approach to movement is if the spatial resolution of the FD grid is changed—movement to a cell now involves traveling a different distance in the same time step. Finally, there is always debate with a neighborhood search algorithm about what do the individual fish sense and how do they know how to go a neighboring cell without having visited it. The fine spatial resolution of the FD model helps in this case because it is easier to envision individuals detecting gradients and other cues on a 1-m2 basis that would allow them to “sense” the conditions of the destination cell in advance of moving there.
The only linkage among the growth, mortality, reproduction, and movement processes is how movement can contribute to mortality. This may be reasonable for FD and the questions being asked, but it is very important for the audience to understand this so the results can be properly interpreted and the model used appropriately. Growth is fixed and based on specified durations of life stages; no matter what conditions are simulated, the individuals will always grow at the same rates and progress through the life stages at the same rates. Mortality does not depend on size but only on stage and temperature. Reproduction, which like mortality is often represented as size-dependent in fish population models, is completely size-independent in the FD model. Maturity depends on stage, which depends on growth, which is fixed; fecundity is also fixed per individual. For these reasons, interpretations of modeling results such as “flow caused slower growth and this led to higher mortality and lower reproduction” are impossible. The point is that interpretation of model results and the types of scenarios that can be simulated depend on the structure of the model. In the FD model, few of the possible linkages (see Rose et al., 2001) between growth, mortality, and reproduction are represented. This may be appropriate—it depends on the biology of the species—but is atypical of many individual-based and population models of fish and requires careful consideration as modeling results are reported and interpreted.
7. Thresholds in process representations should be used cautiously because they can erroneously create non-linear population responses and unrealistic sensitivities to changes in habitat and flow.
The use of daily maximum and minimum values from QUAL2E as inputs to the FD model should be done carefully. If processes are formulated to depend on maximum or minimum daily values (e.g., minimum dissolved oxygen [DO] affects daily mortality), then the model is internally consistent. However, such formulations should be done cautiously, especially with the relatively smooth changing hourly values of the rest of the processes in the model. One of the advantages of the individual-based approach is that it allows accumulation of hourly exposure of individuals to environmental conditions over time. While using minimum or maximum daily values for each day to affect processes is mathematically valid, formulating how these minimum and maximum values affect processes, which themselves could be a threshold response (rates change suddenly not smoothly), is challenging. At a minimum, a thorough sensitivity analysis to evaluate the impact of these thresholds seems warranted. The link from flow to temperature and DO is important because these indirect effects of flow are the only effect of flow on FD to date in the FD model. Thus, interpreting how alternative flows affect FD using the FD model requires understanding how changes in flow affect velocities and depth that are then used as input to the QUAL2E model, and then how these changes in hydraulic outputs affect QUAL2E’s predictions of maximum daily temperature and minimum daily DO.
The use of observed densities for maximum FD densities by vegetation type acts to smooth over the threshold effect of capping FD densities by vegetation type. The smoothing occurs because a range of “maximum” densities are used for each vegetation type rather than a single value. A possible inconsistency occurs because observed densities are not truly maximum densities. Nonetheless, the use of observed densities for maximum densities will help in calibration; that is, as SAV types change in the FD model, the maximum densities change, which in turn encourages the model-predicted densities to mimic the observed densities. Total abundance of FD is the sum of their densities over all cells; thus, model-predicted abundance is a direct result of what values the maximum densities are set to. Because the observed densities were used to limit the model and then the calibration and validation use the sum of the simulated densities compared to the sum of the observed densities, the calibration and validation results showing good agreement are not as rigorous as they may seem based on the predicted versus observed abundances plots. This calibration strategy requires some skill because exceeding the specified maximum densities triggers movement, which can result in higher mortality. Proper interpretation of the calibration and validation results is critical for associating the appropriate level of confidence with model predictions of HCP effects.
8. The representation of density-dependence and how its effects on individuals manifest at the population level needs further evaluation.
Density-dependence is when the rates of a process (e.g., mortality) depend on the number of individuals present in a specified area (e.g., particular cell). Density-dependence can occur with growth, mortality, reproduction, and movement (Rose et al., 2001). As with other effects (e.g., flow), density-dependent effects on mortality and reproduction directly affect the number of individuals in the population (abundance). Density-dependent growth and movement are important because they can have indirect effects on mortality or reproduction (e.g., mortality rate decreasing with size); otherwise, changes in growth or movement do not affect abundance. Including density-dependence in population models is important because most density-dependent effects are a negative feedback and act as compensatory mechanisms. They will offset some of the response of the population to changes in habitat and other factors. For example, a decrease in spring flow can cause reduced SAV habitat for FD and increases their mortality rate because of less cover resulting in increased predation. However, the reduction can then be offset to some extent by reduced crowding at spawning, resulting in females releasing more eggs and these having higher survival. Thus, even with fewer spawners, the higher individual fecundity and higher egg survival results in an increased total egg production. (Note: such a logic chain of responses is not possible in the current version of the FD model.) In subsequent years, the reduction in the population is less than what would be expected from the reduced habitat alone under density-independence. Similarly, augmenting habitat would result in less positive response than expected under density-independence. Without density-dependence (no negative feedbacks), populations cannot be stable for extended periods of time because slight changes in reproduction or mortality must result in them either going extinct or growing unbounded.
The representation of density-dependence in the FD model is limited and restricted to increased mortality under relatively extreme local crowding. Each cell is assigned a habitat type, and a maximum density is generated from field data on densities. Increased mortality occurs when movement options are limited to neighboring cells that are also at their capacity. While this triggering of density-dependence when certain crowding conditions occur is a reasonable representation, it is quite limited in scope. There are other aspects of mortality, as well as growth and reproduction, which could be density-dependent. A simple approach that would allow rapid exploration of the importance of density dependence would be to assume that survival, growth, or fecundity decreases a reasonable amount (similar to the range exhibited in data) as density goes up (depending on vegetation type). Simulations with various combinations of the possible density-dependent processes could be analyzed to determine if further effort to refine the relationships is warranted. In general, a clear rationale for what processes are density-dependent—based on the data, expert opinion, and other similar species—should be developed.
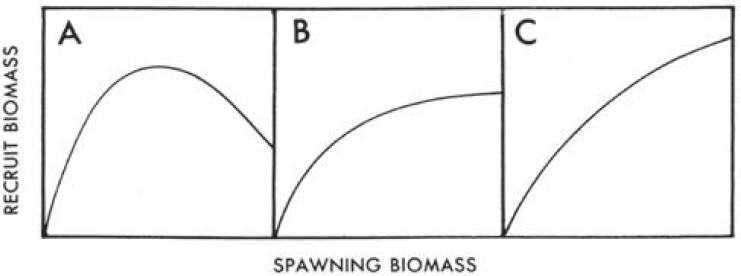
However density-dependent is represented, when all effects are simulated on individuals it is important to show how these effects add up to density-dependence mortality at the population-level. For example, a typical diagnostic to use is showing the annual spawner-recruit plot that results from multiple years of simulation. A common measure of spawners is total eggs produced in a year, and a common measure of recruitment would be the number of individuals that survived from those eggs to become juveniles and then to become adults. This can be difficult with a species like FD that spawns all year long and for which the present formulation includes density-dependence in the adult stage; defining over what months to sum egg production and how to accumulate recruits to obtain annual values needs to be considered. In addition, because of its potential importance on population dynamics, the density-dependence in adults should also be characterized and quantified. Based on the life history of the FD, one would expect a Beverton-Holt type spawner-recruit relationship, likely with a weak response (gradually leveling off curve, Figure A-1B). One often characterizes these curves with the steepness coefficient that summarizes the strength of the density-dependence in the spawner-recruit relationship, which has been reported for hundreds of fish species (e.g., Rose et al., 2001). Based on the Committee’s experience, a steepness value of 0.5 to 0.7 is anticipated. One could also try to create a spawner-recruit curve using proxies from the field data and compare its properties (e.g., shape) to the model predictions. Some additional exploration of how density-dependence manifests itself at the population-level is needed.
9. The representation of flow effects in the model seems too limited in potential effects due to reliance on having site-specific empirical evidence for the effects.
A logic flowchart showing how a change in spring flow affects FD directly and indirectly would be helpful. It must start with flow and eventually result in affecting mortality or reproduction, as these are the two processes that determine FD abundance. Flow effects on growth or movement must then continue in their logic to see how these flow-related changes affect mortality or reproduction. For example, if lower flow affects water depth in cells and this causes FD to move to other cells but their growth, mortality, and reproduction are the same in the new cells, then the lowered flow had no effect on FD abundance despite movement being density-dependent. Similarly, if lower flow was represented as affecting growth rate (i.e., longer or shorter stage durations), this also would have no effect on FD abundance unless mortality rate also was specified as dependent on stage duration. In the present model, mortality rate decreases with stage, and thus prolonged duration in early life stages, with their high mortality rate, could result in higher cumulative mortality. Slowed growth could also result in delayed maturation (reaching the adult stage) and reduced fecundity, but these may or may not have ecologically meaningful effects on population. The logic becomes complicated; does flow affect temperature which then affects mortality or does flow affect SAV, which affects FD habitat? A logic flowchart would enable easier tracking of the direct and indirect effects of changes in flow or other variables affected by the HCP.
With the present configurations of the SAV and FD models, the direct and indirect effects of flow on FD seem to be limited. The direct effects are limited to how flow affects daily maximum temperature and minimum daily DO (from QUAL2E), both of which affect mortality rates. Flow can also indirectly affect FD through flow effects on SAV dynamics, which determines the maximum FD densities in cells, which could lead to movement that causes increased mortality rates. In the uncoupled mode, the observed spatial maps of SAV reflect the effects of flow, but flow is not available to be adjusted in any systematic way (i.e., there is no flow input variable to the SAV maps). When the SAV model is further along in development and the coupled mode is implemented, any indirect effects of flow on FD through SAV will depend on how flow affects the SAV. Present plans, which are subject to adjustment and change as the SAV modeling proceeds, suggest flow could affect the biomass of an SAV species in a cell by altering water depth, which determines light limitation of photosynthesis and temperature affecting respiration. The report also lists velocity directly affecting SAV, but its role it not yet clear. It also has been proposed that the way an SAV species is assigned to a cell (transition) every three months, and maybe also dispersal, could depend on flow, although these remain ideas at this point.
Model development can proceed using several different philosophies, and the approach seemingly taken for the FD model may have over-restricted how flow effects are represented. One philosophy (“top-down”) is to focus
on formulating the model so that there are relatively few parameters that can then be optimized based on simulated and observed population-level variables (e.g., adult abundance over time). Here the fit between predicted and observed values is critical, and the idea is to avoid over-specification of the model. Another philosophy (“bottom-up”) is to carefully develop each component of the model so that when they are put together there is high confidence in the simulated population-level dynamics. The present version of the FD model relies on there being strong empirical evidence for flow effects in order for those effects to be included. In very well studied systems, this is effective because the major possible effects usually have been studied and their representations have a sound empirical basis. However, this approach can lead to over-simplified representations of the effects where the empirical evidence is not strong enough to justify including many of the possible effects that are suspected (e.g., intuitive, data suggestive, occur in other systems) but not documented. Thus, uncertainty due to the lack of site-specific data leads to ignoring possibly important effects. While this system is well-studied in some respects (sampling of FD densities; observational data), many would consider it under-studied in terms of process studies, especially those that relate flow to growth, mortality, reproduction, and movement of FD by life stage. Thus, the FD model reflects what is clearly known about flow effects but likely is missing other effects because of lack of site-specific measurements to justify their inclusion in the model.
There are several approaches for dealing with the possibility of understudied effects not being considered in models. An excellent use of the FD model would be to add some of these suspected effects and explore how including them would affect model results. One approach is to use information from similar species and other systems to infer, in this case, possible flow effects on growth, mortality, reproduction, and movement. These can be put into a category that distinguishes them from the effects documented using site-specific data so people know there is higher uncertainty (less site-specific evidence) with these effects. One can then use a series of simulations (like a sensitivity analysis) to see if these less-well-known effects could have significant population-level effects and have an impact on the advice provided to management. This use of the FD model also then leads to the identification of uncertain information that is also critical to accurate predictions and how to design sampling or experiments to provide this information on a site-specific basis for later incorporation into the FD model.
Submersed Aquatic Vegetation
10. Use of highly simplified formulations describing nutrient limitation or effects of temperature on photosynthesis may be problematic when the model is applied to scenarios where these factors are critical.
Model development must necessarily simplify the system. Nonetheless, it is critical to document and justify what assumptions and decisions have been made regarding which mechanisms to include or focus on. This justification should explain why certain factors or processes were included and why they were formulated at the level of detail used, as well as state why some factors and processes were not included. To develop an SAV model without considering the impacts of nutrients, as this model does, is highly unusual. It was the recommendation of the Committee’s first report (NRC, 2015) that nutrients be measured regularly. Nutrients can be limiting to plant growth and can also result in impaired growth conditions. At low flow conditions, especially in the lake systems that can act as refuges, there could be a future scenario where nutrient issues may be critical. For example, abundant nutrients under low flow conditions may encourage growth of epiphytes that then limit light availability to the SAV. For a model such as this, which is being developed largely to help predict the response of the system to hydraulic conditions not regularly experienced, it seems critical to systematically evaluate the basic factors involved in the growth of the SAV for potential inclusion in the model, level of detail of representation if included, and possible mechanisms linking them to flow.
The treatment of temperature in the model is inconsistent in that there is no temperature limitation in the photosynthesis formulation, but temperature effects are included in respiration and growth equations. Including a temperature limitation term for photosynthesis would resolve these inconsistencies. In many instances, respiration and photosynthesis respond differently to temperature changes, and explicitly including temperature dependencies may be illuminating.
11. In general, more model detail in the final report is critical for both review and future users of the SAV model.
The SAV modeling group has been very helpful in answering questions related to the BIO-WEST (2015) report. Nonetheless, future reports should provide more detail on decisions and assumptions, choices for parameterization, and occasionally referencing of the other coupled models (FD and water quality) in order to aid future users and developers of the SAV (and FD) models. For example, providing greater clarity on the conversions from grams dry weight to glucose and back again, and detailing differences in these conversions amongst species, is important. The Committee’s reading of the BIO-WEST (2015) report suggests that light attenuation data are lacking, such that gathering some field data for solar irradiance and light attenuation would improve upon current forcings and fixed parameterization of the k value (light extinction coefficient). The BIO-WEST (2015) report also suggests that basic temperature limitation studies are not in abundant
supply for the varied species modeled here and that the impact of temperature on mortality is not strongly understood. Providing referenced literature on these links (e.g., between mortality and temperature) is recommended, as is providing more detail on the relationship between flow and scour. Finally, details on model initialization should be included in the final model description. It would be most effective for the modelers themselves to provide an explicit list of the assumptions made, perhaps in some prioritized list, to aid in future iterations and improvements to the model. The developers have the clearest picture of what data, research, and questions must be pursued to improve future management of the systems and to aid in improvement of the models. Strongly identifying those areas where assumptions were made or data were lacking is an invaluable practice.
12. Many parameters appear calibrated, and it is not clear how the values of fixed parameters are connected to literature values. Formulations are taken from a crop model, which is not a problem as long as the developers sufficiently incorporate SAV morphology, growth, and physiology in the formulations and parameterization. Describing how the calibration is done and convincing end users that the parameterization is appropriately matched to reasonable values from the empirical literature will aid model credibility.
Calibration allows for changes in model parameters until predicted and observed values appear consistent with each other. However, calibration must also include documentation that the tuned parameters are realistic and, wherever possible, match literature and site-specific values. There is little information provided regarding parameterization in the BIO-WEST (2015) report. After some evaluation, the modeling team decided to develop a new model, based on a suite of existing models. The basic growth formulations are borrowed from Teh (2006), which focused on crop models. Using growth formulations from other plants is a common approach used by modelers and is effective and efficient as long as the formulations are carefully checked and adjusted based on SAV information and site-specific information. The model is likely extremely sensitive to Pmax (the maximum photosynthetic rate for a species), as are most models of this type, such that a thorough sensitivity analysis is advisable. Based on the available documentation, it appears that relatively little data or empirical parameterization has been taken from the SAV literature; a majority of the parameters are calibrated. A rigorous review of the final SAV model will seek examples where these selections are well founded in the SAV literature.
13. The SAV model grapples with the difficult challenge of handling maximum biomass per cell, as well as conversion of cells from one SAV species to another.
Simulating the processes of both colonization and conversion from one species to another is perhaps the most exciting and challenging aspect of the SAV model. The user-determined maximum aboveground biomass is set to limit biomass in a given cell. However, the model already includes self-shading and permits for negative growth as the main mechanisms that should, presumably, impose a more mechanistically derived limit on the maximum amount of biomass in a cell. Forcing a maximum biomass value can artificially help calibration because it simply cuts off biomass values that are too high without a biological reason. If the development team instead considers this limit to be related to colonization of adjacent cells, then this could be explicitly linked to the transition probabilities. Another option would be to have a variable translocation term, where more growth is allocated below ground as the above ground biomass in a cell becomes larger. For the species that float across the surface, thinking through whether it is necessary to have a rule that limits height to the water depth is advisable. Light is simulated with some detail throughout the water column, which may be critical for the range of species simulated in this model, some of which grow basally and some apically. However, it is not clear if this detailed water column light approach is matched with an equally detailed approach to modeling the SAV that takes into account the location of the meristem. Perhaps most importantly, the need for a translocation term suggests that further work may be needed on the rate process portions of the model.
The dispersal model is still under development and generally appears to be sound. Considering a cost to the parent biomass after dispersal to an adjacent cell seems like a reasonable adjustment that may be useful. Describing in greater detail whether the modelers consider the dispersal process to be related to sexual or asexual reproduction could also be helpful. Recognizing that the transition probabilities are currently under development, it is still important to provide more detail as to how they will be coupled to flow and the biomass dynamics portion of the model.
MODEL CALIBRATION AND TESTING
Model testing is the estimation of model parameters (calibration) and testing (validation) of the model’s performance. The credibility of the modeling results depends, in large part, on how well the model can generate realistic behavior.
Fountain Darter
14. Calibration and validation of the FD model to date show the model can reproduce the historical abundances, but additional confidence is needed to most effectively use the model for management purposes.
The strategy for calibration of the FD model was to vary the number of movement time steps needed to trigger mortality within the movement rules until simulated population abundance stayed near the maximum possible densities for 2003 to 2014. Additional simulations showed what happens if the density-dependent mortality is relaxed (see almost exponential increase) and if movement was simply random (extinction). The calibration results are reassuring, as they confirm the types of model behavior we expect and they demonstrate that the model can show other types of behavior if not properly constrained, but they could be more convincing. The follow-up validation analysis used the same approach, but with the model applied to other reaches than to which it was calibrated. Thus, the calibration and validation are based on this same strategy of the degree of agreement of simulated abundance hovering around the specified maximum densities over time.
It should be noted that the good agreement between predicted and observed abundances within the calibration is somewhat tautological. This is because, in the model, FD densities are constrained to be less than the maximum densities in each cell; overcrowding kills them if they cannot move to a cell where there is room for more individuals. The maximum densities were set to observed densities by vegetation type. So the fact that the sum of FD densities (abundance) hovers near the sum of the maximum densities (abundance) is somewhat expected if the model was generating roughly realistic densities with some surplus production. This calibration approach would fail (e.g., predict extinction) if mortality was too high or reproduction was too low; the population would decrease, and there is nothing in the model that triggers density-dependence (lowering of mortality or increasing in reproduction) at low densities. If the mortality and reproduction rates were set so that there is sufficient potential to produce adults in the model (e.g., reproduction greater than mortality), then the calibration approach used could be successful. The simulated abundance would try to exceed the specified maximum densities, which would trigger density-dependent mortality (i.e., higher mortality), and the simulated abundances would then decrease; with adjustment of the degree of density-dependent mortality, the simulated abundances would then hover near the summed maximum densities. Based on the calibration results to date, the Committee would characterize the model as being a good descriptor of FD abundances during the period of simulation, rather than being a tool for true prediction or forecasting. This is known by the model developers but it needs to be clearly understood by the general audience. The plots of simulated and maximum densities can mistakenly be interpreted as true model predictions that greatly agree with the maximum densities, which may (wrongly) lead to thinking the model is an excellent independent predictor of absolute abundance or can be used to forecast the response of abundance to large
changes in flow. The model may indeed have such capabilities, but the calibration and validation done to date cannot be used to conclude that.
The calibration and validation can be strengthened by examining additional model outputs and years, and by quantifying the uncertainty associated with predictions. Some of this has been done by the model development team but could be better documented, more rigorously compared to the field and lab data, and additional outputs considered. For example, one could examine the simulated spatial distributions and movement trajectories of individual FDs in the model, and perform more in-depth contrasting of dynamics between years with extreme conditions. Scenarios can also be simulated that manipulate flow and SAV (habitat) conditions to then track how these progress through the FD processes and life stages, resulting in population-level responses. The presently used series of years can be manipulated to increase the interannual variation in environmental conditions. Some years can be adjusted or new single or a few years (e.g., drought, scour) inserted. Model responses at selected steps in this changed flow leading to a population response can be qualitatively compared to lab results and field data to confirm such intermediate effects are realistic. Propagating uncertainty and stochasticity through the FD model, while not adding to the validation credibility, would help in ensuring proper interpretation of model results and model differences predicted under different HCP scenarios.
Sensitivity analysis (model response to small changes in inputs) and uncertainty analysis (model response to realistic variations in inputs) can be used to identify key model inputs and the associated variability in model predictions. If key inputs such as parameter values can be identified, then field and lab studies can be designed to provide more certain estimates of these inputs. These revised estimates can then be inserted back into the models to reduce the uncertainty of the predictions. Furthermore, it is important to present not just individual values as model predictions but also the variability around those values. This aids in the comparison of model predictions to field data, as both have variances. Presenting the variability around predictions is also important to properly interpreting the results from running alternative management scenarios—that is, do these scenarios really lead to differences that go beyond the known levels of uncertainty.
15. The historical time period used for calibration had relatively similar environmental conditions from year-to-year, which limits the range of conditions of scenarios feasible for exploration by the model.
The 12 years used for calibration included a relatively narrow range of flow conditions. Lack of information on model performance outside of these conditions limits the scenarios that can be reliably examined by the model.
Submersed Aquatic Vegetation
16. Some calibration of the SAV model appears to have occurred, but the details are not provided in the interim report. More detail will be necessary in the final report.
Creating a framework for model documentation that covers goals, assumptions, justifications for parameterization, calibration, and verification for this (and future) versions of the SAV model is good practice and will aid in the longevity and application of the SAV model. Based on Table 13 in BIO-WEST (2015), several parameters have been calibrated for two species that have been the focus of initial SAV model efforts. However, descriptions of the calibration approach and results have not been provided. The model development team is strongly urged to provide detail regarding their calibration plans.
17. Calibration and validation should consider efforts to compare model output of rates as well as state variables.
It is a common practice to use state variables such as biomass to validate numerical models of primary producers. However, especially in this SAV model where three critical rate processes are simulated (photosynthesis, respiration, growth), it is important to look at output from the model of these rate processes and to compare, in some fashion, these simulated rates to measured rates. If measured rates are not available for all species, their acquisition can be identified as a critical research activity to be done while the literature is scanned to provide some confidence regarding rates for some of the modeled species.
18. Developing an SAV model that can accurately simulate the observed maps of SAV coverage is unlikely and not advisable. Rather, validation exercises should be considered that take SAV coverage into account at larger spatial scales and compare patterns of SAV coverage between predicted and observed maps.
A “pattern-oriented approach” similar to that described by Grimm et al. (2005) could be considered for guiding model evaluation and validation. This approach also influences model development, but in a way that is complementary to the currently described efforts for the SAV model. This might include validation exercises comparing important patterns generated from the model that were not simply an outcome of the model inputs.
In addition to considering a pattern-oriented strategy, with a spatial scale of 1 m2 and the decision to permit just one species per grid cell, it is
highly unlikely that a simulated map of SAV coverage will directly mirror actual species distribution maps. A more realistic validation exercise might consider comparisons at the reach scale or some intermediate spatial scale above 1 m2. Model evaluation should focus on aggregate measures (e.g., total biomass by type) and their seasonal and spatial patterns, rather than trying to match predicted and observed biomasses on a cell-by-cell basis within a survey. Validation should also consider the use of the SAV model as both a standalone model and in its role as generating habitat input for the FD model, to ensure that the appropriate aggregate measures are evaluated.
MODEL COUPLING
Model coupling is a special topic because of the plans by the model development team to use the results of the SAV modeling to provide habitat inputs to the FD model. Running models in a coupled mode involves additional issues beyond those identified above, which were based on running the two models independently (standalone).
There are four submodels within the overall ecological model: hydraulics (steady state 2-D model), water quality (QUAL2E), SAV, and FD. The hydraulics model is Dr. Thom Hardy’s existing MD_SWMS model for both the Comal and San Marcos systems. The grid size is 0.25 m2. Hydrology (flow and depth) is generated by having seven-day averages over the time period 2000 to 2013. The water quality model for both systems is QUAL2E. The model outputs from the hydraulics and water quality submodels that have been used to date in the FD model are maximum daily water temperature and minimum daily DO. The SAV model will require hydraulic and water quality model outputs of depth, temperature, and (eventually) some measure (e.g., average daily) of flow. There is currently no direct role for velocity or depth as inputs to the FD submodel.
The SAV submodel is a standalone model that can be used to examine questions related to HCP activities, and it is also planned to provide the habitat information for the FD model grid. While these are highly related uses of the SAV modeling, it is likely that compromises are needed in order for the same SAV model to be able to perform both uses. For example, trying to use the SAV modeling results as input to the FD model may push the SAV modeling to a finer spatial scale to match the FD model than if the only goal of the SAV modeling was to assess flow effects on SAV dynamics.
The actual coupling between the SAV and FD models is planned on being one-way, which is reasonable. That is, SAV affects FD, but FD does not affect SAV. This is biologically realistic and also allows for the SAV and FD models to be run separately if needed for computational reasons. The SAV modeling should generate outputs on spatial and temporal scales realistic for how FD uses these habitats within the model; that is, how do these habitats
affect FD growth, mortality, reproduction, and movement on hourly to daily time steps for roughly 1-m2 spatial resolution and within the FD model domain of a reach. For example, conversion of a grid cell to a different SAV species occurs just one time per month at this stage of model coupling. Careful consideration of whether this, as well as how other variables are transferred, is sufficiently accurate for use in the FD model is warranted. The SAV modeling is still unsettled, but it seems that a reasonable compromise can be found such that the SAV modeling can be used both for simulating SAV responses to flow and for providing habitat inputs to the FD modeling.
The use of steady-state hydraulics and dynamic QUAL2E as potential inputs to the SAV and FD model is reasonable provided the limitations of this coupling (hydraulics-QUAL2E) for use in the FD model are clearly detailed. The hydraulics model is used in two ways: a series of constant flows is simulated (steady-state for each flow) for direct use of depths and velocities in SAV and FD models, and using seven-day average values of flow (also to steady-state) as input to the QUAL2E model to generate hourly temperature and DO. The steady-state velocities and depths are re-gridded from the 0.25 m2 of the hydraulics to the 1-m2 grid of the FD model. The hourly temperature and DO are processed to obtain daily maximum temperature and daily minimum DO values. All of the FD model cells fall within a single QUAL2E segment, and thus the temperature and DO values in the appropriate QUAL2E segment are applied to all of the cells in the FD model. While the idea of model coupling is sound and seems simple and intuitive, the details are very important for conveying the limitations (and strengths like higher confidence) when the fully coupled set of models are used to simulate SAV and FD responses to HCP actions.
At every step of passing output from one model to be input to the next model in the chain, some information is lost (often variance) and the receiving model inherits the assumptions used to run the donor model. In the situation here, these steps include aggregation of 0.25 m2 scale in the hydraulics to 1-m2 resolution in the SAV and FD models, steady-state hydraulics used dynamically in the SAV and FD models, steady-state hydraulics used differently to generate velocities and depths versus as input to QUAL2E to generate temperature and DO, and all of the FD and SAV model cells being within a QUAL2E segment (i.e., no spatial variability). Careful evaluation and bookkeeping of the assumptions, of how information is generated (e.g., steady-state versus dynamic) and then passed to the next model, is needed to ensure the information from different sources is consistent and to know what types of scenarios can be realistically examined. The FD model will inherit the assumptions and limitations of all of the previous model analyses that provided inputs. Calibration and validation of standalone models independently do not guarantee they will perform with sufficient accuracy and precision when they are coupled.
CONCLUDING REMARKS
The ecological modeling is on a good pathway forward. The FD modeling has made significant progress toward the goal of predicting the effects of HCP actions on FD population dynamics. The SAV modeling is in an earlier stage of development and therefore its status is more difficult to assess. This review examined the available information and offers a suite of comments, some of which are conclusions and some of which are recommendations. The summary below is intended to help the modeling process continue toward its eventual objective of being a quantitative tool to assist in evaluating HCP-related actions on FD and SAV dynamics.
- Ensure adequate expertise is available to modify, run, and properly interpret the models once they are completed by the development team. [Comment 1]
- Utilize the power of the mechanistic approach embodied within the FD model by including the reasons that predicted responses occur; use the model in the inverse mode to identify key life stages, processes, locations, and timings for effective management actions. [Comment 2]
- Expand the factors explicitly included in the SAV modeling to include flow, and consider alternative formulations for dispersal and cell-level changes in SAV species that do not simply mimic the observed data but that depend on flow and other factors. [Comments 3 and 13]
- Keep track of the variance properties as information is passed from one model to the next. [Comment 4]
- Confirm the representativeness of the reach approach for FD so that results can be interpreted at the true population level that spans multiple reaches. [Comment 4]
- Plan for how to ensure that the SAV maps used in the FD model (either from the SAV model or uncoupled) can be used to predict habitat changes in response to flow. [Comment 5]
- Evaluate whether the growth, mortality, reproduction, and movement processes represented in the FD model should be (1) more linked to each other, which might lead to density-dependent responses; and (2) more linked to environmental variables such as flow. Logic charts showing how HCP actions can cause responses in the information passed from the hydraulics and water quality models to the SAV model; from the hydraulics, water quality, and SAV models to the FD model; and within the FD model itself, would benefit model communication and interpretation of the FD modeling results. [Comments 6, 8, and 9]
- Careful use of threshold-like formulations for processes in both models is needed because using minimum or maximum values of environmental conditions or cutoff values for SAV and FD variables can dampen responses to flow changes and generate sudden changes in SAV and FD model predictions. [Comments 7 and 13]
- Evaluate further the present assumptions about no nutrient limitation, the present formulation for light and temperature effects, and direct and indirect roles of flow in the SAV model. [Comment 10]
- Further confirm the calibration and the realism of the resulting parameter values, and the appropriateness of using a crop model for SAV using literature and site-specific information. [Comment 12]
- Ensure sufficient documentation/explanation of the SAV model and of the coupled version of the FD-SAV modeling for future evaluation and use of the models. [Comment 11]
- Expand on the calibration and validation of the FD model to address the partial tautological aspect of specifying the maximum densities from observed values and then showing the model replays total abundances, and the relatively low interannual variation of environmental conditions within the calibration time period. [Comments 14 and 15]
- Develop and implement a calibration and validation plan for the SAV model that includes model-data comparisons of biological rates and testing of the model’s ability to produce key spatial patterns. [Comments 16, 17, and 18]
Much progress has been made, and there is still significant effort remaining in order to get the models to the point in their development and evaluation that they are ready for predicting responses of SAV and FD to HCP actions. These comments hopefully provide guidance for continuing on the path forward.
REFERENCES
BIO-WEST. 2015. Predictive ecological model for the Comal and San Marcos ecosystems project. Edwards Aquifer Habitat Conservation Plan. Interim Report. Contract No. 13-637-HCP.
EARIP (Edwards Aquifer Recovery Implementation Program). 2012. Habitat Conservation Plan. Edwards Aquifer Recovery Implementation Program.
Grimm, V., E. Revilla, U. Berger, F. Jeltsch, W. M. Mooij, S. F. Railsback, H.-H. Thulke, J. Weiner, T. Wiegand, and D. L. DeAngelis. 2005. Pattern-oriented modeling of agent-based complex systems: Lessons from ecology. Science 310(5750):987-991.
NRC (National Research Council). 2015. Review of the Edwards Aquifer Habitat Conservation Plan: Report 1. Washington, DC: The National Academies Press.
Parrish, R. H., and A. D. MacCall. 1978. The climatic variation and exploitation in the Pacific mackerel fishery (Vol. 167). State of California, Resources Agency, Department of Fish and Game.
Rose, K. A., J. H. Cowan, K. O. Winemiller, R. A. Myers, and R. Hilborn. 2001. Compensatory density dependence in fish populations: Importance, controversy, understanding and prognosis. Fish and Fisheries 2:293-327.
Teh, C. 2006. Introduction to Mathematical Modeling of Crop Growth. Boca Raton, FL: Brown Walker Press.


