
6
Mitigation and Minimization Measures
INTRODUCTION
The federal Endangered Species Act’s incidental take permit (ITP) provisions require minimization and mitigation (M&M) measures. First, during the application process, the applicant for an ITP must specify “what steps the applicant will take to minimize and mitigate [the impacts of its incidental taking of ESA-listed species] and the funding that will be available to implement such steps.” Second, before issuing the ITP, the U.S. Fish and Wildlife Service (FWS) must find that “the applicant will, to the maximum extent practicable, minimize and mitigate the impacts of such a taking. . . .” Thus, M&M measures are an integral part of the ITP process and requirements.
The Habitat Conservation Plan (HCP) lists 38 M&M measures that have an associated budget. Table 6-1 summarizes these measures, giving the cost of measure implementation during the first half of the ITP (Years 1 to 7). The table also relates the Committee’s opinion about the species likely to directly benefit from the measure and the purpose of the measure. It should be noted that there are additional measures under consideration that have been the subjects of Applied Research projects (e.g., dissolved oxygen management). Thus, the table does not include all potential measures being implemented or under consideration, only those found in the HCP with an associated budget.
The purpose of this chapter is to review key M&M measures as well as to identify approaches that might maximize their effectiveness. The specific M&M measures reviewed in this chapter include the following:
TABLE 6-1 M&M Measures Found in the HCP
| M&M Measure (HCP Section) | Total Cost Years 1-7 | Target Species | Purpose |
|---|---|---|---|
| Flow Protection Measures | |||
| Critical Period Management Stage 5 (5.1.4) | NA | All | Reduce all pumping during critical low flows |
| Aquifer Storage and Recovery (ASR) (5.5.1) | $33.3 mil (leases) $15.3 mil (O&M) |
All | Reduce SAWS pumping |
| Regional Water Conservation Program (5.1.3) | $11.3 million | All | Reduce demand of SAWS and other participants |
| Voluntary Irrigation Suspension Program Option (5.1.2) | $29.2 million | All | Reduce irrigator pumping |
| San Marcos System | |||
| Texas wild rice enhancement and restoration (5.3.1, 5.4.1) | $1.05 million | TWR | Maintain TWR in the system |
| Sediment removal at Sewell Park (5.3.6 and 5.4.4) | $650,000 | TWR, SAV | Prevent sediment from smothering TWR |
| Aquatic vegetation restoration (non-native removal and native reestablishment) and maintenance (5.3.8, 5.4.3, 5.4.12) | $975,000 | SAV, TWR | Provide FD habitat; remove competition from TWR |
| Management of floating vegetation mats and litter removal (5.3.3 and 5.4.3) | $560,000 | FD, TWR, SAV | Reduce light attenuation and promote SAV/TWR growth. Prevent DO depletion |
| Non-native animal species control (5.3.5. 5.3.9, 5.4.11, 5.4.13) | $245,000 | FD, SAV | Prevent predation of FD and destruction of SAV |
| Sessom Creek sand bar removal (5.4.6) | $100,000 | TWR | Prevent sediment from smothering TWR; limit hydraulic changes in river |
| Low impact development/BMPs (5.7.3) | $2 million | All | Prevent contaminants from entering river systems via surface runoff |
| Recreation control in key areas (5.3.2, 5.4.2) | $336,000 | TWR, SAV | Prevent physical damage to species |
| M&M Measure (HCP Section) | Total Cost Years 1-7 | Target Species | Purpose |
|---|---|---|---|
| Restoration of riparian zone with native vegetation (5.7.1) | $220,000 | TWR, SAV, CSRB | Prevent bank erosion |
| Bank stabilization/ permanent access points (5.3.7) | $120,000 | TWR, SAV, CSRB | Prevent bank erosion |
| Household hazardous waste program (5.7.5) | $210,000 | All | Prevent contaminants from potentially entering the rivers by removing them from the watershed |
| Comal System | |||
| Old Channel Environmental Restoration and Protection Area (ERPA) (5.2.2.1) | $1.2 million | SAV | Promote health of prime FD habitat |
| Flow-split management (5.2.1) | $210,000 | SAV, FD | Control hydraulics into Old Channel |
| Landa Lake and Comal River aquatic vegetation restoration and maintenance (5.2.2) | $845,000 | SAV | Provide FD habitat |
| Non-native animal species control (5.2.5, 5.2.9) | $645,000 | FD, SAV | Prevent predation of FD and destruction of SAV |
| Decaying vegetation removal program (5.2.4) | $840,000 | FD, SAV | Reduce light attenuation and promote SAV growth. Prevent DO depletion |
| Riparian improvements and sediment removal specific to the CSRB (5.2.8) | $325,000 | SAV, CSRB | Prevent bank erosion, sediment accumulation, and potential siltation of CSRB habitat |
| Gill parasite control and non-native snail removal program (5.2.6) | $725,000 | FD | Prevent FD disease |
| Restoration of riparian zone with native vegetation (5.7.1) | $800,000 | SAV, CSRB | Prevent bank erosion |
| M&M Measure (HCP Section) | Total Cost Years 1-7 | Target Species | Purpose |
|---|---|---|---|
| Prohibition of hazardous materials route (5.2.7) | $10,000 | All | Prevent contaminants from entering the river systems by routing them away from rivers |
| BMPs for stormwater control (5.7.6) | $300,000 | All | Prevent contaminants from entering river systems via surface runoff |
| Incentive program for Low Impact Development (LID) (5.7.6) | $700,000 | All | Promote BMPs, which can prevent contaminants from entering rivers via surface runoff |
| Household hazardous waste program | $210,000 | All | Prevent contaminants from potentially entering the rivers by removing them from the watershed |
| Common to both systems, not habitat restoration | |||
| Biomonitoring both systems (6.3.1) | $2.8 million | All those monitored | Assess listed species populations and some WQ parameters |
| Water quality monitoring both systems (5.7.4) | $1.4 million | All | See trends in WQ parameters; compare to WQ in biomonitoring |
| Development of a mechanistic ecological model (6.6.3) | $950,000 | FD, SAV | Predict the responses of listed species to changes (e.g., in flow) |
| Applied environmental research at the USFWS National Fish Hatchery and Training Center Refugia (6.3.4) | $4.75 million | All those under study | Gain new knowledge of listed species; update ecomodel |
| Science Review Panel (NAS) | $550,000 | All | Provide ongoing advice |
| Improve Groundwater Model | Budgeted prior to and outside the HCP | All | Better predict spring flow and well responses to changes in climate, management options, etc. |
| National Fish Hatchery and Training Center Refugia | $11.75 million | All those included | A repository of genes/ organisms to seed springs if populations decline |
Note that there were other M&M measures in the HCP (labeled as “other”) for which no budget was provided. Also, there are activities, such as dissolved oxygen management, that are not explicitly listed in the HCP as M&M measures.
- Submersed aquatic vegetation (SAV) restoration/invasive plant removal in both the Comal and San Marcos systems
- Sediment removal at specific locations
- Dissolved oxygen management in Landa Lake
- Voluntary Irrigation Suspension Program Option (VISPO)
- Regional Water Conservation Program (RWCP)
- Stage V Critical Management Period
- Aquifer Storage and Recovery (ASR)
These M&M measures were selected because of their importance to reaching the biological goals and objectives of the HCP, or because they were specifically identified for review by the Edwards Aquifer Authority (EAA) as a result of uncertainties about their effectiveness or implementation.
Minimization and Mitigation Measures Background and History
Litigation in 1993 focused on reduced spring and stream flow as the primary source of impacts to Edwards Aquifer ESA-listed species, Sierra Club v. Babbitt (No. MO-91-CA-069, U.S. Dist. Ct., W.D. Texas), and the Edwards Aquifer Habitat Conservation Plan (HCP) and ITP maintain that focus (HCP 4-36). Specifically, the U.S. District Court for the Western District of Texas in 1993 ordered the FWS to establish five flow limits: “(1) the spring flow levels at which take of fountain darters and Texas blind salamanders begins at Comal and San Marcos Springs, (2) spring flows necessary to avoid appreciable diminution of the value of critical habitat of any listed species; (3) the spring flow at which Texas wild rice begins to be damaged or destroyed; (4) the minimum spring flow to avoid jeopardy for the fountain darter, San Marcos gambusia, San Marcos salamander, and Texas blind salamander; and (5) the spring flow levels at which take of San Marcos gambusia and the San Marcos salamander begins at San Marcos Springs” (HCP 4-36).
The FWS acknowledged in 1993 that it lacked adequate data for both its “take” and its “jeopardy” determinations. Nevertheless, the flow minimums it submitted to court based on its best professional judgment were as shown in Table 6-2 (adapted from HCP 4-37, Table 4-28), which the FWS characterized as “conservative.”
However, the FWS’s 1993 report to the U.S. District Court for the Western District of Texas also suggested other habitat protection efforts that became the inspiration for M&M measures. For example, the “FWS found that flow levels at Comal Springs could be reduced to 60 cfs for short time periods during certain times of the year without jeopardizing the continued existence of the fountain darter if a ‘very effective’ program to control the giant rams-horn snail was in place and if there was the abil-
TABLE 6-2 Flow Minimums for Edwards Species for Various Purposes
| Species | Level of Flow for ESA “Take” | Level of Flow for ESA “Jeopardy” | Level of Flow for ESA Adverse Modification of Habitat |
|---|---|---|---|
| Fountain Darter in Comal | 200 cfs | 100 cfs | 100 cfs |
| Fountain Darter in San Marcos | 60 cfs | 50 cfs (San Marcos Spring flow) |
150 cfs |
| San Marcos Gambusia | 100 cfs | 100 cfs | 60 cfs |
| San Marcos Salamander | 50 cfs (San Marcos Spring flow) |
N/A | 100 cfs |
| Texas Blind Salamander | 100 cfs | 60 cfs | N/A |
| Texas Wild Rice (“damage or destruction” standard from ESA for plants) | 100 cfs | 100 cfs | 100 cfs |
ity to control the timing and duration of low spring flows” (HCP 4-37). The FWS “also found that short-term reductions in flow levels below 100 cfs might avoid jeopardy for Texas wild rice, if: (1) exotic species (e.g., nutria) could be effectively controlled, (2) an aquifer management plan is implemented to control timing and duration of lower flows, and (3) the distribution of the species is improved throughout its historic range. FWS, however, did not specify what flow levels might be acceptable if those conditions were satisfied” (HCP 4-37). Thus, also from the beginning of the ESA process, management of the Edwards Aquifer system focused on habitat improvements that could reduce the minimum flow requirements.
The FWS’s Final Environmental Impact Statement (EIS, December 2012, http://www.fws.gov/southwest/es/Documents/R2ES/EARIP_HCP_FEIS.pdf) for the Edwards Aquifer HCP and ITP compared four proposals for managing the system. Specifically, the Environmental Impact Statement (EIS) evaluated four alternatives: (1) a “no action” that assessed the status quo if no ITP were issued and no streamflow protections were instituted (required by the National Environmental Policy Act as the baseline alternative); (2) the proposed EARIP HCP; (3) an expanded Aquifer Storage and Recovery (ASR) effort, with its associated infrastructure; and (4) highest critical management period pumping restrictions, which would require an
85 percent reduction in pumping during drought conditions, to 85,800 acre-feet per year (105.791 million m3 per year) (EIS ES-iii). Only Alternatives 2 and 3 required an HCP and ITP. Alternative 2 was the FWS’s preferred alternative:
Though the activities covered under this alternative could generate impacts to covered species, implementation of the proposed HCP is expected to contribute to recovery of the listed species and ensure their survival during conditions equivalent to those experienced during the [drought of record]. The anticipated cost of implementing Alternative 2 has been estimated to total $261.2 million over the 15-year life of the permit. Funding obligations associated with implementing the proposed HCP could have some negative economic impacts, though the certainty provided by an ITP ensuring continued use of the Edwards Aquifer is expected to be an overall benefit to the regional economy. The EARIP HCP is the alternative that minimizes negative effects to both the natural and human environment to the greatest extent, and is the Service’s preferred alternative (EIS ES-iv).
In contrast, Alternative 1 would not protect either the species or the local economy from an extended drought; Alternative 3 would cost $439 million to $1.16 billion; and “the indirect and cumulative effects resulting from the proposed pumping restrictions and developing alternative water sources for human use under Alternative 4 would be expected to have significant negative economic impacts throughout the region” (EIS ES-iv).
The four alternatives also differed radically in their M&M measures. Implementation measures common to all four alternatives included the EAA’s groundwater withdrawal program and permit administration (mandated under Texas law by the EAA Act); the City of New Braunfels’ management of golf course diversions, spring-fed pool diversions, and boat operations on Comal River and Landa Lake, along with infrastructure maintenance and repair, litter collection, and floating vegetation management; and the City of San Marcos’s management of boat operations on the San Marcos River and its infrastructure maintenance and repair (EIS 2-2 Table 2-1). However, as summarized in the EIS, only Alternative 2 offered multiple M&M measures to protect and manage spring flow at Comal and San Marcos Springs; Alternative 3 relied solely on large ASR projects, while Alternatives 1 and 4 did not offer any M&M measures (EIS 2-4 to 2-5, Table 2-2). Alternatives 2 and 3 proposed identical measures to minimize and mitigate impacts to the spring ecosystems (EIS 2-5 to 2-6, Table 2-2). Thus, collectively, Alternative 2 proposed the greatest number of minimization and mitigation measures to protect against the most varied types of impacts, and it was implemented.
REVIEW OF SELECT M&M MEASURES
Vegetation Restoration/Invasive Removal
Minimization and mitigation measures related to vegetation are carried out by the Cities of New Braunfels and San Marcos as well as Texas State University. These activities are largely related to habitat protection or enhancement for the fountain darter and focus on non-native SAV removal, restoration of native SAV species with special attention to the endangered Texas wild rice, and removal of decaying vegetation and maintenance of newly restored sites.
Of interest to the EAA has been understanding the relative differences in restoration and non-native removal techniques applied to the San Marcos and Comal Rivers. This is a valid comparison to make, as lessons learned from each system might be used to improve the effectiveness of vegetation M&M measures in both. In both systems, implementation of these M&M measures is logistically complicated, requiring trained crew who can be relied upon for hard manual labor, have SCUBA or snorkeling experience, and possess scientific technical skills and conscientious quality control habits. Timing must be coordinated between cultivation of plants for use in restoration, and collection of data to document success rates, all the while being mindful of observational data as new techniques or locations are pulled into the restoration effort. In this context, it is likely that each group managing implementation of the vegetation M&M measures has designed a strategy that is uniquely optimized to their organizational and management structure for field and scientific teams. There may be the perception that there is little room for experimentation or adaptation of another’s methods as it would be disruptive in a way that would have unintended consequences on the overall productivity of the teams working in each system.
Fortunately, the two teams that have been implementing vegetation M&M measures in the Comal and San Marcos systems have recently documented differences in technique and provided data to thoroughly and quantitatively evaluate success rates using metrics such as acres planted versus acres sustained (BIO-WEST and Watershed Systems Group, 2016). This effort to synthesize the datasets should serve as an example of how similar efforts related to other M&M measures or monitoring data might be carried out in the future. Every time an M&M measure is implemented, there is a need to document whether it is working. This should be done not only for the first year of implementation, but periodically with a comprehensive synthesis of the monitoring data every five years or so that goes beyond the simple trends analyses found in the HCP annual reports.
Recent restoration efforts in the Comal system involve in situ nursery areas and plugs of plants weighed down in trays that have been deployed
across Landa Lake and the Old Channel. Plants used in the San Marcos system are grown at a facility at Texas State University, and planting occurs immediately following non-native vegetation removal. Removal of non-native plants has focused on Hygrophila in the Comal systems and Hygrophila and Hydrilla in the San Marcos system. Native plants for planting have included Ludwigia, Sagittaria, Cabomba, Heteranthera, and more recently Potamogeton, Vallisneria, Justicia, and bryophytes. Justicia and Vallisneria are not target species in the HCP, but their efficacy in restoration is being explored.
Overall, the BIO-WEST and Watershed Systems Group (2016) study evaluated existing vegetation coverage and presented the area of non-native plants removed versus the sustained planting coverage of native species. In the Comal system, this has resulted in 5,000 m2 of Hygrophila removed since 2013. At the same time, 36,000 native plants were restored resulting in a total of 1,800 m2 of sustained coverage. The definition of “sustained” takes into account the variable coverage from seasonal and inter-annual variability in the populations. In the San Marcos system, 1,800 m2 of Hygrophila has been removed along with 3,400 m2 of non-native Hydrilla. For the time frame evaluated in this study, it is interesting to note that total removal of non-native plants was approximately the same in the two systems (~5,000 m2). The dollars invested in these two programs are also roughly comparable, suggesting that the efficiency of the two teams carrying out the work is about the same.
In terms of native plants restored to the two systems, BIO-WEST and Watershed Systems Group (2016) report a total of 36,000 plants restored to the Comal system, resulting in 1,800 m2 of sustained growth. In the San Marcos system, 22,000 plants were restored, resulting in 700 m2 of sustained coverage. In addition, the San Marcos system separates out their highly successful Texas wild rice program to report 30,000 total plants as associated with 3,600 m2 of areal coverage by February 2016. The ratios of individual plants to resulting coverage in square meters is similar between the two systems (20:1 in the Comal and 31:1 in the San Marcos). The Texas wild rice ratio of eight plants for every resulting square meter of coverage is particularly impressive. This exercise of comparing planting effort to resulting coverage is useful, and we recommend continuing to compute ratios from data such as those reported in BIO-WEST and Watershed Systems Group (2016), further refining the data to be as species specific as possible. The goal of such an exercise should be to seek ways to lower this ratio so that restoration efforts are efficient. Of course, the mechanisms for a given ratio will be a function of a given species colonization potential, growth habits, survival rates, and reproduction.
Although an impressive amount of work has been to both remove non-native vegetation and restore natives, it must be emphasized that a
primary driver for these M&M measures is to provide habitat for the fountain darter. In terms of areal coverage, the overall habitat balance from these efforts has been negative. In the Comal system, there is a net negative coverage of 3,200 m2 from 2013 to February of 2016.1 In the San Marcos system, there is a net negative restoration of SAV on the order of 4,500 m2, although Texas wild rice has provided 3,600 m2 of emergent vegetation. [It should be noted that coverage was adversely affected by a major storm event in October 2015, during which 30 percent of restored Cabomba plantings were lost and upstream erosion led to substantial burial of Ludwigia (Blanton and Assoc., 2016). This points to a potential area of coordination, where upstream erosion and stormwater runoff control measures may be needed to protect planting and sediment control efforts downstream.] The repercussions of these vegetative changes on the fountain darter population are not entirely clear because the data reported in BIO-WEST and Watershed Systems Group (2016) are only from the project areas, which make up only a subset of the total SAV coverage, and because different SAV species have different carrying capacities for fountain darter. In 2013, approximately 37,824 m2 of total vegetation was documented in Landa Lake, while in the Old Channel Project Area there was 4,572 m2.2 So the net loss of SAV in the Comal system due to the vegetation M&M measures constituted about 7.5 percent of the total area. Unless the non-native SAV is poor fountain darter habitat (which it is not), there is not enough new habitat from native plantings to maintain populations of fountain darter to balance non-native plant removal. It may be unpalatable to consider non-native vegetation as fountain darter habitat, but the data used to develop the HCP indicate that both Hydrilla and Hygrophila serve this role. Ultimately, consideration of the vegetation M&M measures must encompass preservation of the fountain darter and Texas wild rice, the two species specifically targeted for protection in the HCP, as the primary end goal for any removal or restoration efforts.
Performance monitoring of the vegetation M&M measures should continue to follow the example laid out in BIO-WEST and Watershed Systems Group (2016). Useful metrics presented therein included number of plants planted, resulting sustained area, coverage of vegetation from baseline maps in 2013, and lessons learned regarding new species or techniques. Another important value to track is the difference between the area of non-native plants removed and the sustained native coverage (reported as m2). This
___________________
1 This calculation is based on 5,000 m2 of Hygrophila removed and 1,800 m2 of native SAV sustainably replanted in the Comal system, and on 3,400 m2 of Hydrilla and 1,800 m2 of Hygrophila removed and 700 m2 of native SAV sustainably replanted in the San Marcos system (BIO-WEST and Watershed Systems Group, 2016).
2 These data come from Table 1 of BIO-WEST and Watershed Systems Group (2016) and reflect the total project area minus the area of bare substrate.
net restoration value can then be compared with the baseline vegetation coverage for a given project reach (as we have done above for the Comal system) to determine the percent change in habitat availability. In order for this to be useful, there must be some effort to convert the areas of nonnative removal and sustained coverage to fountain dater populations, using data for associated fountain darter densities as reported in the HCP or in the calculation of take.
Sediment Accumulation and Removal
Minimization and mitigation measures in support of the HCP include sediment removal at specific locations in the Comal and San Marcos Rivers. The primary goal of this effort is to eliminate sediment that has accumulated that may negatively impact existing SAV or may hinder colonization or survival of new SAV. This may be of direct concern (e.g., to Texas wild rice), or indirect, impacting fountain darters as a result of loss of habitat. The sediment has accumulated as a result of modifications to the river channel, dams, and urbanization and resulting alteration of stormwater runoff as well as natural processes.
Hydraulic suction is being used to remove the accumulated sediment. Divers first disturb the vegetation to drive biota away to minimize their collection during sediment removal. The nozzle of the vacuum is kept in the sediment substrate and not allowed to swing through the water column during the operation. Sensitive areas are also marked to ensure avoidance of vegetated areas of Texas wild rice. An observer is used to monitor the effluent for presence of listed species and all other biota, as well as for the safety of the diver. Sediment samples are sent to the Texas Commission on Environmental Quality (TCEQ) for contaminant testing per TCEQ requirements.
In the Comal River, one specific area of targeted sediment removal is a small island that has formed just behind the Springfed Pool and immediately downstream of Landa Lake. This sediment island continues to grow, has established destructive non-native vegetation, and has displaced/ destroyed fountain darter habitat. Sediment is also of concern along Spring Reach 3 at the western end of the Landa Lake due to steep hillsides and development on that hillside. Efforts in this area are focused on minimizing sediment runoff into Landa Lake to reduce potential negative impacts on the Comal Springs riffle beetle.
In the San Marcos River, the City of San Marcos is removing sediment from the river bottom at various locations from City Park to IH-35. These areas include reaches of the river in City Park, Veramendi Park, Bicentennial Park, Rio Vista Park, and Ramon Lucio Park. In 2015, the focus was on areas downstream of Sewell Park, particularly the confluence of the San
Marcos River with Purgatory Creek. Dredging in Spring Lake and Sewell Park has also been considered, but no dredging took place in these areas in 2015. The method chosen for sediment removal is manpower intensive and slow and of questionable effectiveness. Between November 2014 and November 2015, an area of approximately 284 m2 and volume of 85 m3 of fine sediment was removed from the San Marcos River (Blanton and Assoc., 2016). This is modest compared to the goal of adding more than 1,000 m2 of Texas wild rice in 2015.
There appears to be limited knowledge as to whether ongoing deposition will restore sediment loads in these areas. It is possible that the locations where fine sediments have accumulated tend to be natural depositional sites where continued deposition is likely to occur without substantial control of the upstream watershed. Bank pins and turbidity loggers could be used to evaluate sediment deposition where background knowledge is not currently available. Bank pins are low cost and have been used extensively in the Chesapeake Bay watershed to measure erosion.
High flow events simultaneously erode the sediment bed and remove the restored fauna. As mentioned previously, during a high flow event in October 2015, some 30 percent of restored Cabomba plantings were lost and subsequent deposition of gravel and sediment due to erosion of upstream areas led to substantial burial of Ludwigia. More established plantings were less impacted, but this illustrates that both replanting efforts and sediment removal efforts are at risk without more effective control of upstream erosion. In the Comal River the same flood led to only 10 to 15 percent loss of restored vegetation but led to an approximate 80 percent loss of bryophytes and to the accumulation of sediment and other debris in habitat areas.
It is too early to determine whether any of the current specific sediment removal efforts are having positive impacts on the river and the biota. All sediment removal actions should be coupled to monitoring efforts to demonstrate their efficacy. In addition to approaches such as bank pins to assess erosion, water depth and sediment accumulation should be monitored in areas being considered for sediment removal as well as post-removal. Maps of sediment accumulation should be prepared and monitored over time in the same manner that vegetation area is monitored over time. Monitoring is critical to the evaluation of the effectiveness of sediment removal efforts.
In summary, sediment removal activities can provide positive benefits in terms of enhancing SAV habitat and minimizing negative impacts on both vegetation and associated biota. However, the effectiveness of the current actions is unclear, especially in the San Marcos River where the sediment dynamics (including ongoing deposition) are either unknown or known to be controlled by erosion in upstream areas. The EAA has limited control over management of upland erosion. It is of little use to implement time-
consuming sediment removal actions if the sediment is redeposited in subsequent storm events. This has occurred at the confluence of Purgatory Creek with the San Marcos River where a single storm event led to excessive sediment accumulation in an area that had undergone sediment removal. Similarly, efforts at Bicentennial Park are likely to have limited success because any sediment removal may be reversed by high flow events. A major sediment removal at the confluence of Sessom Creek with the San Marcos River has undergone substantial assessment, but the effort may be negated by sediment input from areas upstream of the control of EAA. In general, sediment removal activities should be limited to areas where ongoing upland sources or natural stream dynamics will NOT lead to deposition of new sediment within a matter of years.
Given these constraints, it may seem more appropriate to direct efforts toward controlling potential sediment sources than to attempt to remove sediment already in the river. However, it should be noted that the benefits of stormwater control measures tend to be local, and it can be difficult to install enough upstream measures to see an effect in the main channel.
Dissolved Oxygen Management in Landa Lake
Managing the dissolved oxygen status of Landa Lake is a mitigation and minimization measure, but it is not specifically called for in the HCP. Rather, an Applied Research project on dissolved oxygen in Landa Lake was conducted in 2015, the results of which are described in detail in Chapter 5. In summary, it appears that low concentrations of dissolved oxygen are not a widespread problem in Landa Lake and Upper Spring run except for a few isolated locations during stagnant periods of low flow. It is likely that fountain darters and other species of concern can move to avoid these areas of low oxygen concentration. Furthermore, the 2015 study on effects of aeration on dissolved oxygen concentrations (BIO-WEST, 2015) showed that aeration had only minimal effects, raising dissolved oxygen concentrations less than 1 mg/L. Therefore, the Committee recommends that aeration not be used routinely as a mitigation measure but be held in reserve to be used only in case of severe low oxygen conditions throughout all of Landa Lake. If floating mats cover more than 25 percent of the surface of Landa Lake and dissolved oxygen concentrations decrease, then manual breaking up and removal of the floating mats should be considered as a mitigation measure. The Committee further recommends that monitoring the dissolved oxygen concentrations using the miniDOTs in selected areas of Landa Lake and Upper Spring Run be incorporated into an integrated water quality and biological monitoring program.
Voluntary Irrigation Suspension Program Option
The Voluntary Irrigation Suspension Program Option (VISPO) is a program for holders of irrigation water rights who are willing to suspend use of all or a portion of their authorized pumping rights. Participants are financially compensated. The EAA determines each October 1st if the aquifer has declined to a level at or below 635 feet above mean sea level in the J-17 index well (which lies about 2 miles north of downtown San Antonio in Bexar County). If this occurs, program participants are required to suspend pumping for the following calendar year. The goal of this voluntary program is to enroll 40,000 acre-feet (49.32 million m3) of permitted irrigation rights that will remain unused in years of severe drought. The program has two options: five-year, and ten-year.
As of April 2016, there was a combined total enrollment of 40,921 acre-feet, with 25,471 acre-feet enrolled in the 5-year program option and 15,450 acre-feet in the 10-year program option. The total enrollment amount exceeds the program goal contained in the HCP. The 5-year commitments enrolled in VISPO extend until December 2018. As shown in Table 6-1, the program will cost $29.2 million over the first 7 years of the HCP. Since the program’s inception, participants were required to reduce their pumping in 2015 because the well J-17 was below the trigger elevation on October 1, 2014.
One drawback of the VISPO is that the trigger is based on the October 1 groundwater elevation. In the September time frame, groundwater elevations are typically beginning to recover from summertime lows as water demands decrease. However, the October 1 date does not necessarily reflect the lowest groundwater elevation, somewhat limiting its utility as a spring flow protection measure. As discussed in Chapter 2, the Committee recommends that Phase 2 of the HCP implement a Decision Support System to replace the triggers for the spring flow protection measures. The Decision Support System would incorporate additional information, such as modeling projections of future groundwater elevations, to determine when the spring flow protection measures would be triggered. For example, the 12-month outlook of the water levels at an index well would be modeled probabilistically, and a pre-determined action would be taken if there is reasonable probability that the water level will be at or below a critical value within that 12-month period.
Regional Water Conservation Program
The Regional Water Conservation Program (RWCP) offers incentives to municipalities to encourage water conservation in exchange for half of all conserved water to remain unpumped in the aquifer for 15 years. The
goal of the program is to conserve 20,000 acre-feet (24.66 million m3) of Edwards Aquifer pumping. For the target of 20,000 acre-feet conserved, 10,000 acre-feet would remain in the aquifer to sustain aquifer levels in support of continued spring flow. Conserved water that remains in the aquifer is held in a “groundwater trust.” The other 10,000 acre-feet of conserved groundwater is available for pumping by the participating entity.
The RWCP currently includes activities focused on municipal water retailers. The program also provides assistance through low-flow toilet programs, leak detection, and other water use efficiency efforts.
The 2014 HCP Annual Report states, “To show that this measure is reasonably certain to occur, the EAA’s goal was to obtain ‘initial commitments’ in the amount of 10,000 acre-feet/year in 2013. As conserved water is committed to the groundwater trust, the initial commitment water is to be returned to the committing entity. At present, the San Antonio Water System (SAWS), Texas State University, and the City of San Marcos have made initial commitments in the amount of 8,400 acre-feet” (Blanton and Assoc., 2015).
The January 2015 report of the Regional Water Conservation Program Work Group (EAHCP, 2015) included recommendations to increase participation in the RWCP. In 2015 SAWS committed to conserve 19,612 acre-feet by the year 2020 through a new leak-repair program, with one-half of the commitment in the leak-repair program going to the groundwater trust so that the water remains in the aquifer. The City of Uvalde and Universal City are also participating in the program. It is anticipated that by 2020 the RWCP will exceed the program’s goal.
Stage V Critical Management Period
The Stage V Critical Management Period is an additional step beyond Stages I-IV that requires a pumping reduction of 44 percent from any Edwards Aquifer groundwater permit. The Stage V triggers for the San Antonio Pool are a monthly average 625 ft groundwater elevation at well J-17 or if the Comal Springs flow rate reaches specific rates. The trigger for the Uvalde Pool is 840 ft groundwater elevation at well J-27 (which lies in the city of Uvalde). The HCP framework is designed so that Stage V is triggered only when other measures have not proven effective in maintaining spring flow during drought conditions.
Through April 2016, Stage V has not been triggered for the San Antonio Pool. Figure 6-1 shows the J-17 monitoring well groundwater elevation for the last six years. Since January 2010, the lowest J-17 groundwater elevation observed was 625.9 feet above mean sea level on September 3, 2014. In 2015, the groundwater elevation in well J-27 recovered from low levels that triggered Stage V restrictions in the Uvalde Pool. Currently there is no Critical Management Period in effect in the region.
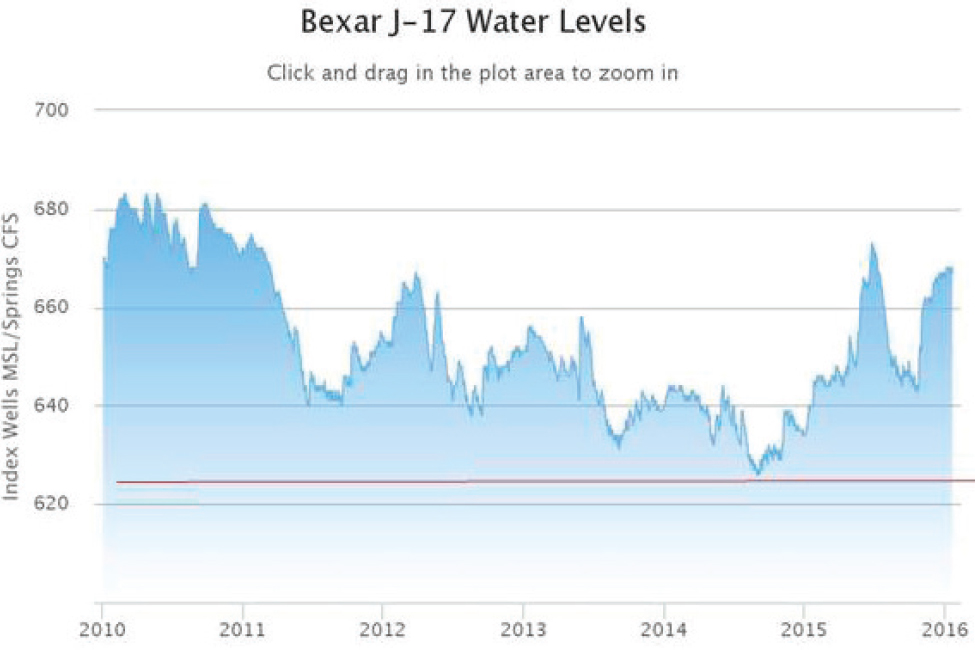
SOURCE: www.edwardsaquifer.org (accessed 1-19-2016).
Aquifer Storage and Recovery
In August 2013, the EAA and SAWS developed an agreement for the use of the SAWS’ Twin Oaks ASR in the HCP. The EAA-SAWS agreement terminates in March 2028. The EAA acquires leases of permitted Edwards Aquifer pumping, and this water is stored in the ASR system. When specified triggers are reached, SAWS will use water stored in the ASR as a base load supply in its area in the general vicinity of the springs, offsetting SAWS Edwards Aquifer demands.
Initially, the rate at which the EAA acquired leases to put water into the ASR lagged behind the target volume. However, in 2015 the EAA increased efforts to acquire leases. In 2015-early 2016, the EAA was managing a program that offers two methods for permit owners to participate: a leasing program with three lease options (10 years—$160 per acre-foot, 5 years—$140 per acre-foot, and 1 year—$120 per acre-foot) and a pooling program. The pooling program utilizes storage of unpumped water. On an annual basis, the pooling program estimates the volume of water that will be unpumped by pooling participants and provides notice to SAWS to store a portion of that water in the ASR. Participants in the pooling program are compensated $50 per acre-foot for their participation. The EAA has indicated that they will continue implementing the leasing program and pooling program through 2016 and make adjustments to the program going forward. For the ASR flow protection measure, the EAA is committed to acquiring 50,000 acre-feet (61.65 million m3) of Edwards permits. As of mid-April 2016, the total leases were 27,015 acre-feet. In addition, in 2015 the EAA was able to provide SAWS with 500 acre-feet of pooled water through the pooling program.
Evaluation of Long-Term Reliability of Twin Oaks ASR
Two studies regarding the SAWS Twin Oaks ASR have been prepared under the supervision of Alan Dutton of the University of Texas at San Antonio. Rabel and Dutton (2014) estimate the capacity of the “massive sand” in the Carrizo Aquifer based on thickness and porosity determined from geophysical logs. Based on their findings, the area of the ASR site for which this pore volume is calculated is 3,022 acres, with a 37 percent average porosity in the injection interval and the average net sandstone thickness of 198 feet in the injection interval. Total pore volume of the main injection zone is estimated to be 233,400 ± 9,000 acre-feet, with a range from 229,700 acre-feet to 266,000 acre-feet, based on use of different log suites (density porosity, total combinable magnetic resonance and sonic logs) (Rabel and Dutton, 2014).
Azobu and Dutton (2014) determined relative volume fractions of Edwards and Carrizo aquifer water within the SAWS ASR site through geochemical modeling. The two waters are geochemically distinct; however, several factors contribute to complexity in estimating the representative fractions. The average Edwards volume fraction is approximately 83 percent based on recovered groundwater samples (Azobu and Dutton, 2014).
Given the importance of the ASR performance to the success of the HCP, appropriate due diligence should be applied to verify the future long-term reliability of the ASR system. Long-term reliability of the ASR system is particularly important if the HCP considers using the ASR system after the current EAA-SAWS contract expires in 2028. Determining the long-term reliability will likely involve additional data collection and studies. The Committee requested information on various water quality, rock-water interaction, and well performance issues. For example, pyrite is reported as a trace mineral in the Carrizo Aquifer (Pearson and White, 1967). This mineral is known to be associated with arsenic and other constituents that may cause water quality issues under variable redox conditions such as ASR (Arthur et al., 2005; Maliva et al., 2006; NRC, 2008). While reports exist for assessing water mixing and water-rock interaction (Otero and Petri, 2010; Malcolm Pirnie, Inc. et al., 2011; Crow, 2012), data are not available to fully evaluate the effects of these processes on stored and recovered water quality over time. The information provided by SAWS did not provide sufficient data to address the potential issues of concern. As water-resource strategies evolve at the Twin Oaks ASR system, any changes in water sources to be mixed with Edwards Aquifer water should be assessed for water quality changes related to mixing of multiple sources, as well as water-rock interactions, to determine potential for adverse water quality changes. Laboratory bench-scale studies, appropriately designed field testing, and geochemical modeling are important tools in this regard.
During a field trip held on February 2, 2016, committee members discussed the performance of the ASR system with SAWS staff. SAWS staff indicated that ASR well injection performance has remained consistent, and they have not observed adverse well performance issues since the ASR began operations in 2004. SAWS staff also indicated they have not observed any adverse rock-water interactions. The EAA and SAWS should give further consideration to evaluating the following items, which may be potential issues in future utilization of the ASR system:
- Are there any geochemical reactions between the Edwards Aquifer injected/recharged water and the aquifer permeable matrix that may cause adverse water quality issues in the short or long term, especially as the storage volume increases to encounter aquifer matrix not yet exposed to the Edwards Aquifer groundwater?
- Are there any geochemical reactions between the injected Edwards Aquifer groundwater and native Carrizo Aquifer groundwater that may cause adverse water quality issues in the short or long term?
- Is there any evidence of mineral precipitation in the aquifer or on well materials (e.g., models or projections of porosity declines in the ASR storage zone) that may affect long-term system performance?
- What are the long-term trends in ASR well performance? Pyne and David (2005) and the National Groundwater Association (2014) describe the importance of monitoring ASR well performance. A common measure of injection well performance is the injection rate divided by the head rise (specific injection).
The Committee recommends that the following activities be initiated: (1) at a minimum of annually, determine specific injection at each ASR well to assess if there are any long-term changes in ASR well performance, (2) design and implement water quality monitoring for arsenic and related constituents in monitoring wells during recharge and storage events, and (3) design and implement water quality monitoring in ASR wells during recovery events.
CONCLUSIONS AND RECOMMENDATIONS
Implementation of key M&M measures, which are critical to the success of the HCP, is moving in the right direction, with the various programs being characterized by competent project teams, sustained effort, and adequate initial performance monitoring. In general, for every M&M measure implemented, performance monitoring should be done not only for the first year, but regularly during implementation, with a comprehensive synthesis of the monitoring data about every five years that goes beyond the simple trends analyses found in the HCP annual reports. The following specific recommendations pertain to individual M&M measures.
SAV Removal and Restoration. Substantial progress has been made removing non-native vegetation from both the Comal and San Marcos systems and replacing it with native SAV species. Nonetheless, despite this sustained effort, there is not enough new habitat from native plantings to maintain populations of fountain darter to balance non-native SAV removal. This should be verified by considering the carrying capacity of the various SAV species (both native and non-native) for fountain darter.
Sediment Management. In general, sediment removal activities should be limited to areas where ongoing upland sources or natural stream dynamics will NOT lead to deposition of new sediment within a matter of years.
Dissolved Oxygen Management in Landa Lake. The Committee recommends that aeration not be used routinely as a mitigation measure. If floating mats cover more than 25 percent of the surface of Landa Lake and dissolved oxygen concentrations decrease, then manual breaking up and removal of the floating mats should be considered as a mitigation measure. Monitoring of dissolved oxygen concentrations using the miniDOTs in selected areas of Landa Lake and Upper Spring Run should be incorporated into an integrated water quality and biological monitoring program.
Voluntary Irrigation Suspension Program Option. When the HCP is reviewed for renewal, it may be appropriate to re-evaluate the time period that the VISPO trigger is based on using a Decision Support System. Consideration should be given to redefining the trigger to use additional information, such as groundwater elevation from a longer time frame, precipitation and recharge data, and groundwater model projections of future conditions.
Aquifer Storage and Recovery. The Committee recommends that the following activities related to aquifer storage and recovery be initiated: (1) at a minimum of annually, determine specific injection at each ASR well to assess if there are any long-term changes in ASR well performance, (2) design and implement water quality monitoring for arsenic and related constituents in monitoring wells during recharge and storage events, and (3) design and implement water quality monitoring in ASR wells during recovery events.
All Spring Flow Protection Measures. The total expense to implement the HCP in 2015 was $16,397,097 (Blanton and Assoc., 2016), with the spring flow protection measures accounting for 67 percent of total expenses. Due to the high expense of the spring flow protection measures and their importance to the HCP’s success, the Committee recommends that compliance of the parties participating in the spring flow protection measures be audited so that there is assurance that parties are complying with the terms of the program and the program will operate as designed.
REFERENCES
Arthur, J. D., A. A. Dabous, and J. B. Cowart. 2005. Chapter 24: Water-rock geochemical considerations for aquifer storage and recovery: Florida case studies, in Tsang, C-F. and Apps, J.A., eds., Underground Injection Science and Technology, Developments in Water Science. Amsterdam, Elsevier, v. 52, pp. 327-339.
Azobu, J. O., and A. R. Dutton. 2014. Using Geochemical Modeling (PHREEQC) to Determine Edwards Volume Fraction in Mixed Groundwaters from the Edwards and Carrizo Aquifers at San Antonio Water System Aquifer Storage and Recovery (ASR) Site, Bexar County, Texas.
BIO-WEST. 2015. Supplemental Dissolved Oxygen Evaluation in Landa Lake.
BIO-WEST, Center for Reservoir and Aquatic Systems Research, and Aqua Strategies. 2015. Algae and Dissolved Oxygen Dynamics of Landa Lake and the Upper Spring Run.
BIO-WEST, Inc. and Watershed Systems Group, Inc. 2016. Submerged Aquatic Vegetation Analysis and Recommendations. Edwards Aquifer Habitat Conservation Plan Contract No. 15-7-HCP June, 2016.
Blanton and Associates. 2015. Edwards Aquifer Habitat Conservation Plan 2014 Annual Report. Submitted to the U.S. Fish and Wildlife Service March 13, 2015.
Blanton and Associates. 2016. Edwards Aquifer Habitat Conservation Plan 2015 Annual Report. Submitted to the U.S. Fish and Wildlife Service March 22, 2016.
Crow, C. L. 2012. Water-level altitudes and continuous and discrete water quality at and near an aquifer storage and recovery site, Bexar, Atascosa, and Wilson Counties, Texas, June 2004–September 2011: U.S. Geological Survey Scientific Investigations Report 2012–5260, 85 pp., 7 apps.
EAHCP. 2015. January 15, 2015 report of the Regional Water Conservation Program Work Group.
Malcolm Pirnie et al. 2011. An assessment of aquifer storage and recovery in Texas, Texas Water Development Board Report # 0904830940, 200 p. https://www.twdb.texas.gov/innovativewater/asr/projects/pirnie/doc/2011_03_asr_final_rpt.pdf.
Maliva, R. G., W. Guo, and T. M. Missimer. 2006. Aquifer Storage and Recovery: Recent Hydrogeological Advances and System Performance. Water Environment Research 78(13):2428–2435.
National Groundwater Association (NGWA). 2014. Best Suggested Practices for Aquifer Storage and Recovery. Approved by NGWA Board of Directors on July 16, 2014.
National Research Council (NRC). 2008. Prospects for Managed Underground Storage of Recoverable Water. Washington, DC: The National Academies Press.
Otero, C. L., and B. L. Petri. 2010. Quality of groundwater at and near an aquifer storage and recovery site, Bexar, Atascosa, and Wilson Counties, Texas, June 2004–August 2008: U.S. Geological Scientific Investigations Report 2010–5061, 34 pp.
Pearson Jr., F. J., and D. E. White. 1967. Carbon 14 ages and flow rates of water in Carrizo Sand, Atascosa County, Texas. Water Resources Research 3: 251–261.
Pyne, R., and G. David. 2005. Aquifer Storage and Recovery: A Guide to Groundwater Recharge Through Wells. 2nd ed. Gainesville, FL: ASR Press.
Rabel, B. C., and A. R. Dutton. 2014. Estimation of Volumetric Capacity of an Aquifer Storage and Recovery (ASR) Field Operated by San Antonio Water System, Bexar County, Texas.
This page intentionally left blank.


