G
Subsea Environmental Factors for Fastener Design
OCEAN ENVIRONMENT
Underwater Environments
Salinity
Sea water contains various organic and inorganic matter and a few atmospheric gasses in suspension or in solution. The inorganic matter consists of salt ions, mainly sodium ( Na+) and chloride (Cl−), though sulfate (SO24−), magnesium (Mg2+), calcium (Ca2+), and potassium (K+) may also be present. These ions make up approximately 99 percent of all salts dissolves in seawater.
The salinity of sea water is nominally 35 g/kg expressed as parts per thousand (ppt). However sea water salinity is not constant in terms of location, time, or depth. There are several factors that affect the salinity of sea water, including the following:
- Temperature,
- Pressure,
- Evaporation,
- Fresh water influx (rainfall, influx from fresh water streams, glacial melting),
- Wind, and
- Ocean currents.
Figure G.1 shows the 1955 to 2012 average annual mean sea water salinity around Earth. The North and South Atlantic have zones of relatively high salinity
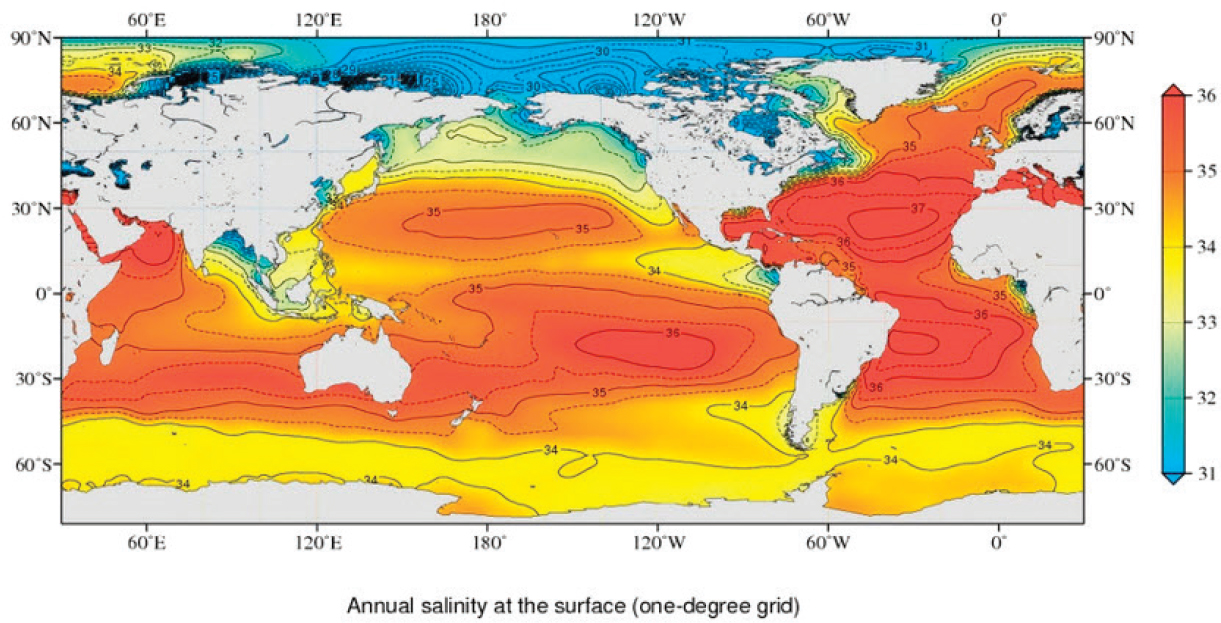
compared with the Pacific Ocean, which is diluted by rainfall during the monsoon season. The Mediterranean Sea has very high salinity levels. The Gulf of Mexico (GOM) has moderately high salinity in its southern half.
Table G.1 shows the effect of seawater salinity on density. This chart ignores the effect of water compressibility.
Water salinity in the Gulf of Mexico varies with time, depth, and location—varying between 35.6 ppt and 36.5 ppt. Salinity variations this small do not appreciably affect the density of water.
There are also hypersaline pools in the Gulf of Mexico. These hypersaline pools contain seawater with up to 8 times the chloride ion concentration of normal seawater.1
Temperature
The temperature of seawater at the ocean surface varies from approximately −2°C to +30°C, depending on surface temperature, cloud cover, latitude, ocean currents, and the time of year. Mid-ocean surface temperatures vary with latitude in response to the balance between incoming solar radiation and outgoing longwave radiation. There is an excess of incoming solar radiation at latitudes less than approximately 45° and an excess of radiation loss at latitudes higher than approximately 45°. Superimposed on this radiation balance are seasonal changes in the intensity of solar radiation and the duration of daylight hours due to the tilt of Earth’s axis to the plane of the ecliptic and the rotation of the planet about this axis. The combined effect of these variables is that average ocean surface temperatures are higher at low latitudes than at high latitudes. Because the Sun, with respect to
TABLE G.1 Density of Seawater versus Salinity and Temperature (g/cm3)
| Temperature | Salinity (psu) | |||||
|---|---|---|---|---|---|---|
| °C | °F | 5 | 10 | 20 | 30 | 35 |
| 0 | 32 | 1.00397 | 1.00801 | 1.01607 | 1.02410 | 1.02813 |
| 5 | 41 | 1.00401 | 1.00797 | 1.01586 | 1.02374 | 1.02770 |
| 10 | 50 | 1.00367 | 1.00757 | 1.01532 | 1.02308 | 1.02697 |
| 15 | 59 | 1.00301 | 1.00685 | 1.01450 | 1.02215 | 1.02599 |
| 20 | 68 | 1.00207 | 1.00586 | 1.01342 | 1.02098 | 1.02478 |
| 25 | 77 | 1.00087 | 1.00462 | 1.01210 | 1.01960 | 1.02336 |
| 30 | 86 | 0.99943 | 1.00315 | 1.01057 | 1.01801 | 1.02175 |
___________________
1 Carl Szczechowski, “Physical Oceanography Synopsis,” presentation to the committee on June 6, 2017.
Earth, migrates annually between the Tropic of Cancer and the Tropic of Capricorn, the yearly change in heating of Earth’s surface is small at low latitudes and large at mid- and higher latitudes.”2
Figure G.2 shows the 1955 to 2012 average annual mean sea water temperature around Earth. As could be expected the Gulf of Mexico is in the warmer zone near Earth’s equator.
Water temperature gets colder with increasing depth, due mainly to the lack of heating by solar radiation. In ultra-deepwater, temperatures can reach as low as −1°C (30.2°F).
Water temperature in the Gulf of Mexico varies with time, depth, and location—varying between 40°F and 79°F (4°C to 26°C). Although there is some expansion of water due to temperature, variations this small do not appreciably affect the density of water.
Dissolved Salts
The relative concentrations of various salt ions in sea water vary little, and should have very little impact on sea water density.
Water Compressibility
Water is relatively incompressible, ranging from 5.1E−10 Pa-1 (3.5E-6 psi−1) at 32°F (0°C) at zero pressure to a low of 4.4E-10 (3.0E−6) at °F (45°C) and zero pressure.3 Water compressibility, therefore, is not considered to be a significant factor in determining water density.
Water Density
Water density affects the pressure exerted on underwater equipment at depth. In fact water density and water depth are the only two factors in determining water pressure at depth. Figure G.3 shows the 1955 to 2012 average annual mean sea-surface density of water in the world’s oceans.
Although water is relatively incompressible, it’s density does increase slightly with water pressure.
___________________
2 National Oceanic and Atmospheric Administration (NOAA), National Centers for Environmental Information, “Ocean Climate Laboratory Team, World Ocean Atlas 2013 Version 2, WOA13F V2 Interactive Image Access,” https://www.nodc.noaa.gov/cgi-bin/OC5/woa13fv2/woa13fv2.pl, accessed October 18, 2017.
3 R.A. Fine and F.J. Millero, Compressibility of water as a function of temperature and pressure, Journal of Chemical Physics 59(10):5529, 1973.
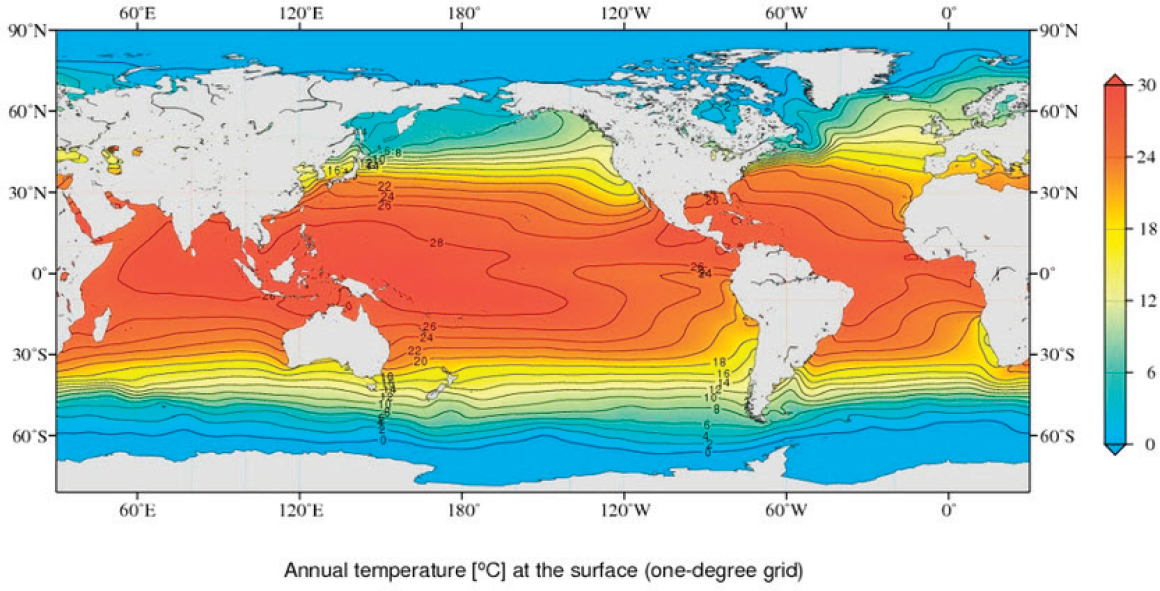
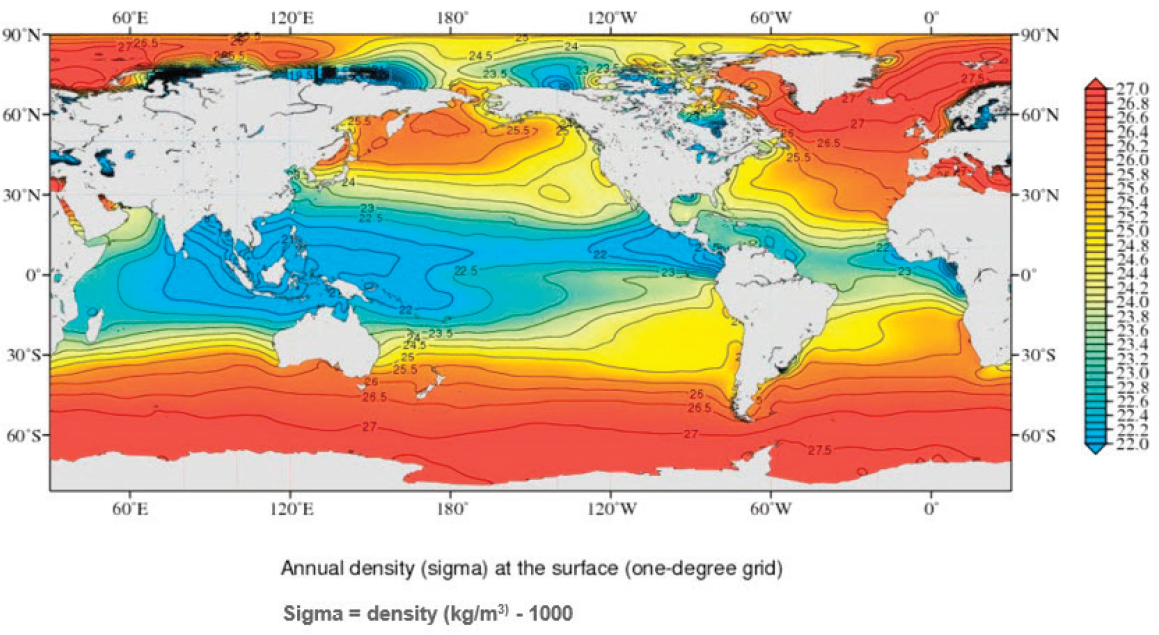
Table G.2 shows the effect of pressure on density. It reflects the compressibility of 35 ppt sea water at 0°C.
It should be noted that the density values in Table G.2 have also been shown in customary U.S. (except California) of pounds per U.S. gallon.
As per current oilfield practice, density has also been converted to pressure gradient expressed in terms of psi per foot (of depth). Pressure gradient is calculated from density by the formula:
Pressure gradient (psi/ft) = Density (ppg) × 0.052
For example, at 100 bar (145 psi) a 35ppt seawater at 0°C will have a density of 8.6196 ppg. At a depth of 100 ft., the pressure gradient will be:
8.6196 ppg × 0.052 = 0.448195 psi/ft.
The pressure exerted by the water will be:
100 ft. × 0.448195 psi/ft. = 44.8195 psi
Neither Table G.1 nor Table G.2 give a full representation of the relationship of seawater density to the combination of salinity, temperature, and pressure. The actual density of seawater is a much more complex relationship. In addition, in-situ salinities and temperatures are very dynamic properties and are difficult to predict.
TABLE G.2 Density of Seawater versus Pressure
| Density Changes with Pressure (seawater 35 parts per thousand and 0°C) |
||||
|---|---|---|---|---|
| Pressure (bar) | (psig) | Density (kg/m3) | (ppg) | Pressure Gradient (psi/ft) |
| 0 | 0.0 | 1028.13 | 8.57974 | 0.446147 |
| 100 | 145.0 | 1032.85 | 8.61913 | 0.448195 |
| 200 | 290.1 | 1037.47 | 8.65769 | 0.450200 |
| 400 | 580.2 | 1046.40 | 8.73221 | 0.454075 |
| 600 | 870.2 | 1054.95 | 8.80356 | 0.457785 |
| 800 | 1,160.3 | 1063.15 | 8.87199 | 0.461343 |
| 1,000 | 1,450.4 | 1071.04 | 8.93783 | 0.464767 |
SOURCE: F.T. Mackenzie, “Seawater,” Encyclopædia Britannica Online, 2017, accessed April 28, 2017, https://www.britannica.com/science/seawater. In this reference, the “Density changes with depth” table on page 7 has been corrected to remove the depth parameter because the depth versus pressure relationship was erroneously based on the density of pure water, not 35 ppt sea water at 0°C.
Water Depth
Fresh water has a density of 1.00 g/cm3, or 8.337 ppg (pounds per U.S. gallon). Generally, 35 ppt sea water has a density of 1.02813 g/cm3 (1.02813 specific gravity). There are minor variations to this “nominal” sea water density depending on water salinity and temperature.
Table G.3 shows how water density, and the resulting pressure gradient, change with increasing pressure at depth. Note that the far-right column shows the calculated pressure using the oilfield norm of 8.6 ppg.
The assumed water density value of 8.6 ppg has served the industry for decades. As is shown Table G.3, if sea water density from Table G.2 is used to predict sea water density and pressure versus depth, the effective density at 2,000 m (6,562 ft.) feet is psi/ft. is 8.66 ppg, the pressure gradient is 0.44920 psi/ft., and the pressure is 2,941.0 psi. If the usual seawater density of 8.6 ppg is used, the calculated pressure
TABLE G.3 Density and Pressure of Seawater versus Depth (seawater 35 parts per thousand and 0°C)
| Depth Section | Depth | Density | Gradient | Pressure | Pressure | ||
|---|---|---|---|---|---|---|---|
| At depth | Average | At depth | Avg ppg | ppg=8.6 | |||
| (m) | (feet) | (ppg) | (ppg) | (psi/ft) | (psi) | (psi) | |
| 1 | 0 | 0 | 8.57974 | 8.57974 | 0.44615 | 0.0 | 0.0 |
| 1,000 | 3,281 | 8.61913 | 8.59944 | 0.44717 | 1,467.2 | 1,467.3 | |
| 2 | |||||||
| 2,000 | 6,562 | 8.65769 | 8.63841 | 0.44920 | 2,941.0 | 2,934.5 | |
| 3 | |||||||
| 4,000 | 13,124 | 8.73221 | 8.69495 | 0.45214 | 5,907.9 | 5,869.1 | |
| 4 | |||||||
| 6,000 | 19,686 | 8.80356 | 8.76788 | 0.45593 | 8,899.7 | 8,803.6 | |
| 5 | |||||||
| 8,000 | 26,248 | 8.87199 | 8.83777 | 0.45956 | 11,915.4 | 11,738.1 | |
| 6 | |||||||
| 10,000 | 32,810 | 8.93783 | 8.90491 | 0.46306 | 14,954.0 | 14,672.6 | |
NOTE: Pressure at depth is calculated using the average sea water density on the depth section.
at depth is 2,934.5 psi. Similarly, at 13,124 ft., the difference in calculated pressure at depth is 5907.9 psi vs. 5969.1 psi.
It can be concluded that the use of 8.6 ppg (1.031 SG; 0.4472 psi/ft.) is sufficiently accurate for use in the Gulf of Mexico where water depths rarely exceed 10,000 ft. (3,048 m)
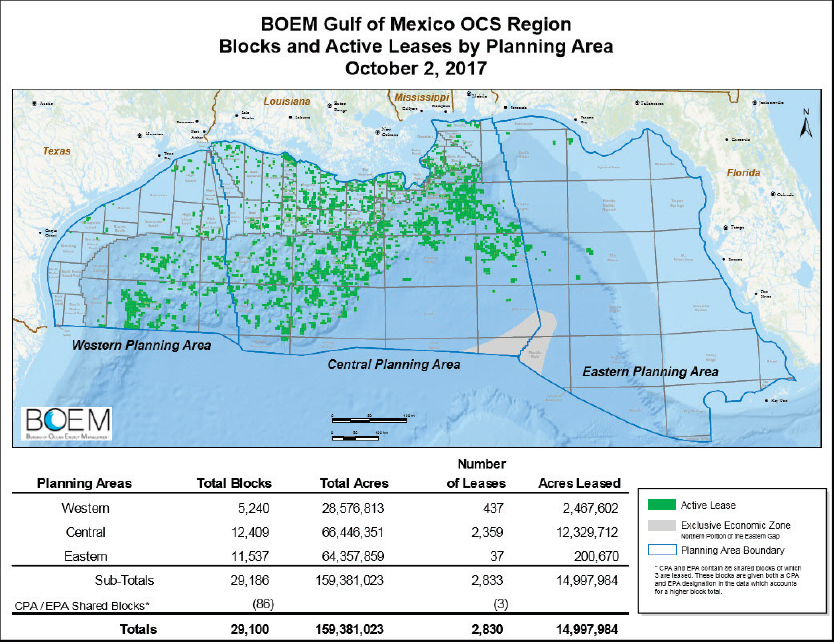
Gulf of Mexico Application Environments
The previous section was intended to give an overview of the physical parameters of seawater that need to be considered when designing underwater equipment. This section will narrow in on the U.S. Gulf of Mexico which is the target area for this study.
Figure G.4 shows the oil and gas leases in the United Stated sector of the Gulf of Mexico. For the purposes of this study we will be further investigating the operating environment in this area.
Gulf of Mexico Bathymetry
Water depth is perhaps the most significant contributor to the design and operational challenges faced by the oil and gas industry in the Gulf of Mexico.
Figure G.5 shows the bathymetry of the entire Gulf of Mexico. In U.S. waters, the Gulf of Mexico is characterized by a wide, shallow shelf (the Outer Continental Shelf) that slopes gently down to 100 to 300 m (328 to 984 ft.). There is then a very steep slope down to approximately 1,000 m (3,281 ft.), followed by a moderately steep slope down to 3,000 m (9,843 ft.). The remainder of the Gulf appears to be a relatively flat plain with a depth of approximately 3,000 m (9,843 ft.). There are other features in the Gulf, such as the Mississippi Fan reflecting the sediments carried by the Mississippi River and dumped into the Gulf.
There is a similar sedimentary fan to the West of the Mississippi Fan likely formed by a prehistoric predecessor to the current-day Mississippi River. There is also a small fan at the outlet of the Rio Grande River.
High Currents in the Gulf of Mexico
Unique to the Gulf of Mexico, the loop current is an area of warm water flowing from the Caribbean Sea between Cuba and the Yucatan Peninsula. This ware water then loops east and exits the Gulf between Florida and Cuba (known as the Florida Current). The Florida Current, and its parent, the Loop Current, feed the Gulf Stream flowing warm water up the East Coast of the Atlantic Ocean. The Loop Current is one of the fastest currents in the Atlantic Ocean, reaching speeds of about 2.9 to 3.9 knots (1.5 to 2.0 m/s) at the surface. It is about 125 to 190 mi (200 to 300 km) wide and 2,600 ft. (800 m) deep.
The Loop Current pulsates “quasi-regularly” (every 3 to 17 months) north into the Gulf of Mexico as far as the U.S. coastline. The Loop Current occasionally “spins off” eddy currents as it moved back to the south. These eddy currents are large clockwise rotating rings of warm water swirling at 3.5 to 3.9 knots (1.8 to 2.0 m/s). They can have diameters of 125 to 250 mi (200 to 400 km) and can reach depths of 3,281 ft. (1,000 m). Eddy currents drift slowly west-southwest at about 1.2 to 3.1 mi/day (2 to 5 km/day) and have a lifespan of up to a year before hitting Texas or Mexico.4,5,6,7
___________________
4 J. Masters, “The Gulf of Mexico Loop Current: A Primer,” Weather Underground, https://www.wunderground.com/hurricane/loopcurrent.asp, accessed October 18, 2017.
5 Texas Pelagics, “Gulf of Mexico Loop Current,” http://texaspelagics.com/gom-info/gom-loop/, accessed October 18, 2017.
6 NOAA, Okeanos Explorer, “Gulf of Mexico Loop Current,” http://oceanexplorer.noaa.gov/okeanos/explorations/ex1202/background/loopcurrent/welcome.html, accessed October 18, 2017.
7 J. Sheinbaum, J. Candela, A. Badan, and J. Ochoa, Flow structure and transport in the Yucatan Channel, Geophysical Research Letters 29(3):10-1-10-4, 2002, doi:10.1029/2001GL013990.
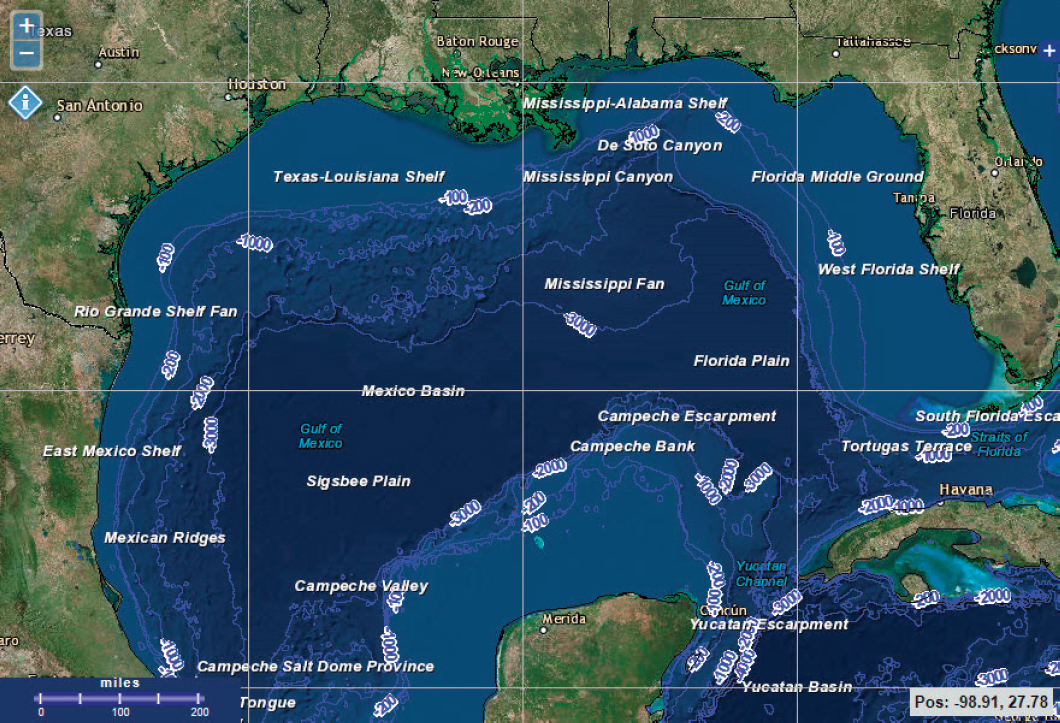
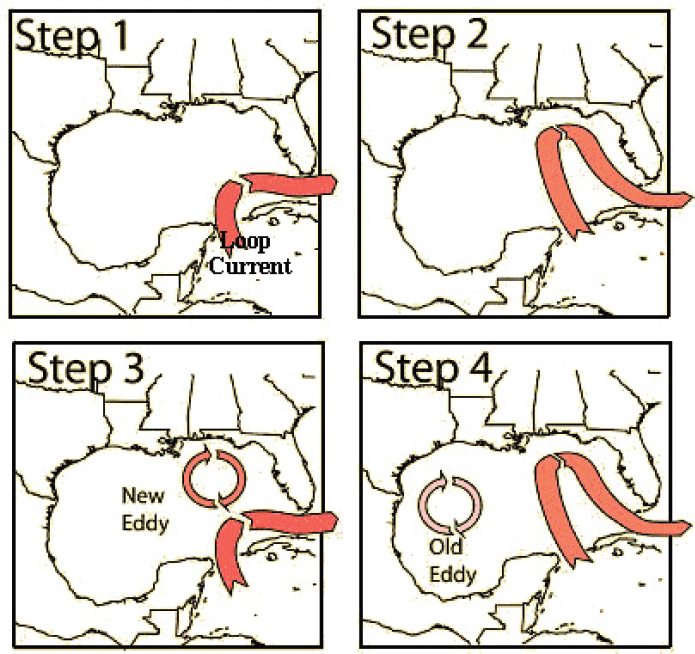
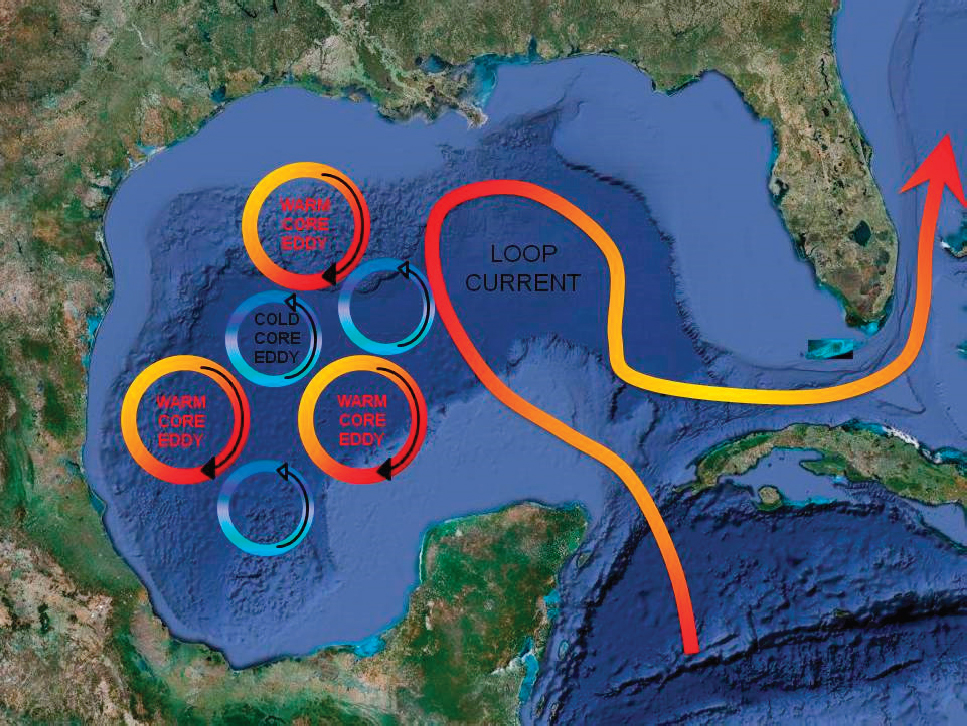
Figure G.6 depicts this Loop Current/eddy current process. Figure G.7 is a diagrammatic Loop Current map that indicates the presence of counter-clockwise rotating “cold core eddies” spaced in between the cyclonic “warm core eddies” that are spun off the Loop Current.
Eddy currents are identified by satellite measurements of sea surface level. Warm core eddies cause a very slight increase in the local sea level because of the thermal expansion of water. Cold core eddies are associated with lower sea surface levels.
Current speeds are measured using several techniques:
- Shallow water drifters are tethered just below the water surface to eliminate the effects of wind and waves. They transmit their location (offset) to a satellite, from which surface currents can be calculated.
- Deep ocean drifters sit at the water surface, and are programmed to sink to a certain depth, remain there for a certain time, then refloat to the surface. They transmit their location (offset) to a satellite, from which deepwater currents can be calculated.
- Acoustic Doppler devices, such as the Acoustic Doppler Current Profiler (ADCP), measure currents using the Doppler principle. They are deployed at various locations on the sea floor where current measurements are desired.
- Shore-based current meters use Doppler radar to measure near-shore currents using the same methodology as acoustic Doppler devises, but using radar rather than acoustics.
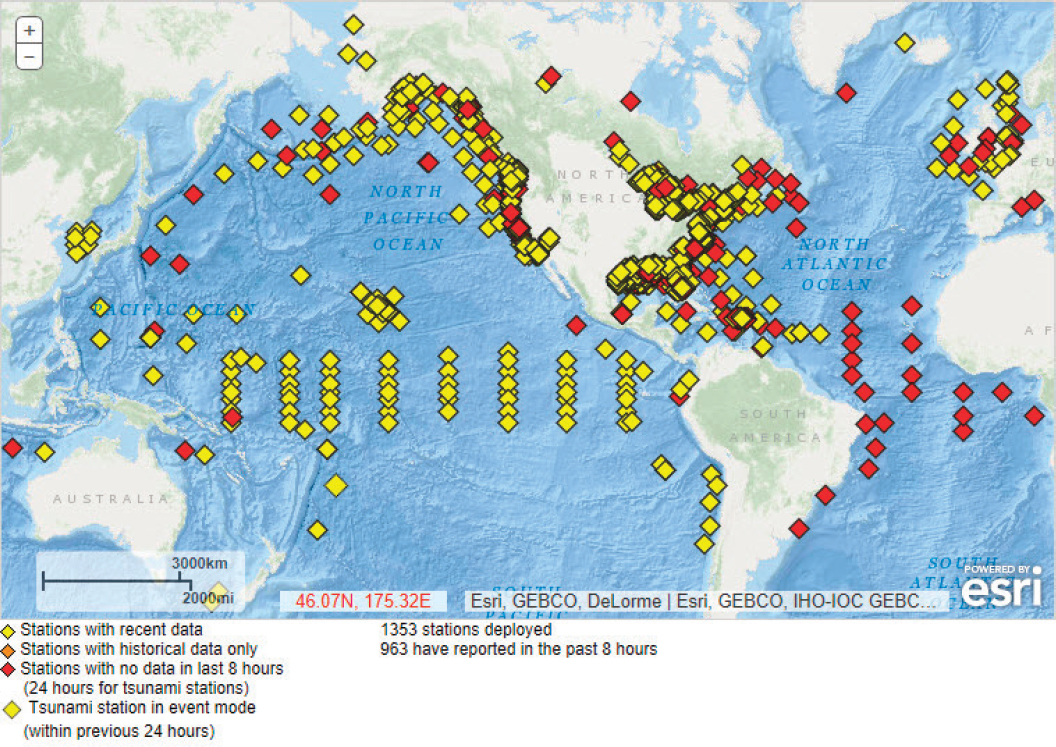
The U.S. National Oceanic and Atmospheric Administration (NOAA) coordinates current measurement efforts in or near the U.S. NOAA owns many of the current speed measurement stations. However other government agencies and universities own some as well. Additionally BSEE requires operators of deepwater Mobile Offshore Drilling Units (MODUs) and floating production facilities to monitor and report surface and deep, down to 3,280 ft. (1,000 m), current profiles.8Figure G.8 shows a map of all the Gulf of Mexico current speed detection stations.
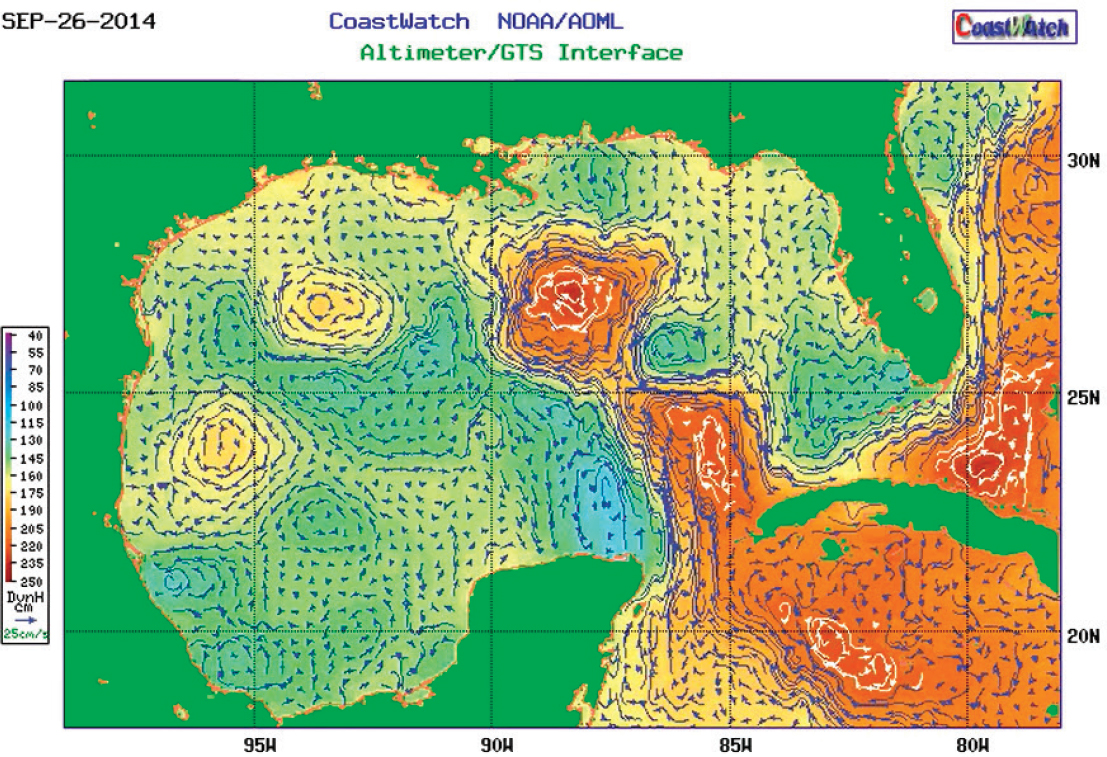
Figure G.9 shows a snapshot of Gulf of Mexico surface currents on September 26, 2014, as the Loop Current is about to spin off a warm core eddy. In this figure, the Loop Current and clockwise-rotating warm core eddy currents are shown in yellow, orange, and red. In contrast, the counter-clockwise-rotating Cold Core Eddies are shown in green and blue.
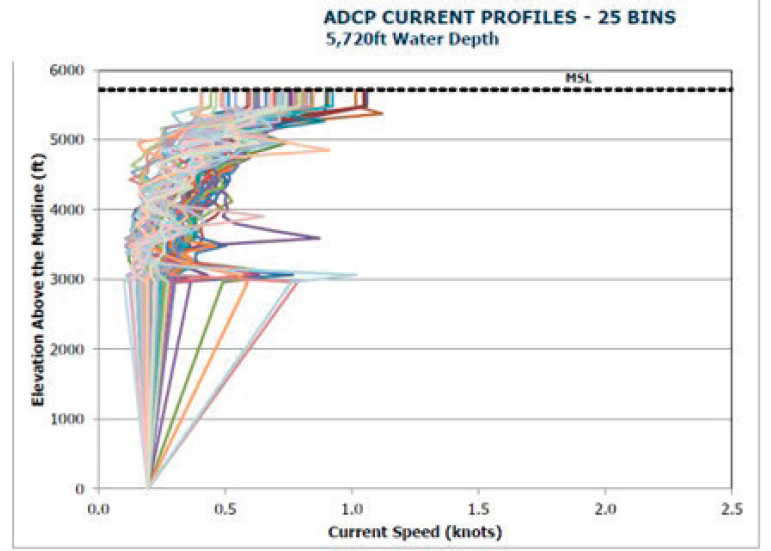
Figure G.10 shows a snapshot of actual ADCP measurements from an actual deepwater drilling operation in the Gulf of Mexico in 5,720 ft. (1,743 m) of water. Current speed generally decreases at depth. However this snapshot shows that current speeds at depth can be as high as those at the surface.
___________________
8 U.S. Department of the Interior, Minerals Management Service, Gulf of Mexico OCS Region, “Notice to Lessees and Operators of Federal Oil and Gas Leases and Pipeline Right-of-Way Holders on the Outer Continental Shelf, Gulf of Mexico OCS Region: Ocean Current Monitoring,” NTL No. 2009-G02, Washington, D.C.