
Part 3: Developing a Harmonized Process for Deriving Nutrient Reference Values
Currently, countries and organizations use varying terminology to express nutrient reference values (NRVs). Four of these NRVs are considered to be the core reference values—the average requirement (AR), the recommended nutrient intake (RNI), the adequate intake (AI), and the upper level of intake (UL):
- AR. The amount of a nutrient estimated to meet the nutrient requirement of 50 percent of the healthy individuals in a population.
- RNI (derived from the AR). The average daily intake for a nutrient that is sufficient to meet the requirements of 97-98 percent of the population.
- AI. The recommended average intake of a nutrient based on observed or experimentally determined estimates for an apparently healthy population. This value is derived when evidence for an AR is insufficient.1
- UL. The highest average daily nutrient intake that is likely to pose no risk of adverse effects to most individuals in a population. It does not include acute or episodic high intakes that might be consumed in a supplement, for example.
Of these four values, RNIs and AIs are considered to be of lesser priority. RNIs are the basis for individual dietary planning and AIs are used because they serve as an indicator of possibly low intakes and are used when it is not possible to derive an AR. ARs and ULs are the priority NRVs because they are critical for evaluating and planning population-level nutrient intakes. Estimates of the prevalence of inadequate intakes in a population subgroup are derived from the AR, using the cut-point method (Carriquiry, 1999), together with nutrient intake data (Barr et al., 2002).
Since the publication of the original NRV organizing framework (King and Garza, 2007), new tools and methods have been developed and incorporated
__________________
1 AIs depend on a greater degree of judgment than is applied in estimating an AR and subsequently an RNI, thus an AI may deviate significantly from, and may be numerically higher than, an RNI. AIs must therefore be used with greater care than RNIs.
into the methodological approaches currently in use (e.g., IOM, 2011). These tools have contributed greater transparency, increased the scientific rigor, and enhanced the accuracy and replicability of the NRVs derived.
Key among these tools is the systematic evidence-based review. A recent example is the application of GRADE (discussed in detail below) to the review process. This serves as an example of how further enhanced transparency and rigor can be included in the process. Importantly, because of the public health implications of nutrient intake recommendations, the framework for deriving NRVs must anticipate the need for decision making about reference values, even when the evidence is limited. Among the tools to facilitate the application of scientific judgment to decision making are methods for identifying and managing uncertainty in the available data (described below).
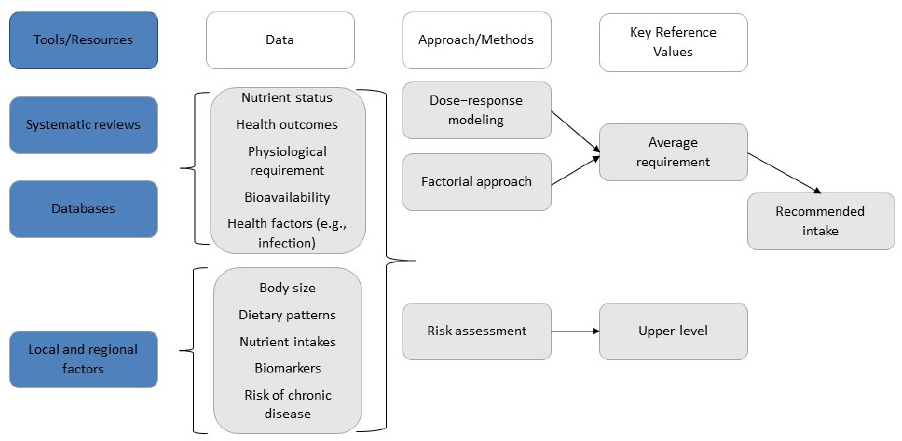
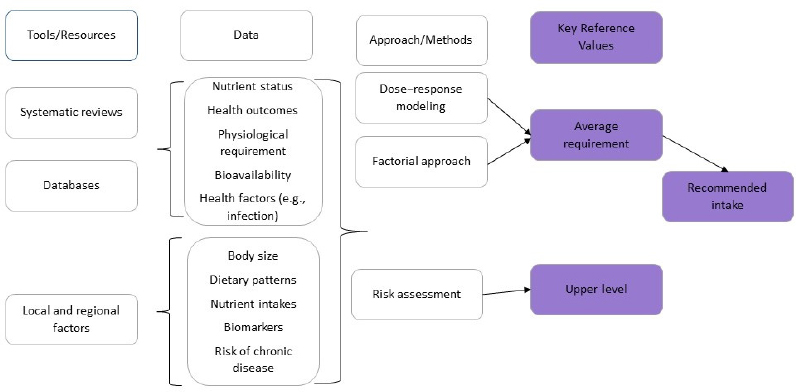
Thus, a new framework for conducting the NRV process (see Figure 2) was developed to incorporate the methodological advances made to the previously proposed framework (King and Garza, 2007). This updated framework, which incorporates the steps described in Part 2 below using color to illustrate the framework components, can be applied to various national and regional contexts, and for different population groups and, thereby, facilitate greater harmonization across countries.
The framework, shown in Figure 2, has four core elements:
- Choose the appropriate tools and data resources.
- Collect data from the tools and resources.
- Identify the best approach for the nutrient under consideration.
- Derive the two key reference values—AR and UL.
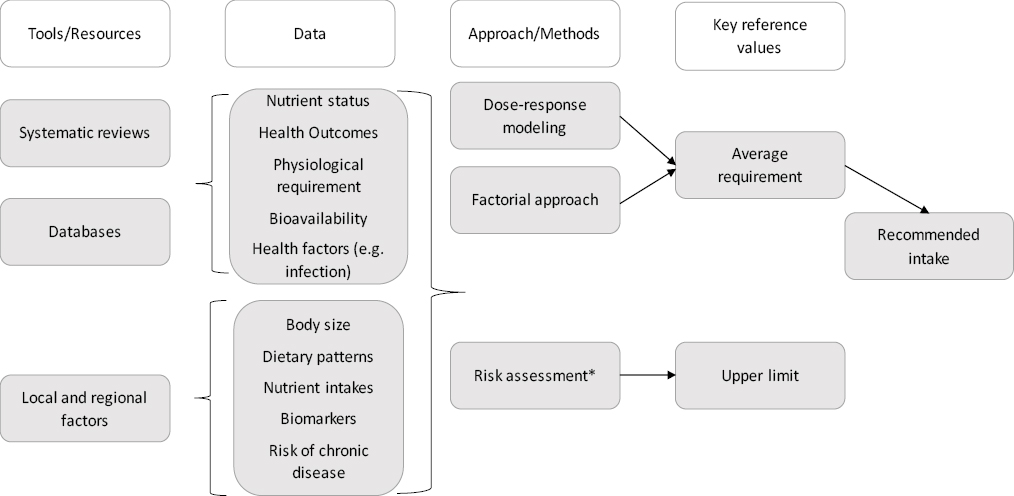
* Risk assessment is a process of (1) identification of risk of toxicity, (2) dose–response assessment, (3) assessment of the prevalence of intakes outside the reference values, and (4) characterization of risks associated with excess intake.
SOURCE: NASEM, 2018b.
Critical Characteristics
In addition, the following characteristics are critical to the NRV review process and help to support harmonization of the approaches to setting NRVs across multiple countries. NRVs must be:
- Regularly updated. Given the rapid pace of the generation of knowledge and data on which NRVs are based, it is important to maintain the currency of information on nutrient outcomes as well as the nutritional profile of populations, particularly as supplement use increases and fortification programs are established.2
- Clear and transparent. Confidence in the systematic reviews that lead to updated or new NRVs is necessary to ensure their use by policy makers as well as researchers. Such credibility requires the establishment of a transparent process that covers how members of the review panels are selected and the training and expertise of each; public availability of all material reviewed by the committee during its deliberations; and written protocols for systematic reviews, quality assessment of each study, assumptions made, and evidence synthesis leading up to setting the NRVs.3
- Rigorous and relevant. Consistent methods need to be established and applied across nutrients, for various values (e.g., AR, RNI, AI, and UL), and for various categories of age, sex, and life stage (e.g., pregnancy). A uniform approach for conducting systematic reviews and establishing values for nutrients in cases where evidence is limited also is needed. Given the changing epidemiologic and nutritional status across populations, values need to be relevant to contexts where chronic disease is rising, in addition to being relevant to the prevention of deficiency.
- Documented. At each stage in the process, all considerations or adjustments that influence the potential NRV must be documented, as must the methodologies used and the assumptions behind them.
- Based on a determination of the strength of the evidence. Limitations in the data and methods must be assessed and documented and uncertainties taken into account.
__________________
2 Supplement use and fortification programs are developed and established in low- and middle-income countries. The potential users of NRVs include international organizations as well as local, regional, and national governments. Because of the many ways NRVs are applied and used, it is important that users understand their derivation and application particularly among low- and middle-income countries.
3 It is also important to acquire, review, and declare conflict of interest statements from potential and candidate panel members.
- Complete and efficient. Given the cost, time, and expertise required to undertake the development or revision of existing reference values, even in high-income countries, low- and middle-income countries could consider using existing NRVs developed by another international partner if they are deemed adequate.
Using the Framework to Derive Nutrient Reference Values
The first major step in the framework is choosing the appropriate tools and resources for reviewing and assessing the evidence. Three main tools and resources are needed: systematic reviews, comprehensive databases, and information about relevant local and regional factors.
Collect Tools and Resources
Systematic Reviews
Systematic reviews are a rigorous and transparent method of collecting and synthesizing relevant published literature. The systematic evidence-based review is an important tool for developing a sound evidence base on which to make science-based decisions.
Systematic reviews address specific questions and provide a comprehensive and objective assessment of available information. They are critical in identifying the state of knowledge about a particular topic as well as the gaps and research needs, and they are used as the basis of deliberations in formulating recommendations and guidelines. In addition, as new data emerge, previous systematic reviews serve as a foundation for updated reviews (Lichtenstein et al., 2008).
Several elements are required to ensure the strength, rigor, and transparency of the systematic review process. These are:
- Identifying relevant PI/ECO elements. The Population, Intervention/Exposure, Comparators, and Outcome (PI/ECO) elements serve as an essential organizing framework for a systematic review, and they are used to build conceptual relationships among the research questions being asked.
- Population(s) of interest – consider demographic factors, including age, sex, ethnicity, and their public health significance
- Intervention/exposure to the nutrient of interest – exclude research when the exposure dose is outside the biologically significant range
- Comparator – for randomized controlled trials (RCTs), compare intervention group to a placebo or non-intervention group, or an existing standard of care; for observational cohort studies, compare between groups, stratified by differences in usual intake
- Outcome of interest – include the listing and ranking of outcomes of interest; prioritizing outcomes may require an iterative review of the population data available for different outcomes; proximal biomarkers may be useful in assessing and prioritizing outcomes; separate RCT from observational or clinical outcomes.
- Assessing uncertainty in the evidence. Evaluating the risk of bias is an essential step in systematic reviews and requires an assessment of the internal and external validity of each study included in the review. Bias occurs when the results of the review are distorted by systematic flaws or limitations in the design or conduct of a study. They can be introduced at various points in a study and are important to identify because they can affect the conclusions and the interpretation of results. A number of tools have been developed in recent years to evaluate different types of risk of bias.
When risk of bias analyses suggests a potentially serious bias, an expert panel may choose to use bias-adjusted meta-analyses to summarize the body of evidence. These analyses allow for adjustments of the estimates of a response (directional bias and quantitative expression of the magnitude of bias). However, they require the use of expert judgment and modeling and rely on sound data. Because the necessary nutrient data may not be available, bias-adjusted meta-analysis may not always be feasible.
- Assessing uncertainty in the review process. A shortcoming common to many systematic reviews is that they pool studies that use different types of evidence, such as various study designs, different populations, or the use of animal and human data. Because this heterogeneity leads to uncertainty, pooling studies should be conducted only when they meet meta-analysis criteria. Evidence mapping—a way to systematically identify, organize, and summarize available studies and identify gaps and research needs—can help to reduce this bias.
Expert panels increasingly are using tools such as the Grading of Recommendations Assessment, Development and Evaluation (GRADE) approach to summarize the uncertainties that occur in pooled studies that include heterogeneous types of data. GRADE is a qualitative approach to evaluate the factors that may affect study quality, such as the consistency of findings across studies and the likelihood of publication bias. GRADE ranks the strength of evidence into four categories: high, moderate, low, and very low. In the GRADE approach, evidence is rated by outcome and study design. Overall, GRADE specifies that the certainty of evidence should be designated as the lowest detected across critical outcomes. Randomized controlled trials generally start with a ‘high’ rating and may be rated down. Observational studies generally are considered “low” certainty of evidence, but may be rated up.
Databases
Food intake and composition data are needed to estimate the appropriate bioavailability factors to apply to local diets. However, once the AR and the UL for nutrients have been determined, having nutrient intake data that is compared to the AR and UL is key to estimating the prevalence of inadequate and excessive intakes, respectively, of specific nutrients among population groups. When an AR cannot be set, population-level intake data may be useful for setting an AI.
In recent years, the development of local, regional, and global databases on food intake and food composition have progressed substantially. Although these databases may not be perfectly matched to local foods, it should be remembered that this information is never perfect due to realities such as the difficulty of collecting food intake data and the effects of many factors on food composition (e.g., variety, seasonal changes in climate, soil conditions, storage, processing, and cooking). Variability in available foods (e.g., chemical form, food matrix composition, or other food components that may enhance or inhibit bioavailability), recipes among households (e.g., methods of preparation, processing, or cooking), and physiologic
characteristics in populations, including age, and other major factors may affect these data. Thus, for most purposes, existing data may be acceptable.
Contextual Factors
- Genetic variability – may have an impact on certain physiological processes that affect nutrient requirements
- Baseline measures of dietary intake, nutrient status, and body composition in population groups
- Infection can affect intake requirements via impaired nutrient metabolism, and through the body’s natural responses to infection.
- Physiologic changes that accompany aging (e.g. muscle strength and bone mass can affect physiological and metabolic responses to nutrient intake)
- Host condition, dietary, and environmental factors can affect nutrient bioavailability, thereby altering physiological and dietary requirements
Food Consumption and Food Composition Databases
Many countries have their own food intake databases, but regional and global databases are also available and may be useful. A list of regional and global databases can be found in Appendix 3: Websites for Tools and Resources.
Food composition databases are used to estimate the dietary content of factors that affect nutrient bioavailabiity (e.g., phytate). They may also be useful for calculating the prevalence of inadequate and excessive intakes. A list of international and U.S. databases can be found in Appendix 3: Websites for Tools and Resources.
Databases of Relevant Recent Extant Systematic Reviews
The cost of doing new systematic reviews can be very high. Existing reviews will usually describe most or all of the relevant information. However, updates may be needed. A list of databases with relevant systematic reviews can be found in Appendix 3: Websites for Tools and Resources.
Key References from Nutrient Expert Groups
A list of these key references can be found in Appendix 3: Websites for Tools and Resources.
Other Tools
A panel convened to decide whether to update or adapt existing NRVs might appraise existing NRVs using an adaptation of the Appraisal of Guidelines for Research and Evaluation II (AGREE II) tool. This tool was designed to manage variability by providing a systematic approach to assessing the quality of clinical practice guidelines; provide the user with
direction on guideline development; and serve as a guide for what specific information should be reported in the user’s guidelines (Brouwers et al., 2010).
There are six domains in the AGREE Instrument Reporting Checklist. Each domain denotes a specific aspect of guideline quality. The six domains of the AGREE II checklist are:
- Scope and Purpose (which includes a description of the intended population)
- Stakeholder Involvement
- Rigor of Development (including whether systematic reviews of evidence were used)
- Clarity of Presentation
- Applicability
- Editorial Independence (including potential influence of the funding body and transparency of competing interests of development group participants)
Using the rater’s assessment, an overall quality score is calculated for each domain and each is independently scored. The domain scores are calculated by summing up all the scores of items in the domain and then scaling the total as a percentage of the maximum possible score for that specific domain.
Gather and Review Data
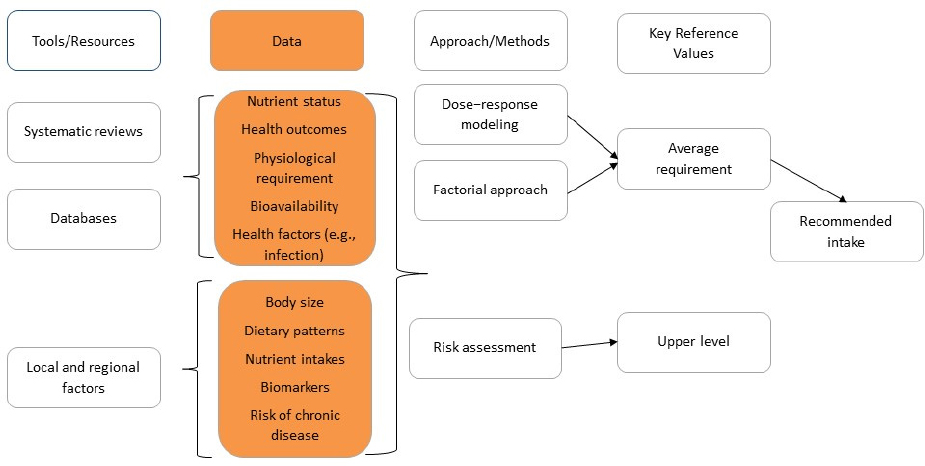
The second major step in setting key NRVs involves collecting the relevant data from the tools and other resources.
Examples of data include:
- Biomarkers of nutrient status. Biomarkers are presently only available to assess various stages of depletion for some nutrients. Biochemical analyses include both static and functional tests. Static tests measure either a nutrient or its metabolite in biological fluids or tissues, including urinary levels. Functional tests may reflect later stages in the development of nutrient deficiencies or shifts in nutritional status associated with reductions in chronic disease. Anthropometric measurements of physical dimensions or body composition, including bone, while not specific, are useful if there are imbalances of protein and energy intakes, but they do not reflect specific nutrient deficiencies. A medical history and physical examination are nonspecific and only develop in the advanced stages of nutritional deficiencies (Combs et al., 2013; Dragsted et al., 2017).
- Bioavailability algorithms. The bioavailability of a nutrient in any food refers to the degree it is absorbed, transported, and used physiologically. Because the dietary factors influencing nutrient absorption or utilization are not well established for many nutrients, algorithms to predict bioavailability are unavailable for most nutrients. The exceptions are iron and zinc. These mathematical models predict bioavailability by determining the amount and form of iron or zinc, the presence of dietary enhancers and inhibitors, and the iron and zinc status of the individual. The accuracy of bioavailability algorithms is limited by the interactions occurring between the enhancing and inhibiting factors in the whole diet. For example, the effect of enhancers (e.g., animal tissue) and inhibitors (e.g., phytate) on zinc and non-heme iron absorption both affect absorption when consumed in the same meal. Bioavailability algorithms need to be revised regularly as quantitative information on the effect of dietary components on nutrient absorption and utilization becomes available. Algorithms for iron and/or zinc have been established by the FAO/WHO (WHO, 1988; Hunt, 1996), Murphy et al. (1992), and the International Zinc Nutrition Consultative Group (IZiNCG) (2004).
- Nutrient bioavailability software. The increased availability of electronic nutrient composition databases provides an opportunity to consider the bioavailability of nutrients when micronutrient intakes are estimated for various population groups. An example is the development of software called the Calculator of Inadequate Micronutrient Intake (CIMI) to assess nutrient intake as well as the bioavailability of iron and zinc (Radix et al., 2014). This program calculates the bioavailability of iron and zinc in the individual diet. The bioavailability factor was determined using several scenarios of the percentage of bioavailability. For example, if more than 5 percent of total energy intake is accounted for protein from fish and meat, the iron bioavailability is 15 percent. The classification of iron and zinc bioavailability is
- Nutrient availability modeling software. Software for converting nutrient intake data to prevalence of inadequate intakes is now available. One example is Intake Monitoring, Assessment and Planning Program (IMAPP) at Iowa State University.
shown in Table 1 below.
TABLE 1 An Example of Classifying Iron and Zinc Bioavailability
| Nutrient | Bioavailability | Classification |
|---|---|---|
| Iron | 15% | >5% of total energy intake as protein from fish and meat. |
| 12% | 3-5% of total energy intake as protein from fish and meat. | |
| 10% | <50% of total energy intake is from rice, other grains, other starchy staples and pulses and nuts and 1-2% is as protein from fish and meat or if >50% of energy intake is from rice, other grains, other starchy staples and pules and nuts and 2-3% of total energy intake is as protein from fish and meat. | |
| 5% | If none of the conditions above are met. | |
| Zinc | Low | >50% of total energy is from rice, other grains, other starchy staples, pulses and nuts and <2% of the energy intake is as protein from fish, eggs, dairy, and meat. |
| High | ≤50% of total energy is from rice, other grains, other starchy staples, and pulses and nuts and >5% of the energy intake is as protein from fish, eggs, dairy, and meat. | |
| Moderate | If none of the described conditions is met. |
* Recommended nutrient intake based on the bioavailability of the diet as recommended by the 2008 FAO/WHO Human Vitamin and Mineral Requirements.
SOURCE: Radix et al., 2014.
- Usual activity levels. Questions regarding the type and level of habitual physical activity or exercise should be included when energy intakes are evaluated. A number of physical activity questionnaires are available (Sylvia et al., 2014).
- The correlation between the available questionnaires and an objective measure of activity or fitness such as accelerometers tends to be low. Also, the questionnaires tend to overestimate physical activity by nearly 85 percent (Lee and Carlisle, 2011).
Identify the Best Approach
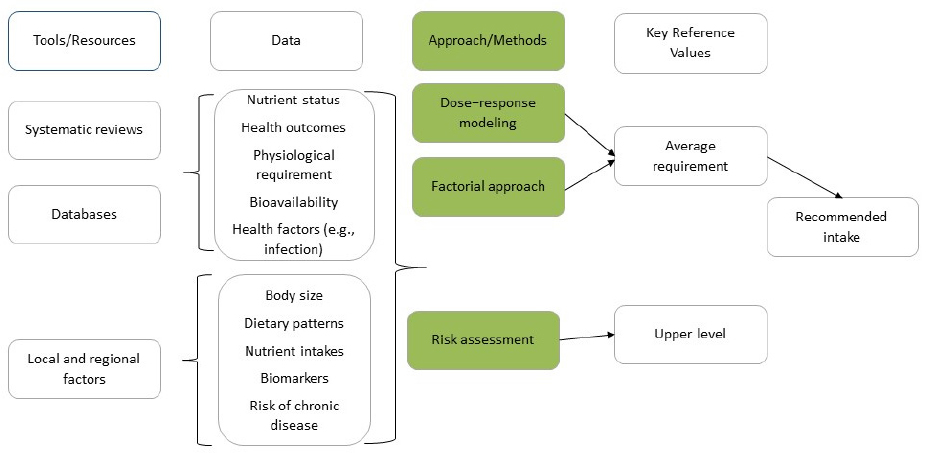
The third major step is identifying the best approach for determining key reference values. Several approaches can be used. Dose–response modeling is often used in cases when a clear relationship exists between the intake of a nutrient and a metabolic or functional outcome. The factorial approach is generally used to set NRVs for minerals because the losses of minerals in the urine, feces, skin, menstrual blood, or semen are in the same organic form as in the diet. This is not true for most of the vitamins because they are metabolized into many end products. Recommended intakes for these nutrients is determined by the amount needed in the diet to maintain a status measure (i.e., serum or red blood cell levels or the level of a critical metabolic product that changes with low intakes and responds to increased intakes of the nutrient).
Examples of approaches for determining key reference values include:
- Currently, the derivation of recommended intakes for iron and zinc are based on the factorial approach. For example, dietary zinc recommendations are based on the amount of absorbed zinc needed to replace endogenous zinc losses including fecal and non-intestinal losses (i.e., urine, integument, menstrual losses in women, and seminal losses in men). This approach is simplified by the fact that the non-intestinal zinc losses are constant over a wide range of zinc intakes (4-25 mg/d) (IOM, 2001). The endogenous fecal zinc losses vary with the amount of zinc absorbed that increases with increased zinc intakes. A number of zinc biomarkers have been measured (i.e., plasma, erythrocyte, urinary, and hair zinc) to determine
-
if they vary directly with zinc intakes. However, most of the endpoints measured remain constant over a range of zinc intakes, and the intestinal zinc losses increase or decrease in order to sustain tissue zinc levels over a wide range of intakes.
- Like zinc, the physiological iron requirements are based on the amount needed to replace total losses from the intestine, urinary tract, skin, and menstrual losses in women or semen in men. Total losses average 0.014 mg/kg body weight in men and non-menstruating women; they increase to 0.025 mg/kg body weight in menstruating women (IOM, 2001). Major determinants of dietary iron requirements are the proportion of iron from heme in the diet and the sources of non-heme iron. Typically, 15-35 percent of the heme iron is absorbed while non-heme iron absorption can range from 2 to 20 percent, depending on the type of grain or legume and the amount of phytate in the diet that limits iron absorption. As is true for zinc, there are a number of problems in establishing recommended iron intakes using the dose–response method. For example, the bioavailability of dietary iron has a poor correlation with iron status. Sensitive, specific biomarkers of iron status are limited and many are affected by other factors (i.e., infection or inflammation) (see the section “Contextual Factors” above).
Folate dietary requirements are determined primarily by the bioavailability of folate in foods along with certain genetic factors. Folate is present in foods in the form of a polyglutamate derivative that must be hydrolyzed by intestinal enzymes to monoglutamate prior to absorption. The bioavailability of folate from food is about 50 percent whereas that from supplements or fortified cereals is at least 80 percent. Thus, the amount of dietary folate is calculated as μg food folate + 1.7 × μg folic acid. This calculation is expressed as dietary folate equivalents (DFEs). Although the amount of dietary folate can be determined, the adequacy of folate intakes must be linked to biomarkers of folate status because it is metabolized to so many different end products. Several different status measures have been used to estimate dietary folate requirements. They include serum and plasma or erythrocyte concentrations. Erythrocyte levels are considered to be more reliable as they are not affected by short-term folate intakes as is serum or plasma folate. Plasma homocysteine concentrations also reflect low intakes or the response of deficient individuals to folic acid or folate interventions. However, homocysteine concentrations also change with vitamin B12, riboflavin, and B6 status.
Derive Key Reference Values
The final step in the process is to derive the two key NRVs—AR and UL. As discussed below, the AR is the core values from which the RNI value is derived.
The first step in deriving NRVs is to define the AR. Nutrient requirements, defined as the lowest continuing intake level of a nutrient that maintains a defined level of nutrition for a given criterion of nutritional adequacy in an individual, form the basis for the AR (IOM, 2000; Yates, 1998). They are thought to have a normal symmetrical distribution (see Figure 3). Thus, the median of the requirement distribution represents the AR, that is, the amount of a nutrient estimated to meet the nutrient requirement of 50 percent of the healthy individuals in a life-stage and sex group for that population. Iron requirements are an exception to this general model as iron needs are positively skewed for some age/sex groups (Yaktine et al., 2020).
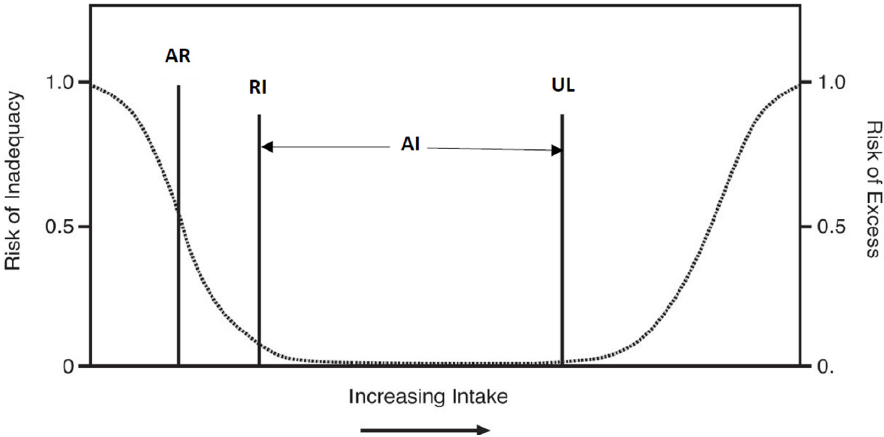
SOURCE: NASEM, 2018b.
AR=average requirement
RI=recommended nutrient intake
AI=adequate intake
UL=tolerable upper intake level
If data for a specific group are limited or missing, they may be extrapolated from another life-stage group. For example, when data on physiologic requirements in the elderly are limited, they may be extrapolated from measurements made in younger adults.
Expert groups from various countries often use different criteria for defining the requirement for a specific nutrient as well as different terminology (see Appendix 2: Glossary). For example, the AR may be based on a nutrient amount that induces marginally low or deficient levels of a nutrient followed by a correction of the deficit with measured amounts (i.e., depletion/repletion studies), the amount required to replace body losses after accounting for usual levels of absorption (i.e., the factorial approach), or the amount needed to maintain a given circulating concentration, degree of enzyme saturation, tissue saturation, or molecular function, or an amount associated with optimal physiological function (i.e., dose–response modeling). If data are not available for one of these three approaches, an AI may be estimated from the observed intake of healthy individuals.
Once the criteria for defining the AR is selected, an RNI is often set at two standard deviations above the AR. Thus, this higher level should be sufficient to meet the daily nutrient requirements for almost all (about 97.5 percent) of the healthy individuals in a particular life-stage and gender group in the population specified. If the standard deviation is unknown, a coefficient of variation (CV) of the AR may be used. An assumed CV of 10 percent or 15 percent of the AR is often used, and the RNI is set at the AR plus an amount equaling two times the CV.
Population ARs frequently differ among various countries depending on the criterion that was used to estimate the AR. For example, ARs will differ if different physiological determinants were used, the data were limited, the bioavailability or absorption factors differed, or the life-stage groupings varied. To illustrate, dietary phytate is a major determinant of zinc absorption. A population’s physiologic requirement for zinc would therefore be calculated from the phytate:zinc molar ratio. Iron bioavailability, and thus absorption, is determined by its form. Heme iron from animal sources has a higher bioavailability than non-heme iron from vegetable and grain sources. Both dietary phytate and non-heme iron are more prevalent in the food supplies among low- and middle-income countries, thus contributing to a higher prevalence of deficiency and increased physiologic requirement in those populations. Additionally, iron stores, a biomarker of iron status, can be modified by chronic disease, infection, or other nutrient deficiencies, further contributing to increased physiologic requirements for this nutrient (NASEM, 2018b).
The UL is the highest average daily nutrient intake level likely to pose no risk of adverse health effects for nearly all people in a particular group. The need to set a UL grew out
of two major trends: increased fortification of foods with nutrients and the more prevalent use of dietary supplements in larger doses. A challenge in setting a UL is the paucity of data indicating adverse health effects from chronic intakes or high intake levels of nutrients with potential toxicity. Thus, experimental animal and observational data are useful for setting this standard. Another challenge is the use of competing risk-benefit analyses for chronic disease outcomes as opposed to toxicity-related outcomes. The level of risk from chronic disease differs among possible adverse health outcomes, thus introducing another level of uncertainty that must be considered in the derivation of a UL.
FRAMEWORK SUMMARY
Developing the key nutrient reference values (i.e., the AR and the UL) involves four major steps: (1) Choose tools and resources, (2) Collect the needed data, (3) Identify the best approach, and (4) Derive the key values. The process for deriving harmonized standards is based on six core principles:
- The NRVs are regularly updated.
- The process is clear and transparent.
- The methods are rigorous and relevant.
- Factors influencing the NRV are documented.
- The strength of the evidence is determined.
- The review is complete and efficient.
To date, several groups have incorporated some or all of these principles when setting their NRVs. They include the U.S./Canadian Dietary Reference Intakes, developed jointly by the United States and Canada, the WHO/FAO, the European Food Safety Authority (EFSA), Australia and New Zealand (Aus/NZ), the Nutrition Societies of Germany, Austria, and Switzerland (D-A-CH), and the Nordic Nutrition Recommendations (NNRs). The National Academies publication Harmonization of Approaches to Nutrient Reference Values provides case studies depicting how to use this paradigm for establishing ARs and ULs for zinc, iron, and folate (NASEM, 2018b). The case studies demonstrate how to use the proposed framework as an approach for harmonizing the methods for deriving NRVs on a global scale. Proposed Harmonized Nutrient Reference Values for Populations have been published; ideally these would continue to be revised and be supported by an authoritative international body for global application (Allen et al., 2020).


