
6
Evaluation of the Demonstration Data on Small Areas and Populations
LOCAL AND REGIONAL
Planning committee member Jan Vink (Cornell University) moderated “Use Cases Part IV,” which included local and regional data use cases. Jill Kaneff (Northern Virginia Regional Commission) was ill and unable to present in person or virtually, so her colleague Brian Engelmann (demographer for Prince William County, Virginia) presented Kaneff’s slides, which were available to the planning committee prior to the workshop. As a result, Engelmann’s statements appear in this proceedings, although the slides are Kaneff’s. Sarah Garcia (Wilder Research/Minnesota Compass) gave an overview of how her organization serves constituents and discussed her concerns about the differentially privatized data. Mary Craigle (Montana Department of Commerce) served as the discussant; she also provided during this session a summary of key statutes in Montana that require decennial data, which is grouped with relevant information in Chapter 10.
Engelmann explained that census data are critical for assessing distribution and concentration of racial and ethnic groups across jurisdictions and in small areas. Governments use race and ethnicity data at the micro level to determine areas of inequity. Affordable and fair housing is one of many areas of service in which policies and programs are continually being developed and reevaluated.
An example was offered to compare the Demographic and Housing Characteristics (DHC) File with the 2010 Summary File 1 (SF1) data by examining the percentage of homeowners who are Hispanic in a specific census tract in northern Virginia (see Table 6-1). Before the data
TABLE 6-1 Comparisons for Tract 511390135
| DHC Demo | Original Census | Delta | |
|---|---|---|---|
| Total occupied HU | 1,003 | 1,002 | 1 |
| Owner-occupied HU | 867 | 875 | –8 |
| Renter-occupied HU | 136 | 127 | 9 |
| Hispanic-occupied HU total | 53 | 37 | 16 |
| Hispanic owner-occupied HU | 22 | 28 | –6 |
| Hispanic renter-occupied HU | 31 | 9 | 22 |
| Hispanic-occupied total share of total occupied HU | 5.3% | 3.7% | 1.6% |
| Hispanic-owner-occupied share of total owner-occupied HU | 2.5% | 3.2% | –0.7% |
| Hispanic-owner-occupied share of total Hispanic-occupied HU | 41.5% | 75.7% | –34.2% |
NOTE: HU = housing unit.
SOURCE: Jill Kaneff workshop presentation, June 22, 2022.
were disaggregated, there were no substantial differences noted, but when delving deeper into housing units occupied specifically by Hispanic homeowners, problematic differences emerged.
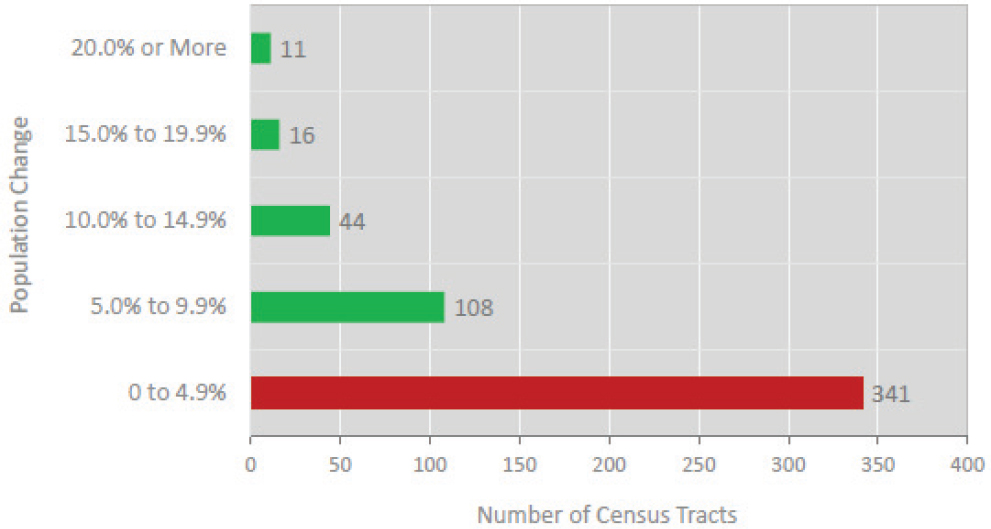
Engelmann noted the takeaway that when one moves from total households as a part of the denominator to households of a racial/ethnic group as the denominator, there is significantly more variation, to the point that the data become unreliable and unstable. When looking at Hispanic homeowners as a percentage of Hispanic-occupied households in Figure 6-1, most of the tracts fall into the 0–4.9 percent range. This indicates that the tract-level share (percentages) of margins of error are problematic and unusable when the hierarchical subtotal is used rather than the top-level total.
Engelmann explained that governments use decennial data at the micro level beyond critical issues such as equity and disadvantage, and accurate decennial numbers for small geographies, such as census tracts, are critical for long-term planning and proper use of taxpayer dollars. Data at small geographies are also used for population and household estimates and forecasting, including facility planning (e.g., fire stations, schools, parks, other local facilities) and transportation planning (e.g., travel demand, traffic volume vs. road capacity, transportation actions needed to meet future clean air targets, transportation improvements).
An example of non-census geographies that Prince William County and others in the region use for travel-demand modeling and local-services
SOURCE: Jill Kaneff workshop presentation, June 22, 2022.
planning are traffic analysis zones (TAZs). Previously, analysis by the Northern Virginia Regional Commission (NVRC) for Prince William County’s TAZs used 2010 Census block data as an input for base numbers for intercensal estimates and forecasts. However, the mapping and planning divisions now use census tract data intentionally for the 2020 base because NVRC’s differential privacy analysis showed larger variability in data sets below the tract level. The Northern Virginia region has 1,416 TAZs, and jurisdictions such as Prince William County have even smaller TAZs nested within the regional TAZs. Engelmann noted the minimum population threshold of 450 is recommended by the Census Bureau’s Disclosure Avoidance Handbook.1 Out of the 1,416 regional TAZs, more than a third have an estimated population of less than 450, which will make the 2020 base data unreliable for 503 of the regional TAZs. These differences in population counts caused by inaccurate census data can be a deciding factor for whether a new facility will be built, such as a school or fire station.
Closing comments focused on household size and the person-household joins for the DHC files. Average household sizes for tracts and smaller will not match between these 2020 Census products according to the Census Bureau. From the redistricting file (not the 2022 release), average household size was biased to lower household sizes, therefore, Kaneff’s analysis
___________________
1https://www2.census.gov/library/publications/decennial/2020/2020-census-disclosure-avoidance-handbook.pdf
TABLE 6-2 2010 Comparisons for Corvallis, Oregon
| City (total) | SF1 | DAS 2020 | DAS 2022 |
|---|---|---|---|
| Population | 54,462 | 54,318 | 54,455 |
| Households | 49,563 | 49,444 | 49,604 |
| Group quarters | 4,899 | 4,874 | 4,851 |
| UGB (margins) | |||
| Population | 3,012 | 3,188 | 3,015 |
| Households | 2,975 | 3,170 | 2,983 |
| Group quarters | 37 | 18 | 32 |
NOTE: DAS = disclosure avoidance system; SF1 = Summary File 1; UGB = urban growth boundary.
SOURCE: Adapted from Ethan Sharygin workshop presentation, June 21, 2022.
argues, the bias in the household size should be fixed when constructing the Detailed DHC (DDHC).
Urban Growth and School Planning
Ethan Sharygin2 (Portland State University) discussed comparisons for urban growth boundaries in “Use Cases Part I,” moderated by planning committee member Marta Tienda (Princeton University). He identified blocks inside the city boundary for Corvallis, Oregon, and then blocks in the margins that were outside city limits but within the city’s urban growth boundary. Comparisons for SF1 and demonstration data released in May 2020 and March 2022 are displayed in Table 6-2. Sharygin stated that, while there were problems with the 2020 demonstration data, the March 2022 demonstration data had improved so they were now usable when aggregated to a city of this size (50,000).
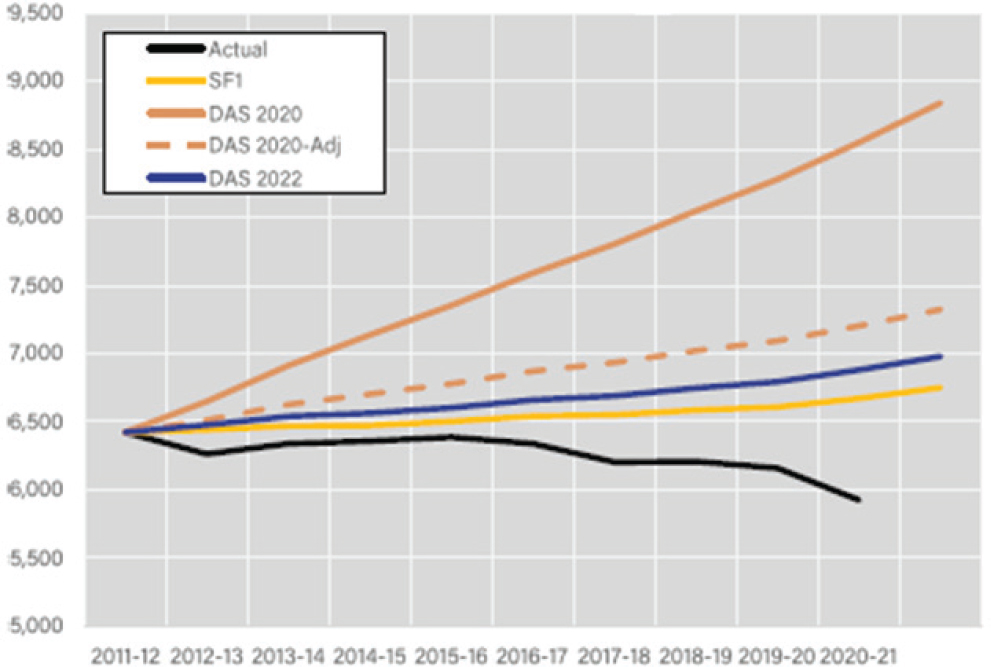
In a separate use case, Sharygin focused on school enrollment forecasts, explaining that the Population Research Center, where he works, completes the enrollment forecasting for a number of districts in Oregon as required by statute (ORS 195.11). The basic forecasts use 109 data points, including age and sex, as well as housing stock, tenure, and occupancy rates. All of the tables it uses have been added back, except Table H11, which is planned for release in the DDHC at the block group level and is not usable for its purposes. Based on analysis displayed in Figure 6-2, he concluded that school enrollment forecasts were less accurate in the 2020 demonstration file compared with baseline, although they improved in the 2022 demonstration file.
___________________
2 Sharygin’s coauthors are Sigurd Dyting and Abraham Flaxman.
NOTE: DAS = disclosure avoidance system; SF1 = Summary File 1.
SOURCE: Ethan Sharygin workshop presentation, June 21, 2022.
Therefore, Sharygin stated, the errors in accuracy in the 2022 release were much more acceptable and could be used without adjustment.
Data Use Needs by Local Nonprofits
Sarah Garcia (Minnesota Compass) introduced her organization, explaining that Minnesota Compass is part of Wilder Research, a nonprofit organization that provides a wide range of human and social services in Minnesota. As an applied-research organization, Minnesota Compass conducts research for its communities, including needs assessments and program evaluations. Garcia expressed that the DHC files are an essential component in serving its neighborhoods by providing details used to shape its programs and match resources with unmet needs.
In the process of curating data about the demographics of the people who live in Minnesota, the Census Bureau is its main source of data, although augmented with many other sources. The data are then used for custom queries based on a user-specified boundary to look at data in different ways. Minnesota Compass can parse the data all the way down to the city or even
neighborhood level to examine quality-of-life indicators. Garcia noted that many of the data come from the American Community Survey (ACS), but that small levels of geography or sparsely populated regions have data that become unreliable or have margins of error too large for drawing meaningful conclusions, which is when it relies on the decennial census data. Consequently, she stated, the proposed changes to the DHC data may affect the conclusions that its communities can draw from the data.
Minnesota Compass also offers a build-your-own profile tool, which provides data by specific locations that the user creates by pulling data from cities, school districts, counties, zip codes, and census tracts. Garcia described this tool as “choose your own adventure” because it can drill down to small areas at least one mile in diameter. Although the values for 2010 were not assessed using the demonstration data with differential privacy applied, Garcia displayed a scenario in which a specific area would have about 15 percent of children under the age of nine years who might be in daycare. She explained that this area is racially and ethnically diverse, with a sizable proportion of the population speaking a language other than English at home or that is foreign born.
Garcia stated that Minnesota Compass’s main concern is that communities and policy makers make decisions based on data that provide a valid picture of the sociodemographic and economic characteristics of their communities. It is of vital importance that the Census Bureau is transparent in how the differential privacy algorithm was developed. Researchers such as her require clear instructions so that they can draw accurate conclusions about the ways in which the true data may differ from the revised data because how the DP algorithm was developed has major implications for communities and policy makers in Minnesota.
RURAL
Planning committee member Marta Tienda moderated a session featuring rural use cases and commended the presenters for preparing these use cases under very difficult and incredible timelines. She reiterated the invitation, repeated by Jason Devine, from Director Robert Santos to provide in-depth use cases.
Julia Cho (U.S. Department of Agriculture [USDA]) noted that she worked previously for the Census Bureau and discussed the need for census data for program implementation, statutory requirements, and performance and impact evaluation; she also discussed why the USDA needs rural-specific data. USDA Rural Development serves more than 40 programs3 that cover rural housing, utilities, and business offices.
___________________
For rural development program implementation, USDA uses census data to look at specific eligibility; allocate funding; monitor civil rights compliance; and calculate state nonmetro median household income, which is defined as the “median household income of the State’s nonmetropolitan counties and portions of metropolitan counties outside of cities, towns or places of 50,000 or more population.”4 USDA collaborates with the Census Bureau to develop this custom measure of state nonmetro median household income.
USDA also uses census data for equity outreach programs. The most important factor in determining eligibility is the population size of Census Designated Places (i.e., cities, towns, counties, subdivisions, census tracts, and zip code areas). Another way in which USDA uses socioeconomic data from the Census Bureau is to fulfill statutory requirements to conduct outreach and investment in underserved, poverty-stricken communities in rural areas. Decennial data are used for population, age, and race and ethnicity:
- P12;
- DHC P12A–P12AH; and
- DP1 and DP3.
Cho displayed maps to demonstrate how these data are used for USDA’s Strategic Investment Mapping Tool.
Cho discussed the Biden-Harris priority to advance racial equity and support for underserved communities. Rural areas are one of the groups specified in the January 20, 2021, Executive Order 13985 on Advancing Racial Equity and Support for Underserved Communities Through the Federal Government. Cho stated that the Census Bureau provides the most reliable, and perhaps only, publicly available data for rural and small areas. For more successful and targeted implementation of policy initiatives, USDA requires more granularity from the census data. Currently, it can obtain data at state and regional levels, but it also needs rural data.
Tom Mueller (University of Oklahoma) discussed the discrepancies between the SF1 and DHC demonstration file across the rural–urban continuum. He offered an overview of rural America, describing it as experiencing a long pattern of population aging, chronic out-migration, and economic difficulties characterized by poverty and poor health outcomes. He stated that, while these trends are known, documenting them is complicated by data suppression, such that many data sets are simply unusable.
He offered the example that data from the ACS have “massive” margins of error, so many researchers will not use them because they are not
___________________
4https://www.federalregister.gov/documents/2004/11/15/04-25245/definition-clarification-of-state-nonmetropolitan-median-household-income-snmhi
trusted to be accurate. Other data sets are similarly unsuitable for rural analysis, such as the Behavioral Risk Factor Surveillance System, Survey of Income and Program Participation, and Panel Survey of Income Dynamics. Mueller stated that, because of these impediments, the decennial Census is regarded as the gold standard for rural demography. The Office of Management and Budget uses the classification of a metropolitan county as one with a core urban population greater than 50,000 people, so counties are therefore a valuable use case for analyzing rural areas that are not only about people but also with the inability to access “metropolitan amenities.”
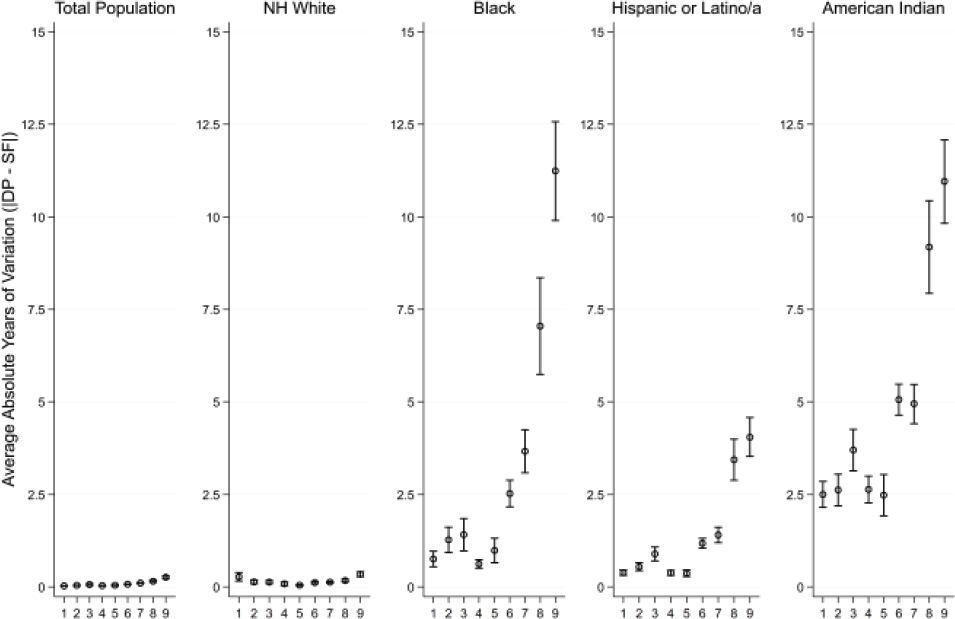
Using the person files, Mueller compared discrepancies between traditional methods of disclosure avoidance with swapping and suppression, top and bottom coding, and the new differential privacy approach using the TopDown Algorithm (TDA) for the DHC File. Mueller explained that, although many people consider “rural” and “urban” to be dichotomous, they actually exist on a continuum and are measured as such with nine different levels on the Rural-Urban Continuum Codes (RUCCs), with one being the most urban and nine being the most rural (he noted that four is where rural counties start to be detected). Mueller stated the discrepancies he would discuss impact real people because there are counties in these areas (RUCC = 9) composed of 72 percent Black, 92 percent Hispanic, or 94 percent American Indian. Craigle asked Mueller to clarify whether he was using single race alone or in combination, and Mueller specified that it was in combination.
Mueller explained that his analysis replicates his published work examining the redistricting file (Mueller and Santos-Lozada, 2022), but uses the most recent demonstration data. Mueller stated that the results for total population and non-Hispanic White are relatively acceptable, although a little worse than in the redistricting file. However, there are a lot of outliers with non-Hispanic Black, Hispanic, and American Indian populations at the county level, which worsen when moving from urban to rural. For 70 percent of the most rural counties, the counts for Black residents are off by 10 percent between the SF1 and the differentially privatized file. In addition, the errors worsen for all three non-White groups along the spectrum from urban to rural (see Figure 6-3).
Mueller observed that, in his community of rural demographers, it has not been adequately communicated how differential privacy makes sense when accuracy for small groups is important. He argued that the prior methods did a better job of preserving head counts, but it is difficult to make that assessment without having the raw data to do a full postmortem. Consequently, there is a lot of confusion and a need for better communication and outreach to some of these groups. Although the Federal Register notice comment period exists, Mueller expressed his thought that a lot of the rural demographers are not going to offer any more comments because
NOTE: DHC = Demographic and Housing Characteristics File; DP = differential privacy; NH = Non Hispanic; RUCC = Rural-Urban Continuum Code; SF1 = Summary File 1.
SOURCE: Tom Mueller workshop presentation, June 22, 2022.
they are frustrated. Outreach could be helpful to these data users, though at this point he does not think the data are fit for his research or that he can recommend that others use them for rural demography if they are released with these discrepancies.
Mueller asserted that small groups and places have an equal right to accuracy and representation as large groups and places, although he acknowledged that there are very real concerns about re-identification. He observed that the picture is even worse for intersectional groups, and concluded by expressing concerns about the ability of academic and practitioner communities to do their jobs going forward.
ASIAN AMERICANS
Howard Shih (AAPI Data) and Linying He (Asian American Federation) made their presentation in a session moderated by planning committee member Randall Akee (University of California, Los Angeles). Their analysis focused on the impact of differential privacy on neighborhood-level
analysis for Asian American communities in Manhattan Chinatown and in Buffalo, New York.
Linying He explained that Manhattan Chinatown has a large Asian American population, and past analysis of the 2000–2010 decennial data has shown losses in total population. The decreases in Asian population outpaced the decrease in total population, which can be attributed to the loss in the population of children, while the senior population remained relatively stable. The analysis with the DHC File replicates this analysis to examine the potential impact on a large minority population.
This analysis included 15 census tracts with a population greater than 500 Asian alone or in combination with another race or whether the Asian population exceeded 25 percent of the total population of the tract. Comparisons are displayed in Table 6-3 from 2000 to 2010 for changes in published data, and then comparing the 2000–2010 change from 2000 to 2010 using the DHC data with differential privacy. He concluded that in areas for large minority populations, differential privacy had limited impact.
Shih explained that data for Buffalo were analyzed because, while that city’s Asian population is small, it is growing rapidly; this analysis provided an opportunity to examine the impact of differential privacy on similar Asian populations. For example, very few Asian individuals lived in Buffalo in 2000. However, the population had shifted by 2010, consisting mainly of refugees who moved primarily to three census tracts: 61 and 69 on the western side of Buffalo and 27.02 in eastern or central Buffalo.
There was more variability when looking age segmentation. Shih stated the child population growth rates are fairly similar across all tracts. He referenced other presenters in the workshop who commented on small numbers, where differential privacy can have a big impact on the overall percentage change. As shown in Table 6-4, the impact of differential privacy was evident in the instability for percentage change for the senior population—especially in Census Tract 27.02, where the percentage change using published data was 122 percent versus 37 percent using the DHC demonstration data with differential privacy.
Shih concluded with suggestions for the Census Bureau. He stated that it had been echoed over the course of two days that the Census Bureau should have a more transparent process. Shih noted the importance of education about how to use the data and what the impacts of differential privacy are on the community data. He noted further that the technical expertise for these presenters’ nonprofit organizations is atypical for community-based organizations. Therefore, the data should be more accessible and more user friendly to help organizations leverage the data more effectively. The last conclusion was that guidance is needed about how to interpret the data, such as providing levels of uncertainty.
TABLE 6-3 Population Change in Manhattan Chinatown
| Area of Population Change | 2000 decennial census | 2010 decennial census | 2010 DHC demonstration data | Percentage change between 2000 and 2010 based on decennial census | Percentage change between 2000 and 2010 based on DHC demonstration data |
|---|---|---|---|---|---|
| Manhattan Chinatown | |||||
| Total population | 87,575 | 83,105 | 80,827 | –5% | –8% |
| Asian population | 56,531 | 48,009 | 48,070 | –15% | –15% |
| Asian share | 65% | 58% | 59% | ||
| Asian population | |||||
| Asian child population | 9,906 | 7,071 | 7,084 | –29% | –28% |
| Child share of Asian population | 18% | 15% | 15% | ||
| Asian senior population | 8,929 | 9,066 | 9,104 | 2% | 2% |
| Senior share of Asian population | 16% | 19% | 20% | ||
NOTE: DHC = Demographic and Housing Characteristics File.
SOURCE: Adapted from Howard Shih and Linying He workshop presentation, June 22, 2022.
TABLE 6-4 Population Change in Buffalo, New York
| Area of Population Change | 2000 decennial census | 2010 decennial census | 2010 DHC demonstration data | Percentage change between 2000 and 2010 based on decennial census | Percentage change between 2000 and 2010 based on DHC demonstration data |
|---|---|---|---|---|---|
| Census tracts 61 and 69 | |||||
| Asian child population | 150 | 646 | 636 | 331% | 324% |
| Child share of Asian population | 53% | 15% | 15% | ||
| Asian senior population | 25 | 55 | 52 | 120% | 108% |
| Senior share of Asian population | 9% | 19% | 20% | ||
| Census tract 27.02 | |||||
| Asian child population | 44 | 299 | 299 | 580% | 580% |
| Child share of Asian population | 38% | 15% | |||
| Asian senior population | 9 | 20 | 15 | 122% | 67% |
| Senior share of Asian population | 8% | 19% | 20% | ||
NOTE: DHC = Demographic and Housing Characteristics File.
SOURCE: Adapted from Howard Shih and Linying He workshop presentation, June 22, 2022.
AMERICAN INDIANS AND ALASKA NATIVES
Carolyn Liebler (University of Minnesota) was the final speaker in “Use Cases I.” In her opening remarks, Liebler acknowledged the assistance of Randall Akee and Yvette Roubideaux (National Congress of American Indians), stating it was helpful to follow Tom Mueller, who made many of the same points she wanted to make in her presentation. She noted that her presentation was about the impacts of differential privacy on American Indian and Alaska Native (AIAN) people and about the impact of differential privacy on tribal land data. Similar to rural areas, data on tribal lands and AIAN people are difficult to obtain, and there is often no source other than decennial data. Core users include tribal leaders using it for tribal governance, as well as other governments, policy makers, advocacy groups, and judges and lawmakers. Issues impacted include water rights and other types of litigation that make an important difference in people’s lives.
Liebler used the category “single race” for AIAN data. She explained that the “two or more race” category puts about half of the AIAN population into categories that researchers cannot analyze. She also explained that these are self-described races and that tribal membership is not required to report yourself as American Indian on the census. Liebler commented that she wanted to take this opportunity to implore the Census Bureau to provide single-race AIAN, as well as AIAN single race alone or in combination.
For her analysis, she used percent differences (positive differences indicate that differential privacy is larger than the original number) and displayed her data using 52 bars to represent each state plus Puerto Rico and the District of Columbia. Displaying the bars in the order of the size of the American Indian population, she showed the calculated percent difference in every county and then the lowest and highest within each state. She explained that in one county in a state with more than 100,000 American Indian people, the differentially privatized data showed the American Indian population as 47 percent lower than in the SF1 file.
Given the problem with not being able to parse how many in the “two or more races” category are AIAN people, Liebler focused her analysis on single-race AIAN people in counties with at least 2,000 single-race American Indians in states with at least 100,000 American Indian people. Liebler discussed an age pyramid for one county to display the difference between the differentially privatized and SF1 data for 220 counties that did not show much variation. She stated that, while the difference of about five percent for age between the differentially privatized and SF1 data is not large, it becomes a problem when it is used as a denominator—when calculating vital rates, for example.
Liebler then shifted to analyses of fertility data; because her emphasis was examining the impact of AIAN as the denominator, it is discussed in this
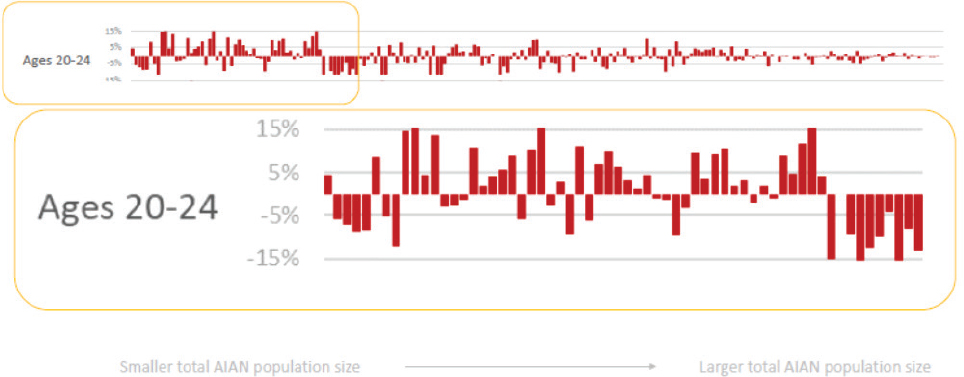
section rather in the later section on fertility as it pertains to public health. Table 6-5 shows that using differentially privatized data as the denominator does not substantially impact the birth rate for women ages 20–29; however, Liebler characterized the 10 percent difference between the differentially privatized and SF1 population denominators for the birth rates for 18- to 19-year-olds as causing “alarm.” When these counties are lined up, many differences in detailed population sizes by age, sex, and race exceed a 15 percent difference (see Figure 6-4) and range from negative 65 percent to positive 52 percent. Liebler stated that, in her opinion, the difference would need to be less than five percent for the data to be useful without having to “throw it out.” As the population gets larger, the results improve.
TABLE 6-5 Birth Rates to Single-Race AIAN Women in a County in 2010, with Non-DP and DP
| Births to AIAN mothers | Pop. of AIAN women | Birth rate per 1,000 AIAN | |||
|---|---|---|---|---|---|
| SF | DP | SF | DP | ||
| Ages 10–17 | 3 | ||||
| Ages 18–19 | 14 | 155 | 139 | 90.3 | 100.7 |
| Ages 20–29 | 39 | 735 | 727 | 53.1 | 53.6 |
| Ages 30+ | 31 | ||||
NOTE: AIAN = American Indian and Alaska Native; DP = differential privacy; SF = Summary File.
SOURCE: Carolyn Liebler workshop presentation, June 21, 2022.
NOTE: AIAN = American Indian and Alaska Native.
SOURCE: Carolyn Liebler workshop presentation, June 22, 2022.
Liebler then turned briefly to housing characteristics on tribal lands. She noted that the National Congress of American Indians highlights that tribal census tracts are very important tribal geography; their optimal population is 4,000, although many tribal lands do not have nearly 4,000 people, a point echoed by panelist Kirk Greenway on day two.
DISCUSSION
Weiwei Zhang (South Dakota State University) is also the state demographer for South Dakota and served as the discussant for the session “Use Cases Part I,” moderated by Marta Tienda. Zhang stated that Cho’s comments helped explain why it is important to gather demographic data at the rural level, while Mueller and Liebler’s presentations demonstrated the distribution of errors that co-chair Garner requested in her discussant remarks for Devine’s presentation.
Zhang expressed her concern that the mean absolute errors cancel out at the national level when users need data on individual communities. Additional overall concerns with the differential privacy–based methods were raised, including that applied demographers, who use data below the county level, face shortcomings when the solution is aggregated and misses the data needed at finer levels of geography. In South Dakota, Zhang found that data on AIAN populations, especially for children, were too noisy to be useful. Finally, with respect to equity, Zhang stated that small areas will suffer more, and errors should not be associated with population size since small areas are already underserved.
Tienda mentioned a comment in the chat from an anonymous user who asked whether it is too late to reconsider differential privacy, and Tienda reiterated Jason Devine’s comments that another round of demonstration data will be issued. However, Tienda also noted that the use cases revealed that improvements in later rounds of demonstration data will benefit some groups more than others, which illustrates the equity issue raised by others.
Webinar attendee Gwynne Evans-Lomayesva (University of Pennsylvania) asked Liebler whether geographic spread was analyzed for different tribal lands and impacts in the DHC demonstration data with differential privacy. Were any tribal areas impacted more than others or than other areas of the United States? Liebler responded that she broke out tribal lands by total population size, and tribal lands with smaller total populations have larger percent differences.
INNOVATIVE TECHNIQUES
Working with data on small populations often requires adjustments to glean insight from the data, even if it is as simplistic as aggregation. A few
presentations highlighted new techniques that could assist with constraints placed on the data with noise infused by the TDA.
Kyle Cassal (Esri) discussed some of these options in his presentation in “Use Cases Part V,” with Randall Akee (University of California, Los Angeles), who served as the moderator and discussant. Cassal explained that Esri is concerned about the new disclosure avoidance system and differential privacy for many reasons. He stated that Esri needs to serve its users who span a broad base from the business world, academics, nonprofits, planners, and many others. All of Esri’s users require an accurate understanding of the human landscape. Cassal compared challenges associated with differential privacy to educating users about margins of error when ACS data were first introduced. He also expressed concern that some variables in the proposed DHC File will have less geographic resolution than data from the prior census. Decennial variables that were available at the block group level in 2010 and are available only at the county level in 2020 will have a big impact on Esri’s users. Esri also builds its own estimates and projections on top of census data, and it is important for the underlying data to be accurate.
As a result, Esri has developed some tools, which Cassal demonstrated, that will assist users in making the DHC data more accessible. One is the “Compare Places Dashboard,” which provides users with values for both SF1 data and differentially privatized data. This tool is described further in an Esri blog article.5 These tools are especially important for planners and local governments to assess the data, where the improbable and impossible statistics that Cassal noted can have severe consequences.
The second tool is called “Blur” (also described on the Esri blog6), which creates a layer effect that defocuses or softens edges of the features to signal a reliability scale to users. The blur can give users a quick reference point to understand the relative quality of their estimate. Cassal also discussed an approach to fix data irregularities using values from prior census data and borrowing data from larger geographies and similar neighborhoods. Cassal stated that the realignment effort was fairly straightforward for the Public Law 94-171 data but doing so for the DHC file will be a much larger effort. (Esri’s Census 2020 realignment approach is described in greater detail in an Esri blog article.7)
The final tool presented by Ethan Sharygin (Portland State University) was discussed in “Use Cases Part I,” which was moderated by Marta
___________________
5https://www.esri.com/arcgis-blog/products/esri-demographics/state-government/compare-places-dashboard-review-the-most-recent-census-2020-disclosure-avoidance-system-v2022-03-16/
6https://www.esri.com/arcgis-blog/products/arcgis-online/mapping/blur-differential-privacy/
7https://www.esri.com/arcgis-blog/products/esri-demographics/state-government/census-2020-realignment-by-esri/
Tienda. The P-TOPALS (Tool for Population Analysis Using Linear Splines) approach is a nonparametric technique that offers smoothing. Sharygin stated that he and his coauthors (Sigurd Dyrting and Abraham Flaxman) found that changes since 2020—including the higher privacy-loss budget and a change to the Gaussian noise mechanism—had positive effects on fitness for use. Sharygin clarified that results were closer to published distributions when he and his colleagues used age-smoothing techniques.
As discussant, Weiwei Zhang stated that although Sharygin did not have enough time to describe the P-TOPALS smoothing technique in detail and it could be promising, she was concerned that there is already error with uncertainty from disclosure avoidance system mechanisms; using an additional method could make it difficult to assess how much error is coming from which method.
DISCUSSION
Mary Craigle served as discussant for “Use Cases Part IV.” She introduced herself as the chair of the State Data Centers (SDCs) in addition to her duties for the state of Montana. She noted that her discussion points would emphasize people because state and local governments use references to DHC values sometimes with ignorance of where those data come from and how they are developed. Craigle’s discussion centered largely on state laws and rules (see Chapter 10). Her primary contention was that legislators rely on people like her since they do not have the expertise to know whether a given value is fit for use.
Craigle asserted that the Census Bureau must release guidance on the usability of the DHC statistics in partnership with the data users. She explained that many real-world users do not have the statistics background or access to statistical experts to gauge whether a value is fit-for-use. She urged the Census Bureau to consider that wrong conclusions from these data can cause people “to die, go hungry, or become homeless.” She applauded the Census Bureau for its partnerships to date with the SDCs, Census Information Centers, and the Federal-State Cooperative on Population Estimates, but she stated that more examples are needed to improve the DHC File and that the Census Bureau should begin preparing guidance now for data users to distribute with the release of the DHC File.
Michael Hawes (U.S. Census Bureau) asked Craigle what the form and content of the guidance might look like in an ideal world. Craigle responded that she spoke to Director Santos on the first day of the workshop and suggested that the values be given a very clear color-coding system indicating whether the value could be used freely, could be used with caution, or is simply too unreliable. Craigle suggested making this very simple for users, because sometimes users in tribal or rural areas only want to know whether
they can be confident in the value for the decision at hand or whether they need to seek additional information. Craigle noted further that such an approach would go a long way toward firming up the trust in the Census Bureau. Craigle explained that she does not believe the Census Bureau has lost credibility, but rather that there is confusion when values do not match what communities see on the ground. John Abowd (U.S. Census Bureau) asked Craigle whether she was referring to total uncertainty or disclosure avoidance uncertainty. Craigle confirmed she was referring to total uncertainty stemming from both disclosure avoidance and collection challenges.
Webinar attendee Matthew Lawton (Nevada state demographer) asked whether the public can expect to see a household statistic for tracts or blocks in the DDHC File. Alexandra Krause (U.S. Census Bureau) responded that the 2020 Census Data Product Planning Crosswalk8 compares the 2010 and 2020 Census data products. It shows that the DHC File includes information on household size down to the block level. However, the more detailed information on counts of people by certain households will be in the Supplemental DHC (S-DHC), formerly known as the DDHC or the complex person-household join tables.
Tom Mueller (University of Oklahoma) asked Flaxman about the false positives for transgender youth that decreased with each method and how these influence interpretation of the plausibility of disclosure. Flaxman responded there were 6,000 transgender children disclosed in Scenario One, 600 disclosed in Scenarios Two and Three, and 150 in Scenario Four. He explained that, while some of these disclosures were due to household residents moving in and out of a block, they were not strictly false positives. Flaxman elaborated that his analysis with Os Keyes was a relatively simple construction, but more sources of data could be brought in with peril, merging data from multiple years with additional sources to increase the precision.
Webinar attendee Jeff Hardcastle (retired Nevada state demographer) raised research by Krish Muralidhar arguing that the recombination of data is infinite. Hardcastle asked how this impacts studies with synthetic data. Flaxman responded that he had read this work and commented that it was a valuable deep dive into how reconstruction might work. Flaxman explained that it is a challenge for people outside the Census Bureau trying to figure out the details of what has been happening in the reconstruction attacks and the like that led to the decision to switch from swapping to a new method. He stated that he understood the points about how there will be some imprecision in the reconstructions, including information available
___________________
8https://www2.census.gov/programs-surveys/decennial/2020/program-management/data-product-planning/2010-demonstration-data-products/02-Demographic_and_Housing_Characteristics/2022-03-16_Summary_File/2022-03-16_2020_Census_Data_Product_Planning_Crosswalk.xlsx
in some court filings, but that there were also some ways of thinking it through with simulated data in hand that made it clear that there are real risks here. Flaxman stated that simulated data can also improve understanding that there are many other risks and attacks out there, such as the re-identification of transgender children through linked data.
Hawes also responded about reconstruction, stating that it is important to recognize that there will certainly be variability. In reconstructions there are many cases with more than one possible solution. However, there are plenty of cases where there is one and only one solution. Hawes explained if there is only one possible solution for a particular block or a particular block group, then one knows they have the right reconstructed data. On day two, after conferring with his Census Bureau colleagues, Hawes reported back to the workshop attendees that 65 percent of blocks have unique reconstruction solutions, so there is one and only one possible reconstruction block that represents the 88 million people living in those blocks.
This page intentionally left blank.


