
7
Evaluation of the Demonstration Data in Public Health
FERTILITY
Helen You (Texas Demographic Center) provided an overview of the Texas Demographic Center and explained that it is required by the state of Texas to produce population estimates every year, as well as biennial population projections. These data in turn are used by public agencies as denominators for calculating prevalence rates for many subjects. Her presentation focused on the population projections they produce every other year for the state and all 254 counties in Texas with great variability, ranging in populations of fewer than 100 in Loving County to about four million in Harris County.
You stated that these projections are required by single year of age, race, and ethnicity and always start with the most recent decennial census and project out for 40 years until the next decennial data are released. The components of change model includes fertility, mortality, and net migration by age, race, and sex. In addition to the decennial data serving as the base, these estimates incorporate birth data from the Texas Department of State Health Services. You’s analysis focused on the fertility component required for age-specific fertility rate projections using data for women ages 15–49. Given the varying size of counties, these projections are not possible for all racial and ethnic groups, so some counties have to be grouped together.
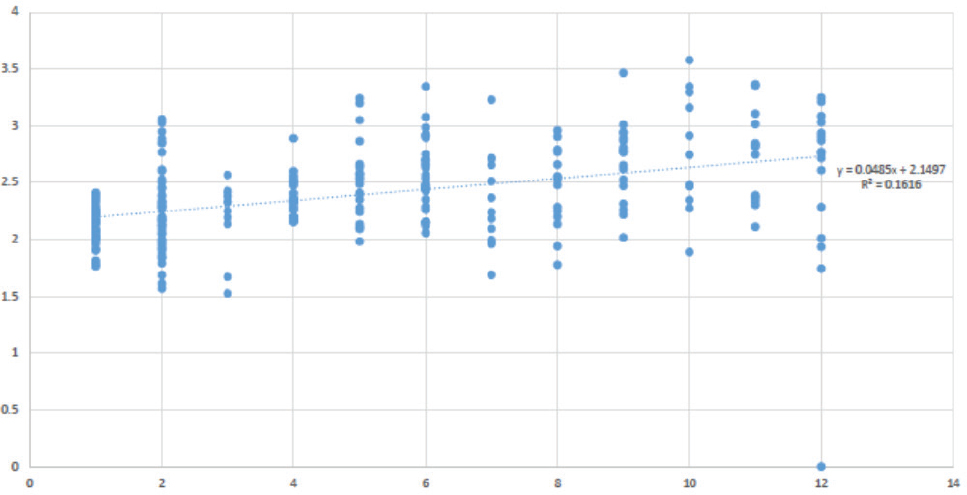
You found a positive relationship between rurality and fertility. Referring to the explanation of Rural-Urban Continuum Codes (RUCCs) by Tom Mueller (University of Oklahoma), You presented Figure 7-1, and pointed out that rurality was plotted on the x-axis with each dot
NOTE: Data from Texas Department of State Health Services, Births 2009–2011; Census Bureau, 2010 Decennial Census Summary File 1; U.S. Census Bureau, Demonstration Data for the 2020 Census Demographic and Housing Characteristics File, 2022-03-22.
SOURCE: Helen You workshop presentation, June 22, 2022.
representing a county. She explained that fertility rates increase in counties that are more rural, and that rural populations tend to give birth at earlier ages compared with urban populations. Since the decennial data are used as the denominator, having accurate data is critical to this demographic analysis for Texas.
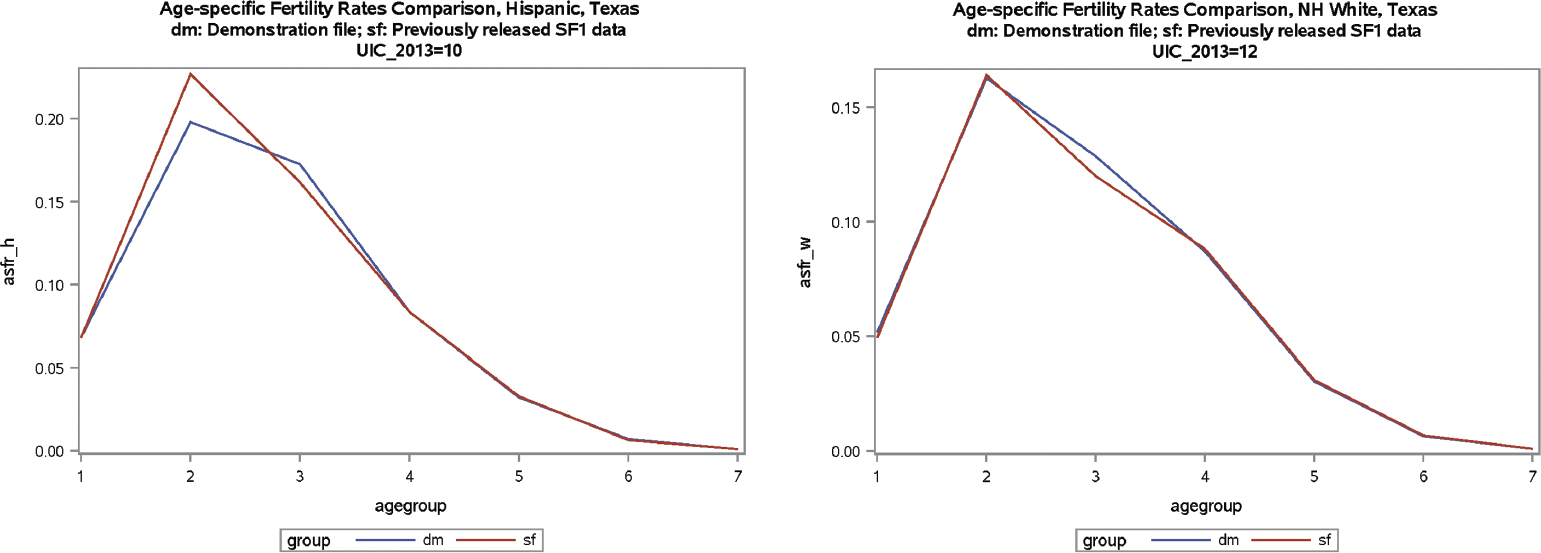
You displayed the age-specific fertility rates to compare estimates from the Summary File 1 (SF1) and demonstration data from March 2022 that used differential privacy-based noise infusion, and she then examined these estimates by Hispanic and non-Hispanic White (Figure 7-2), as well as non-Hispanic Black, non-Hispanic Asian, and non-Hispanic other race (additional figures available in the slides posted for the workshop). She concluded that there were not many differences between the SF1 and demonstration data for urban counties, but differences appeared in rural counties. You stated that the projections are important to local governments between census years, and they need granular data to do their work well. In closing, she urged the Census Bureau to make the confidential data (without differential privacy applied with noise injection) available to the Research Data Centers.
NOTE: Data from Texas Department of State Health Services, Births 2009–2011; Census Bureau, 2010 Decennial Census Summary File 1; U.S. Census Bureau, Demonstration Data for the 2020 Census Demographic and Housing Characteristics File, 2022-03-22.
SOURCE: Helen You workshop presentation, June 22, 2022.
COMPARISONS AT COUNTY, CENSUS TRACT, AND BLOCK LEVELS
Angie Werner (U.S. Centers for Disease Control and Prevention [CDC]) coordinates CDC’s efforts to examine the potential impacts of differential privacy on public health through the National Environmental Public Health Tracking Program, and she and her colleagues1 have developed a series of use cases. Werner gave an overview of public health surveillance; introduced the concept of age-adjusted rates (OWCD, 2012); and explained that the information is used for health action by governments, state and local agencies, public health practitioners, and the public.
These use cases are discussed below by topic; Werner summarized overall conclusions from CDC by level of geography. At the county level, data showed overall improvement in age-adjusted rate. These rates were not stratified by sex, race and ethnicity, urban and rural, or any other subpopulation. Additionally, age-specific rates did not improve and remained problematic. At the census tract level, the data remained problematic when calculating age-adjusted rates. Changes in age groups impacted overall rate calculations, even if total population counts did not change significantly. For the block level, the data were problematic for characterizing risks accurately and identifying or targeting populations at higher risk.
The implications of CDC’s analysis for public health, especially for denominators, include over- or underestimation of disease, health disparities, or health care use rates with unstable denominators. When monitoring trends over time, it is important to be able to detect true increases or decreases, set targets, implement evidence-based interventions, and monitor progress. Data are also needed at a finer spatial resolution for sub-populations to disseminate more local-level data, target populations more accurately, and allocate resources appropriately. Lastly, measuring baselines and progress of CDC health equity goals is critical.
COVID-19
The first use case examined COVID-19 cases by county, race, and age. The denominators were SF1 and the differentially privatized demonstration data from March 2022. County-level rates were calculated for both metro and nonmetro areas using the same RUCCs as discussed by Tom Mueller in “Use Cases Part I.” The two sets of rates were age-adjusted with the SF1
___________________
1 Adam Vaughan, Division for Heart Disease and Stroke Prevention; Mel Smith and Ryan Davis, Geospatial Research, Analysis, and Services Program; Nick Skaff, National Environmental Public Health Tracking Program; CDC Differential Privacy Interest Group; CDC Tracking Program Differential Privacy Content Workshop; CDC Office of Science; National Center for Health Statistics; and IPUMS.
denominator and then with the denominator of differential privacy; then the absolute difference was calculated.
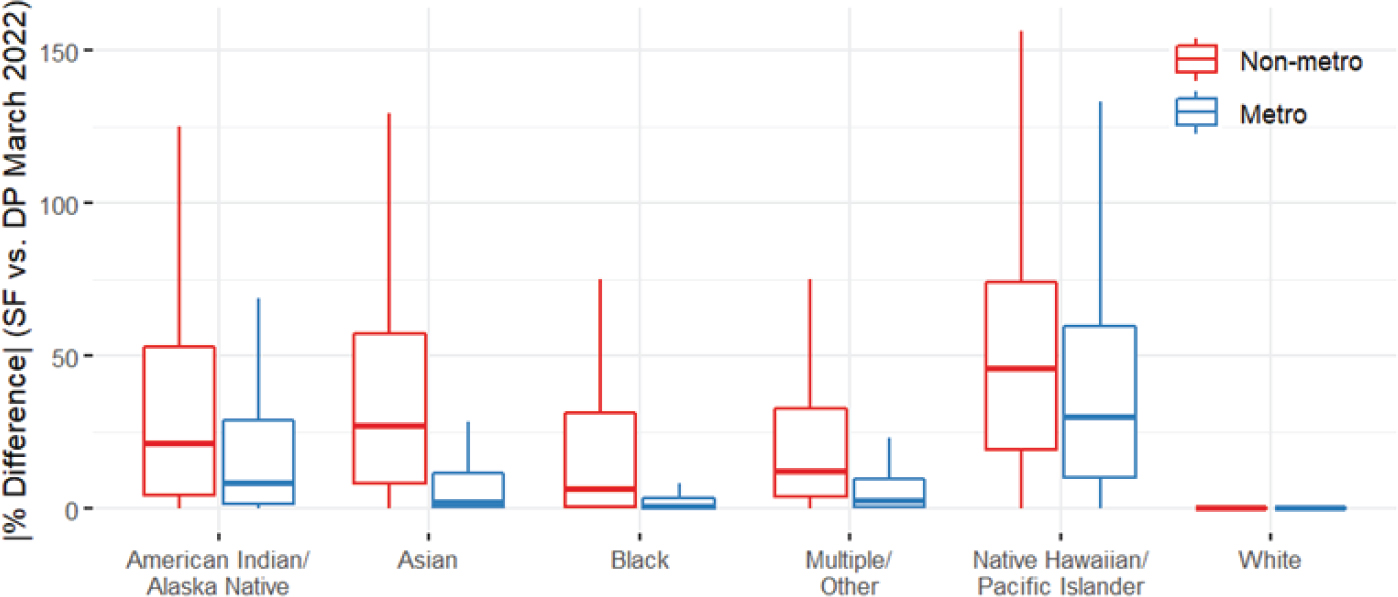
Werner discussed Figure 7-3, in which nonmetro areas in red reveal the disproportionate impact of differential privacy on age-adjusted rates for all racial groups. When the median percent differences were compared, the highest differences were found for Native Hawaiian/Other Pacific Islander in the metro (29.9%) and nonmetro areas (45.7%). CDC found that the use of differential privacy in the denominator could distort CDC’s health equity efforts by being unable to distinguish between true increases and decreases in incidence. There were greater impacts on smaller populations, which included both racial minority groups and rural communities. Werner explained that inaccurate calculation of rates could result in targeting interventions incorrectly, allocating scarce medical resources improperly, and further exacerbating health inequities.
Cardiac Disease Mortality
To examine heart disease mortality, data for the numerators were taken from 2010 county-level heart disease death counts from the National Vital Statistics System, and data for the denominators were taken from the National Center for Health Statistics bridged-race estimates and differentially privatized demonstration data. A Bayesian spatiotemporal conditional autoregressive model was used to estimate the percent change between rates with different denominators. Age-standardized rates by sex as well as age-specific rates were stratified by 10-year age groups by sex.
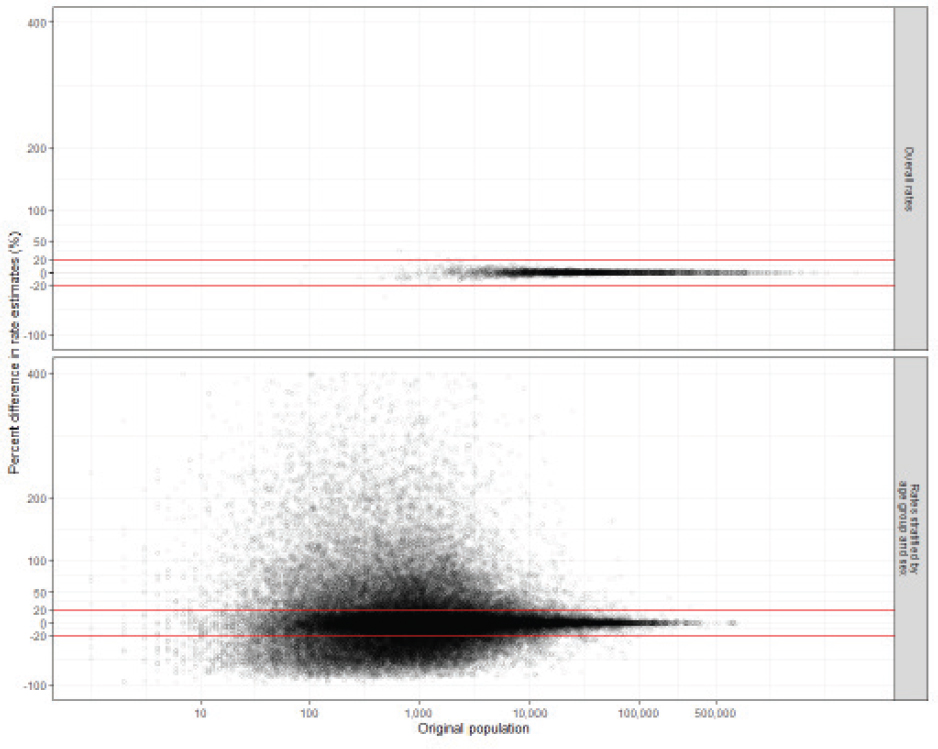
In Figure 7-4, Werner explained that the top half of the figure shows overall rates, and the lower half shows the rate stratified by age and sex. For the percent difference in age-adjusted rates, the red bars show plus or minus 20 percent difference. As a result, positive differences indicate that the rate estimated using differential privacy was a higher value. Most of the differences fell within the 20 percent demarcation for overall rates, and those areas that were not within that value generally had populations of fewer than 10,000 people. When the rates were stratified by age group and sex, almost half of the data points had more than a 20 percent difference. The same pattern was observed, however, where almost all of these estimates with the larger percent differences were in areas with smaller populations.
Werner discussed how the implications of the models in this use case are critical for cardiovascular disease public health surveillance. She noted there were impacts, particularly on smaller populations, that could include rural communities and racial or ethnic minority groups. These estimates are typically used to identify which counties have the highest burden, in order to allow for targeting geographically focused interventions. The estimates were generally inflated with the differentially privatized denominators,
NOTE: DP = differential privacy; SF1 = Summary File 1.
SOURCE: Angie Werner workshop presentation, June 22, 2022.
SOURCE: Angie Werner workshop presentation, June 22, 2022.
which could have implications in that counties may be less likely to meet certain goals.
Emergency Department Visits and Hospitalizations
Werner described the methods used to calculate age-adjusted rates with and without differential privacy, and then calculate the percent difference for asthma emergency department visits. More states had data available for the county level than for census tracts (30 states with county level vs. six states with census tracts). Werner discussed Figure 7-5, which shows that the county-level rates improved with the demonstration data. The red circles indicate areas where the difference from the SF1 data were greater than 20 percent. The tract-level data on the right, however, show more variation, which is problematic for decision making to address community concerns. Werner offered the example of a health department looking at cancer rates in a given town or neighborhood, supporting the need to obtain data that
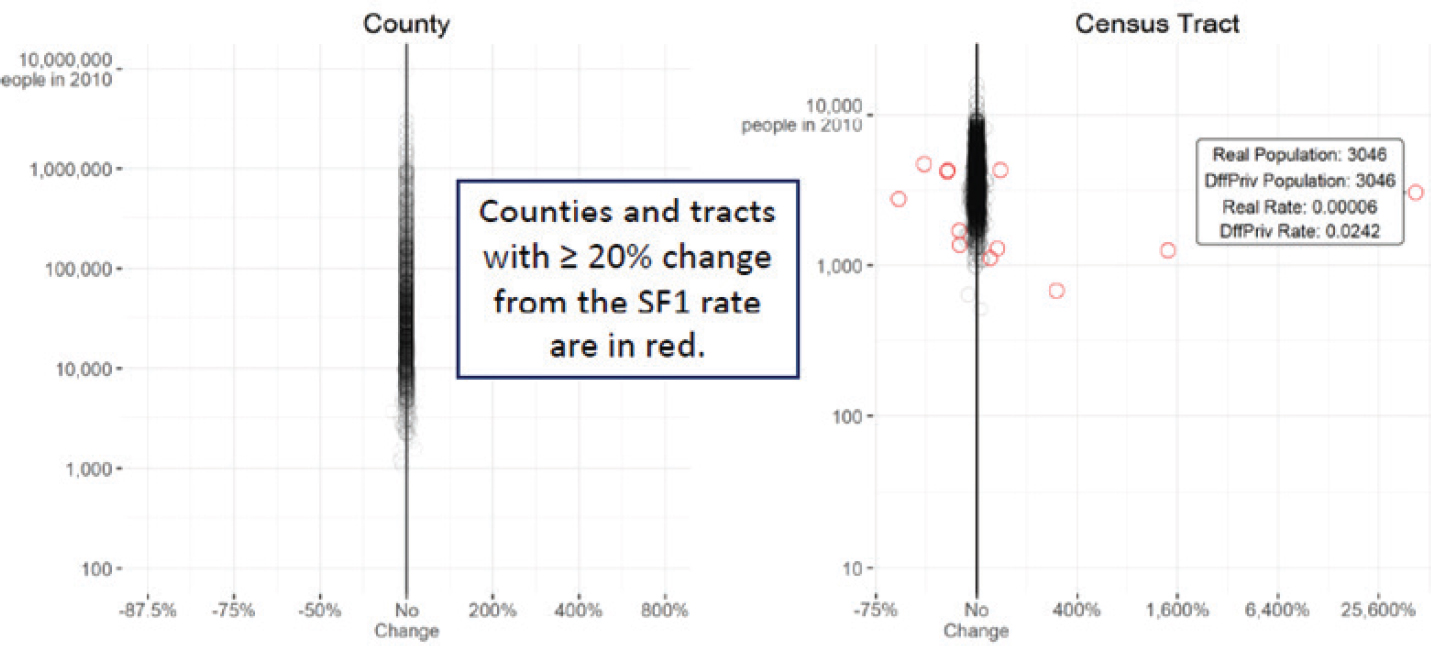
NOTE: SF1 = Summary File 1.
SOURCE: Angie Werner workshop presentation, June 22, 2022.
are more timely and at a finer spatial resolution to see impacts and calculate rates for those areas.
At the county level for acute myocardial infarction hospitalizations, Werner explained that rates improved for the March 2022 demonstration data compared with the May 2020 demonstration data, as displayed in Figure 7-6. For the census tract level, changes exceeded five percent in certain tracts. These age-adjusted rates were sensitive to population changes within individual age groups even if the total population count did not typically change.
Environmental Health Hazards
Werner explained that environmental hazard site assessments are typically done in a specific area, such as a superfund site, where there is exposure to environmental contaminants, in order to characterize a population in that area. Another example is an accidental chemical spill, when data are needed for assessing the population at greatest risk, in addition to data on surface topography, air patterns, and other data. To illustrate this use case, two areas were selected—one with low-density population (the Arkla Terra superfund site in Florida) and one with higher population density (the Keegan Landfill site in New Jersey).
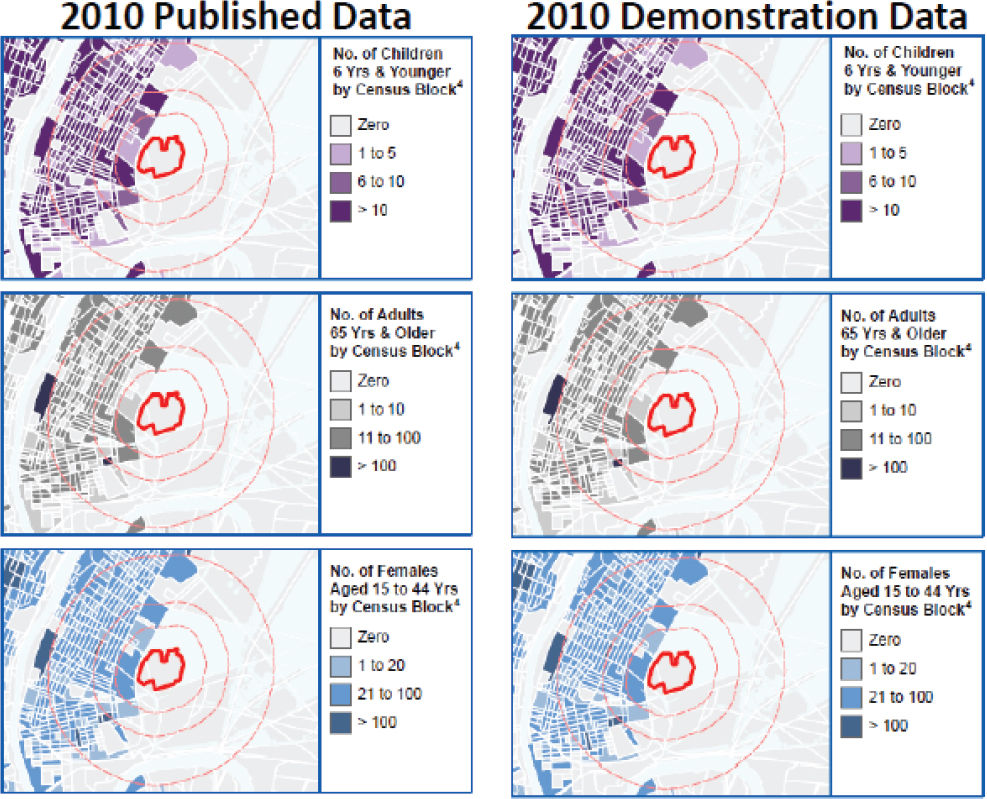
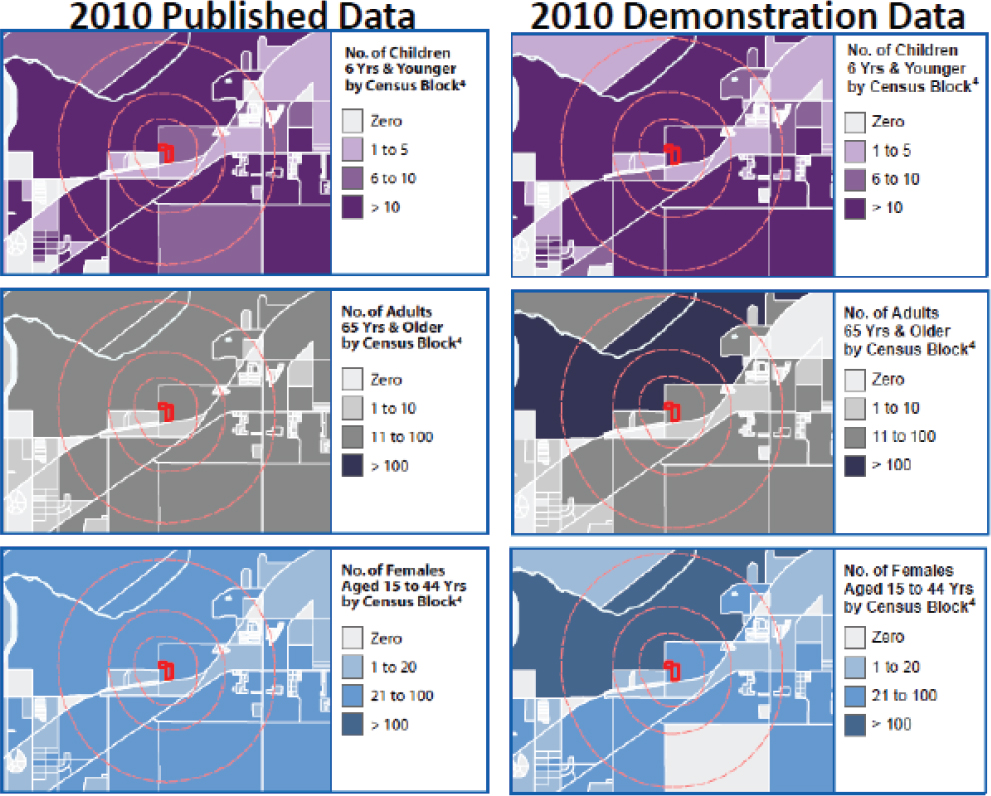
Demographics for the maps were generated using census variables, and then an area proportion technique. Next, population values were estimated for blocks not completely within the designated buffer. The estimate was calculated based on the proportion of area of the block included within the distance. The accuracy of this technique is directly related to geospatial granularity of data, so block-level data were preferred. The analysis used block-level data for race, ethnicity, age, and sex, along with both sets of denominators. Figure 7-7 for the Keegan Landfill site in New Jersey (a more densely populated site) shows that variation between the 2010 published data and 2010 demonstration data was not significant enough to change classification assignments for blocks within 1 mile of the site. However, for the Arkla Terra superfund site in Florida (a low-density populated area), Figure 7-8 shows that the variation with the differentially privatized demonstration data was significant enough to change classification assignment for blocks.
The results for environmental hazards in the two sites by demographic differences are summarized in Table 7-1. They show that there was a higher percent change in the low-density population site, with Native Hawaiian and Other Pacific Islanders alone having the largest percent changes in both the more densely populated and low-density sites, respectively (36.4% vs. –100.0%). The implications of this work are that exposure assessments require accurate information. Environmental health scientists rely on this
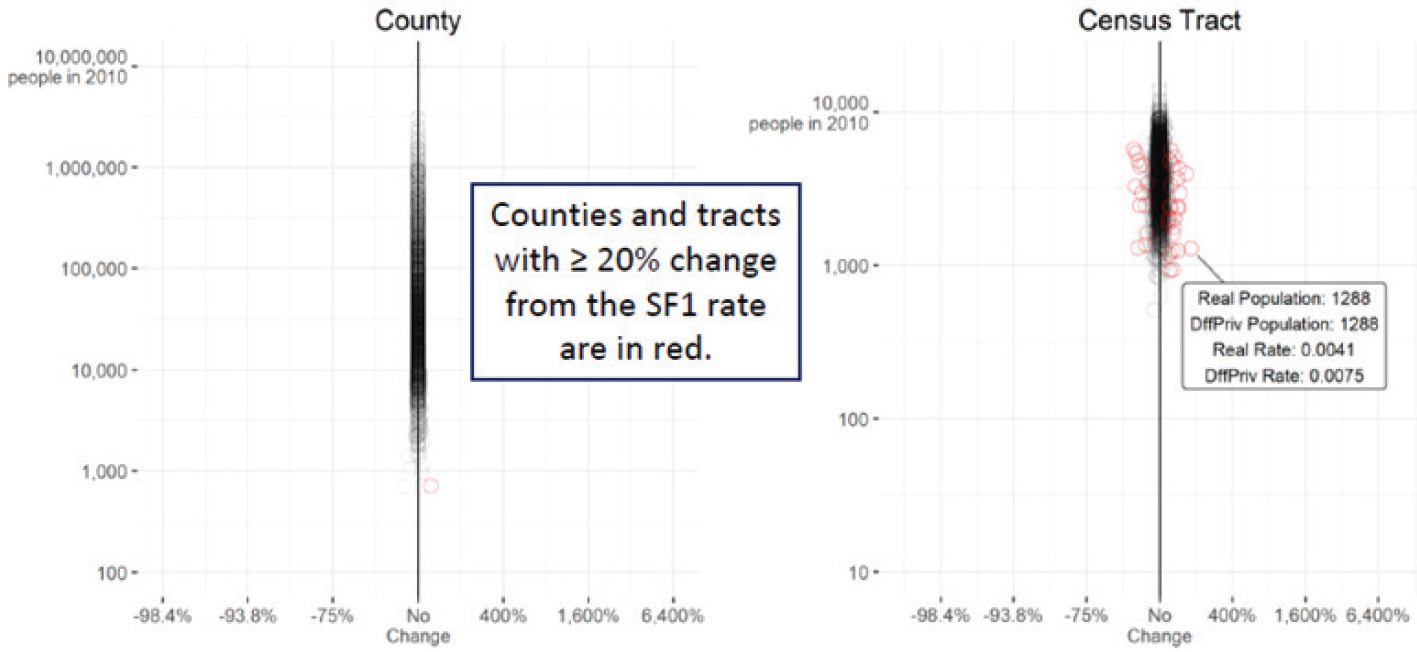
NOTE: SF1 = Summary File 1.
SOURCE: Angie Werner workshop presentation, June 22, 2022.
SOURCE: Angie Werner workshop presentation, June 22, 2022.
information to better identify and assess the risk for the general population and for those who are at higher risk for conditions associated with exposure. Underestimating the population because of differential privacy may inadvertently exempt affected areas from consideration for assessment.
DISCUSSION
Vickie Mays (University of California, Los Angeles), who served as moderator, reflected on comments by danah boyd (Microsoft Research) in the Privacy Panel (see Chapter 8) about the ways in which we think about people. These presentations offered additional insights about the ability to intervene and know exactly where resources are needed and how to set targets. For example, what defines a medically underserved area?
Joe Hotz (Duke University) asked about the nature of bias, especially in less populated areas, and nonnegativity constraints that tend to have a bias that would suggest inflating low-population areas. Michael Hawes (U.S.
SOURCE: Angie Werner workshop presentation, June 22, 2022.
TABLE 7-1 Difference in Demographic Estimates in Two Sites
| Measure | Difference |
|---|---|
| Densely Populated Site | |
|
Black Alone |
–7.6% |
|
American Indian & Alaska Native Alone |
–14.9% |
|
Native Hawaiian & Other Pacific Islander Alone |
36.4% |
| Low-Density Population Site | |
|
Black Alone |
5.4% |
|
American Indian & Alaska Native Alone |
30.4% |
|
Native Hawaiian & Other Pacific Islander Alone |
–100.0% |
|
Some Other Race Alone |
–15.1% |
|
Two or More Races |
–8.5% |
|
Hispanic or Latino (of any race) |
–9.7% |
SOURCE: Adapted from Angie Werner workshop presentation, June 22, 2022.
Census Bureau) responded that the Census Bureau is looking into the bias, but while the upward bias for small groups and low-population groups was prevalent with the October 2019 demonstration data, it has now been substantially mitigated.
A webinar attendee posed a question for Helen You, referring to Tom Mueller’s presentation on the significant diversity among rural communities. The attendee asked whether You found that a rural county’s dominant racial demographic had any impact on the projection accuracy for the county as a whole. You responded that rural counties vary in demographic composition in Texas. For example, while statewide, 37 percent of Texas’s population in 2010 was Hispanic, the population of some border counties was 80–90 percent Hispanic and northern counties were predominantly non-Hispanic. You indicated that more research was needed because the noise in the non-Hispanic population is not evenly distributed.
Mays responded to another question from a webinar attendee about whether there is an intuitive sense of the way differential privacy differs from previous sources of variation for denominators. Mays stated that health data are often discussed within the context of the protection provided by HIPAA (Health Insurance Portability and Accountability Act of 1996), which applies to clinical data that carries into administrative data. She questioned whether there was a way to think about differential privacy in the census data that is already there and whether the data are being overprotected in the health sphere.
Werner responded that accurate denominators are needed to characterize health burdens and disparities. Hawes added that using small denominators for rates will also be susceptible to changes from other known sources of error, such as coverage and measurement error. Webinar attendee Nicholas Nagle (University of Tennessee) commented that age standardization is common at the county level. Since age standardization can vary widely in small counties, there is extensive literature on Bayesian spatial smoothing of disease. Mays closed the session observing that the data are not just about the impact on people but also about data resources and the ability to intervene based on having that data.
This page intentionally left blank.


