
2
A Demographic Portrait of Intergenerational Child Poverty
The committee was charged with identifying policies and programs that have the potential to reduce intergenerational poverty. To provide useful background information, this chapter describes the demographic structure of intergenerational mobility out of low-income status in the United States. Here the committee was aided by the availability of population-wide data that track individuals from the years when they were still living with their parents as children until they were well into their 30s and had families and careers of their own. With these data, the committee could identify the subset of individuals who were living in low-income households during childhood and then track their economic trajectories into adulthood. And because the data cover the entire population, they can describe the intergenerational fortunes of different racial and ethnic groups as well as the trajectories of children of immigrants from all parts of the globe. The chapter then turns to geographic differences in mobility out of a low-income childhood across the United States—shedding light on the geographic correlates of intergenerational poverty—and examines how the structure of intergenerational mobility has changed over time.
MEASURING INTERGENERATIONAL POVERTY
Intergenerational poverty can be defined as a situation in which children who have grown up in families in poverty are themselves living in poverty during their adult years. Given our Statement of Task, our ideal estimates of this status would be based on the Supplemental Poverty Measure
(SPM).1 Recent counts of SPM-based childhood poverty are readily accessible because the Census Bureau issues an annual report on U.S. children with household incomes below the SPM-based poverty line (e.g., Shrider & Creamer, 2023). Over the decade preceding the COVID-19 pandemic, these child poverty rates averaged 14.9%, although they fell to 5.2% in 2021 in response to generous pandemic cash assistance programs and rose again to 12.2% in 2022 when these programs ended. These figures represent a likely upward bound on the prevalence of intergenerational poverty, because not all children who are poor during their childhood years will also be poor in adulthood.
It will be at least two decades before we can know how many of the children in these 2021 poverty counts are also poor in adulthood. What we can do now is observe intergenerational mobility out of poverty for past cohorts of children and then make educated guesses about the future economic position of current cohorts. But this is complicated by the absence of data on SPM-based poverty for past cohorts. In fact, the committee’s review of evidence on patterns of intergenerational poverty and policies and programs that might reduce it produced only one limited study using an SPM-type measure of the poverty status in adulthood of individuals who, as children, lived in household with incomes below an SPM-type poverty line (Parolin et al., 2022; see Appendix C-2).
Most of our data on intergenerational poverty and mobility come from a much larger study that provides a wealth of population-wide information about intergenerational mobility out of low-income status defined by income reported on Internal Revenue Service tax (IRS) forms rather than SPM-based poverty (Chetty et al., 2020).2 These data allow us to focus on children with low-income parents—defined as parents with incomes in the bottom 20% of the income distribution for the full population of children. We are most interested in what fraction of these children remained in low-income status in their 30s and how these fractions vary across groups defined by race and ethnicity. We also show counterpart calculations in Parolin et al. (2022), which are based on data from the Panel Study of
___________________
1 The SPM provides the most comprehensive measure of poverty. Specifically, it compares household income with a set of poverty thresholds, which ranged between $25,000 and $30,000 for two-adult, two-child families in 2020 for the SPM (Fox & Burns, 2021). Children and all other family members in households with incomes below the corresponding threshold are considered poor. The SPM differs from the Official Poverty Measure in a number of ways, most notably in that it includes “in-kind” sources of income such as tax credits and benefits from programs such as the Supplemental Nutrition Assistance Program (SNAP; formerly Food Stamps). Because some “in-kind” income sources such as SNAP payments may not be completely substitutable with cash income, there is more ambiguity with the household income component of the SPM than the official poverty measure poverty measure. See Chapter 6.
2 Our methods using these data are detailed in Appendix C: Chapter 2; and in Chetty et al. (2020).
Income Dynamics (PSID) and a measure of economic status that is much closer to the SPM poverty definition that what can be constructed from IRS data. Case counts for these PSID-based data are much lower than those in the IRS data, permitting subgroup comparisons only between White and Black children.
A disadvantage of an IRS-based approach is that a “bottom fifth” definition of poverty is somewhat arbitrary and is relative—it will always be the case that 20% of the population is low income by this definition, even though we have already seen that, using the SPM poverty measure, poverty rates have fallen substantially in recent years. Another drawback is that tax records do not measure some of the household resources that are relevant for defining “poverty,” in particular because they exclude government transfers. To address this last issue, we provide data from Parolin et al. (2022) and from other intergenerational studies based on more complete income measurements. Based on data presented in Appendix C: Chapter 2, we also describe the correspondence between our measures of household income and measures of income used to define the SPM based on the Current Population Survey.3 Because the Chetty et al. (2020) 20th percentile threshold does not correspond to any conventional poverty thresholds used in the United States, we refer to it as a marker of “low-income status” rather than poverty.
We also use IRS-based data on intergenerational economic status at the individual level, based on each child’s eventual earnings between ages 31 and 37. In this case, we focus on the same group of children as before—those whose parental income was in the bottom quintile. But instead of measuring economic status in adulthood by household income, we use the individuals’ own earnings. This approach reveals some noteworthy gender differences in adult earnings for certain racial and ethnic groups and provides a more nuanced portrait of intergenerational mobility than one based only on household income.
THE DEMOGRAPHICS OF INTERGENERATIONAL POVERTY
Focusing on U.S. children born around 1980 who grew up in low-income families, the committee found that, depending on the measure, between 29% and 34% of them were living in low-income families when they were adults (Figure 2-1). In other words, around one-third of all children
___________________
3 The appendix tables show that the majority of children growing up in families with parents’ income below the 20th percentile of the parental adjusted gross income (AGI) distribution grow up in poverty as measured by the SPM; however, many children whose parents are in the bottom 20% are still above the poverty line, because they receive transfers or have other household members whose earnings place them above that line.
raised in low-income families also lived in a low-income household in adulthood. The 34% rate based on tax data is twice as high as the 17% rate found among children who did not grow up in such families.
Figure 2-1 also shows immobility estimates separately for Black and White children—the only two groups large enough to support reliable estimates in the Parolin et al. (2022) data. In both datasets, remaining in low-income status in adulthood is considerably more likely for Black than White children.
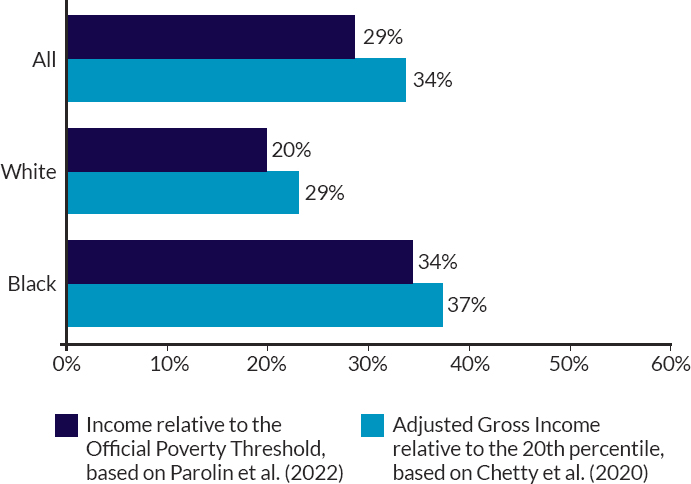
NOTES: This figure shows the percentage of children with low family incomes in childhood who also have low incomes in adulthood based on both absolute and relative measures of low-income status. Absolute poverty data come from the PSID; absolute poverty is measured by whether cash plus in-kind income is below the Official Poverty Measure threshold between ages 0 and 10 (childhood) or at age 30 (adulthood). Children in the PSID analysis were born between 1965 and 1994. Relative poverty data come from IRS tax records; relative poverty is measured by whether average AGI between 1994 and 2000 is in the bottom 20% of the AGI distribution between ages 0 and 18 (childhood) or by whether AGI between 2015 and 2016 is in the bottom 20% of the AGI distribution between ages 31 and 39 (adulthood). Children in the IRS analysis were born between 1978 and 1983.
SOURCE: Data from Parolin et al. (2022), based on data from the PSID and Chetty et al. (2020), based on data from the IRS.
Because the Chetty et al. (2020) data are based on all tax records, they support a much more detailed comparative look at intergenerational persistence across population subgroups. Figure 2-2 shows that the 29% rate of intergenerational low-income persistence for White children is similar to the 25% rate for Latino children, while Asian children raised in poor families have a considerably lower rate of low-income persistence (17%). In contrast, nearly half (46%) of Native American children and 37% of Black children who grow up in low-income households remain poor in adulthood.4
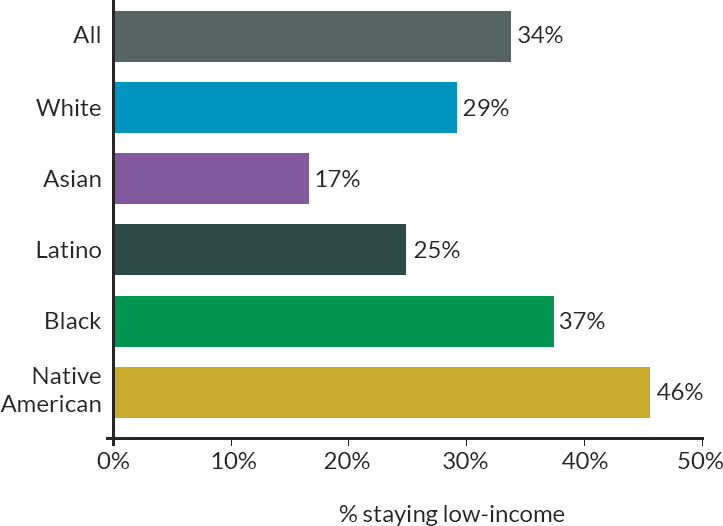
NOTES: This figure shows the percentage of children with parents in the bottom income quintile who remained in the bottom income quintile in adulthood, by racial/ethnic group. Child income is measured as mean household income in 2014–2015, and parent income is measured as mean household income in 1994–2000. Children were born between 1978 and 1983.
SOURCE: Data from Chetty et al. (2020).
___________________
4 To provide an idea of what kind of economic status corresponds to the 20th percentile of the distribution of adjusted gross income (AGI), we used the Current Population Survey to rank children by both AGI and income/needs based on the SPM needs standard. The 20th percentile of the AGI distribution for parents corresponds to an income that is 36% above the poverty line—an income of about $37,500 for a family of four (in 2022 dollars). See Appendix C: Chapter 2 for more details on the comparison of data from these two sources.
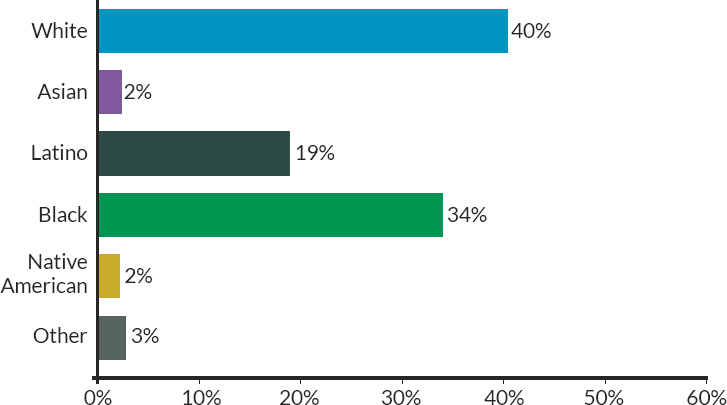
NOTES: This figure shows the race/ethnicity of children with parents in the bottom income quintile who remained in the bottom income quintile in adulthood. Child income is measured as mean household income in 2014–2015, and parent income is measured as mean household income in 1994–2000. Children were born between 1978 and 1983.
SOURCE: Data from Chetty et al. (2020).
Despite the higher rates of low-income persistence among Black and Native American children, White children make up the largest share (40%) of children with persistently low economic status (as defined by the 20th income percentile; Figure 2-3). One-third of persistently low-income children (34%) are Black, 19% are Latino, and Native American and Asian children account for 2% each.
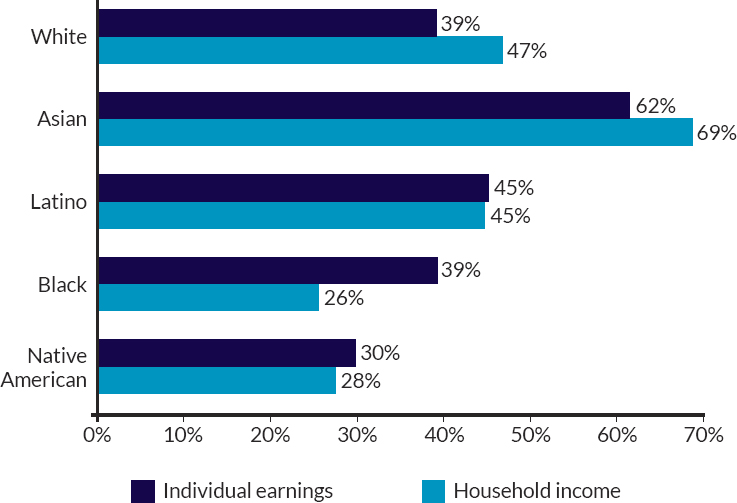
Measuring adult economic success by individual earnings rather than family income allows us to differentiate between patterns for males and females. In contrast to the focus on low-income persistence in prior figures, Figure 2-4 shows rates of upward mobility for male children using both adult earnings and household income, defined as earnings or household income in the top 60% of their respective distributions. As before, all the data presented in this figure are for children born between 1978 and 1983 and with parental family incomes below the 20th percentile while they were growing up. The lighter-colored bars show fractions of males with adult earnings in 2014 and 2015 above the 60th percentile of the adult earning
distribution, while the darker bars show those with household incomes above the 60th percentile, but in the case of Figure 2-4 only for males.
For males, there appears to be more intergenerational mobility in earnings than in household income. This stems, in part, from the fact that males’ earnings in adulthood are being compared with the full distribution of earnings across both males and females. Since men generally have higher labor force participation rates and earn more than women, their mobility into the top three earnings quintiles exceeds that of women. Slightly more than half of White, Asian, and Latino men have adult earnings that place them in the top 60% of the overall earnings distribution, while the corresponding rates for Black and Native American men are considerably lower. A comparison of the earnings and household income results in Figure 2-4 shows broadly similar patterns across groups.
In the case of daughters, there is a notable difference between the relative rates of household income mobility and earnings mobility for Black individuals and White individuals (Figure 2-5). Black and White women who have grown up in low-income households have identical (39%) rates
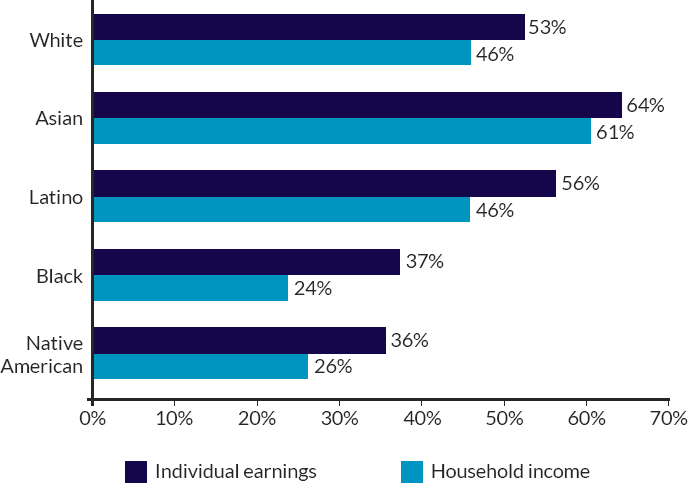
NOTES: The figure shows the fraction of male children growing up in households with AGI in the bottom 20% of the AGI distribution whose individual earnings and household incomes in adulthood (ages 31–37) placed them in the top three quintiles of the adult earnings and household AGI distributions. Children were born between 1978 and 1983.
SOURCE: Data from Chetty et al. (2020).
of earnings mobility but very different (26% vs. 47%) rates of household income mobility. As detailed in Chapter 7, this is probably due to the fact that Black women are more likely than White women to live in single-parent families, and thus also to be the primary earners in their families. In the case of both earnings (30%) and household income (28%), Native American women have roughly the same low rates of intergenerational mobility for both household income and earnings.
Conclusion 2-1: As measured by household income, rates of intergenerational persistence in low-income status in the United States differ starkly by race/ethnicity. The lowest rates are found for Asian children, followed by White and Latino children. In contrast, persistence rates are very high for Black and Native American children. When adult economic success is measured using individual earnings rather than household income, mobility patterns are generally similar. Black women
NOTES: The figure shows the fraction of female children growing up in households with AGI in the bottom 20% of the AGI distribution whose individual earnings and household incomes in adulthood (ages 31–37) placed them in the top three quintiles of the adult earnings and household AGI distributions. Children were born between 1978 and 1983.
SOURCE: Data from Chetty et al. (2020).
who grew up in low-income households are an exception; their earnings in adulthood are just as high, on average, as those of White women who grew up in similar economic circumstances. This reflects the greater likelihood that they are the primary earners in their families.
A BROADER LOOK AT INTERGENERATIONAL INCOME MOBILITY ACROSS GROUPS
For a more comprehensive look at intergenerational mobility across groups, it is useful to think of economic status as rungs on a 100-step ladder, with the lowest rungs corresponding to the lowest incomes and the highest rungs representing the highest incomes. Each rung corresponds to a percentile in the income distribution. In the case of intergenerational mobility, there are two ladders—one showing the family income rank of children throughout childhood and the other showing the family income rank of those children in adulthood (ages 30–39).
The top five lines in Figure 2-6 show mobility patterns for children with very low childhood family incomes—on the 10th rung (percentile) of the income ladder. The topmost line shows considerable mobility in the case of White children, whose adult income, on average, reached the 41st rung. Asian children who grew up with 10th-rung income levels rose even higher, on average to the 53rd rung. Latino children’s average upward mobility (39th rung) nearly matched that of White children. In sharp contrast, both Black and Native American children starting out on the 10th rung ended up at the 29th rung—12 rungs lower than White children.5
What about intergenerational economic mobility from other starting points? The second set of lines in Figure 2-6 shows average mobility for children in the five racial/ethnic groups who all started out with family incomes across childhood placing them on the 50th rung—the middle position in the childhood income distribution. The 10-rung gap persists for children starting out at the middle of the income distribution (the 50th rung), with White children advancing about 4 rungs and both Black and Native American children losing ground and falling back to the 39th and 41st rungs, respectively. Looking across the top and bottom sets of lines, it appears that if Black and Native American children were to match the average economic position of White adults who started out on the 10th rung as children, they had to have grown up in families with incomes above the middle (50th) rung.
___________________
5 As detailed in Appendix C-2, Fisher and Johnson (2023) provide counterpart data from the PSID based on measures of income, consumption and wealth. Upward mobility from the 10th percentile is several rungs lower in PSID than IRS income data, but consumption and wealth-based destination rungs are more similar to IRS results.
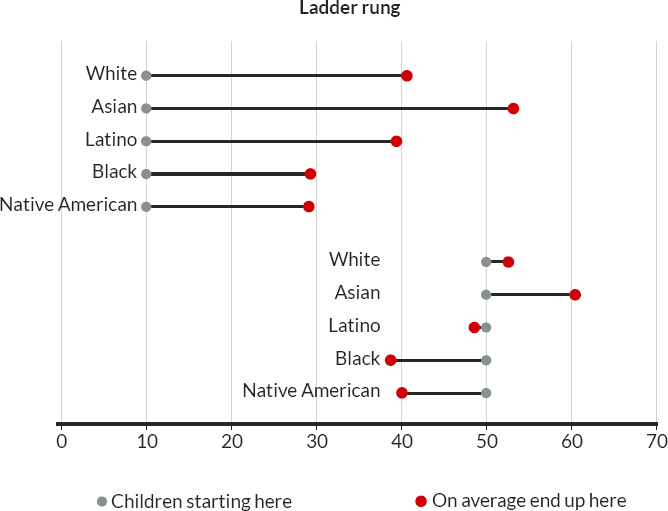
NOTES: This figure shows the mean income percentile of children with parents at the 10th and 50th income percentiles. Child income is measured as mean AGI income in 2014–2015, and parent income is measured as mean AGI income in 1994–2000. Children were born between 1978 and 1983.
SOURCE: Data from Chetty et al. (2020).
These differences reinforce the importance of applying a racial/ethnic disparities lens in analyzing key determinants of entrenched intergenerational economic disadvantage. As a result, Chapter 3 examines the histories, practices, and contexts that limit the intergenerational mobility of both Black and Native American children.
Conclusion 2-2: Racial/ethnic disparities are an enduring feature of the intergenerational trajectories of children, with Black and Native American children experiencing much less upward mobility than White children growing up in the same economic circumstances.
INTERGENERATIONAL INCOME MOBILITY AMONG CHILDREN OF IMMIGRANTS
Immigrants come to the United States with a wide range of human capital and labor market skills. Compared with the U.S.-born, foreign-born individuals disproportionately have either very high or very low levels of educational attainment (Card, 2005). Immigrants are more likely than U.S. natives to hold a graduate or professional degree, while at the same time, particularly if they come from poorer countries, they are far more likely than natives to have completed fewer than 12 years of schooling. Not only do many immigrants from less developed countries arrive with only a few years of relatively low-quality schooling, many also lack proficiency in English. These factors limit the labor market opportunities and earnings of low-skilled immigrants (Duncan & Trejo, 2012).
Because of the large share of immigrants with low skills, average earnings are substantially lower for foreign-born workers than for their U.S.born counterparts (Card, 2005). Not surprisingly, the poverty rate tends to be higher for immigrants than for those born in the United States. In 2018, for example, the poverty rate was 14.6% for the foreign-born compared with 12.9% for the U.S.-born (Budman et al., 2020).6 As a result, children of immigrants are more likely than children of natives to grow up in poverty.
Nevertheless, children of immigrants tend to experience remarkable socioeconomic progress. On average, they acquire more education and have higher earnings in adulthood than do children of the U.S.-born (Abramitzky et al., 2021; Card, 2005). Children of immigrants enjoy larger economic gains relative to their parents than do U.S.-born children (Abramitzky et al., 2021; Chetty et al., 2020), and this is particularly true of children who grew up in poverty. In other words, among children raised in poor households, children of immigrants are substantially more likely than children of non-immigrants to escape poverty as adults.
Figure 2-7, taken from Abramitzky et al. (2021), illustrates this finding. As in the case of our earlier figures, the analysis is based on data from Chetty et al. (2020) using tax records and census information to link the incomes of millions of parental households with the incomes of their adult children. For sons whose parental households between 1994 and 2000 ranked at the 25th percentile of the income distribution (i.e., families near the bottom of the distribution), the figure reports the average rank of the sons’ household incomes when they were ages 31 to 37. Figure 2-7 reports this information both for children of U.S.-born parents (the red bar in the
___________________
6 These statistics are based on the Official Poverty Measure rather than the alternative poverty measure (SPM) that is primarily used in this report.
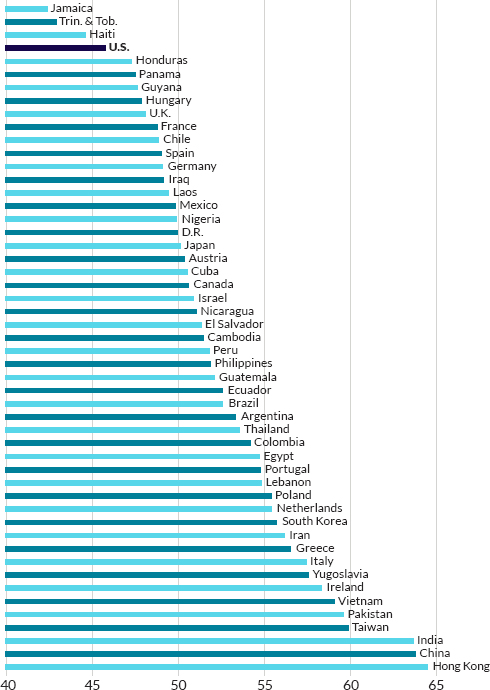
NOTES: This figure is adapted from Figure 3C of Abramitzky et al. (2021). It shows the mean income percentile of sons with parents at the 25th income percentile, by father’s country of origin. Child income is measured as mean income in 2014–2015, and parent income is measured as mean household income in 1994–2000. Children were born between 1978 and 1983.
SOURCE: Data from Abramitzky et al. (2021), Figure 3C.
figure) and separately for children of immigrants by country of origin (the gray bars).
The figure documents extraordinary intergenerational mobility among children of poor immigrants. On average, sons of U.S.-born parents who grew up in households at the 25th percentile of the income distribution climbed more than 20 rungs to the 46th percentile in adulthood. But most sons of immigrants who grew up in similarly low-income households did considerably better as adults. Sons of parents from almost every country
of origin—countries both rich and poor—experienced greater intergenerational mobility, on average, than did sons of U.S.-born parents. Abramitzky et al. (2021) find a similar pattern of results when looking at daughters rather than sons.
Why do children of immigrants experience these larger intergenerational advances? Part of the difference seems to be rooted in the fact that immigrants are more likely to settle in areas that offer their children better opportunities for upward mobility (Abramitzky et al., 2021). Also worth noting is that in many cases, the earnings of immigrants from poorer countries do not reflect the full potential of these individuals, who did not typically grow up speaking English or attending U.S. schools. Their children, however, enjoy these advantages and the economic gains associated with them (Abramitzky et al., 2021; Bleakley & Chin, 2004, 2008, 2010).
Conclusion 2-3: Children of immigrants from almost every country of origin—rich and poor nations alike—experience greater intergenerational mobility than children of U.S.-born parents. This immigrant advantage is larger for children from lower-income households, and to a large extent it reflects the fact that immigrants are more likely to settle in areas that offer their children better opportunities for upward mobility.
THE GEOGRAPHIC DISTRIBUTION OF INTERGENERATIONAL POVERTY
Rates of intergenerational economic disadvantage differ greatly from one part of the country to another, and even from one neighborhood to another in some cities. Figure 2-8 shows national patterns of intergenerational mobility in the United States. Constructed from anonymized adult tax records for more than 10 million children born between 1980 and 1982, it shows the average likelihood that children with parents in the bottom quintile of the income distribution will be in one of the top three quintiles in adulthood (Chetty et al., 2014a). Children are assigned to commuting zones based on the location of their parents, and their household incomes are measured in 2011–2012, when they are approximately age 30.
The blue parts of the map represent commuting zones in which children from the bottom quintile are more likely to reach one of the top three quintiles; the red areas represent places where such intergenerational mobility is less likely. The persistence of intergenerational economic disadvantage varies substantially across regions. Low-income children who grow up in the deepest-blue areas, such as the Great Plains, are about twice as likely to
rise in the income distribution as otherwise comparable children growing up in parts of the Southeast and Midwest.
Although the red areas in Figure 2-8 overlap substantially with areas with concentrations of Black children, Chetty et al. (2020) show that, even among White populations, mobility is lower in the Southeast and areas with larger Black populations more generally.
Variation among nearby census tracts is also evident. A broad range of outcomes can be found in both rural and metropolitan areas; indeed, low-income children in neighboring areas may experience vastly different life trajectories. Chetty et al. (2018) use a dataset similar to that used to construct Figure 2-8 to measure intergenerational mobility for each census tract in the United States. Their estimates show that the geographic distribution of intergenerational economic disadvantage within communities in the United States is far from uniform. Some areas offer opportunities on par with some of the most upwardly mobile countries in the world, while in nearby areas intergenerational economic disadvantage is much more persistent. Figure 2-9 provides an illustrative example by plotting upward mobility by census tract in New York City (analogous data for other cities are available in Chetty et al.’s Opportunity Atlas at www.opportunityatlas.org). Here the measure of upward mobility is the predicted income of children raised in families at the 25th percentile of the national income distribution, a measure that can be estimated more precisely at the census tract level than the probability of remaining in or rising out of low-income status for the subset of children who start out in the bottom quintile.
Several studies have demonstrated that the variations shown in Figures 2-8 and 2-9 are driven largely by the causal effects of place, rather than by differences in the types of people living in different places (Chetty et al., 2016; Chetty & Hendren, 2018; Chyn, 2018; Chyn et al., 2023). This argues for examining place-focused policies such as investing in the economic development of low-opportunity areas and in approaches to increase children’s upward mobility in those areas.
Race remains a factor as well. The geographic distribution of intergenerational poverty in each location varies by race, with one racial group experiencing good outcomes while other groups may not. Consistent with Figures 2-1 and 2-3, Chetty et al. (2020) show that, on average, Black children and Native American children in the United States have much lower rates of upward mobility (and higher rates of downward mobility) than White Americans. But these researchers go on to demonstrate that the gaps often persist within neighborhoods. In 99% of U.S. census tracts, Black boys have lower average incomes in adulthood than White boys. Therefore, to paint an accurate portrait of the geographic distribution of intergenerational poverty, it is necessary to take into account how economic mobility varies across places and across racial and ethnic subgroups.
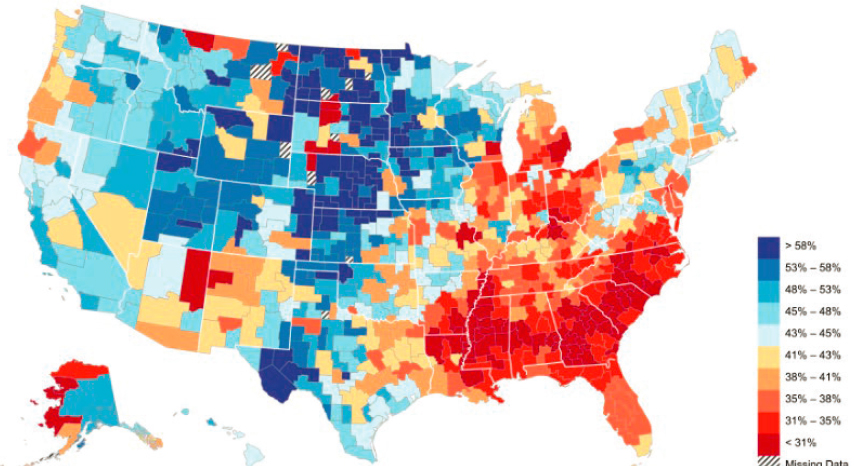
NOTES: This map shows the share of children with parents in the bottom income quintile who reached the top three income quintiles in adulthood, by commuting zone. Child income is measured as mean AGI household income in 2011–2012, and parent income is measured as mean AGI household income in 1996–2000. Children are from the 1980–1982 birth cohorts and are assigned to the commuting zones where they grew up.
SOURCE: Data from Chetty et al. (2014a).
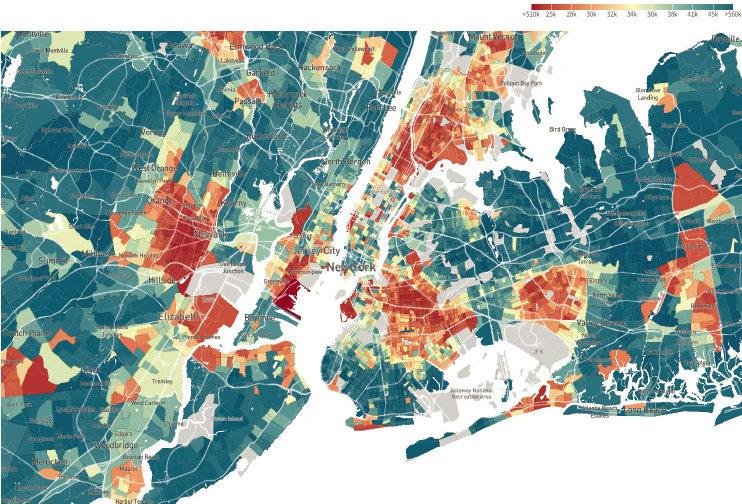
NOTES: This map shows the mean household income of children with parents at the 25th income percentile, by census tract in the New York City area. Child income is measured as mean AGI household income in 2014–2015, and parent income is measured as mean AGI household income in 1994–2000. Children are from the 1978–1983 birth cohorts and are assigned to the census tracts where they grew up.
SOURCE: Image generated from https://www.opportunityatlas.org/ for Chetty et al. (2018).
Motivated by this finding, a rich literature has emerged using geographic variation to understand what factors explain differences in intergenerational mobility across areas. Studies have found several systematic predictors of differences in mobility, from poverty rates and school quality to the degree of inequality and historical factors such as redlining and Jim Crow laws (see Chapter 3).
The demographic characteristics of neighborhoods also show strong correlations with levels of upward mobility. Living in an area with a larger concentration of Black residents is associated with lower intergenerational mobility for both Black individuals and White individuals. One of the strongest predictors of differences in mobility across areas is the neighborhood fraction of children living with single parents. This correlation was
nearly as strong for children growing up in married-parent families as for children growing up in single-parent families. However, because this is merely a correlation, it does not mean that changes in neighborhood family structure will necessarily cause changes in intergenerational mobility. In fact, Chetty et al. (2014a) find evidence that some of this correlation can be explained by the fact that family structure is associated with an area’s degree of income inequality.
“Economic connectedness” is another strong predictor. Chetty et al. (2022) examine a measure of social capital constructed from Facebook friendships among low- and high-income individuals. They find that “economic connectedness”—as measured by the share of a person’s Facebook friends from higher social strata—is among the strongest predictors to date of upward intergenerational income mobility. In fact, they find that it can explain several of the other correlations discussed above, such as the link between mobility and poverty rates, racial demographics, and income inequality. For example, areas where poverty is more concentrated tend to have fewer social connections between low- and high-income people, and this can explain (in a predictive sense) why higher poverty is associated with lower mobility.
Conclusion 2-4: Children’s chances of growing up and escaping low-income status vary substantially depending on where they live. At both a broad regional level and within community boundaries, there are areas where low-income children tend to grow up and join the middle class, as well as areas where generations are more likely to remain mired in poverty. The spatial patterns of economic mobility vary by racial/ethnic group; nonetheless, disparities in economic mobility between Black and White children persist even within neighborhoods.
INTERGENERATIONAL MOBILITY: TRENDS AND COMPARISONS WITH OTHER COUNTRIES
Regardless of whether the amounts of intergenerational mobility out of low-income status shown in Figures 2-1 and 2-3 are perceived to be large or small, it is useful to examine how mobility rates have changed over time and how they compare in the United States and other countries.
Trends in U.S. Intergenerational Mobility
A number of economic and demographic changes over the past 75 years have created strong headwinds for children who grew up in poverty and
have sought to do better economically than their parents. Economic growth was much stronger before the mid-1970s than it has been since. Moreover, as detailed in Chapter 6, high-income families have experienced far more growth since the mid-1970s than low-income families. Much of this differential growth can be attributed to increasing rewards for workers with college degrees relative to those whose schooling came to an end in high school. Some of the lower growth in family income is due to an increasing prevalence of single-parent families among the less educated.
Data presented thus far have shed light on the intergenerational mobility of children born around 1980. What about children born 20 or 40 years earlier? In the United States, intergenerational data spanning multiple cohorts are scarce. Although our decennial census counts the entire U.S. population every 10 years, there is no easy way of linking the data for a child in, say, the 1940 or 1950 census to the data gathered for that same child 30 or 40 years later. Chetty et al. (2020) matched the relevant data with the censuses starting in 2000, but no one has yet done so with prior cohorts.
Concentrating on children born in the first half of the 20th century, Jácome et al. (2021) find clear evidence of increasing intergenerational mobility. In contrast, for more recent cohorts, decreasing mobility is evident in some but not all measures. Davis and Mazumder (2022) take advantage of two large Bureau of Labor Statistics surveys covering cohorts born around 1950 and cohorts born in the early 1960s. They describe mobility patterns for all of the children in these birth cohorts, making no distinction between children born into low- and higher-income families. As did a number of other intergenerational studies they review, they find considerable decreases in intergenerational mobility between their two cohorts. They also show that declining mobility can be attributed, in part, to increasing returns to education beginning in the late 1970s, a factor that drives up mobility rates for middle- and upper-middle-income children relative to low-income children, as well as to the increasing prevalence of single-parent families, which leads to more persistent intergenerational disadvantage among lower-income children.
As described in Appendix C: Chapter 2, Chetty et al. (2017) take a different approach that enables them to describe mobility patterns for birth cohorts going back to 1940. Their data provide answers to a simple question: How many children born in a given year (e.g., 1940, 1970) will grow up to enjoy a family income that exceeds that of their parents? To adjust for the fact that family incomes tend to grow with time, both parent and child household incomes are measured when earners are around age 30. Figure 2-10 shows their results for birth cohorts every 10 years, beginning
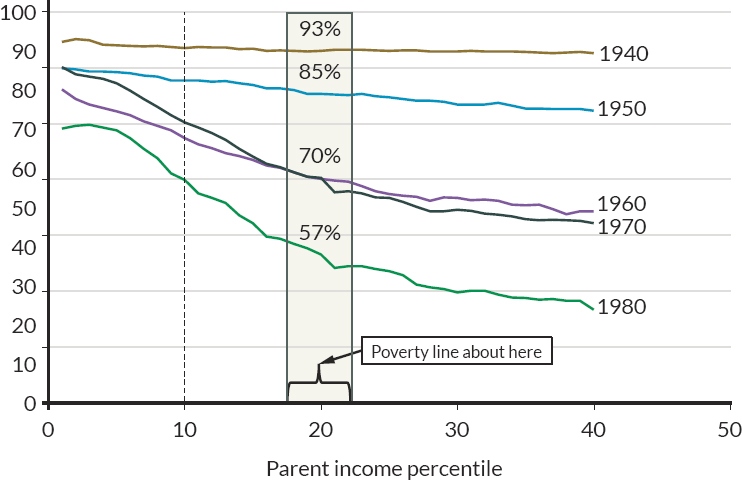
NOTES: This figure shows the share of children earning more than their parents, by child birth cohort and parental income percentile. This measure is calculated using children’s and parents’ marginal income distributions estimated using the Current Population Survey and decennial U.S. Census for the 1940–1984 birth cohorts, and a rank-rank copula estimated using tax records for the 1980–1982 birth cohorts, which is then applied to all cohorts from 1940 to 1984. See Appendix C: Chapter 2 for more details.
SOURCE: Data from Chetty et al. (2017).
in 1940. It further breaks down the chances of upward mobility separately by parental income percentile.7
Declining intergenerational mobility is quite apparent in the figure. Among children born in 1940 to families at the 20th percentile of the income distribution, almost all (93%) were found to have higher incomes in adulthood than their parents did. This fraction drops steadily in later cohorts; for the 1980 birth cohort, it is estimated to be only slightly more
___________________
7 Because AGI and the SPM are not perfectly aligned, lower-income parental income percentiles contain a mix of households above and below the poverty line. At the 20th percentile of AGI, for the years we consider, the average SPM poverty rate was 29.1%, meaning that roughly 3 out of 10 households were living in poverty. For the same years, at the 10th percentile of AGI, the average SPM poverty rate was 68.3%.
than half (57%).8 At the 10th percentile there is a similar decline across birth cohorts, although among this group the share of children born in 1980 who went on to have higher incomes in adulthood than their parents is substantially higher, at roughly 70%. Similar patterns of decline are observed in other industrialized countries for children born in the second half of the 20th century (Berman, 2022).
Seeking an explanation for the trends, Chetty et al. (2017) estimate what the trends would have been in a “higher growth” scenario in which the economy had grown as fast in recent decades as in past decades, and a “more broadly shared growth” scenario in which the benefits of the growth that did occur were equally shared across the income distribution. They find that both conditions matter. Higher growth would have reduced the decline in absolute mobility by about a third, while more broadly shared growth would have reduced the decline in absolute mobility by about two-thirds of what actually occurred. In this sense, changes in inequality—particularly the relative stagnation of wages at the bottom of the income distribution in the United States over the past 40 years—are central to understanding the decline of absolute upward mobility.
INTERGENERATIONAL MOBILITY IN THE UNITED STATES VERSUS OTHER COUNTRIES
We conclude our portrait with an international comparison. Do U.S. children have an easier or more difficult time surpassing their parents’ economic fortunes than children in other countries? More specifically, given that the Chetty et al. (2017) study, described above, finds that about half of U.S. children born in 1980 do better than their parents, what are the counterpart fractions in other countries?
Studies based on income comparisons between parents and children have found that the U.S. mobility rate of 50% is similar to that of Canada (Ostrovsky, 2017), lower than Germany’s 70% rate (Bönke et al., 2019; Stockhausen, 2018), and considerably smaller than Sweden’s 77% rate (Liss et al., 2019). A recent and more comprehensive study (Manduca et al., 2020) found quite high mobility across most Scandinavian countries and in the United Kingdom and confirmed the lower rates in the United States and Canada.
___________________
8 Although the pattern of declining mobility is clear in the Chetty et al. (2017) analysis, the exact numbers are less certain. A key technical question is how to adjust for cost-of-living differences, a contentious issue among economists. Chetty et al. (2020) show that alternative inflation measures can generate estimates of the overall fraction of, for example, children born in 1980 who are doing better than their parents that range from around 50% to a little over 70%.
Conclusion 2-5: After declining over the past 75 years, the fraction of children doing better than their parents is now lower in the United States than in most other industrialized countries. The most likely cause is that gains from economic growth have been disproportionately enjoyed by higher-income families, which has made it even more difficult for those at the bottom rungs of the income distribution to work their way up.
This page intentionally left blank.


