
3
Racial Disparities in Intergenerational Poverty
While progress toward socioeconomic parity has occurred between White people and Black and Native American people in some domains, such as in high school graduation rates, residential integration, and poverty rates, in other domains gaps have been persistent or even widened. And despite whatever progress has been made, the previous chapter documents stark differences in intergenerational mobility for Black American and Native American children relative to other groups, even for children born between 1978 and 1983—more than a decade after the civil rights legislation of the mid-1960s. Chapter 2 provides two striking examples:
- Much higher fractions of low-income Black (37%) and Native American (46%) children are also low income in adulthood, as compared with low-income White children (29%).
- Both Black and Native American children with middle-class (50th rung) family incomes in childhood attain lower rungs of economic status in adulthood than White children who were low-income (10th rung) in childhood.
This chapter examines the histories, practices, and contexts that limit the intergenerational mobility of both Black and Native American children. These patterns are also gendered, as is discussed further in Appendix C: Chapter 3. The evidence presented in this chapter points to historical and contemporary racism as a driving factor in intergenerational economic outcomes. For example, in comparison with other advanced countries, the United States has a relatively weak social safety net, which limits the
resources available for reducing intergenerational poverty. This weak welfare state is due in part to greater racial polarization in the United States and racist stereotypes of non-White people (Alesina et al., 2001; Fox, 2012). Many mechanisms of structural racism can be found in an array of institutional arrangements and public policy choices of the past and present (e.g., Baker, 2022), although the magnitude of the effects of such choices is unknown. Because racial disparities in intergenerational poverty were, in part, a product of past policy choices, future policy choices may help to reduce current and future disparities.
DEFINING DISPARITY, INEQUALITY, DISCRIMINATION, AND STRUCTURAL RACISM
Because this chapter discusses disparities and inequalities among racialized groups, it is vital to clarify what is meant by “racial inequality,” “racial disparity,” “racial discrimination,” and “structural racism.” Box 3-1 provides a list of brief definitions of these terms, and Appendix C: Chapter 3 offers a more in-depth discussion. It is also important to note that race can interact with gender, sexual orientation, religion, socioeconomic status, and disability in ways that compound inequality (Crenshaw et al., 2015; Harris, 2000; Nanda, 2019a).
HISTORICAL ROOTS OF RACIAL DISPARITIES IN INTERGENERATIONAL MOBILITY
To elaborate on structural racism and its link to intergenerational poverty, the persistent racial and ethnic disparities in upward mobility that are documented in this report can be better understood when placed in historical context. The report focuses on the historical experiences of Native Americans and Black Americans, given the persistence of intergenerational poverty in these populations (see Chapter 2). Though other racial and ethnic minorities in the United States have been impacted by structural racism, the duration, depth, and breadth of anti-Black and anti-Native racism are distinct.
Native Americans and Black Americans stand out as groups subjected to centuries of structural racism rooted in beliefs about White supremacy. Among the most severe forms of historical structural racism that set Black and Native Americans on a course of socioeconomic disadvantage are (a) forced migration and land theft; (b) chattel slavery and labor exploitation (Kiernan, 2007; Saito, 2020); and (c) forced assimilation and legalized racial discrimination imposed by racially oppressive institutions. While land theft is paramount for Native American people and slavery for Black people, it is important to note that Native American people were also enslaved
(Johnson, 2017; Reséndez, 2016; Trafzer & Hyer, 1999), and Black people have experienced both historical and contemporary theft (Atuahene & Berry, 2018; Immergluck et al., 2020; McMillan & Chakraborty, 2016; T. Mitchell, 2005). These primary histories and their long-term effects are discussed in depth in Appendix C: Chapter 3.
These forms of structural racism were means of economic exploitation that enriched White individuals and deprived generations of Black and Native Americans of economic assets, including income, wealth, and land ownership, as well as the correlated human capital, such as educational attainment and occupational skills, that are necessary for upward mobility and that they otherwise stood to gain (Desmond, 2021; Dubois, 1998). Native and Black Americans experience myriad other forms of theft, extraction, loss, and appropriation, both historically and in the present, from paying higher property taxes for similar public goods (Avenancio-León & Howard, 2022), to bearing a greater parking ticket burden (Brazil, 2020), to being the revenue-generating “mascot” for sports teams (Black, 2002; Fryberg et al., 2008). Whether historical or contemporary, the disproportionate rates of intergenerational poverty among Black people and Native Americans are due in part to their disproportionate subjection to impoverishment.
CONTEMPORARY DRIVERS OF RACIAL DISPARITY IN INTERGENERATIONAL POVERTY
The historical context described above and in Appendix C: Chapter 3 sets the stage for understanding contemporary intergenerational poverty in the United States and its relationship to Black and Native American communities. Black and Native American children and families face more challenging conditions rooted in a racialized distribution of resources and social processes of racial exclusion in the United States that have compounded over time. Today those processes manifest as inadequate access to health care and to well-funded, quality schools; greater exposure to crime, violence, and harm from the criminal justice system; housing insecurity and exposure to toxins; and lower family incomes, wealth, and neighborhood resources (National Academies, 2018).
Given this history and contemporary context, the question of how to address racial inequality thus looms large. The social determinants of health framework, which is widely accepted in the scientific literature today, is an instructive example. This framework is used to understand racial inequalities in the unequal risk of poor health outcomes, the lack of access to health care, and differential treatment by health care providers. Adult health is influenced by an individual’s health-related behaviors and choices, but the factors that influence the behaviors and choices of Black and Native American individuals include the experiences of historical violence,
BOX 3-1
Key Terms and Concepts
Racial Disparities
Racial disparities are group-based average differences in outcomes. Chapter 2 and the opening section of this chapter documented the disparities between White people and Black and Native American people in rates of intergenerational economic mobility. Racial disparities are also evident in the key life experiences that are relevant for upward mobility, such as exposure to environmental toxins, residence in high-poverty neighborhoods, and attendance at schools with college-preparatory curricula. The cumulative and intersecting nature of these disparate exposures over the life course partly explains higher rates of intergenerational poverty. The word “gaps” is often used interchangeably with disparities.
Racial Inequality
Racial inequality refers to group-based differential treatment or access to valued resources that are rooted in law and public policy as well as in individual behavior and institutional practices National Academies, 2022b, pp. 1–7). Racial inequalities can result from multiple sources, including both historic and contemporary oppression, structural racism, and prejudice, whether intended or not. Racial inequality is a more comprehensive term than racial disparities because it recognizes that disparities occur across multiple domains and multiple outcomes. While the term may sometimes be used as synonymous with racial disparities to mean group-based differences in a particular domain or outcome, it is more often used to describe differences at a more macro level. For example, there might be racial disparities in access to preschool, and racial inequality in the educational system.
Racial Discrimination
An important part of racial discrimination is differential treatment on the basis of race that disadvantages a racial group (National Research Council, 2004, p. 4). This type of discrimination can reflect either animus toward specific racial groups, which economists call “taste-based” discrimination, or else what some social scientists call
oppression, and marginalization (National Academies, 2017d, 2021). Public health researchers understand that to varying degrees, health outcomes for these groups are a product of a racially stratified society rooted in historical and material conditions that remain salient in the health care system itself (Jones, 2002). Improving health outcomes for Black and Native American individuals means fixing the constituent pieces of an unequal society.
A logic similar to that of the social determinants of health framework pertains to intergenerational poverty. Identifying the structural mechanisms that drive racial inequality can help ensure that the policy or practice solutions are designed at an appropriate institutional or systemic level. To that end, this section describes the systems and social drivers—education, health,
statistical discrimination, a situation in which the discriminator possesses too little information about the characteristics of an individual and instead makes assumptions about the individual based on group-based stereotypes regarding, for example, skills or criminal behavior. Both racial animus–based and stereotype-based discrimination are illegal in the United States. Recent labor market evidence (e.g., Cordoba et al., 2021; Hurst et al., 2021) suggests there has been a decline in racial animus but growing statistical discrimination, although audit studies show no decline in employment discrimination since at least 1989 (Quillian et al., 2017). Regardless of its origin and nature, discrimination is relevant for intergenerational poverty because it excludes Black people and Native Americans from access to contexts that enhance opportunities or exposes them to situations that reduce opportunity.
Structural Racism
Structural racism refers to a system in which public policies, institutional practices, cultural representations, and other systems work in often reinforcing ways to maintain or compound racial inequalities (National Academies, 2022b, pp. 1–7). Thus, structural racism goes beyond mere patterns (disparities) or treatment (discrimination) to capture how rules, routines, and assumptions of U.S. law, institutions, norms, ideologies, policies, and technologies create disadvantages and advantages for people and groups based on how they are racialized in society. Structural racism can be historical or contemporary. Federal acquiescence to local segregationist laws and practices, which resulted in the near exclusion of Black World War II veterans from the benefits of the GI Bill, is an example of historical structural racism (Delmont, 2022). Historical structural racism affects the stocks of assets, skills, exposures, and opportunities—e.g., college degrees and home equity—that compound with families over generations into the present. A contemporary illustration of structural racism is how ostensibly race-neutral artificial intelligence algorithms may incorporate racial biases and inequalities from the real world to produce racially disparate outcomes when applied (Benjamin, 2019; Noble, 2018; Obermeyer et al., 2019). The qualities of being “built in” and often obscured are hallmarks of structural racism.
housing and neighborhood resources, child welfare, criminal justice, and income and employment—that perpetuate racial disparities in intergenerational poverty today.
Throughout each section, we discuss the patterns and experiences for both Black and Native American individuals when possible. However, much of the research on racial disparities uses a Black-White paradigm. Native American people are often left out of reported data, given their small overall population numbers, and even when there are available data they are often left out of analyses. Chapter 11 on future priorities for research and data collection discusses this issue in further detail.
Education
While educational attainment and skills have dramatically improved over time among Black and Native American children, and while racial disparities have declined in magnitude in some areas, disparities in access to educational opportunity are still deep and enduring characteristics of the American education system. Education can play a powerful role in undoing intergenerational poverty, as it promotes the development of the knowledge and skills that will allow children to be successful in the labor market, but the progress here remains far too limited. (See Chapter 4.)
For Native Americans, for example, there is a history of the U.S. government using education as a tool for colonization and forced assimilation. Throughout much of the 20th century, in the name of education, Native children were taken from their families, placed in federally controlled boarding schools, and punished for “speaking or acting Indian” (Adams, 1995). As a result, for generations, getting an education has been a metaphor for assimilation or “becoming White” (Deloria, 1999; Deyhle & Swisher, 1997; Elliott-Groves & Fryberg, 2019; Ogbu & Davis, 2003). Although most tribal nations and Native individuals today recognize that education is essential for socioeconomic success, the path toward attaining an education is replete with structural and social barriers.
When a Native American child enters kindergarten, compared with other American children, they are often behind in reading, mathematics, and fine motor skills (Snyder & Dillow, 2011). This result is largely due to the lack of early childhood education and the preponderance of economic and social struggles in the home. Native American children have lower preschool enrollment rates (44%) than White children (49%).1 Disparities continue throughout the life course: Compared with other ethnic groups, Native students ages 3–17 are more likely to be identified as having a learning disability and as needing special education intervention services (U.S. Census Bureau, 2012). Native students have the highest dropout rates of any ethnic group in the United States. Recent statistics from the Bureau of Indian Affairs show that 29% to 36% of all Native American students drop out of school, mostly between the 7th and 12th grades. In the 12 states with the largest populations of Native American students, these numbers are even higher, with less than 50% of Native American students graduating from high school, compared with 71.4% of all students in those states (Faircloth & Tippeconic, 2010). These high school graduation rates are the lowest among American students.
___________________
1 See https://www.diversitydatakids.org/research-library/data-visualization/neighborhood-preschool-enrollment-patterns-raceethnicity
The same patterns apply to college completion. The 6-year graduation rate for Native American students from 4-year degree-granting institutions is 39%, compared with 74% for Asian American students and 64% for White students (National Center for Education Statistics, 2019). These outcomes do not constitute a snapshot of one generation of Native students but rather reflect a history of distrust stemming, in large part, from the physical and social abuses experienced during the boarding school era (late 1800s to the mid-1900s) that constitute an intergenerational trauma passed down from one generation to the next (Adams, 1995; A. Smith, 2007) and the lack of cultural fit for Native American students in mainstream educational institutions (Fryberg & Markus, 2007; Fryberg et al., 2013, 2018).
Native American students who attend schools in which Natives are more than one-quarter of total enrollment reported more serious problems with absenteeism, tardiness, low family involvement, and low expectations than other schools (Devoe & Darling-Churchill, 2008). One potential reason for these differences is the landscape of social representation in the schools, that is, the ideas and images available. Shear et al. (2015, Table 3) found that 87% of state-level U.S. history standards portray Native people in pre-1900 contexts. In high Native contexts, this bias in the curriculum may be more salient (Fryberg & Leavitt, 2014; Lomawaima & McCarty, 2006). Beyond the curriculum, Native American students rarely see members of their group represented as primary or secondary teachers (0.5% are Native American), as college students (1% are Native American), or as professors (0.5% are Native American; Coopersmith, 2009; Snyder et al., 2009). The lack of self-relevant social representations in education subtly conveys to Native students that they do not belong and cannot be successful in these educational contexts (Fryberg & Eason, 2017; Fryberg & Townsend, 2008; Gay & Howard, 2000; Ladson-Billings, 1995).
Similar disparities in treatment and outcomes are evident for Black children. As described further in Chapter 4, Black students entering kindergarten are about half a year behind their White counterparts in early math achievement, with gaps apparent in kindergarten-entry literacy as well. These differences in learning continue throughout the educational process and through school completion (Kuhfeld et al., 2020; Paschall et al., 2018; Reardon, 2021). One explanation is that teachers’ expectations for their students differ based on students’ race and ethnicity. Lower expectations have harmful effects on actual achievement (Jussim & Harber, 2005), and White teachers have lower expectations of Black students than they do of White students (Gershenson et al., 2016; Papageorge et al., 2020).
Also meriting attention is access to high-quality, well-funded schools and the school environment itself. After years of progress toward racial desegregation, on some measures pre-K-to-12 schools have become increasingly segregated by class and race (An & Gamoran, 2009; Reardon
& Owens, 2014; Reardon et al., 2021). Most school districts reflect the demographic and socioeconomic compositions of their neighborhoods, and Black and Native American children are more likely than White children to live in high-poverty areas (National Academies, 2019a). School assignment policies that send all (or many) children from a high-poverty neighborhood or community to the same school create schools with high concentrations of children living in poverty. Schools serving children from low-income families tend to have fewer material resources (e.g., books, libraries, classrooms), fewer course offerings, and fewer experienced teachers. The educational opportunities available to students attending these schools are not of the same quality as those in schools in more affluent areas (Monarrez & Chien, 2021). These trends pose increasing challenges for school systems that serve large numbers of non-White students, which all too often are the same school systems that have fewer economic resources in the first place.
School discipline is relevant as well. Black and Native American students are disproportionately subjected to harsh in-school discipline, which threatens students’ well-being and learning (Beland & Kim, 2016; Gregory et al., 2017; Nowicki, 2018). Disparities in punishment appear at the very earliest ages. In preschool, Black and Native American toddlers are suspended at rates 2.5 and 1.5 times higher, respectively, than their representation in the preschool population, and Black preschoolers are overrepresented among expelled children by a factor of 2 (U.S. Department of Education Office for Civil Rights, 2021a). In K-12 settings, Black and Native American youth are also at higher risk of being referred to law enforcement and being arrested at school (Brown, 2014; U.S Department of Education Office for Civil Rights, 2021b).
Studies show that such disparities are not always due to children’s behavior but rather are sometimes due to between-school differences in punishment cultures and to the differential labeling of behaviors of Black and White children and ensuing punishments (Gilliam et al., 2016; Goff et al., 2014; Okonofua & Eberhardt, 2015; Owens & McLanahan, 2020; Sabol et al., 2022; Skiba et al., 2014), and higher rates of racial bias at the community level (Riddle & Sinclair, 2019). For example, Okonofua and Eberhardt (2015) found that when presented with identical descriptions of student behavior, teachers viewed two minimal infractions as more troubling and deserving of harsher punishment when committed by a Black student than by a White student. At the same time, students in classrooms with higher shares of Black, Native American, and Latino peers report a greater likelihood that classroom misbehavior slows down learning and experience greater pressure to misbehave (Ferguson, 2016). Okonofua et al. (2016) hypothesize that there is a negatively reinforcing causal loop from disproportionate punishment to poor student behavior, whereby racially
stigmatized students experience a lack of belonging, delinquent labeling, and perceived unfair treatment, which increases their misbehavior. Field-tested randomized controlled experiments show that increasing teachers’ use of “empathic discipline” (Okonofua et al., 2016) and improving Black students’ identity self-affirmations (Borman et al., 2022) and sense of belonging, inclusion, and growth (Goyer et al., 2019) all decrease exclusionary discipline against Black students.
Exclusionary school discipline leads to lost learning days (Losen & Martinez, 2020). The U.S. Department of Education reports that students lost more than 11 million days of school owing to out-of-school suspensions in 2017–2018, with this burden falling disproportionately on Black and Native American students (and also falling disproportionately on boys). The Civil Rights Project at the University of California, Los Angeles reports (using 2015–2016 data) that “Black students lost 103 days per 100 students enrolled, which is 82 more than the 21 days their White peers lost due to out-of-school suspensions.” Native American students lost 54 days per 100 students enrolled (Losen & Martinez, 2020)
Correlational and quasi-experimental studies show that school discipline is negatively related to standardized test scores and high school and college graduation and is positively correlated with involvement in the criminal legal system (Bacher-Hicks et al., 2019; Chu & Ready, 2018; Mittleman, 2018; Rose et al., 2022; Rosenbaum, 2020; Wolf & Kupchik, 2017). Raffaele Mendez (2003) found that unequal treatment based on race and other characteristics results in disparate outcomes for children, as out-of-school suspensions are highly predictive of future involvement with the criminal justice system and reduced educational achievement. Using integrated administrative data from the state of Oregon linking school discipline with adult outcomes, Davison et al. (2022) found that:
approximately 30% of the gap between Black and White young adult criminal justice outcomes, SNAP participation, and bachelor’s degree (BA) receipt can be traced back to inequalities in school discipline, and that just accounting for out-of-school suspensions for insubordination reduces the Black-White disparity by approximately 10% (Davison et al., 2022, p. 233).
In sum, large gaps in school achievement and completed schooling persist across racial and ethnic subgroups, posing a key challenge for policy makers seeking to reduce intergenerational poverty and pointing to the importance of education-related interventions, which will be discussed in Chapter 4.
Health
Child physical and mental health is an important driver of intergenerational mobility, as will be examined in Chapter 5. Children born to mothers with lower socioeconomic status in the United States are born in worse health than other children, and this disparity increases as they age (Case et al., 2002), culminating in a strong relationship between childhood poverty and adult health as well as adult income given the link between health and income. Inequalities in health derive largely from unequal risk of poor health outcomes (through environmental influences on health and nutrition and food insecurity), lack of access to health care, and differential treatment by health care providers. For example, a study of the desegregation of hospitals after the 1964 Civil Rights Act demonstrated sharp declines in Black infant mortality, demonstrating how the lack of appropriate maternity care to Black women had resulted in the deaths of Black newborns (Almond et al., 2006). Using a social determinants of health framework, public health researchers hypothesize that these inequalities are all, to varying degrees, outcomes of a racially stratified society and are rooted in historical and material conditions that remain salient in the health care system itself (Jones, 2002).
Historically, science and medicine have reinforced White racial superiority to justify and perpetuate disparate treatment of individuals. Examples of racism in science and medicine that have engendered Black people’s mistrust of the medical system include the eugenics movement of the 1900s, which resulted in the forced sterilization of Black women; and the use of tissue from Henrietta Lacks (a Black woman with cervical cancer) to create cell lines for scientific research without her permission. The effects of the “Tuskegee Study of Untreated Syphilis in the Negro Black Male,” in which Black men were deliberately not treated for syphilis despite effective available treatment in order to study the natural course of the disease in Black men is perhaps most well-documented. Alsan and Wanamaker (2018) compared older Black men to other demographic groups, before and after the information about the Tuskegee study was revealed, and in varying proximity to the Tuskegee study’s victims. They found that the public disclosure of the study in 1972 was associated with increases in medical mistrust and mortality and decreases in both outpatient and inpatient physician interactions for older Black men, with the largest effects found for Black men living in closest geographic proximity to Tuskegee. They estimate that life expectancy fell for Black men by up to 1.5 years in response to the disclosure, accounting for approximately 35% of the 1980 life expectancy gap between Black and White men (Alsan & Wanamaker, 2018).
Implicit bias has also been shown to be prevalent in health care (FitzGerald & Hurst, 2017; Hall et al., 2015) and to result in disparate
outcomes among individuals of different races. For example, some research suggests that Black women are less likely than their White counterparts to receive an epidural during childbirth because of providers’ beliefs about the relationship between race and pain tolerance, as well as poor communication in racially discordant provider-patient relationships (National Academies, 2021). Research has also shown that providers perceive Black individuals as less likely than White individuals to adhere to medical advice, a perception that contributes to poor communication and care (Laws et al., 2014; Van Ryn & Burke, 2000). These experiences of implicit bias can lead to mistrust and avoidance of the system, thus exacerbating health disparities (Chaturvedi & Gabriel, 2020).
Lack of access to health care also affects the health of Black and Native American people. Native Americans experience very high uninsured rates; the Centers for Disease Control and Prevention reports that 28.6% of Native Americans under age 65 are uninsured (Assistant Secretary for Planning and Evaluation, 2023). Although the Indian Health Service provides medical care, funding is adequate to meet the needs of only about half of those eligible for services, and staff shortages are persistent (Chapter 5). Black individuals under age 65 have an uninsurance rate (11.5%) that is roughly 60% higher than the uninsurance rate for White individuals (7.5%; Artiga et al., 2020). A landmark study demonstrated that even after accounting for socioeconomic factors, race and ethnicity remained significant predictors in access to and the quality of health care received (Institute of Medicine, 2003).
Racism impacts health through environmental influences, including greater exposure to and experiences of trauma and chronic stress (Giscombé & Lobel, 2005; Nuru-Jeter et al., 2009), environmental toxins, and violence. Stress, for example, has been associated with poor health in multiple arenas, including mental health (Paradies et al., 2015), sleep (Slopen et al., 2016), obesity (Bernardo et al., 2017), hypertension (Dolezsar et al., 2014), and cardiovascular disease (Lewis et al., 2014). In addition to the actual experience of discrimination, just the threat of discrimination—and its associated hypervigilance—can harm a person’s health. Chronic exposure to racism and discrimination leads to dysregulation of stress hormones and to epigenetic modifications, in which environmental influences regulate gene expression without changing genetic sequences (Seeman & Crimmins, 2001; Seeman et al., 2014). It also leads to “weathering,” that is, premature aging at the cellular level (Geronimus et al., 2006). These biological changes are associated with chronic disease in childhood, such as asthma and obesity, and poor cardiovascular outcomes in adulthood, which affect future economic prospects (McEwen & Seeman, 1999; McEwen & Stellar 1993; Shonkoff et al., 2009).
In sum, Black and Native American children continue to experience worse health than their White counterparts, and drivers of worse health among Black and Native American children include those related to access to health care, environmental influences including pollution and community violence, and nutrition, as well as differential treatment by health care providers. Improving the health of Black and Native American children living in low-income households is therefore a key lever for reducing intergenerational poverty, as improvements in child health have been shown to improve economic status in adulthood (see Chapter 5).
Wages and Employment
The persistence of economic immobility has defined Black Americans’ relationship to labor and the labor market throughout much of U.S. history (Collins & Wanamaker, 2022; also see Appendix C: Chapter 3, where this issue is discussed in detail). Black people’s relationship to the labor market can be divided into at least three distinct periods: (1) slavery to emancipation, (2) emancipation to the Civil Rights Act of 1964, and (3) post-Civil Rights Act to the present. In both the first and second periods, racist and discriminatory employment practices were legally sanctioned, protected, or ignored.
In the third (contemporary) period, explicit discrimination based on race and ethnicity is illegal. Yet despite declines in Black-White wage and employment gaps, significant disparities remain (Bayer & Charles, 2018). Black workers receive lower average earnings, face less predictable work hours, experience less overall employment stability, and reside disproportionately in states where the relatively low federal minimum wage is binding (Hardy & Logan, 2020). They also tend to be concentrated in low-skilled or disappearing occupations (Meschede et al., 2019; Smith, 2002), resulting in their overrepresentation among low-income populations (National Academies, 2019a).
One explanation of these disparate outcomes is racial discrimination in the labor market—affecting who gets an interview as well as who gets hired. Evidence from audit and correspondence studies indicates that White applicants are more likely than Black applicants with the same education and employment qualifications to receive employer call-backs (Bertrand & Mullainathan, 2004; Neumark, 2012; Pager, 2003) and job offers (Quillian et al., 2020b). These employment patterns are present in entry-level positions (Agan & Starr, 2018; Pager, 2008), among the college-educated (Gaddis, 2015), and among those with advanced degrees (Reeves, 2014). Experimentally identified discrimination against Black applicants may be of either the taste (i.e., based on racial animus) or statistical kind, although Bertrand and Mullainathan (2004, p. 1010) note that both models “struggle to explain” their findings in full.
A weakness of this research is that audit studies cannot be used directly to measure the role of discrimination in generating observed outcome disparities in wages or employment rates. In an essay reviewing the field, Neumark (2018, p. 855) states that “very few [audit] studies have tried to capture wage outcomes, and none have done so convincingly.” Other studies, however, suggest that employment discrimination identified in audit studies translates into wage gaps (Lanning, 2013), as do higher levels of White racial prejudice in an area (Charles & Guryan, 2008). And in the related field of housing-discrimination audit studies, Christensen et al. (2021, p. 7) find that “differential treatment identified in the correspondence study predicts…the probability of a subsequent lease by a renter from the same [racial] group.” In other words, housing discrimination identified against Black auditors is related to a lower probability that a Black person ultimately lives in the audited housing unit. This study offers a model for research matching employment audits to hiring and wage outcomes for the same jobs.
Racial disparities in employment and earnings can also be attributed in part to gaps in educational attainment, achievement, and skills between Black and White Americans. As discussed in the previous section on education, such gaps are in part the result of unequal treatment and access in educational institutions. The relative contribution of cognitive and non-cognitive skills and education to the employment and wage gap is a topic of long-standing scholarly debate (Carneiro et al., 2005; Darity & Mason, 1998; Elder & Zhou, 2021; Neal & Johnson, 1996; Rodgers & Spriggs, 1996; Tomaskovic-Devey et al., 2005), and often depends on how the education controls are specified and the specific outcome of interest. For example, Thompson (2021, p. 20) reports that the “contribution of human capital to differences in the earnings of Black and white men grew steadily over the past 50 years,” whereas Cajner et al. (2017) find that differences in observable characteristics have consistently explained very little of the Black-White employment gap over a similar time period, and Coleman (2003) reports a wider wage gap controlling for skill. Importantly, achievement and education gaps now favor women relative to men in all racial groups (Reeves, 2022) and may help explain why intergenerational poverty is more pronounced for Black men than for Black women when measured by individual earnings. Other important considerations such as union density and wage structures are also important for explaining racial earnings gaps (Bayer & Charles, 2018). As is discussed further in Chapter 4, improving education and skills for low-income Black and Native American children is likely to increase their adult wages and decrease their intergenerational poverty.
Labor market segmentation may also explain racial disparities in employment. Black workers are more likely to be employed in less stable jobs,
with less regular work, and with more precarious work hours. For instance, while Black people make up 12.1% of the labor force, they make up 25.9% of temporary workers earning 40% less for the same jobs as permanent workers in the same position (Wilson, 2020). Racialized wage gaps also manifest along gender lines. In 2017, the median annual earnings for full-time Black women workers was 21% lower than for White women and 39% lower than for White men, reflecting the over-representation of Black women in low-wage service and sub-minimum wage jobs (Banks, 2019).
Black workers tend to fare worse in the labor market, independent of macroeconomic conditions, though they suffer more during downturns and benefit relatively more during tight labor markets. During the economy recovery following the COVID-19 pandemic, unemployment rates have declined, yet racial disparities remain. As of July 2022, the unemployment rate of Black workers was 6.0%, compared with 3.9% for Latino workers and 3.1% for White workers (U.S. Bureau of Labor Statistics [BLS], 2021). In April 2020, when the COVID-19 pandemic raged, the unemployment rate of Black Americans reached 16.6%, compared with 12.8% for White Americans (Fairlie et al., 2021). More than 6 in 10 Black adults with a 2019 household income of less than $35,000 reported losing labor income in 2020 (Sanchez Cumming & Kopparam, 2021). In late 2009, during the peak of the Great Recession (2007–2009), unemployment for Black workers was 14.8%, significantly higher than the White unemployment rate of 8.5% (BLS, 2010).
Differences in labor force participation rates—particularly among men (Binder & Bound, 2019; Eberstadt, 2016; Thompson, 2021)—also contribute to racial disparities in earnings and household income. In 2021, according to data on adult men from the BLS (2023), Latino men (75.4%) were more likely to participate in the labor force than men of other races, and Black men (63.5%) were the least likely, with White men (67.9%) and Native American men (66.2%) between the two. In contrast, among adult women, Black women (58.8%) were more likely to participate in the labor force than were Latina women (55.8%), White women (55.4%), and Native American women (55%). The BLS data overstate labor force participation among Black men because they do not include incarcerated populations (Pettit, 2014) and there is evidence of underreporting of those not incarcerated (Holzer, 2021). Measured progress between White men and Black men in relative earnings becomes much more limited when the lower labor force of the latter, especially among the incarcerated, is taken into account (Bayer & Charles, 2018).
Important racial disparities can be found not only among workers but also among business owners and entrepreneurs. Black-owned businesses comprise about 9% of privately owned businesses in the United States and are overwhelmingly newly founded or started (Fairlie & Robb,
2010; M’Balou Camara et al., 2019). These businesses are denied loans at 2.5 times the rate of White-owned businesses (Cavalluzzo & Wolken, 2005). Black-White differences in loan denials are largest at the top end of the wealth distribution (Ards & Myers, 2001). In one study, only 56% of minority-owned businesses were approved for financing, compared with 73% of White-owned firms (de Zeeuw, 2019). In addition to loan denials, Black-owned firms are more likely to be charged higher interest rates despite clean credit histories and creditworthiness (Ards & Myers, 2001; Blanchflower et al., 2003). Disparities in the source and amount of start-up capital may mean the difference between success or failure.
In sum, disparities in both employment and earnings remain between White individuals and Black individuals. Given that persistently low family incomes and employment are an important driver of intergenerational poverty, policies that increase parental incomes and employment may increase intergenerational mobility (and will be discussed in Chapter 6).
Housing and Neighborhood Environments
Housing represents a bundle of possible inputs—such as access to good schools, parks, safety, doctors and health care, and commercial offerings—that affect family well-being and can promote or hinder mobility out of poverty. Despite a reduction in Black-White residential segregation in recent decades (Logan & Stults, 2022), Black Americans have experienced systematic exclusion from places that promote upward mobility and have instead been concentrated in places with various forms of toxicity. Additionally, the rise in segregation by socioeconomic status (Reardon & Bischoff, 2011) means that Black and Native American families living below the poverty line suffer a double blow, which limits the upward mobility of their children over time.
After the Great Depression, the federal government came to play a greater role in housing policy, replicating and intensifying the discrimination already present in the private housing market (see Appendix C: Chapter 3). Government programs were a source of wealth accumulation and upward mobility for White families, while excluding Black families from homeownership and its wealth-generating potential (Katznelson, 2005; Radford, 2008; Taylor, 2019). The Federal Housing Administration and the Veterans Administration insured approximately half of all mortgages for single-family homes and small buildings by the 1950s (Fishback et al., 2022, p. 25), yet “between 1945 and 1959, less than two percent of all federally insured home loans went to African Americans” (Hanchett, 2000, p. 166). To insure private mortgages, the federal government developed standardized appraisal systems that regarded Black neighborhoods as high-risk (Fishback et al., 2022; Stuart, 2003). The rating system color-coded
sections of cities in green, blue, yellow, and, for the lowest category, red. The term redlining refers to the systematic denial of mortgage loans based on these federal guidelines, which were steeped in racial, ethnic, and anti-urban biases (Jackson 1985; Rothstein, 2017, see Appendix C: Chapter 3). Exclusion from mortgage markets reduced housing wealth in redlined areas (Xu, 2022), and exposed Black neighborhoods to predatory private lenders like contract sellers, who siphoned off the income and wealth of Black individuals (Dubois Cook Center, 2019; Satter, 2009). Family wealth—or its lack—is an important determinant of children’s outcomes (Conley, 1999; Moulton et al., 2021; Orr, 2003; Pfeffer, 2011), and thus discrimination against Black people in the housing market reverberates across generations (Oliver & Shapiro, 1997; Pfeffer & Killewald, 2018).
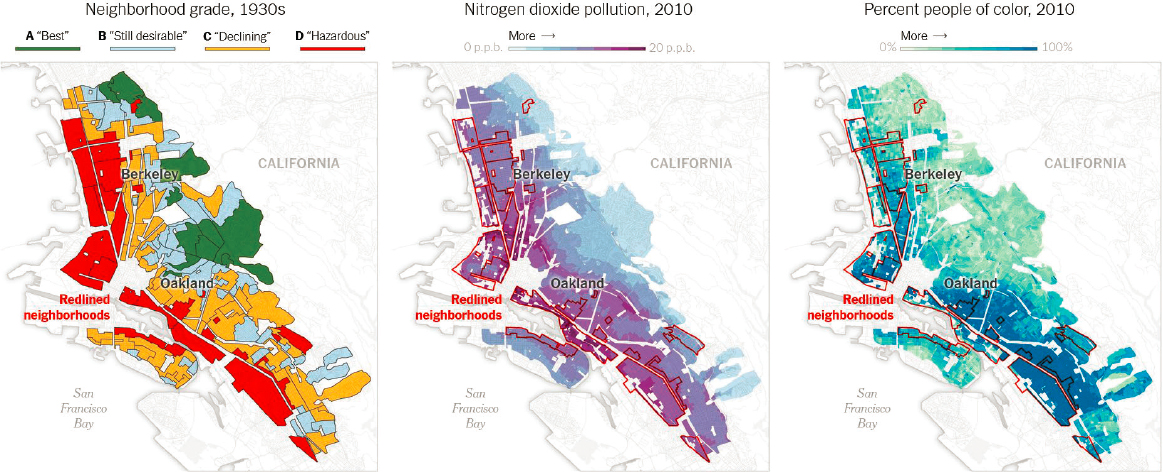
Research shows the long arm of redlining reaching into the present. Aaronson et al. (2021b) compare areas along actual and potential Home Owners’ Loan Corporation (HOLC) boundaries and show that the HOLC appraisal ratings in the early 20th century impact the long-term socioeconomic outcomes of children born in the 1970s and 80s. In particular, children in the lower-graded areas were in lower household-income rankings at age 29 and were less likely than other children to move toward the top of the income distribution as adults. Today, historically redlined neighborhoods have lower homeownership rates and lower home values (Aaronson et al., 2021a,b), higher poverty rates, lower life expectancy, higher rates of chronic disease (National Community Reinvestment Coalition, 2020), higher rates of preterm births (Krieger et al., 2020), less health-promoting tree cover and green space (Hoffman et al., 2020; Nardone et al., 2021; Schinasi et al., 2022), and higher incidence of emergency room visits for asthma (Nardone et al., 2020). Lane et al. (2022) find that historically redlined areas are disproportionately occupied by non-White residents today and have greater exposure to pollution. Figure 3-1 shows these patterns clearly for the city of Oakland, California. Exposure to pollution has negative effects on children’s health and long-term outcomes, as discussed above and in Chapter 5. This is an area that has been positively impacted by policy, namely the Clean Air Act of 1970, which has reduced racial disparities in such exposure (Currie, 2023).
Redlining and the association of Black residents with risk did not end in the 1930s. Appraisal manuals explicitly called for lower appraised values in racially mixed neighborhoods up until at least 1977 (Kuebler, 2012; Yinger, 1995), and private appraisal practices continue to disadvantage Black home buyers today (Freddie Mac, 2022; Howell & Korver-Glenn, 2021; Perry et al., 2018). In the decades leading up to the housing crisis of 2007, Black neighborhoods and households were disproportionately targeted by lenders and banks to receive subprime loans, no matter their socioeconomic status and despite other indicators of creditworthiness (Bayer et al., 2018; Faber,
2013; Hwang et al., 2015; Institute on Race and Poverty, 2009; Massey et al., 2016; Rugh & Massey, 2010; Steil et al., 2018). Scholars have referred to these practices as “predatory inclusion” (Taylor, 2019).
Targeting Black neighborhoods for lower appraisals or subprime loans is possible in part because of enduring patterns of racial residential segregation. The causes of that segregation are manifold, including historical and contemporary “preferences,” racial steering and discrimination by real estate agents and landlords, White flight, and anti-Black prejudice (Boustan, 2010; Card et al., 2008; Charles, 2006; Christensen et al., 2021; Flage, 2018; Krysan & Crowder, 2017; Massey & Lundy, 2001; Rugh & Massey, 2014). While residential segregation between Black and White Americans has declined steadily since about 1970, it remains higher than for any other racial or ethnic group. Given current trends, Black-White residential segregation will not dip into what social scientists consider to be low levels until the year 2080 (Rugh & Massey, 2014, p. 213).
The most recent national audit study using matched pairs of house-seekers found declines in discrimination against Black people compared with previous decades, but it also found continued practices of racial steering of Black testers into neighborhoods with higher poverty rates, lower school test scores, higher rates of violent crime, and greater exposure to air toxins (Christensen & Timmins, 2022; Turner et al., 2013). Christensen et al. (2021) conducted the largest correspondence study of racial discrimination in the rental market to date. They found that apartment seekers with Black-identified names were 9.3% less likely than White renters to receive a response. Further, they show that greater housing market discrimination is correlated with greater residential segregation and with larger White-Black gaps in intergenerational income mobility. Likewise, Black boys who grow up in areas with less racial bias, as measured by Google searches for racial epithets and on-line implicit bias tests, have higher incomes in adulthood (Chetty et al., 2020). Past and current racial residential discrimination and segregation are correlated with lower rates of intergenerational mobility (Andrews et al., 2017; Chetty et al., 2014; Christensen et al., 2021; Derenoncourt, 2022).
Patterns of racial residential segregation increase Black people’s exposure to high poverty neighborhoods (Ananat, 2011; Christensen & Timmins, 2022; Massey & Denton, 1993; Quillian, 2012). Roughly 30% of Black and Native American children, compared with 4% of non-Hispanic White children, live in neighborhoods where 30% or more of the residents have incomes below the poverty line (Annie E. Casey Foundation, 2019a,b). Just as the intergenerational experience of poverty is higher among Black people, so is the intergenerational exposure to neighborhoods experiencing poverty (Sharkey, 2013). Growing up in high-poverty neighborhoods, and in counties with greater concentrated poverty and racial segregation, is correlated
with lower intergenerational mobility (Chetty & Hendren, 2015, 2018). As such it is a key policy lever, which will be described in greater detail in Chapter 8.
Crime, Victimization, and Criminal Justice
There is substantial contemporary evidence of racial disparities not only in the commission of violent crime and victimization but also across the criminal legal system in arrests, charging, convictions, sentencing, incarceration, and community supervision (Alesina & La Ferrara, 2014; Alexander, 2010; Arnold et al., 2018; Feigenberg & Miller, 2021; Franklin, 2013; Stewart et al., 2022; Weaver et al., 2019; for reviews and compilations of this research see Arya & Rolnick, 2008; Balko, 2020; Du, 2021; Hinton et al., 2018; Kurlychek & Johnson, 2019; National Academies, 2022b; National Research Council, 2014; Nielsen & Silverman, 2009; Redner-Vera & Wang, 2022). Black and Native American youth also experience disproportionate punishment in the juvenile justice system (Development Services Group, 2016; National Research Council, 2013; Rovner, 2016). An analysis of juvenile incarceration in 2019 shows that the rate of confinement for Black and Native American youth is higher than the rates of confinement for White, Latino, and Asian youth combined (Wang, 2021).
At the same time, community violence poses a significant risk to health and well-being for Black, Native American, and low-income communities, as is discussed in Chapter 9. Black and Native American youth are more likely to be homicide victims than White youth, but rates of other kinds of violent victimization are more comparable (Hullenaar & Ruback, 2020). Black and Native youth also witness more community-level violence (Kravitz-Wirtz et al., 2022; Office of Juvenile Justice and Delinquency Prevention, 2016). Data from the Federal Bureau of Investigation’s Uniform Crime Reports (Federal Bureau of Investigations, 2019) also show racial disparities in the commission of violent crime—particularly robberies and homicide. For instance, in 2019, Black people committed over half of reported homicides in which the race of the perpetrator was known, despite being just 13% of the U.S. population. Although some analysts have been critical of these data and suggest racial bias (e.g., Hinton, 2016), the National Crime Victimization Survey shows similar over-representation of Black assailants (Carson, 2021). Chapter 9 shows that reducing crime and exposure to violence are important strategies for reducing intergenerational poverty.
A recent National Academies committee was charged with understanding these racial disparities in criminal involvement and criminal justice processing. The resulting report concludes that “Racially inscribed inequalities, especially disadvantage, explain most of the dramatic differences in crime
across racialized areas. These same disadvantaged contexts also contribute to racial disparities in criminal justice contacts, further compounding inequality” (National Academies, 2022b, p. 137). In other words, racial disparities in criminal offending and criminal justice contact emerge within the broader histories of structural racism and racial inequality in the important domains of education, health, neighborhoods, and labor markets, which is documented in this chapter. As the aforementioned report argues: “Racial inequality can drive disparities in both crime and [criminal justice] system involvement; racial differences in criminal victimization, offending, and incarceration can further exacerbate racial inequality in socioeconomic life (National Academies, 2022b, p. 1).”
It is important to note that the process of criminalization is often excluded from such analysis of offending and criminal behavior. The term “criminalization” acknowledges that conduct designated as “crimes” is necessarily a product of societal efforts to label, enforce, surveil, and punish. Criminalization refers to how the law, the police, and court officials classify and act upon some kinds of conduct, but not others, as criminal. Social norms, prejudices, and power relations at a given point in time can influence this process, potentially codifying and locking in definitions of crime that have a disproportionate impact on Black and Native American people (Lacey & Zedner, 2017; Lacey et al., 2018). For example, the Bureau of Indian Affairs created criminal codes and reservation court systems that criminalized traditional religious and cultural activities that the U.S. government sought to eradicate in its campaign to forcibly assimilate Native Americans (Ross, 2010).
A wide range of evidence points to the negative effects of criminal conviction and incarceration, which disproportionately affect Black and Native Americans, on later employment and earnings. Field studies, for example, find that employment outcomes after incarceration are worse for Black youth and men compared with White youth and men (Sullivan, 1989; Western & Sirois, 2019). Consistent with these findings, Pager (2007; Pager et al., 2009) also finds that the stigma of a criminal record in the labor market is larger for Black job-seekers than for White ones. Monetary sanctions and court-ordered fees resulting from contact with the criminal justice system can also impact socioeconomic outcomes. A randomized controlled trial in a misdemeanor court in Oklahoma showed that court fines and fees led to warrants for nonpayment, debts in collection, and state garnishment of tax refunds (Pager et al., 2022). Studies show that these sanctions are both disproportionately imposed on and are associated with the adverse treatment of Black Americans by police and other officials (Bing et al., 2022; Shoub et al., 2021). Finally, punishment in one generation reverberates in the next through worse child and young-adult health, educational attainment and achievement, socioeconomic and psychological adjustment, and behavior
(Finlay et al., 2022; Haskins et al., 2018; Heard-Garris et al., 2018; Shaw, 2019; Wakefield & Wildeman, 2013).
In sum, racial inequality in crime, victimization, and criminal justice system involvement contributes to disproportionate rates of intergenerational poverty among Black and Native Americans. Interventions that address both violence and victimization as well as how the criminal justice system affects youth outcomes and, ultimately, intergenerational mobility are discussed in detail in Chapter 9.
Child Welfare System
Involvement with the child welfare system is also marked by pronounced racial inequalities (e.g., see H. Kim et al., 2017). Research suggests that associations between maltreatment or child welfare involvement and later outcomes do vary by race/ethnicity. For example, in a large study of children in Mississippi (n = 30,000), Yoon et al. (2021) documented that children who experienced maltreatment had worse educational outcomes than those who had not, specifically in grade retention and chronic absenteeism. Black male children who were maltreated had worse educational outcomes compared with similar White males or Black or White females. Further, Mersky and Topitzes (2010) analyzed data from the Chicago Longitudinal Study, which included 1,539 children from economically disadvantaged backgrounds, 93% of whom were Black. They found that children with substantiated reports of maltreatment had an increased likelihood of adverse education and employment outcomes during early adulthood (18–24 years), such as lower high school graduation rates (54% vs. 37%), less employment or college attendance (53% vs. 41%), and increased history of arrest (36% vs. 48%).
The strong relation between family poverty and race/ethnicity in the United States, especially among the child population (National Academies, 2019a; Thiede et al., 2021), also has implications for maltreatment and child welfare involvement. It may be challenging to differentiate child maltreatment and neglect from the common sequalae of poverty (e.g., food insecurity, lack of child care), and thus the child welfare system risks sweeping in families—particularly Black and Native American families—just for being low income.
A strong evidentiary base exists on the overrepresentation of Black children in the child welfare system. Specifically, Black children are more likely than their White counterparts to be referred to the child welfare system regarding suspected maltreatment (Administration for Children and Families, 2022a; Drake et al., 2011; Putnam-Hornstein et al., 2013) and to be substantiated for maltreatment (Administration for Children and Families, 2022a; Drake et al., 2011; Putnam-Hornstein et al., 2013). According to
the most recent federal data, Black children have the second highest maltreatment victimization rate, at 13.2 per 1,000 children of the same race or ethnicity (Administration for Children and Families, 2022a). The limited rigorous data on children from Native populations (American Indian/Alaska Native) suggest that they have the highest rate of maltreatment at 15.5 per 1,000 children of the same race or ethnicity (Administration of Children and Families, 2022a; Wulczyn, 2020).
These disparities have been attributed to elevated risks among nonWhite families (Barth et al., 2020, 2022; Drake et al., 2011) as well as structural racism internal and external to the child welfare system (e.g., increased community surveillance, biased decision making), and policies of removal of Native American children (Boyd, 2014; Detlaff & Boyd, 2022). Both these explanations can be considered in the context of poverty. Specifically, Black and Native American families are more likely to experience the poverty-related risks identified previously, such as mental health challenges, substance use, and criminal justice system involvement (Birckhead, 2012; Jones Harden & Slopen, 2022; Wadsworth et al., 2016). They are also more likely to reside in neighborhoods with higher concentrations of poverty and experience the adverse neighborhood conditions that characterize these communities (Jones Harden & Slopen, 2022; Molina et al., 2012; Quillian, 2012), including child maltreatment (Coulton et al., 2007; Maguire-Jack et al., 2022).
Scholars have attempted to disentangle the influences of race and poverty on child welfare system involvement. For example, in a population-based study, Putnam-Hornstein et al. (2013) documented that Black children were more than twice as likely as other children to experience child maltreatment referral and substantiation, as well as foster care placement prior to age 5. However, when the authors adjusted for the contribution of socioeconomic factors, they found that Black children with low socioeconomic status (SES) were less likely to be referred, substantiated, and enter foster care than White children from similar SES backgrounds.
In sum, these disparities point to the need for policies and programs that can reduce child maltreatment and child welfare system involvement in order to address intergenerational poverty. Such interventions are discussed in Chapter 10.
Conclusion 3-1: The challenges that Black and Native American families face in propelling their children into socioeconomic security result from contemporary and historical disparities, discrimination, and structural racism. Behaviors and choices can also have major causal impacts on intergenerational mobility. Many factors influence the behaviors and choices of Black and Native Americans, including the experiences of historical violence, oppression, and marginalization manifested through
mechanisms of contemporary structural racism. These factors are crucial in shaping the relevant determinants of poverty over generations.
SOME IMPLICATIONS FOR PROGRAM AND POLICY INTERVENTIONS
The most obvious policy implication of the prevalence of racism in all its forms, even today, is that there is a need to end racism and counter the persistent effects of past discrimination. Nevertheless, there are few direct policy mechanisms available for achieving this goal, outside the existing body of federal and state antidiscrimination laws in employment, housing, and other realms. Improving outcomes for Black people and Native Americans will likely require some race consciousness in our policies and their implementation to ensure that their impacts are as positive as possible for these marginalized groups.
Race consciousness requires marshalling data to understand racial disparities and the policies and practices that contribute to it. For example, the U.S. Treasury Department (2021) is “examining the tax system through a racial equity lens,” as facilitated by the Executive Order on Advancing Racial Equity and Support for Underserved Communities Through the Federal Government (White House, 2021). As discussed in Chapter 4, Black teachers can have a positive long-term impact on Black students, so race consciousness may also be important for workforce policies. Race-targeted policies may result from race conscious data gathering. For example, responding to the underrepresentation of Black and Native American (and Latino) students from universities, race-targeted affirmative action in university admissions and employment (for government contractors) can help achieve more racial equity and has done so relatively successfully (Holzer & Neumark, 2000; Long & Bateman, 2020).2
Race consciousness and targeting in policy making is politically contentious. But policies such as Texas’s Top Ten Percent Rule, which targets the highest achieving high school students rather than race, have been shown to “pull in” larger concentrations of Black and Hispanic into higher-quality Texas universities than White students and, in the case of Black students, disproportionately increase their college graduation rates as well (Black et al., 2023). In the labor market, the 1966 Fair Labor Standards Act, a race-conscious policy that extended minimum-wage laws to previously uncovered workers in agriculture and service employment, where Black people
___________________
2 In June 2023, the Supreme Court issued a ruling to restrict affirmative action that will present challenges to efforts to diversify the nation’s colleges and universities (National Academies, 2023).
were over-represented, had the effect of reducing the Black-White earnings gap significantly (Derenoncourt & Montialoux, 2021).
Even race-neutral efforts to reduce poverty can have disproportionately beneficial effects. An analysis by the Center on Budget and Policy Priorities (Trisi & Saenz, 2021) concludes that “economic security programs have become more effective at reducing poverty and racial disparities over the last 5 decades” (p. 2) and that “economic security programs reduce gaps in child poverty by race and ethnicity by nearly half” (p. 9). The National Academies report A Roadmap to Reducing Child Poverty (2019a, Table 5-1) lists several programs that disproportionately reduce Black child poverty (the report did not highlight Native American children), including the Earned Income Tax Credit, child care subsidies, housing vouchers, and a universal child allowance. Other research shows causal evidence that expanded Medicaid coverage has disproportionately positive impacts on Black children’s long-term health outcomes and suggestive evidence on positive impacts on educational outcomes (Miller & Wherry, 2019; Wherry & Meyer, 2016; Wherry et al., 2018). Similarly, another race-neutral policy, the Clean Air Act of 1970 and its National Ambient Air Quality Standards has contributed significantly to the narrowing of Black-White disparities in exposure to particulate matter (Currie et al., 2023). Reducing school suspensions is another race-neutral way to disproportionately benefit the long-term outcomes of Black students (Bacher-Hicks et al., 2019). While these policies and programs are promising for reducing various disparities, there is less direct causal evidence on interventions that will improve intergenerational mobility for Black and Native American individuals.
In the chapters that follow, we identify a set of policies and programs for reducing intergenerational poverty that are supported by direct evidence on intergenerational impacts. There are notably few interventions for which there is direct evidence of intergenerational impacts specifically on Black and Latino Americans, and none assessing impacts on Native Americans. As discussed elsewhere, there are relatively few studies that are able to measure direct intergenerational impacts at all, and those often rely on small samples. Subsetting these studies to examine effects specifically for Black or Latino families leaves even smaller samples.
A common pattern is that an intervention yields a measurable, statistically significant effect on the overall population, but that the estimated effect on the Black or Latino subpopulation is imprecisely measured and not statistically significant. This can be so even when the estimate of the effect on the subpopulation is equal to or larger than the full-population effect, simply because the subpopulation effect is less precisely measured. In this case, the appropriate conclusion is not that the intervention does not work for Black or Latino families, but rather that we do not have enough data to distinguish the effects on these families from the overall positive effect.
Still, there is some promising evidence that the subgroup effects of the interventions we identify elsewhere have direct intergenerational effects. These are detailed in Appendix C, Table C-3-1, and are summarized in Box 3-2 in the case of interventions that have been found to have statistically significant effects in samples (or subsamples) that consist primarily of Black or Latino families. Where the subgroup effects are not significant, they are not included here. As noted, this should not be taken as evidence that the programs do not work for members of those subgroups.
The implications of our findings above for research are clear and extremely important. Because rigorous analysis of structural racism is a fairly recent phenomenon, a great deal remains to be done. Developing more consensus on how to define, measure, and test its effects—especially in the contemporary context—is a necessary first step. Then, testing and evaluating innovative and targeted policies and programs can also address the lack of rigorous evidence on how to improve upward mobility for those who have suffered from both poverty and racism.
BOX 3-2
Direct-Evidence Interventions in Chapters 4 Through 10 That Have Been Shown to Be Effective for Reducing Intergenerational Poverty Among Black or Latino Children
Education
K-12 education: Increased K-12 school spending in the poorest districts benefits Black students. Having Black teachers benefits Black students. Reducing harsh school discipline benefits Black and Latino students, especially males. Ethnic Studies course-taking benefits Latino students.
Postsecondary education: Some programs that expand effective financial aid programs for low-income students and increase campus supports (such as tutoring and case management) benefit Black students.
Career training: Expanding high-quality career and technical education programs in high school and sectoral training programs for adults and youth increases the later earnings of Black youth and young adults.
Child and Maternal Health
Health insurance: Access to Medicaid improves the life expectancy of Black children.
Pollution reduction: Some pollution reduction policies increase the adult work hours and earnings of Black children and have reduced racial gaps in exposure to pollution by 60%.
Nutrition: Expanding SNAP access for legal permanent resident parents and eliminating proration for citizen children of undocumented parents would improve intergenerational health for Latino children.
Family Income, Employment, and Wealth
Work-based income support: State supplements to the Earned Income Tax Credit generate generally positive effects on educational attainment and earnings of Black children.
Neighborhood Crime and the Criminal Justice System
Juvenile incarceration: Reducing juvenile detentions and incarcerations promotes school completion and reduces adult crime among Black youth.
Child investment strategies: Scaling-up evidence-based therapeutic interventions such as the Becoming a Man program improves youth outcomes for Black males.
Strengthening communities to reduce violent crime and victimization: Scaling up programs that abate vacant lots and abandoned homes reduces crime in majority-Black neighborhoods.
Policing strategies: Expanding funding for policing in high-crime neighborhoods reduces homicides among the Black population.
SOURCE: Appendix Table C-3-1; Chapters 4, 5, 6, and 9.


