Appendix C
Appendices to Chapters
APPENDIX C: CHAPTER 2
A DEMOGRAPHIC PORTRAIT OF INTERGENERATIONAL POVERTY
This appendix details the methods used to construct Chapter 2’s portrait of intergenerational mobility. It first describes the population-level data used to measure mobility for recent generations by subgroup and geographic area and then describes the historical data used to measure trends in economic mobility over time. Finally, it presents distributional data on economic status as measured by adjusted gross income (AGI) and the income concept used in the Supplemental Poverty Measure (SPM).
Contemporary Measures of Mobility by Subgroup and Area Based on Tax Data
Data
Our featured estimates of economic mobility by race, gender, and geography are obtained directly from the Opportunity Atlas data constructed by Chetty et al. (2018, 2020). Here, we briefly summarize their methods as they pertain to the results we summarize in the main text; see Chetty et al. (2018, 2020) for further details.
To measure present-day intergenerational mobility in the United States, Chetty et al. combine three sources of data: (1) the Census 2000 and 2010 short forms; (2) federal income tax returns from 1989, 1994, 1995, and
1998–2015; and (3) the Census 2000 long form and the 2005-2015 American Community Surveys. The target population comprises all children in the 1978–1983 birth cohorts (a) who were born in the United States or are authorized immigrants who came to the United States in childhood and (b) whose parents were also U.S. citizens or authorized immigrants.1 After excluding children who cannot be linked to parents or have no address information during childhood, the primary analysis sample comprises 20.5 million children, which covers 96% of the target population. When reporting race-specific estimates, an additional 5% of children for whom race data is missing are excluded.
Parental income is defined as the mean of parents’ household income over 5 years: 1994, 1995, and 1998–2000. Parents’ household income is measured as AGI in years in which a parent files a tax return and is defined as zero otherwise. Children’s annual income is defined similarly, except that data from W-2 forms (which are available in more recent years) are used to impute income for non-filers. Children’s income is measured as the mean of children’s annual incomes in 2014 and 2015 (when they are between ages 31 and 37).
Methods
We use children’s and parents’ income ranks to measure intergenerational mobility. A child’s income rank is measured as his or her percentile in the national distribution of incomes (measured between ages 31 and 37) relative to all others in his birth cohort who are included in our primary analysis sample. Similarly, we measure parents’ income rank as their percentile in the national distribution of parental income for their child’s birth cohort. For any given parental income percentile, we can then directly calculate the mean income percentile of their children, as shown in Figures 2-1 through 2-5.2 These relationships provide measures of relative mobility, addressing the question “What are the outcomes of children from low-income families relative to those of children from high-income families?”
___________________
1 We construct this sample by identifying all children born between 1978 and 1983 who were claimed as a dependent child on a 1040 tax form at some point between 1994 and 2015 by an adult who appears in the 2016 Numident file and was between ages 15 and 50 at the time of the child’s birth. We define a child’s parent as the person who first claims the child as a dependent (between 1994 and 2015).
2 From children’s and parent’s income ranks, we can also create a summary statistic measure of intergenerational mobility: the correlation between children’s and parents’ income ranks (rank-rank slope). Chetty et al. (2014a) show that rank-rank slopes provide a more robust measure of relative mobility than another commonly used measure, the elasticity of children’s income with respect to parental income.
For the geographic analyses in Figures 2-8 and 2-9, children are assigned to locations based on the location of their parents (when the child was first claimed as a dependent), irrespective of where they live as adults.
Comparisons with Studies Based on the Panel Study of Income Dynamics
Two studies based on data from the Panel Study of Income Dynamics (PSID) provide comparative information on intergenerational poverty persistence and intergenerational income mobility from low economic status in childhood—Parolin et al. (2022) and Fisher and Johnson (2023).
Parolin et al. (2022) estimate intergenerational poverty persistence using data gathered in the 1968–2019 waves of the PSID. Since their income measure includes both cash and two in-kind sources (Supplemental Nutrition Assistance Program [SNAP] and refundable tax credits), it is closer to an SPM-based than an Official Poverty Measure-based measure of total household income. A family is defined as poor if this income measure falls below the Official Poverty Measure threshold for a family of that size. The Parolin et al. sample consists of PSID participants observed in the data for at least 6 years between birth and age 10 and for at least 1 year between ages 25 and 30. Childhood poverty is defined as living in a household with income below the poverty threshold for 50% or more of the years between birth and age 10. Adult poverty is defined using the same income measure, but only in a single year—age 30. The small number of individuals who did not identify as “White” or “Black” are excluded from the calculations, so the “All” columns of Appendix Tables C.2.2 are based only on Black and White PSID families.
Fisher and Johnson (2023) study PSID individuals observed between ages 14 and 18 in childhood and ages 31 and 35 in adulthood. Their birth cohorts span the period from 1954 to 1982, and PSID data are drawn from the 1968 through 2017 waves. Total household income equals the sum of taxable income, cash transfer income, and social security income for the head, spouse/partner, and other family units in the household. Total consumption values are imputed for every PSID household and wave based on reported food expenditures and, beginning in 1999, responses to a more comprehensive set of consumption questions, as well as to the Consumer Expenditure Survey (Fisher & Johnson 2021). Wealth data are available in the PSID for 1984, 1989, 1994, and the period 1999–2017. Wealth is imputed in other waves using information on home value and on interest and dividend income.
We sought PSID counterpart estimates for Figure 2-6, which shows the average adult income ranks for children with household AGI at the 10th and 50th percentiles of childhood income distribution. Special tabulations
by Fisher and Johnson using data from their article provided average economic rank in adulthood for children in the 8th to 12th and 48th to 52nd percentiles of the PSID-based distributions of income, consumption, and wealth.
Poverty Transitions
Table C-2-1 shows intergenerational data on low-income rates and transitions in Internal Revenue Service (IRS) data using the bottom decile or quintile of the child or adult distributions to define low-income thresholds. Overall rates of low-income status for the bottom decile and quintile are, by definition, 10% and 20%, respectively. In both cases, rates are three times as high for Black as for White individuals.
Counterpart numbers for the PSID are shown in the first three columns of Table C-2-2. The Parolin et al. (2022) annual measure of poverty—cash plus tax credits and SNAP benefits relative to the official poverty line—yields an average annual poverty rate of 12.3%. In their main analyses, Parolin et al. (2022) consider children to be poor if their household income fell below the poverty threshold in more than half of their birth-to-age-10 years. Despite this unusual definition, their estimate of childhood poverty—11.3%—is very similar to the average of the annual rates, and it is much higher for Black (38.2%) than White (5.4%) children. Their estimate of poverty in adulthood (10.3%) is also similar, although the racial gap for this adult poverty measure is smaller than for its childhood counterpart.
Given the committee’s focus on reducing intergenerational poverty, the most relevant estimates from these two data sources are of the fraction of children living in poor or low-income families who are also observed to be poor or low-income in adulthood. These are shown in the “Conditional Poverty Persistence” columns of the two tables. Rates are similar for the 20th percentile threshold in tax data (33.7%; also shown in Figures 2-1 and 2-2) and in the PSID data (28.6%; also shown in Figure 2-1). Lowering the threshold to the 10th percentile produces a considerably lower (19.6%) estimate of conditional mobility out of poverty/low-income status. In both datasets, substantially fewer Black than White children escape poverty/low-income status.
Also of interest is the general prevalence of intergenerational poverty—the fraction of all children who live in low-income families in both childhood and adulthood. This is simply the product of childhood poverty rates and intergenerational persistence. So, if, for example, 12% of children grow up in poor families and one-third of poor children are also poor in adulthood, then the fraction of all children poor in both generations is one-third of 12%—or 4% in all. Estimates of intergenerational poverty/low-income prevalence are highest (6.7%) for the IRS-based 20th-percentile cutoff for
| Poverty defined by 10th percentile (bottom decile) | Poverty defined by 20th percentile (bottom quintile) | |||||||
| Average annual child poverty rate (% of children with average AGI in bottom decile in childhood) | Average annual adult poverty rate (% of children with average AGI in bottom decile in adulthood) | Conditional poverty persistence (Among children in bottom decile, % in bottom decile in adulthood) | Intergenerational poverty prevalence (% of children with AGI in bottom decile in both childhood and adulthood) | Average child poverty rate (% of children with average AGI in bottom quintile in childhood) | Adult poverty rate (% of children with average AGI in bottom quintile in adulthood) | Conditional poverty persistence (Among children in bottom quintile, % in bottom quintile in adulthood) (Figure 2-1) | Intergenerational poverty prevalence (% of children with AGI in bottom quintile in both childhood and adulthood) | |
| All | 0.100 | 0.100 | 0.196 | 0.020 | 0.200 | 0.200 | 0.337 | 0.067 |
| White | 0.055 | 0.117 | 0.151 | 0.291 | 0.034 | |||
| Black | 0.192 | 0.377 | 0.303 | 0.373 | 0.141 | |||
| Black-White | 0.137 | 0.260 | 0.152 | 0.082 | 0.107 | |||
| White men | 0.117 | 0.166 | 0.313 | 0.037 | ||||
| Black men | 0.373 | 0.394 | 0.485 | 0.181 | ||||
| White women | 0.117 | 0.136 | 0.267 | 0.031 | ||||
| Black women | 0.380 | 0.217 | 0.268 | 0.102 | ||||
SOURCE: Chetty et al. (2020); see text for more information. No publicly available data are available for the blank cells in the 10th percentile columns.
| Average yearly child poverty rate (Fraction of years poor between ages 0 & 10, 1970–2003) | Average yearly adult poverty rate (Fraction of years poor between ages 25 & 30, 1995–2019) | Child poverty (poor more than 50% of years between birth and age 10) | Adult poverty (% poor at age 30) | Conditional poverty persistence (Among poor children, % poor at age 30) | Intergenerational poverty prevalence (% of population poor in both childhood and at age 30 | |
| All | 0.123 | 0.102 | 0.113 | 0.101 | 0.286 | 0.032 |
| White | 0.074 | 0.075 | 0.054 | 0.072 | 0.198 | 0.011 |
| Black | 0.371 | 0.231 | 0.382 | 0.231 | 0.344 | 0.130 |
| Black-White | 0.297 | 0.156 | 0.328 | 0.159 | 0.146 | 0.119 |
| White men | 0.072 | 0.067 | 0.054 | 0.068 | 0.172 | 0.009 |
| Black men | 0.341 | 0.206 | 0.359 | 0.220 | 0.346 | 0.122 |
| White women | 0.076 | 0.084 | 0.054 | 0.077 | 0.225 | 0.012 |
| Black women | 0.401 | 0.254 | 0.408 | 0.243 | 0.346 | 0.140 |
SOURCE: Parolin et al. (2022); see text for more information.
low-income status, lowest (2.0%) for the IRS-based 10th-percentile threshold, and in between (3.2%) for the PSID-based poverty measure. In both cases where race-specific estimates are available, the prevalence of persistent poverty/low-income status is higher for Black than for White children.
Income Mobility
Text Figure 2.6 shows adult outcomes for children with household incomes that placed them on the 10th or 50th rung of the childhood economic ladder based on data from tax records. Table C-2-3 and Figure C-2-1 provide data on income, consumption, and wealth from the PSID as described above and in Fisher and Johnson (2023). The two data sources and various measures of economic well-being tell a broadly similar story about intergenerational economic mobility:
- Children starting out on the 10th rung of the economic ladder, on average, climb to considerably higher rungs in adulthood. This is especially true for White children, for whom rungs average between the 36th and 45th, depending on the measure.
- The average adult destinations for Black children are between 11 and 18 rungs lower than for White children.
Translating Percentiles of the Adjusted Gross Income Distribution to Incomes Relative to the Poverty Line
To support the report’s data efforts, commissioned consultants were asked to match the AGI of children (based on their families’ incomes) to a measure of their families’ incomes relative to the poverty line (measured under the SPM). The consultants produced estimates of this correspondence by determining children’s position in the AGI percentile distribution and then calculating the average income-to-needs of children within each percentile, with income-to-needs ratios assessed using the SPM. They first describe the steps they took to match the percentiles of the AGI distribution to income-to-needs ratios in greater detail and the challenges encountered in this process. They use the Historical Supplemental Poverty Measure Data Series (Wimer et al., 2022) and the Annual and Social Economic Supplement to the Current Population Survey, retrieved from IPUMS3-CPS (Flood et al., 2022) to produce these results.
___________________
3 “IPUMS” stands for Integrated Public Use Microdata Series.
| Conditional mobility from 10th percentile (Fig. 2-6) | Conditional mobility from 50th percentile (Fig. 2-6) | |||||
| Chetty et al., (2020) based on data from the IRS | ||||||
| Average percentile rank, based on adjusted gross income (AGI; Fig. 2-6) | Average percentile rank, based on AGI (Fig. 2-6) | |||||
| All | 37.6 | 50.6 | ||||
| White | 40.7 | 52.6 | ||||
| Black | 29.3 | 38.8 | ||||
| Black-White | -11.4 | -13.8 | ||||
| White men | 39.7 | 51.5 | ||||
| Black men | 27.0 | 36.5 | ||||
| White women | 41.7 | 53.7 | ||||
| Black women | 31.5 | 41.0 | ||||
| Fisher and Johnson (2023), based on PSID | ||||||
| Average percentile rank, based on full income | Average percentile rank, based on consumption | Average percentile rank, based on wealth | Average percentile rank, based on full income | Average percentile rank, based on consumption | Average percentile rank, based on wealth | |
| All | 0.301 | 0.334 | 0.331 | 0.583 | 0.500 | 0.581 |
| White | 0.364 | 0.389 | 0.449 | 0.610 | 0.528 | 0.553 |
| Black | 0.234 | 0.267 | 0.269 | 0.298 | 0.373 | 0.501 |
| Black-White | -0.130 | -0.122 | -0.180 | -0.312 | -0.155 | -0.052 |
SOURCE: Data from Chetty et al. (2020) for IRS data; Fisher and Johnson (2023) for PSID data. See text for more information.
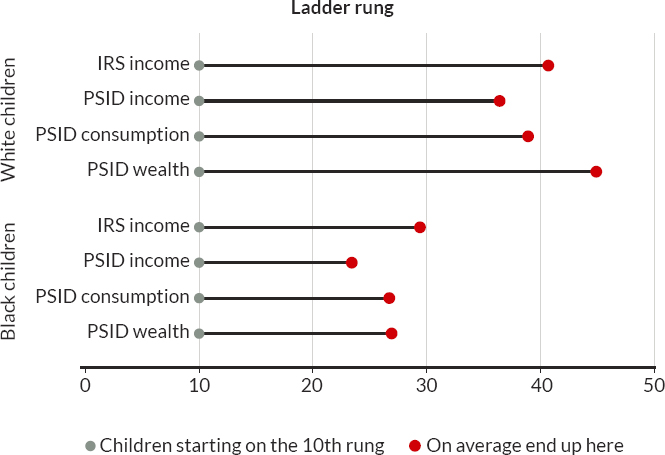
NOTES: This figure shows the mean percentile of economic status in adulthood for children with parents at the 10th income percentile of that same measure of economic status. Child “IRS” economic status is measured by mean AGI in 1994–2000 for childhood and 2014–2015 for adulthood in IRS tax records. Children were born between 1978 and 1983. All PSID measures are based on individuals observed between ages 14 and 18 in childhood and ages 31 and 35 in adulthood. Children were born between 1954 and 1982. “Income” is pre-tax cash income of household; “consumption” is based on reported and imputed expenditures; and “wealth” is based on reported and imputed wealth. PSID data are based on individuals in the 8th to 12th percentiles of the childhood measure of economic status.
SOURCE: Data from Chetty et al. (2020), based on data from the IRS and Fisher and Johnson (2023), based on data from the PSID.
Matching Children’s Placement in the AGI Distribution to Income-to-Needs Ratios
The AGI distribution underlying results presented in Chapter 2 is tabulated at the tax unit level, where children under age 18 are typically dependents within tax units and their parents or guardians are the primary tax filers (see the following section for a discussion of the exceptions to this arrangement). The first step in matching children’s placement in the AGI distribution to a measure of their income-to-needs was to determine the total AGI of the tax units in which children were claimed as dependents.
To do so, we first needed to construct tax units in the data from the Annual Social and Economic Supplement to the Current Population Survey (ASEC-CPS) that included primary tax filers and their dependents under age 18 or 24 (the latter in the case of those in school). Note that our objective was to link child dependents to those who claim them as dependents, so we do not discuss linking older dependents to the filers who may have claimed them. The ASEC-CPS microdata made available by IPUMS-CPS includes a variable from the Census Tax Model that identifies individuals as joint filers, heads of household, single filers, or non-filers (see O’Hara, 2004 for a discussion of the Census Bureau’s Tax Model). Note that we exclude children under 18 who are identified by the Census Tax Model as primary tax filers from our primary analysis; see the following section for a more detailed discussion of this decision and the sensitivity of our results to it.
We begin by using the tax-filing type variable to identify the universe of individuals who may have filed, and the subset who may have claimed dependents, the latter being heads of household or joint filers. The next step is to identify which of the non-filers are dependents of the tax filers who may have claimed dependents, which we accomplish by taking the following steps:
- Identify children who could possibly be claimed as dependent; this includes those who were not tax filers and were under age 18 at the time of the March ASEC-CPS survey administration or those under age 24 who were in school at the time the survey was administered.
- Link those children to the filers in their household unit using the following rules:
- If they live with either the mother, father, or both, and their parents were tax filers, they are placed in their parents’ tax units.
- If their parent(s) are not filers or they do not live with their parents but they live with a relative who is a filer that claims dependents (according to the Census Tax Model), they are placed in the unit of that filer.
- If their parents are non-filers and the children do not live with any relatives who are filers, a non-filing tax unit is created that links the children to their parents.
- If they do not live with their parents, and none of their relatives files taxes, a non-filing tax unit is created that links the children to their eldest relative.
Once we identified these tax units, we calculated the total AGI across all members of the tax unit using the ASEC-CPS AGI variable. The AGI variable was constructed by the Census Tax Model and is described in the IPUMS-CPS codebook as including “an individual’s total gross (pretax) income from taxable sources minus certain items, such as individual retirement plan contributions (payments to a Keogh plan or a deductible Individual Retirement Account), alimony paid, medical savings accounts, and non-reimbursed employee business expenses.”4 In the case of joint-filers, we also ensured that income sources were not double-counted when totaling AGI across tax unit members. The total AGI of the tax unit represented the AGI of each child’s family and is the primary variable used in the subsequent analyses described below. We produced these estimates for data representative of 1994, 1995, 1998, 1999, and 2000.
Determining Children’s Income-to-Needs Ratios
Next, we determine the income-to-needs ratio of all children in the data using variables available in the Historical SPM Data Series (Wimer et al., 2022). As described by Fox et al. (2015) and Wimer et al. (2016), the Historical SPM Data Series includes the necessary inputs for measuring poverty under the SPM from 1967 to 2009 (before the data were available in the ASEC-CPS). We define children’s income-to-needs ratio as the total resources for the SPM poverty unit divided by the poverty threshold for their unit, all measured using the SPM and available in the Historical SPM Data Series. See Fox et al. (2015) for a more extensive discussion of the construction of the SPM resources variables, and Nolan et al. (2017) for a discussion of the SPM poverty thresholds construction. Again, we produced these results for data representative of 1994, 1995, 1998, 1999, and 2000.
___________________
4 Additional information on this variable is available at https://cps.ipums.org/cps-action/variables/ADJGINC#description_section
Matching Percentiles of the AGI Distribution to Income-to-Needs Ratios
Our final step was to determine the percentiles of the AGI distribution in the data when limiting to children under age 18, and then to find the average income-to-needs of children within these percentiles. We weighted these averages using the person-lev2 weights available in the ASEC-CPS microdata files. Again, we produced these results for data representative of 1994, 1995, 1998, 1999, and 2000. Figure C-2-2 depicts the 5-year averages of these results, while Table C-2-4 presents the results by year.

NOTES: Figure C-2-2 shows the average income-to-needs of children by their position in the AGI distribution. AGIs are determined based on the total AGI of the tax unit claiming each child in the ASEC-CPS data retrieved from IPUMS-CPS (2022) and matched to income-to-needs ratios based on data from the Historical SPM Data Series (Wimer et al., 2022). Results are produced with data representative of 1994, 1995, 1998, 1999, and 2000. Children identified as independent tax filers (i.e., non-dependents) based on the Census Tax Model are not included in these results (see Figure C-2-4 and Table C-2-2 for results inclusive of this population).
SOURCE: Data from the Historical SPM Data Series (Wimer et al., 2022) and the ASEC-CPS data from IPUMS-CPS (2022).
| Percentile AGI | Avg. Income-to-Needs | Percentile AGI | Avg. Income-to-Needs | ||||||||||
|---|---|---|---|---|---|---|---|---|---|---|---|---|---|
| 1994 | 1995 | 1998 | 1999 | 2000 | 5-year average | 1994 | 1995 | 1998 | 1999 | 2000 | 5-year average | ||
| 1 | 0.77 | 0.87 | 0.79 | 0.76 | 0.76 | 0.79 | 51 | 1.96 | 2.04 | 2.25 | 2.18 | 2.27 | 2.14 |
| 2 | 0.77 | 0.87 | 0.79 | 0.76 | 0.76 | 0.79 | 52 | 1.97 | 2.01 | 2.24 | 2.20 | 2.35 | 2.15 |
| 3 | 0.77 | 0.87 | 0.79 | 0.76 | 0.76 | 0.79 | 53 | 1.94 | 2.13 | 2.31 | 2.27 | 2.29 | 2.19 |
| 4 | 0.77 | 0.87 | 0.79 | 0.76 | 0.76 | 0.79 | 54 | 2.08 | 1.99 | 2.23 | 2.37 | 2.38 | 2.21 |
| 5 | 0.77 | 0.87 | 0.79 | 0.76 | 0.76 | 0.79 | 55 | 2.24 | 2.06 | 2.27 | 2.33 | 2.49 | 2.28 |
| 6 | 0.77 | 0.87 | 0.79 | 0.76 | 0.91 | 0.82 | 56 | 2.28 | 2.21 | 2.16 | 2.45 | 2.53 | 2.33 |
| 7 | 0.77 | 0.87 | 0.79 | 1.02 | 0.75 | 0.84 | 57 | 2.09 | 2.22 | 2.32 | 2.30 | 2.44 | 2.27 |
| 8 | 0.77 | 0.87 | 0.86 | 0.72 | 0.94 | 0.83 | 58 | 2.11 | 2.30 | 2.40 | 2.27 | 2.58 | 2.33 |
| 9 | 0.77 | 0.85 | 0.96 | 0.87 | 0.90 | 0.87 | 59 | 2.26 | 2.26 | 2.43 | 2.35 | 2.54 | 2.37 |
| 10 | 0.71 | 0.69 | 1.13 | 0.98 | 1.08 | 0.92 | 60 | 2.22 | 2.41 | 2.51 | 2.61 | 2.58 | 2.47 |
| 11 | 0.81 | 0.95 | 1.00 | 1.13 | 1.21 | 1.02 | 61 | 2.29 | 2.33 | 2.56 | 2.50 | 2.65 | 2.47 |
| 12 | 0.95 | 0.89 | 0.96 | 1.08 | 1.08 | 0.99 | 62 | 2.33 | 2.35 | 2.54 | 2.45 | 2.79 | 2.49 |
| 13 | 0.89 | 1.10 | 1.10 | 1.26 | 1.30 | 1.13 | 63 | 2.46 | 2.53 | 2.65 | 2.67 | 2.78 | 2.62 |
| 14 | 0.85 | 1.06 | 1.11 | 1.10 | 1.36 | 1.10 | 64 | 2.39 | 2.47 | 2.63 | 2.73 | 2.84 | 2.61 |
| 15 | 1.07 | 1.31 | 1.10 | 1.25 | 1.25 | 1.20 | 65 | 2.34 | 2.56 | 2.73 | 2.71 | 2.75 | 2.62 |
| 16 | 0.99 | 1.16 | 1.30 | 1.17 | 1.32 | 1.19 | 66 | 2.58 | 2.56 | 2.84 | 2.70 | 2.81 | 2.70 |
| 17 | 1.19 | 1.15 | 1.14 | 1.52 | 1.34 | 1.27 | 67 | 2.52 | 2.52 | 2.78 | 2.70 | 2.92 | 2.69 |
| Percentile AGI | Avg. Income-to-Needs | Percentile AGI | Avg. Income-to-Needs | ||||||||||
|---|---|---|---|---|---|---|---|---|---|---|---|---|---|
| 1994 | 1995 | 1998 | 1999 | 2000 | 5-year average | 1994 | 1995 | 1998 | 1999 | 2000 | 5-year average | ||
| 18 | 1.18 | 1.18 | 1.16 | 1.34 | 1.37 | 1.25 | 68 | 2.53 | 2.72 | 2.76 | 2.82 | 2.94 | 2.75 |
| 19 | 1.07 | 1.21 | 1.29 | 1.27 | 1.45 | 1.26 | 69 | 2.60 | 2.62 | 2.81 | 3.09 | 2.97 | 2.82 |
| 20 | 1.20 | 1.42 | 1.46 | 1.44 | 1.35 | 1.37 | 70 | 2.67 | 2.71 | 2.84 | 3.01 | 3.07 | 2.86 |
| 21 | 1.28 | 1.30 | 1.25 | 1.32 | 1.28 | 1.29 | 71 | 2.68 | 2.83 | 2.94 | 2.95 | 2.94 | 2.87 |
| 22 | 1.12 | 1.39 | 1.30 | 1.45 | 1.34 | 1.32 | 72 | 2.66 | 2.89 | 3.13 | 3.04 | 3.16 | 2.98 |
| 23 | 1.36 | 1.26 | 1.48 | 1.45 | 1.47 | 1.40 | 73 | 2.68 | 2.89 | 3.11 | 3.12 | 3.09 | 2.98 |
| 24 | 1.36 | 1.35 | 1.46 | 1.53 | 1.58 | 1.46 | 74 | 2.93 | 2.85 | 3.18 | 3.03 | 3.20 | 3.04 |
| 25 | 1.31 | 1.27 | 1.36 | 1.43 | 1.52 | 1.38 | 75 | 3.16 | 3.05 | 3.18 | 3.24 | 3.23 | 3.17 |
| 26 | 1.32 | 1.46 | 1.45 | 1.49 | 1.48 | 1.44 | 76 | 3.01 | 2.95 | 3.19 | 3.15 | 3.17 | 3.09 |
| 27 | 1.27 | 1.57 | 1.66 | 1.62 | 1.47 | 1.52 | 77 | 2.99 | 3.00 | 3.30 | 3.46 | 3.33 | 3.22 |
| 28 | 1.43 | 1.62 | 1.59 | 1.49 | 1.65 | 1.56 | 78 | 3.04 | 3.18 | 3.37 | 3.50 | 3.38 | 3.29 |
| 29 | 1.58 | 1.58 | 1.70 | 1.65 | 1.57 | 1.62 | 79 | 3.10 | 3.11 | 3.27 | 3.66 | 3.38 | 3.30 |
| 30 | 1.44 | 1.48 | 1.67 | 1.55 | 1.72 | 1.57 | 80 | 3.16 | 3.07 | 3.43 | 3.67 | 3.54 | 3.37 |
| 31 | 1.54 | 1.41 | 1.72 | 1.55 | 1.63 | 1.57 | 81 | 3.22 | 3.15 | 3.36 | 3.47 | 3.40 | 3.32 |
| 32 | 1.46 | 1.51 | 1.61 | 1.61 | 1.75 | 1.59 | 82 | 3.30 | 3.29 | 3.40 | 3.54 | 3.56 | 3.42 |
| 33 | 1.49 | 1.56 | 1.72 | 1.71 | 1.77 | 1.65 | 83 | 3.32 | 3.34 | 3.68 | 3.59 | 3.66 | 3.52 |
| 34 | 1.53 | 1.55 | 1.62 | 1.58 | 1.75 | 1.61 | 84 | 3.41 | 3.48 | 3.60 | 3.45 | 3.83 | 3.55 |
| 35 | 1.51 | 1.48 | 1.63 | 1.67 | 1.90 | 1.64 | 85 | 3.48 | 3.44 | 3.64 | 3.96 | 6.00 | 4.10 |
| 36 | 1.55 | 1.65 | 1.56 | 1.68 | 1.85 | 1.66 | 86 | 3.57 | 3.71 | 3.87 | 3.94 | 6.00 | 4.22 |
| 37 | 1.57 | 1.68 | 1.83 | 1.63 | 1.80 | 1.70 | 87 | 3.64 | 3.67 | 4.16 | 3.96 | 6.00 | 4.29 |
| 38 | 1.60 | 1.72 | 1.64 | 1.75 | 1.92 | 1.73 | 88 | 3.70 | 3.75 | 4.14 | 5.40 | 6.00 | 4.60 |
| 39 | 1.63 | 1.69 | 1.82 | 1.78 | 1.86 | 1.76 | 89 | 3.78 | 3.71 | 6.01 | 5.40 | 6.00 | 4.98 |
| 40 | 1.67 | 1.73 | 1.86 | 1.77 | 1.94 | 1.79 | 90 | 3.78 | 3.75 | 6.01 | 5.40 | 6.00 | 4.99 |
| 41 | 1.65 | 1.62 | 1.81 | 1.90 | 1.92 | 1.78 | 91 | 3.83 | 3.97 | 6.01 | 5.40 | 6.00 | 5.04 |
| 42 | 1.70 | 1.73 | 1.88 | 1.92 | 1.95 | 1.84 | 92 | 4.01 | 4.30 | 6.01 | 5.40 | 6.00 | 5.14 |
| 43 | 1.85 | 1.90 | 1.91 | 1.89 | 2.06 | 1.92 | 93 | 4.28 | 4.33 | 6.01 | 5.40 | 6.00 | 5.20 |
| 44 | 1.94 | 1.85 | 1.87 | 1.99 | 2.01 | 1.93 | 94 | 4.52 | 7.07 | 6.01 | 5.40 | 6.00 | 5.80 |
| 45 | 1.81 | 1.90 | 1.97 | 2.02 | 2.19 | 1.98 | 95 | 4.52 | 7.07 | 6.01 | 5.40 | 6.00 | 5.80 |
| 46 | 1.77 | 1.91 | 2.00 | 1.93 | 2.28 | 1.98 | 96 | 4.52 | 7.07 | 6.01 | 5.40 | 6.00 | 5.80 |
| 47 | 1.84 | 1.92 | 2.09 | 1.97 | 2.25 | 2.01 | 97 | 4.52 | 7.07 | 6.01 | 5.40 | 6.00 | 5.80 |
| 48 | 1.88 | 1.70 | 2.06 | 2.01 | 2.08 | 1.95 | 98 | 4.52 | 7.07 | 5.50 | 5.87 | 5.58 | 5.71 |
| 49 | 2.00 | 1.97 | 2.28 | 2.04 | 2.27 | 2.11 | 99 | 4.57 | 6.70 | 5.54 | 5.34 | 5.71 | 5.57 |
| 50 | 1.95 | 1.88 | 2.06 | 2.28 | 2.25 | 2.08 | 100 | 4.59 | 6.70 | 7.66 | 5.65 | 6.32 | 6.18 |
NOTES: Table C-2-4 shows the average income-to-needs of children by their position in the AGI distribution. AGIs determined based on the total AGI of the tax unit claiming each child in the ASEC-CPS data retrieved from IPUMS-CPS (2022) and matched to income-to-needs ratios based on data from the Historical SPM Data Series (Wimer et al., 2022). Produced with data representative of 1994, 1995, 1998, 1999, and 2000. Children identified as independent tax filers (i.e., non-dependents) based on the Census Tax Model are not included in these results (see Figure C-2-4 and Table C-2-2 for results inclusive of this population).
SOURCE: Data from the Historical SPM Data Series (Wimer et al., 2022) and ASEC-CPS data from IPUMS-CPS (2022).
Tax Filers Under Age 18 and Challenges That Arose When Producing These Estimates
In producing these results, one issue that arose concerned the assignment of minors with earnings to individual tax units based on the Census Bureau’s tax model, a group we call “minor filers.” They are teenagers with low levels of earnings (and thus low AGIs) who also live with other family members. The minor filers are predominantly teenagers with very low incomes that the Census Tax Model identifies as needing to file taxes (either on their own return or possibly as dependent tax filers). In the years that we examine, there is no flag for “dependent tax filers,” and the Census assigns many teenagers in this group to be single filers. In the weighted 2000 data, there are 28.4 million children ages 11–17, and 10.7% of them (or 3.1 million) are minor filers.5 Unweighted, this translates to 27,255 children ages 11–17 and 3,235 minor filers. All minor filers are ages 15–17, and the majority (1.7 million weighted) are age 17. The same pattern holds in earlier data years.
The distribution of tax unit AGI associated with these minor filers is also very different from that of other children claimed as dependents (Figure C-2-3, left panel): their median AGI is $2,850, versus $44,000 for children claimed as dependents.6 At the same time, the distribution of the income-to-needs ratio is more similar between these groups (a bit higher for minor filers; Figure C-2-3, right panel). This is because the minor filers are often living with other family members and are thus part of larger poverty units than their individual tax unit, and the other members of these larger poverty units bring in additional resources. The average poverty rate of minor filers is actually lower than that of children claimed as dependents (4.7% vs 14.2%). On average, when compared with dependent children, the minor filers have lower levels of AGI in their tax unit (because it is just them) but also lower poverty rates.
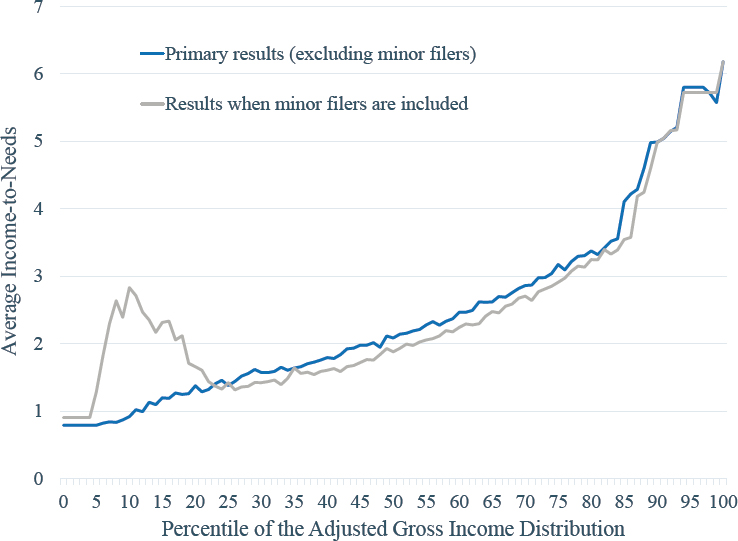
The minor filers are not evenly distributed across the AGI distribution. Instead, they are concentrated at the bottom end of the distribution (because they have low AGIs) and they introduce more data points in that tail. Thus, when we include them in the analysis, they end up dominating these lower percentiles and they push many children claimed as dependents into higher percentiles of the distribution. Because minor filers dominate these lower percentiles when they are included and the distribution of their income-to-needs ratios is relatively higher than for children claimed as dependents (Figure C-2-3, right panel), they make it appear as though
___________________
5 The number of teenagers flagged as filers by the Census Tax Model likely does not line up with the tax data, but that is a limitation that we cannot avoid.
6 When combining minor filers and children claimed as dependents, the median AGI is $38,004.
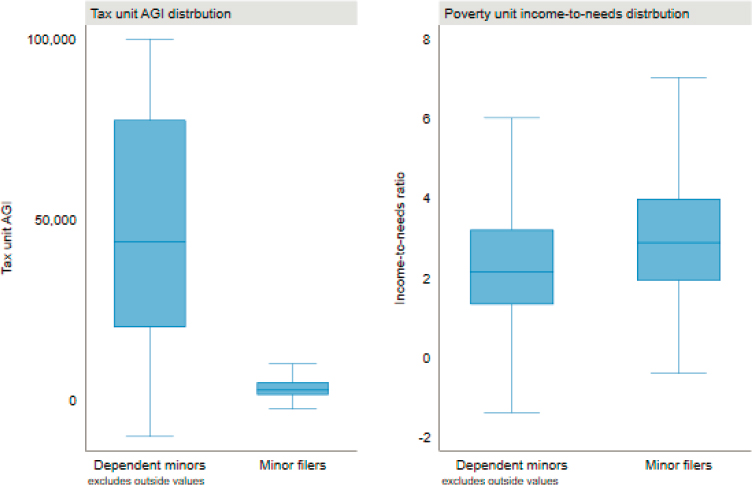
NOTES: Figure C-2-3 shows the AGI distribution and the distribution of income-to-needs ratios among children under 18 in the 2001 ASEC-CPS (representative of 2000) who are identified by the Census Tax Model as dependents versus those identified as independent tax filers. See O’Hara (2004) for a discussion of the Census Bureau’s Tax Model.
SOURCE: Data from the Historical SPM Data Series (Wimer et al., 2022) and ASEC-CPS data from IPUMS-CPS (2022). Limited to data representative of the 2000 calendar year.
these bottom percentiles have higher income-to-needs ratios. This pattern is depicted in Figure C-2-4, which plots the income-to-needs from our primary results (also presented in Figure C-2-2), and when we include minor filers in the analysis. We do not include this group of children in our primary estimates but provide supplemental results inclusive of them in Table C-2-5.
NOTES: Figure C-2-4 shows the average income-to-needs of children by their position in the AGI distribution and presents results under two scenarios: when including and when excluding children identified as independent tax filers (i.e., non-dependents) based on the Census Tax Model in the dataset. See O’Hara (2004) for a discussion of the Census Bureau’s Tax Model. AGIs are determined based on the total AGI of the tax unit claiming each child in the ASEC-CPS data from IPUMS-CPS (2022) and matched to income-to-needs ratios based on data from the Historical SPM Data Series (Wimer et al., 2022).
SOURCE: Data from the Historical SPM Data Series (Wimer et al., 2022) and ASEC-CPS data from IPUMS-CPS (2022).
| Percentile AGI | Avg. income to needs | Percentile AGI | Avg. income to needs | ||||||||||
|---|---|---|---|---|---|---|---|---|---|---|---|---|---|
| 1994 | 1995 | 1998 | 1999 | 2000 | 5-year average | 1994 | 1995 | 1998 | 1999 | 2000 | 5-year average | ||
| 1 | 0.84 | 0.94 | 0.89 | 0.90 | 0.94 | 0.90 | 51 | 1.79 | 1.87 | 1.94 | 1.83 | 1.96 | 1.88 |
| 2 | 0.84 | 0.94 | 0.89 | 0.90 | 0.94 | 0.90 | 52 | 1.80 | 1.97 | 1.88 | 1.96 | 2.03 | 1.93 |
| 3 | 0.84 | 0.94 | 0.89 | 0.90 | 0.94 | 0.90 | 53 | 1.91 | 1.91 | 2.05 | 1.98 | 2.12 | 1.99 |
| 4 | 0.84 | 0.94 | 0.89 | 0.90 | 0.94 | 0.90 | 54 | 1.95 | 1.85 | 1.97 | 1.89 | 2.22 | 1.97 |
| 5 | 0.84 | 0.94 | 0.89 | 0.90 | 0.94 | 0.90 | 55 | 2.07 | 1.77 | 2.01 | 2.07 | 2.20 | 2.02 |
| 6 | 0.84 | 0.94 | 0.89 | 0.90 | 2.85 | 1.28 | 56 | 1.90 | 2.06 | 2.22 | 2.04 | 2.06 | 2.05 |
| 7 | 0.84 | 0.94 | 0.89 | 3.54 | 2.89 | 1.82 | 57 | 1.87 | 1.97 | 2.06 | 2.22 | 2.24 | 2.07 |
| 8 | 0.84 | 0.94 | 3.35 | 3.17 | 3.18 | 2.30 | 58 | 2.00 | 1.92 | 2.24 | 2.13 | 2.27 | 2.12 |
| 9 | 0.84 | 3.89 | 3.01 | 2.52 | 2.91 | 2.64 | 59 | 1.97 | 2.15 | 2.24 | 2.27 | 2.34 | 2.19 |
| 10 | 0.84 | 2.69 | 2.76 | 2.93 | 2.73 | 2.39 | 60 | 2.07 | 2.00 | 2.27 | 2.26 | 2.28 | 2.18 |
| 11 | 2.58 | 3.11 | 3.20 | 2.56 | 2.69 | 2.83 | 61 | 2.31 | 2.04 | 2.19 | 2.30 | 2.37 | 2.24 |
| 12 | 2.47 | 2.39 | 2.81 | 3.02 | 2.87 | 2.71 | 62 | 2.13 | 2.18 | 2.18 | 2.39 | 2.58 | 2.29 |
| 13 | 1.88 | 2.46 | 2.69 | 2.65 | 2.66 | 2.47 | 63 | 2.07 | 2.32 | 2.22 | 2.27 | 2.51 | 2.28 |
| 14 | 2.22 | 2.13 | 2.17 | 2.43 | 2.81 | 2.35 | 64 | 2.25 | 2.28 | 2.27 | 2.23 | 2.45 | 2.29 |
| 15 | 1.93 | 2.20 | 2.30 | 2.14 | 2.26 | 2.17 | 65 | 2.19 | 2.39 | 2.49 | 2.39 | 2.58 | 2.41 |
| 16 | 2.24 | 2.31 | 2.68 | 1.98 | 2.35 | 2.31 | 66 | 2.38 | 2.37 | 2.47 | 2.62 | 2.54 | 2.47 |
| 17 | 2.23 | 2.12 | 2.35 | 2.53 | 2.42 | 2.33 | 67 | 2.35 | 2.30 | 2.50 | 2.49 | 2.65 | 2.46 |
| Percentile AGI | Avg. income to needs | Percentile AGI | Avg. income to needs | ||||||||||
|---|---|---|---|---|---|---|---|---|---|---|---|---|---|
| 1994 | 1995 | 1998 | 1999 | 2000 | 5-year average | 1994 | 1995 | 1998 | 1999 | 2000 | 5-year average | ||
| 18 | 1.86 | 2.09 | 2.25 | 1.96 | 2.11 | 2.06 | 68 | 2.44 | 2.45 | 2.58 | 2.58 | 2.71 | 2.55 |
| 19 | 2.27 | 1.95 | 2.53 | 2.02 | 1.80 | 2.12 | 69 | 2.38 | 2.41 | 2.66 | 2.72 | 2.76 | 2.59 |
| 20 | 1.60 | 1.74 | 1.69 | 1.70 | 1.81 | 1.71 | 70 | 2.50 | 2.61 | 2.74 | 2.77 | 2.75 | 2.67 |
| 21 | 1.50 | 1.90 | 1.72 | 1.44 | 1.73 | 1.66 | 71 | 2.55 | 2.55 | 2.83 | 2.80 | 2.79 | 2.70 |
| 22 | 1.58 | 1.65 | 1.73 | 1.49 | 1.57 | 1.60 | 72 | 2.52 | 2.56 | 2.75 | 2.56 | 2.82 | 2.64 |
| 23 | 1.36 | 1.59 | 1.44 | 1.44 | 1.35 | 1.44 | 73 | 2.57 | 2.63 | 2.76 | 2.91 | 2.98 | 2.77 |
| 24 | 1.20 | 1.41 | 1.34 | 1.39 | 1.51 | 1.37 | 74 | 2.69 | 2.60 | 2.80 | 2.96 | 3.00 | 2.81 |
| 25 | 1.29 | 1.29 | 1.33 | 1.28 | 1.44 | 1.33 | 75 | 2.66 | 2.83 | 2.88 | 2.92 | 2.96 | 2.85 |
| 26 | 1.24 | 1.32 | 1.29 | 1.60 | 1.63 | 1.42 | 76 | 2.69 | 2.84 | 3.00 | 3.03 | 2.99 | 2.91 |
| 27 | 1.22 | 1.37 | 1.31 | 1.43 | 1.24 | 1.32 | 77 | 2.88 | 2.79 | 3.06 | 2.98 | 3.15 | 2.97 |
| 28 | 1.26 | 1.43 | 1.27 | 1.45 | 1.38 | 1.36 | 78 | 3.10 | 2.87 | 3.19 | 3.05 | 3.17 | 3.07 |
| 29 | 1.32 | 1.27 | 1.52 | 1.31 | 1.42 | 1.37 | 79 | 3.01 | 3.01 | 3.25 | 3.32 | 3.16 | 3.15 |
| 30 | 1.26 | 1.52 | 1.47 | 1.37 | 1.48 | 1.42 | 80 | 3.04 | 3.05 | 3.16 | 3.17 | 3.25 | 3.13 |
| 31 | 1.42 | 1.39 | 1.35 | 1.51 | 1.43 | 1.42 | 81 | 3.06 | 2.97 | 3.32 | 3.54 | 3.33 | 3.25 |
| 32 | 1.35 | 1.27 | 1.62 | 1.55 | 1.39 | 1.44 | 82 | 3.04 | 3.17 | 3.17 | 3.52 | 3.30 | 3.24 |
| 33 | 1.34 | 1.48 | 1.48 | 1.52 | 1.48 | 1.46 | 83 | 3.16 | 3.16 | 3.47 | 3.66 | 3.52 | 3.39 |
| 34 | 1.27 | 1.34 | 1.37 | 1.52 | 1.46 | 1.39 | 84 | 3.32 | 3.09 | 3.37 | 3.42 | 3.44 | 3.33 |
| 35 | 1.38 | 1.60 | 1.44 | 1.48 | 1.51 | 1.48 | 85 | 3.28 | 3.15 | 3.47 | 3.57 | 3.47 | 3.39 |
| 36 | 1.57 | 1.60 | 1.75 | 1.72 | 1.55 | 1.64 | 86 | 3.44 | 3.49 | 3.60 | 3.49 | 3.68 | 3.54 |
| 37 | 1.45 | 1.62 | 1.69 | 1.54 | 1.50 | 1.56 | 87 | 3.49 | 3.44 | 3.58 | 3.79 | 3.57 | 3.58 |
| 38 | 1.52 | 1.51 | 1.62 | 1.59 | 1.65 | 1.58 | 88 | 3.59 | 3.59 | 3.86 | 3.87 | 6.02 | 4.18 |
| 39 | 1.44 | 1.45 | 1.75 | 1.49 | 1.59 | 1.54 | 89 | 3.64 | 3.61 | 4.05 | 3.91 | 6.02 | 4.24 |
| 40 | 1.51 | 1.53 | 1.56 | 1.62 | 1.72 | 1.59 | 90 | 3.75 | 3.70 | 4.09 | 5.41 | 6.02 | 4.59 |
| 41 | 1.51 | 1.56 | 1.62 | 1.65 | 1.69 | 1.60 | 91 | 3.77 | 3.66 | 6.05 | 5.41 | 6.02 | 4.98 |
| 42 | 1.54 | 1.52 | 1.60 | 1.71 | 1.79 | 1.63 | 92 | 3.85 | 3.90 | 6.05 | 5.41 | 6.02 | 5.05 |
| 43 | 1.55 | 1.47 | 1.63 | 1.54 | 1.75 | 1.59 | 93 | 4.10 | 4.20 | 6.05 | 5.41 | 6.02 | 5.16 |
| 44 | 1.56 | 1.76 | 1.58 | 1.65 | 1.75 | 1.66 | 94 | 4.15 | 4.21 | 6.05 | 5.41 | 6.02 | 5.17 |
| 45 | 1.52 | 1.59 | 1.78 | 1.66 | 1.82 | 1.68 | 95 | 4.15 | 7.00 | 6.05 | 5.41 | 6.02 | 5.72 |
| 46 | 1.71 | 1.67 | 1.69 | 1.72 | 1.81 | 1.72 | 96 | 4.15 | 7.00 | 6.05 | 5.41 | 6.02 | 5.72 |
| 47 | 1.61 | 1.71 | 1.82 | 1.76 | 1.92 | 1.76 | 97 | 4.15 | 7.00 | 6.05 | 5.41 | 6.02 | 5.72 |
| 48 | 1.73 | 1.62 | 1.77 | 1.78 | 1.87 | 1.76 | 98 | 4.15 | 7.00 | 6.05 | 5.41 | 6.02 | 5.72 |
| 49 | 1.79 | 1.77 | 1.83 | 1.79 | 2.02 | 1.84 | 99 | 4.15 | 7.00 | 6.05 | 5.41 | 6.02 | 5.72 |
| 50 | 1.90 | 1.89 | 1.94 | 1.99 | 1.93 | 1.93 | 100 | 4.15 | 7.00 | 6.05 | 5.41 | 6.02 | 5.72 |
NOTES: Table C-2-2 shows the average income-to-needs of children by their position in the AGI distribution and when including children identified as independent tax filers (i.e., non-dependents) based on the Census Tax Model in the dataset. See O’Hara (2004) for a discussion of the Census Bureau’s Tax Model. See Table C-2-1 for results excluding minor filers from this analysis. AGIs are determined based on the total AGI of the tax unit claiming each child in the ASEC-CPS data from IPUMS-CPS (2022) and matched to income-to-needs ratios based on data from the Historical SPM Data Series (Wimer et al., 2022).
SOURCE: Produced with data representative of 1994, 1995, 1998, 1999, and 2000 from the Historical SPM Data Series (Wimer et al., 2022) and ASEC-CPS data from IPUMS-CPS (2022).
Historical Trends in Absolute Mobility
Data
A key challenge in measuring mobility historically is the lack of longitudinal (panel) data that could allow researchers to link children to their parents and construct measures of mobility analogous to those discussed above. Chapter 11, which covers research needs, discusses ongoing efforts to remedy this problem by linking historical census data (the American Opportunity Study). Lacking such data at the time, Chetty et al. (2017) develop a method of estimating absolute mobility—the share of children who earn more than their parents—using currently available cross-sectional historical data on income distributions. Note that their method cannot be used to construct measures of relative mobility historically, nor can it be used to measure mobility across subgroups or areas reliably. We therefore focus here on their analysis of national trends in mobility.
To measure absolute mobility over time in the United States, Chetty et al. (2017) use data from the decennial U.S. Census and CPS to estimate marginal income distributions for children in the 1940 to 1984 birth cohorts and for their parents. Marginal income distributions at age 30 for these children are obtained from the CPS March 1970 to March 2014 samples. The sample of children comprises U.S.-born members of the 1940 to 1984 birth cohorts who, at age 30, were present in the United States and not institutionalized. We compute household income as the sum of spouses’ personal pretax income.
Parents’ income distributions for children in each of the 1940 to 1984 birth cohorts are constructed by pooling data from census cross sections between 1940 and 2000, using the 1% IPUMS samples, and focusing on individuals who have children between ages 16 and 45. To cover all parents via decennial censuses, parents’ incomes are estimated when the highest earner is between ages 25 and 35, a symmetric window around age 30. For example, the income distribution of parents of children in the 1970 birth cohort is estimated as follows. First, the authors use the 1970 census and select parents between ages 25 and 35 who have a child younger than age 1 in 1970. Next, they turn to the 1980 census and select parents between ages 26 and 35 who have 10-year-old children (i.e., individuals who had a child in 1970 when they were between ages 16 and 25). Third, to identify parents between ages 35 and 45 who had children younger than age 1 in 1970, they turn to the 1960 census and select all individuals ages 25–35. This last group receives a weight equal to the fraction of individuals in the 1970 census between ages 35 and 45 who had a child younger than age 1 in
1970.7 Income distributions for parents with children in other birth cohorts are estimated analogously.
In their baseline series, which we show in Figure 2-10, Chetty et al. adjust for inflation using the benchmark CPI-U-RS. Choices of the inflation index can affect measures of absolute mobility significantly, as pointed out by Strain (2020) and by others; Chetty et al. demonstrate that the qualitative conclusion of declining absolute mobility is robust to reasonable choices of the inflation index, but the magnitudes of the decline remain debatable.
Methods
Chetty et al. (2017) focus on a measure of absolute mobility to address the question: “What fraction of children born in a given year (e.g., 1940, 1970) grow up to have a household income that exceeds that of their parents?” To do so, they combine children’s and parent’s marginal income distributions constructed as described above with a nonparametric rank-rank copula that measures relative mobility. This copula is a 100 × 100 matrix, where each (i,j) cell in the matrix indicates the probability that a child born to parents with income percentile i will grow up to have income percentile j.
The copula is constructed using modern tax records based on near-population data in Chetty et al. (2014a). The sample used to construct the copula comprises children in the 1980 to 1982 birth cohorts who are linked to parents by being claimed as dependents on federal income tax forms. This comprises more than 10 million parent-child pairs. To construct the copula, children’s and parent’s income are first measured using concepts similar to those described above. For tax filers, income is defined as adjusted gross income plus the nontaxable portion of Supplemental Security Income and Social Security Disability Income. For non-filers, income is the sum of W-2 wage earnings, Supplemental Security Income, Social Security Disability Income, and unemployment insurance income. If individuals’ incomes are missing in these data, they are assigned a value of zero. Children’s incomes are mean income in 2011 and 2012 (when they are between the ages of 30 and 32) and parents’ incomes are mean taxable income between 1996 and 2000, the first 5 years for which population tax records are available.8
To produce their baseline series of absolute mobility—shown in Figure 2-10—Chetty et al. apply the copula estimated for the 1980 to 1982 cohorts
___________________
7 This approach assumes that the income distribution of those who have children after age 35 is representative of the income distribution of the general population. Chetty et al. (2017) show that results are robust to restricting attention to parents who have children between ages 25 and 35.
8 Parents are between ages 30 and 60 when we measure their incomes. Since the distribution of income ranks is fairly stable between ages 30 and 60 (Chetty et al., 2014a), this approach provides a reasonable estimate of the copula that one would obtain using income ranks at age 30 for all parents.
to all cohorts, effectively assuming that relative mobility did not change across cohorts. Using children’s and parent’s marginal income distributions, for each child’s income percentile rk and parent’s income percentile rp, they calculate whether children at rk earn more than parents at rp. The copula provides the probability that each children-parent rank pair (rk, rp) occurs. They then measure absolute mobility as the fraction of cases where children at rk earn more than parents at rp, integrating over the copula.
The strong assumption of constant relative mobility over time is based on evidence from Chetty et al. (2014b) that relative mobility has remained stable overall in recent cohorts. Furthermore, Chetty et al. show that their estimates of absolute mobility are insensitive to assumptions about the degree of relative mobility in early cohorts (in the 1940s and 1950s), since virtually all children out-earned virtually all parents in those cohorts, implying that absolute upward mobility rates were close to 100% during that time period irrespective of the degree of relative mobility.9
___________________
9 Formally, they compute bounds on absolute mobility using linear programming methods to search over all plausible copulas for the maximum and minimum levels of absolute mobility consistent with the marginal income distribution, and show that these bounds are very tight in early cohorts.
APPENDIX C: CHAPTER 3
RACIAL DISPARITIES IN INTERGENERATIONAL POVERTY
This appendix provides a much broader literature review on several of the topics discussed in Chapter 3 of the report. The titles of the sections below correspond to the section titles in the Chapter 3 text; two additional sections discuss gender issues and Black immigrants.
Patterns of Intergenerational Mobility by Race and Gender
As shown in Figures 2-4 and 2-5 in Chapter 2, Black women who grew up in low-income families attain rates of upward mobility that are equal to those of similar White women when measured by individual earnings (roughly 39% for both groups), but they are less upwardly mobile when measured by household income (26% vs. 47%). Meanwhile, Black men have lower rates of upward mobility than similar White men using both measures. (The difference in individual earnings mobility rates relative to White people of the same gender is similar for Native American men and women, whereas it is much larger for Black men than for Black women. Also, individual and household income mobility favors Native American men over Native American women.)
Chetty et al. (2020) find that Black men are less likely to be working, have lower wage rates, have lower educational attainment, and are more likely to be incarcerated than White men from similar family backgrounds. In exploring the correlates of these gaps between Black and White men, Chetty et al. rule out parental characteristics, family wealth, and ability differences as explanations, and instead write: “We conclude that neighborhoods with low poverty rates, high rates of father presence among blacks, and low levels of racial bias among Whites have better outcomes for black boys and smaller racial gaps” (p. 718).
Chetty et al. (2020, p. 747) note two implications of these gender differences. They write:
It is important to note, however, that this finding does not imply that the unconditional Black-White gap in women’s individual incomes will vanish with time. This is because Black women continue to have substantially lower levels of household income than White women, both because they are less likely to be married and because Black men earn less than White men (Online Appendix Figure V). As a result, Black girls grow up in lower-income households than White girls in each generation, leading to a persistent racial disparity in individual income for women even in the absence of an intergenerational gap in their individual incomes.
Nevertheless, the key to closing income disparities for both Black and White women is to close intergenerational gaps in income between Black and White men…. The model predicts that in the absence of intergenerational gaps for women, the steady-state gap for both women and men is proportional to the intergenerational gap in individual incomes for men.
The second statement above suggests a tight focus on policies and programs specifically for Black boys and men, even though the first statement identifies the cycle of intergenerational poverty for females, with Black girls each generation growing up in lower-income households than White girls in each generation. Ignoring investments in Black girls and women would maintain this cycle. The committee also highlights the importance of a relational, historical, intersectional, and (qualified) resilience approach to understanding these gendered patterns of Black-White disparities.
First, as stated in Chapter 2, the fact that Black women exhibit similar individual mobility but not household mobility as White women “is probably due to the fact that Black women are more likely than White women to live in single-parent families, and thus also more likely to be the main breadwinners in their families.” Since Black women are more likely to be heads of households than White women, their average socioeconomic position will be more disadvantaged than that of similar White women. Within coupled households (that are same-race and opposite-gender), Black women’s earnings act as compensatory for the relatively low earnings of Black men, whereas White men’s higher earnings compensate for the lower earnings of White women. Too close of a focus on Black men’s outcomes ignores the need for policies that support low-income Black girls and women in their need to generate even greater socioeconomic resources.
Second, the gendered contours of racial discrimination and racism are historically specific and change over time. Black women disproportionately experienced rape during slavery, whereas Black men disproportionately experienced lynching after slavery. The 15th Amendment, ratified in 1870, granted only Black men the right to vote, whereas Black (and White) women were disfranchised until 1920 with the ratification of the 19th Amendment. Black men and women both experienced racism in the labor market in the early- to mid-20th century, but Black women were disproportionately confined to domestic labor whereas Black men were relegated to unskilled blue-collar jobs (outside of agriculture). The historical violence, exclusion, and exploitation explored in this chapter were experienced differently by Black men and women. Similarly, the forms of discrimination and racism today are different and may yield different disparities across race and gender. For example, while low-income Black boys have lower rates of upward mobility than Black girls, Black men on average have substantially higher wealth levels than Black women (Chang et al., 2021).
While attention to Black men may be relevant to the narrow question of intergenerational income mobility, such a focus reflects a presentist bias regarding the changing nature of gendered racism and does not allow for discussions of policies and interventions that can support Black women’s mobility while also improving Black men’s outcomes.
Third, the comparison by race within genders obscures the fact that both Black and White women trail White men in achieving upward mobility. Roughly 39% of Black and White women who grew up poor rise to the top three quintiles of the individual income distribution as adults, compared with 54% of White men. Gender-based discrimination and what might be called “structural sexism” (Homan, 2019) reduces the socioeconomic mobility and well-being of all women (Ridgeway & Correll, 2004), just as structural racism negatively effects the outcomes of all Black people, with Black men and women showing different outcomes relative to White people in different domains (see, e.g., Kim, 2009; Paul et al., 2022). Only comparing Black women to White women and Black men to White men controls away the workings of racialized gender structures in education, health, housing, families, law, and the labor market. An intersectional approach recognizes that Black women from low-income backgrounds still do not enjoy the same opportunities for upward mobility as similar White men.
Finally, the performance of Black women also reflects their effort and resilience, and individual- and community-level protective factors. This success goes even further in some domains. For example, at every parental income level, Black women have higher college attendance rates than even White men (Chetty, 2020, p. 716). These outcomes are attained in spite of racism and discrimination (and sexism), not because racism and discrimination do not exist. Black girls are more likely than White girls to experience school discipline (Morris, 2016); less likely to be seen by adults as needing nurturing, care, and support (Epstein et al., 2017); and less likely to receive a substance abuse treatment referral in the juvenile justice system (Johnson et al., 2022), to name just a few examples. Yet they show greater achievement in some areas. Upward mobility is also not without its health costs. Research on “skin-deep resilience” has found that the positive mindsets and behaviors of upwardly mobile low-income youth pay off in educational attainment and other outcomes, but also take a toll on physiological health (Chen et al., 2020; Miller et al., 2015). This finding holds across race and gender, but studies have not looked simultaneously at the effortful striving required for upward mobility and experiences of racial (and gender) discrimination. The resilience shown by low-income Black girls who climb the socioeconomic ladder must be qualified by these factors and does not obviate a discussion of the contexts of discrimination and structural racism within which Black girls and boys grow up.
While the situation for Black boys and men merits specific policy interventions where appropriate, it is important that the success of some low-income Black girls and women not exclude them from policy attention. Racial disparities are group-based average differences in outcomes. However, because individual experience varies—often greatly—around the average, group averages by themselves tell us little about the specific characteristics of individuals. Instead, averages offer a way of describing the status of one group compared with another (National Academies, 2022b).
Defining Disparity, Inequality, Discrimination, and Structural Racism
Racial disparities illustrate the differences in rates, trends, or probabilities between White people and Black and Native American people in key life experiences that are relevant for upward mobility. For example, Black babies born to women with a high school diploma or less are 1.5 to 2 times as likely to have low birthweight as White children born to similar mothers (Pollack et al., 2021). Low birthweight is negatively associated with adult educational and labor market outcomes (Black et al., 2007; Conley & Bennett, 2000; Currie, 2009). The homes where infants spend their time are also deeply unequal environments. For example, 5.8% of Native American households lack complete plumbing, compared with only 0.3% of White households. Water access, quality, affordability, and infrastructure are not issues only plaguing low-income countries (Meehan et al., 2020), but instead disproportionately affect low-income Black and Native Americans in the United States (Almond et al., 2018; Deitz & Meehan, 2019; McDonald & Jones, 2017; Mueller & Gasteyer, 2021; Roller et al., 2019; Tanana et al., 2021), and contaminated water increases the incidence of infant low birthweight (Currie et al., 2013).
Furthermore, racial disparities are evident in, for example, exposure to environmental toxins (Lane et al., 2022; Taylor, 2014), proximity to pediatricians and primary care doctors (Gaskin et al., 2012; Kruse et al., 2016), availability of full-service grocery stores and healthy food (Pindus & Hafford, 2019; Walker et al., 2010), access to libraries and broadband internet (Burke, 2007; Dolcini et al., 2021), residence in high-poverty neighborhoods (Erickson et al., 2008; National Equity Atlas, 2019; Sampson et al., 2008), and attendance at schools with college-preparatory curricula (Rose & Betts, 2004; U.S. Department of Education Office for Civil Rights, 2016). It is the cumulative and intersecting nature of these disparate exposures over the life course that partially explains higher rates of intergenerational poverty.
Racial inequality encompasses a broader range of processes than that identified solely based on research on racial disparity. In the context of the criminal justice system, for example, studying race within this larger
framework on inequality has several advantages. According to National Academies (2022b, p. 29):
First, the decomposition of racial disparities into differential offending and differential treatment is placed in a larger social context in which the social structure outside the criminal justice system may influence offending, differential treatment within the system, and criminal justice policy design. Second, in the inequality framework, a reduction in disparity at a particular point may not reduce racial inequality in the broader community. Large racial inequalities in housing, jobs, and quality education can persist even if racial disparities in criminal justice contact are reduced.
In other words, racial inequality is often used to refer to system-level racial gaps whereas racial disparities are used to characterize differences in a single outcome or variable.
Studies of racial discrimination using statistical, audit, and experimental methods (Pager & Shepherd, 2008), as well as several meta-analyses, find clear patterns of racial discrimination against Black Americans in areas such as employment, housing, health and mental health care, criminal prosecution, conviction, and sentencing, consumer markets, and in children’s placement into gifted classes (Anwar et al., 2012; Bertrand & Mullainathan, 2004; Besbris et al., 2015; Card & Giuliano, 2016; Faber & Mercier, 2022; Gaddis, 2015; Ge et al., 2020; Kugelmass, 2016; O. Mitchell, 2005; Pager & Shepherd, 2008; Quillian et al., 2020a; Wu, 2016). There is less research on racial discrimination against Native Americans, but audit, self-report, and correlational studies show frequent experiences of discrimination across a range of settings (Abramson et al., 2015; Findling et al., 2019; Hurst, 1997; Puumala et al., 2016; Robert Wood Johnson, 2018; Stepanikova & Oates, 2017; Turner & Ross, 2004; Wilmot & Delone, 2010; Weber et al., 2018; however, see Button & Walker, 2020, which does not find employment discrimination in a large audit study). Discrimination is relevant for intergenerational poverty because it excludes Black people and Native Americans from access to and participation in contexts that enhance opportunities or exposes them to practices that reduce opportunity.
The term “racism” is sometimes used to describe individual dispositions linked to beliefs in racial stereotypes and negative sentiments against a racialized outgroup. Survey researchers have designed scales to measure racism among individual respondents (National Research Council, 2004), and psychologists have designed experiments to detect racial bias among research subjects (see, for example, Eberhardt et al., 2004; Geller et al., 2021). This evidence demonstrates the ways in which belief, sentiment, and cognition operate at the individual level to drive decision making and other behavior in a direction that is harmful to racialized outgroups. Beyond the
level of the individual, social organizations and institutions (e.g., neighborhoods, families, markets, health care systems) are often run or structured in a way that is harmful to racialized outgroups, even in the absence of individual-level racism. Scholars have described this configuration of social relations as “structural racism.”
Some scholars emphasize the historical character of structural racism, in which “whiteness, a privileged racial category justified by negative racist stereotypes, [is] passed down from generation to generation, so as to become acceptable, normal, and part of the public common sense” (Marable, 2001, p. 13; see also Rucker & Richeson, 2021). Whereas racial inequality describes (perhaps enduring and multidimensional) group-based differences, structural racism attributes such inequality to social organization and institutions. Against this background, structural racism is defined as the operation of race as an organizing social force to enact, codify, or enable the oppression of one or more groups. Once a society becomes racialized, invidious racial distinctions affect “social relations and practices” at “all societal levels” (Bonilla-Silva, 1997). Structural racism is not defined by individual bigotry, prejudice, or discrimination but rather is based on how social, economic, and political institutions of government and civil society are organized by law, policy, practice, and norms. In this way, the argument that posits structural racism as a force contends that inequalities by race occur specifically because of social and institutional factors that perpetuate racial inequality.
Understanding the historical roots of structural racism is crucial to recognizing its effects today and how it has evolved over time (Glenn, 2015; Harris, 1993). Structural racism is reflected in the distribution of political power, economic wealth, material conditions, and equal access to, or fair treatment by, social systems over time, from housing to health care to the criminal justice system (Feagin & Elias, 2013). However, these impacts are neither linear nor constant. Since laws change and social forces are dynamic, shifting with politics, demographics, economics, and social movements, structural racism has evolved over time (see. e.g., Alexander, 2010).
A classic example of structural racism is the passage of voter disenfranchisement laws after the passage of the 15th Amendment. Laws establishing poll taxes, literacy tests, and grandfather clauses disproportionately excluded Black men from registering and casting a vote (Baker, 2022; Manza & Uggen, 2006). They were written without any explicit reference to race in order not to violate the 15th Amendment, which disallowed racial discrimination in voting. Yet their intentions to exclude Black voters were clear, and these laws produced large racial disparities in voter participation between White men and Black men, and often complete Black disenfranchisement. These disparities were the evidence of legally sanctioned second-class citizenship for Black Americans. The 24th Amendment to the Constitution
eliminated poll taxes, and the Voting Rights Act of 1965 added enforcement powers to combat the structural racism of ostensibly race-neutral disenfranchisement laws. Yet law and practice are not equivalent, and later policies, such as partisan redistricting, felon disenfranchisement, and voter identification restrictions have continued to disproportionately curtail the franchise for Black citizens. Thus, structural racism encompasses both those neutral policies that are motivated by racist intent and those that reinforce racial hierarchies resulting from past intentional racism, regardless of motivation (Roithmayr, 2014).
Researchers have developed novel measures to study contemporary structural racism, including one that combines indicators of political participation, employment and job status, educational attainment, and judicial treatment (Lukachko et al., 2014). In this study, structural racism is defined by state-level racial disparities across those four domains. Using this measure, the researchers found that Black people living in states with high levels of structural racism were more likely to experience myocardial infarction relative to their counterparts living in states with low levels of structural racism (Lukachko et al., 2014). Another group of researchers developed a measure of state-level structural racism that combines indicators of residential segregation, incarceration rates (though not adjusted for crime), educational attainment, economic indicators, and employment status. This latter study found that higher levels of structural racism were associated with a larger disparity between Black and White victims of fatal police shootings (Mesic et al., 2018; National Academies of Sciences, Engineering, and Medicine [National Academies], 2021).
A final illustration of structural racism is how ostensibly objective artificial intelligence algorithms produce racially disparate outcomes (Benjamin, 2019; Noble, 2018). Obermeyer et al. (2019) document how such algorithms in health care result in doctors providing fewer medical interventions and less care for Black patients. Manifold structures in American society—e.g., the tax code, criminal fines and fees, and the child welfare system (Brown, 2021; Jacobs, 2014; U.S. Commission on Civil Rights, 2017; Williams, 2022)—have built-in, unstated stereotypes, biases, and rules that contribute to the ongoing impoverishment of Black and Native American people.
Contemporary scholars view racial inequality as at least partly structural, cumulatively generated through the mutual and reciprocal interaction of institutions (Powell, 2008; Ray, 2019; Sampson, 2012; Williams & Collins, 2001; Wilson, 1987). The mechanisms of structural racism today can be (although they are not always) found in an array of public policies such as zoning laws and in the pricing of goods and services, as well as in credit risk scoring to limit access to loans or rental housing (using income, zip codes, and arrest records). Still, it is often the case that contemporary forms
of structural racism can be traced back to racially exclusive or racially targeted policies and practices of earlier moments in history.
The National Academies noted in a 2017 report on racial health disparities (National Academies, 2017d, p. 104):
Though inequities may occur on the basis of socioeconomic status, gender and other facts, we illustrate these points through the lens of racism, in part because disparities based on race and ethnicity remain the most persistent and difficult to address. Racial factors play an important role in structuring socioeconomic disparities; therefore, addressing socioeconomic factors without addressing racism is unlikely to remedy these.
Historical Roots of Racial Disparities in Intergenerational Mobility
As noted in the main text, Native Americans and Black Americans stand out as groups subjected to centuries of structural racism rooted in beliefs about White supremacy. The notion of intergenerational poverty has a presentist bias, a narrow time band, and a limited definition of well-being. In other words, we measure only economic status (wages, income, wealth), across at most three generations, in the most recent time period for which we have the best economic data. For example, research on multigenerational poverty finds that 1 in 5 Black families experience poverty across three generations, compared with roughly 1 in 100 White families (Winship et al., 2021; also see Collins & Wanamaker, 2022; Pfeffer & Killewald, 2018). A much longer historical view, however, shows that African and Native American peoples were not “poor” before European contact, but rather sustained themselves and often prospered for millennia in complex societies with functioning governing and economic systems (Carlos et al., 2022; Rodney, 2018).
The plunge into poverty and its persistence across generations in what became the United States is the result of successive waves of theft, destruction, and exploitation of people, land, and property into the present. Among the most glaring forms of historical structural racism that set Black and Native Americans on a course of socioeconomic disadvantage relative to other groups are (a) forced migration and land theft, (b) chattel slavery, labor exploitation, and property theft, (c) scientific racism, and (d) forced assimilation and legalized racial discrimination enforced by racially oppressive institutions. These mechanisms are discussed in detail in the sections that follow.
Forced Migration and Land Theft
The core of European colonialism along the Atlantic coast, and later throughout what would become the United States, was the removal of Native Americans in order to control the land and its riches. Indian wars, removal, and dispossession were the foundations of early policies of land acquisition as European colonizers and later settlers moved westward. Indigenous tribes, whose presence on or possession of land and property lay in the path of White expansion, were often defined as savages or bandits by nature and as criminals by law or custom. Tactics for seizure of Native lands included “threatening genocide, offering bounties for Indian scalps, and exacting massively disproportionate revenge for Indian atrocities” (Kiernan, 2007, p. 310).
Because of incomplete Native land-transfer records, it has proven challenging to fully evaluate the claim that Native Americans lost their land largely through market mechanisms rather than by force (Banner, 2005). However, critics of this contention point to rich documentation of the converse, showing that “Indian nations were forcibly removed, subjected to military containment, deceived by treaties, and defrauded of their landed birthright by unscrupulous non-Indians” (Geisler, 2014, p. 58). Treaties were binding primarily on the Native tribes only, and many were rescinded, unilaterally amended, or annulled without notifying Native leaders. Geisler (2014) concluded that:
though there were pragmatic moments in which Anglo-Americans found it in their interest to pay Indians for land rather than mount armies against them, the longue duree is a different story… Indians in America lost their land through coercion muted by market-like negotiations on some occasions and coercion without pretense on others (pp. 58–59).
Box C-3-1 highlights the experience of the Sauk people.
The practice of impoverishing Native Americans continued through law and force. The Louisiana Purchase (1803), the Indian Removal Act (1830), the Homestead Act (1862), and the Dawes Act (or General Allotment Act, 1887), among many others, authorized through various measures the occupation and expropriation of Native territories.
The Homestead Acts were a series of laws passed between the mid-1800s and the 1930s by which an applicant could acquire ownership of government land, the most well-known (and first) being the Homestead Act of 1862, which accelerated the settlement of western territory. These acts played out on Native lands taken by conquest and coercive pacification, bringing few monetary rewards to Native people (Geisler, 2014). By 1934, some 270 million acres in 160 tracts, nearly 10% of all the land in
BOX C-3-1
History of Land Dispossession and the Sauk Tribe
In the late 18th century, the Sauk, Fox, and Meskwaki people lived in what is now Illinois, Wisconsin, and Iowa. They established migratory cycles of hunting and planting to take advantage of the rich natural resources. According to Rigal (2009, p. 207–208):
During the summer, they lived in multi-family lodges, in large, relatively permanent summer villages situated on river terraces or flood plains along the river. There they harvested corn, squash, and other crops planted in the rich soil of bottomlands replenished by frequent floods. In those days, the Iowa River was lined with marshy sloughs that filled with water whenever the river rose. As a result, the river valleys (unlike the open prairie) gave rise to an abundance of trees and plant cover that could shelter and support large animal populations throughout the year. Every fall, as cold weather approached, Poweshiek’s and Wapashashiek’s villages broke up into smaller family units that dispersed to winter hunting camps, usually in sheltered creek valleys. There they harvested muskrat, raccoon, otter, deer, and occasionally beaver. In the early spring, these hunting groups reunited, first to make maple sugar in the stands of maple trees that flourished throughout the watershed and then to reconstitute their summer villages along the Iowa River, plant their crops, and begin the cycle anew. Similar seasonal cycles had been followed by Native peoples in the western Great Lakes and Upper Mississippi River Valley for at least 2,000 years.
However, by the 1800s large numbers of White American settlers began to arrive. In the spring of 1829, while the Sauk families were away from their summer villages in Saukenuk in western Illinois, where the Rock and Mississippi rivers converge, White settlers moved in and “enclosed nearly all the Sac Indians [sic] cornfields,” wrote a colonial officer at the time. He continued: “The Indians on their arrival were surprised
the United States, had been given away to more than 1.4 million claimants, virtually all of whom were White (approximately 3,500 Black people received land), for a trivial filing fee (Merritt, 2016). Claimants took legal possession of the land after 5 years, conditional on 5 years of continuous residence on the land, building a home, and farming the land. As of 2000, an estimated 46 to 93 million people were descendants of families who took up this “free land” (Shanks, 2005) and the wealth it has generated.
The General Allotment Act (or the Dawes Act) of 1887 aimed to allot federal lands to individual Native American families for private ownership. Its execution, however, resulted in the transfer of roughly 27 million acres of tribal land to non-Native owners (Royster, 1995), a checkerboard ownership pattern frustrating tribal governance and development, and a fractionated pattern of ownership between multiple heirs and the federal government. Comparing a Minnesota reservation that was allotted to one that was not, Akee (2020) found that allotment decreased Native American homeownership and displaced people into wage labor as opposed to
at this, as also the destruction committed by the settlers, by tearing down many of their lodges” (quoted in Wallace, 1982, p. 270). Sauk leader Black Hawk wrote of the incident in his autobiography describing: “I received information that three families of whites had arrived at our village, and destroyed some of our lodges, and were making fences and dividing our cornfields for their own use… I immediately started for Rock River, a distance of ten day’s travel, and on my arrival, found the report to be true. I went to my lodge, and saw a family occupying it” (quoted in Pratt, 2001, p. 116).
This band of Sauk families left for the hunting season and returned to find that White settlers had appropriated their land, fields, and homes. This process was repeated across the territory. By 1832, Black Hawk and the Sauk people were defeated and displaced west of the Mississippi River. Whereas they had once thrived on the richness of the land, “In less than a decade, their ancient way of life was in ruinous decline. Hunger and want had become common, as had drunkenness and debt” (Trask, 2007, p. 3).
Although the tribes were forcibly relocated to Kansas and Oklahoma, dozens of families moved back to Iowa in the 1850s. Today, the Sac and Fox Tribe of the Mississippi in Iowa maintain a settlement of over 8,000 acres and have 1,450 enrolled tribal members (https://www.meskwaki.org/history/). This story of dispossession, impoverishment, despair, and resilience expands the chronology, scope, and relevant variables for a contemporary discussion of intergenerational poverty. The economic productivity of Sauk cornfields and the real property of their lodges were stolen through duplicitous “treaties” and White settler occupation, all enforced by violence. Their poverty ensued, despite ongoing valiant efforts at reconstituting their cultural and economic wealth.
SOURCE: Committee generated.
self-employed farming from 1900 to 1910. Leonard et al. (2020) found in a national study of allotted lands that fractionation was associated with decreased per capita income among Native Americans as recently as 2000. Frye and Parker (2021) show that tribal areas with constrained sovereignty over their lands—one result of the Indian Reorganization Act of 1934—have lower per capita incomes. Contemporary forms of discrimination and dispossession are illustrated in the withholding of loans to Native American (and Black) farmers and ranchers, resulting in disproportionate foreclosure and property loss (Carpenter, 2012), and in the higher prices of mortgage loans to Native American home buyers (Cattaneo & Feir, 2021).
The Indian Appropriations Act of 1851 created the U.S. reservation system, which increased the government’s control of Native American people and natural resources and expanded territories for White settlements. In the first of several appropriation acts, funds were allocated to move Native people living in the West onto reservations. Most Native lands today are trust lands, meaning the federal government holds the legal title to the
land, and that Native tribes or individual tribal members lack ownership and control over the land.
More recently, in the 1950s and 1960s, Congress passed 12 “termination” bills, which ended federal responsibilities for tribes in several states and turned over governing power to the states. By 1957, 2.5 million acres had been removed from federal trust protection (Philp, 1983, p. 166). However, federal trust protection is itself no protection against dubious practices of extraction (Fixico, 2011), as illustrated by a $3.4 billion settlement with the U.S. government in Cobell v. Salazar (2009), which found that the Department of Interior and other agencies had breached their trust obligations with hundreds of thousands of Native American plaintiffs in the class. Overall, roughly 56 million acres are held in federal trust as Native reservations, a mere fraction of the 1.9 billion acres that make up the contemporary United States, once occupied by Native peoples.
In all, Native Americans experienced a 98.9% reduction in their access to land from the period of European arrival to the present. The remaining lands are more susceptible to climate risks and less abundant in mineral resources than the territory on which they historically resided (Farrell et al., 2021). These collective experiences of dispossession remain salient. Whitbeck et al. (2004) report that roughly 42% of a sample of Native American respondents in the U.S. Midwest and Canada think about this loss of land at least monthly, and greater proportions think about the loss of language, spiritual ways, and culture.
Chattel Slavery, Labor Exploitation, and Property Theft
The story for Black Americans begins not with land dispossession but with theft of labor and personhood. The first enslaved Africans arrived to what would become the United States in the early 1500s (Guasco, 2014; Johnson, 1923), prior to the 1619 English settlement at Jamestown, Virginia. The Anglo-centered history records slavery as flourishing in the United States for 244 years until the Emancipation Proclamation of 1863, though the timeline is likely much longer given bondage on U.S. shores decades before 1619 and for 2 years after 1863.
Indentured servitude began in early colonial America in response to the need for labor. Most indentured servants were poor Europeans—Irish, Scots, and English—but some were Africans who had been sold into bondage. Typically, servants worked off their indentures and were freed 4 to 7 years after they began. During the earliest years of settlement, no slave laws were in place. However, with increasing demands for labor, rising costs of indentured servants, and increasing demands for land from newly freed servants, colonists established laws in the mid-1600s to hold Africans and their descendants in perpetual servitude. Statutes decreed slavery as a lifelong
and heredity condition and enslaved people as the legal property (i.e., chattel) of their “owners” to be bought, sold, traded, or willed as owners wished (Bridgewater, 2005; Franklin, 1969). This system made labor more profitable and readily renewable across generations. Laws ensured that any children born to an enslaved woman belonged not to the mother but to the White man who owned the mother. Enslavers’ biological children—born of the rape of enslaved women—had no legal right to any of the father’s property, which was ordinarily granted via paternity (Bridgewater, 2005).
When the 13th Amendment was adopted as part of the U.S. Constitution in 1865, officially abolishing chattel slavery, the newly freed people had no land, capital, or equipment for farming. Ida B. Wells, a well-known Black journalist who lived in the late 19th and early 20th century, aptly summed up the situation, noting that the end of slavery left Black people “homeless, penniless, ignorant, nameless, and friendless… We were turned loose to starvation, destitution, and death” (cited in Darity & Mullen, 2020, p. 9). After leading the Union army to victory over the Confederate states, General Sherman ordered the redistribution of 400,000 acres of land along coastal areas of South Carolina and Georgia (40 acres and a mule per family) to help newly freed Black individuals gain economic independence. Shortly thereafter, President Lincoln’s successor Andrew Johnson rescinded the order, and the land remained in White possession (Darity & Mullen, 2020; Saito, 2020). Darity and Mullen (2020) argue that had Sherman’s order been carried out, it “would have dramatically reversed black asset poverty and reduce blacks’ economic vulnerability across generations” (p. 175).
Just as the economic prosperity stolen from Native Americans through land and people theft is incalculable, so are the profits wrought from slavery, which touched every colonial and U.S. institution, from law to the economy to social mores to universities. Economic historians estimate that the present value for lost wages during the period of slavery range from $2.1 to $4.7 trillion, not accounting for land loss or the opportunity costs of educational and discriminatory practices (Darity & Mullen, 2020; Marketti, 1990). Labor exploitation and the stealing of property, land, and assets from Black Americans continued after the formal dissolution of slavery. Between 1865 and the beginning of World War II, Black Americans in the South experienced widespread labor theft and exploitation reminiscent of slavery that impoverished generations of Black families (e.g., through sharecropping, convict leasing, and peonage; Blackmon, 2008; Carper, 1976; Mancini, 1996). Sharecropping was a system of land tenancy in the South that kept Black people working the land they had worked as enslaved people. With little to no capital of their own, they could not even afford the provisions to plant and were thus forced to buy them on credit from White landowners, with agreements to repay the costs upon harvest. Planters kept Black tenants in perpetual debt through unfair contracts and accounting
practices, backed by Jim Crow laws that accorded few to no rights to Black people and by White terrorist violence. Box C-3-2 illustrates the experience of a sharecropper in Florida in the 1920s.
The forced labor of prisoners, overwhelmingly Black men, was also rampant during this period. In southern states in the period after the Civil War—and in compliance with the 13th Amendment that allows for “involuntary servitude” in the case of criminal conviction—southern jurisdictions arrested and convicted hundreds of thousands of Black men and some women (LeFlouria, 2015) and sold their labor to private corporations without pay, or with remuneration going to the local government. To replace the social controls of slavery removed by the Emancipation Proclamation, state legislatures in the south passed an array of interlocking laws referred to as “Black Codes” in 1865–1866 that barred Black citizens from voting, serving on juries, testifying against White people in court, and working in skilled jobs. These laws criminalized many aspects of Black daily life (e.g.,
BOX C-3-2
Labor Exploitation Through Sharecropping
Journalist Isabel Wilkerson (2011, p. 54) recounts a story told by George Swanson, whose family sharecropped in Florida in the 1920s. Swanson’s uncle tried in vain to negotiate on equal footing. Wilkerson writes:
“During the lull before harvest time, one of George’s uncles, Budross, went to the little schoolhouse down in the field and learned to read and count. When it came time to settle up over the tobacco George’s grandmother Lena had raised, the uncle stood by while the planter went over the books with her. When they got through, George’s uncle spoke up.
“‘Ma, Mr. Reshard cheatin’ you. He ain’t addin’ them figures right.’
“The planter jumped up. ‘Now you see there, Lena, I told you not to send that boy to school! Now he done learn how to count and now done jumped up and called my wife a lie, ‘cause my wife figured up these books.’
“The planter’s men came and pistol-whipped the uncle right then and there.
“The family had to get him out that night. ‘To call a white woman a lie,’ George said, ‘they came looking for him that night. They came, fifteen or twenty of them on horseback, wagon.’”
In cases like these, not only was the sharecropping family cheated out of their harvests or wages, but they were also forced to flee their homes, taking as much as they could but losing their property and productive investments in the cultivation of the land. Even greater violence ensued if Black people organized against the theft of the sharecropping system. Two hundred Black people were massacred in Elaine, Arkansas, in 1919, after organizing a union to bargain for fair wages (Stockley, 2004).
SOURCE: Committee generated
unemployment, indigency, and disrespect of White people were made illegal) to provide pretexts for jail terms. Black people were often unable to pay even minor fines and, as a result, were sentenced to labor (Carper, 1976; Mancini, 1996).
In his book, Slavery by Another Name, Douglas Blackmon defines convict leasing as “a system in which armies of free men, guilty of no crimes and entitled by law to freedom, were compelled to labor without compensation, were repeatedly bought and sold, and were forced to do the bidding of white masters through the regular application of extraordinary physical coercion” (2008, p. 4). Supposed convicts were sold to work in mines, on railroads, on plantations, and in timber fields. The system was highly profitable for private firms who paid no wages and for the state systems that sold the labor of people convicted of “crimes.” One contract to the Walker Coal and Iron Company in Georgia in 1874 “called for the leasing of 100 prisoners for five years at $11 per convict per year” (Mancini, 1978, p. 341), or about 7 cents per day, when the average daily wage for miners in the United States at the time was $1.97 (Abbott, 1905, Table XII).
Convict leasing was used not only to enrich private and public coffers but also to impoverish newly freed Black people. Sociologist Christopher Muller (2018) shows that in Georgia after emancipation, Black imprisonment in the convict lease system for property crimes increased most in parts of the state where Black people were gaining an economic foothold through valuable land ownership and leaving sharecropping through urban residence, while White incarceration remained steady. White southerners used punishment as a method to interrupt this progress and to instead return Black men and some women to the status of unpaid laborers. Not only did disproportionate incapacitation stymie economically productive activities, but convict labor was essential to the South’s agricultural production and industrialization, and it enriched the jailers and their jurisdictions.
Even Black Americans who were able to escape this exploitative system had to contend with discriminatory laws and lending practices that largely barred Black people from land ownership, apprenticeship programs for skilled training, trade unions, and other routes to upward mobility (Lancaster, 2000). During Reconstruction (1865–1877), the period after the Civil War when efforts were made to reintegrate Confederate states and redress the inequities of slavery, Black Codes were abolished. However, after Reconstruction ended, many of the provisions of these codes were reenacted in Jim Crow laws. Adopted in southern states in the 1870s and 1880s and enforced until 1965, Jim Crow laws legalized and mandated racial segregation in all public facilities (e.g., schools, transportation, hospitals, prisons, morgues), relegating Black people to inferior treatment, jobs, and facilities (Franklin, 2013; Lancaster, 2000).
Contemporary labor exploitation continues within prisons. While there is some contracting of prisoner labor to private industry, the majority of this labor benefits federal, state, and local governments, lowering the costs of operating prisons and distorting the true costs of mass incarceration. The American Civil Liberties Union (ACLU) and the University of Chicago Law School’s Global Human Rights Clinic (2022) estimate that incarcerated people “produce more than $2 billion a year in goods and commodities and over $9 billion a year in services for the maintenance of the prisons where they are warehoused” (p. 6). Yet they are paid nearly nothing. Private companies, on the other hand, extract revenues through negotiated contracts for high-priced services targeted at prisoners, such as food, telephone, and internet communications (Lara-Millan, 2021). This unpaid labor represents resources that are not passed on to children of incarcerated people, most of whom are living in poverty. Using the ACLU/University of Chicago assumption of 6.5-hour workdays (across industry types) for 22 workdays per month, if 400,000 workers were paid the 2022 federal minimum wage of $7.25/hour, and 20% of their wages were passed through to the custodial parents for care of their children, that would be ([6.5 × 22 × 12 × $7.25] × 400,000) × 0.2 = $995,280,000 of income for their families.
One historical example of property theft concerns The Freedmen’s Bank, which was established after the Civil War in lieu of land reparations and as a way to integrate Black families into the national economy. Signed as The Freedmen’s Bank Act of 1865 by President Abraham Lincoln, it established a bank that served more than 60,000 Black depositors across 34 branches just before its demise in 1874 (Hunter, 2018). The bank’s White managers advertised aggressively in Black publications while using the deposits for risky investments in railroads and unsecured loans. Legal scholar Mehrsa Baradaran (2017, p. 29) writes, “As one white observer explained, the white managers, entrusted with guarding the meager savings of the freed slaves, ‘looted the bank’.” The economic crisis of 1873 was the final straw, and the bank failed in 1874. The deposits were not federally guaranteed, and only 62% of the more than $3 million in deposits (or roughly $76 million in 2022 dollars) was ever repaid (Hunter, 2018). Half of the Black people with holdings in the bank got nothing (Washington, 1997). Stein and Yannelis (2020, p. 5374) show the effects of this asset destruction over the long run, finding that “African Americans in the present day who live in counties that once had a Freedman’s Savings Bank branch are more likely to list mistrust of financial institutions as a reason for being unbanked; this association is not present for Whites.”
There was also property destruction in places of Black urban settlement. In the late 1890s, Black people made up more than half of Wilmington, North Carolina. They were relatively prosperous and had significant representation in the city government, having been enfranchised during
the Reconstruction era. In 1898, White residents staged what historians now label as a violent coup in order to regain power (Zucchino, 2020). Estimates are that between 60 and 250 Black people were killed. The economic effects were evident in Black employment and labor status. All of Wilmington’s Black city workers were fired and replaced by White employees. The number of Black business owners declined, and Black businesses were disproportionately displaced from the downtown area (Hamilton & Darity, 2006).
The economic toll is even more quantifiable for the Tulsa massacre of 1921, in which as many as 300 Black people were killed. White mobs—deputized and armed by the local police—destroyed roughly 35 acres of the Greenwood section of the city, called Black Wall Street for its concentration of thriving Black-owned businesses (Messer et al., 2018). The Oklahoma Commission to Study the Tulsa Race Riot of 1921 (2001) reported claims for property damage of $1.8 million, or nearly $30 million in today’s dollars. Messer et al. (2018) figure that if the same 1,256 homes were destroyed in Tulsa in 2018, the cost would be roughly $150 million. None of the property claims were ever repaid to Black families.
This historical violence and property loss reverberates in present-day socioeconomic well-being. Albright et al. (2021) show that the Tulsa massacre lowered the occupational status of Black Tulsans into the 1940s and lowered their homeownership rates up to 2000, the last year of observations. Moreover, Black homeownership rates were also lower in Black areas across the country that received significant newspaper coverage of the Tulsa massacre. Just as the failure of the Freedman’s Bank made Black people leery of banks (Stein & Yannelis, 2020), the Tulsa massacre “provided a warning of the danger of the accumulation of wealth through home ownership” (Albright et al., 2021, p. 31) that has persisted for decades. In addition to the reverberations from historical forms of expropriation, more recent and contemporary practices of asset extraction are manifest through the racially disparate use of eminent domain (U.S. Commission on Civil Rights, 2014), unfair property tax assessments (Atuahene & Berry, 2018), and Black home loss through foreclosure and institutional purchases (Hwang, 2019), just to name a few.
Scientific Racism
During the mid to late 1600s, race ideology developed as justification for White supremacy, land theft and genocidal wars against Native peoples, and permanent enslavement of Black people. Native people were regarded as fierce, as evil, as savages fated by God for conquest, and Black people as inferior subhumans without capacity for reasoning, imagination, and sentiment (Franklin, 1969; Smedley, 1998; Stannard, 1992). Science played
a supporting role in hardening early folk beliefs among White colonists and settlers about “race” and inequality. From the 18th century and well into the 20th century, anthropologists, biologists, and psychologists developed techniques to measure differences in physical characteristics as a basis for racial classification and subordination (Gould, 1996). For example, during slavery, a physician invented the diagnosis of “drapetomania,” a mental illness hypothesized to cause enslaved Africans, who were thought to be naturally servile, to flee captivity, for which the prescribed treatment was severe whipping (Opara et al., 2022). “Studies” using these techniques purported to confirm the inferiority of Black and Native people, and to support the belief that “White blood” increased the mental capacity of Black and Native children of mixed racial backgrounds (Guthrie, 1976; Smedley & Smedley, 2005).
Integral to the social construction of race ideology that developed during this period was the valuation of phenotypic traits associated with European ancestry and the devaluation of those associated with non-White people, biases that exist to this day among Black Americans (e.g., Adams et al., 2016; Maddox & Gray, 2002) as well as some Native tribal groups (Brown et al., 2018). Color and phenotypic hierarchies established during slavery also cast a long shadow in establishing practices of anti-Blackness (Franklin, 1969; Frazier, 1957). Studies have found that lighter skin tone among Black people is positively correlated with socioeconomic outcomes (Monk, 2021), higher self-esteem among Black youth (Adams et al., 2020), attribution of more positive traits (Maddox & Gray, 2002), lower rates of school suspension, better physical health, greater upward mobility, and increased odds of full-time employment and college attendance (Han, 2020; Hannon et al., 2013; Hargrove, 2019; Keith & Herring, 1991; Ryabov, 2013). Analyzing archival records of capital murder cases, Eberhardt et al. (2006) showed that defendants whose appearance was perceived as more stereotypically Black were significantly more likely to receive a death sentence than defendants whose appearance was perceived as less stereotypically Black, controlling for numerous factors. Persistent skin tone stratification illustrates the lasting effects of the ideologies created to justify racism and colonialism.
Forced Assimilation and Legalized Racial Discrimination
The original U.S. constitution directed that for purposes of representation and taxes, the population would be determined “excluding Indians not taxed, [and including] three fifths of all other Persons.” This separation and erasure of Native Americans and sub-humanization of Black people is built into the fabric of the United States and has clear contemporary manifestations, such as in the “willful blindness toward Native American
victimization” by law enforcement (Perry, 2006, p. 412; also see Fryberg & Stephens, 2010), and the digital association of Black people with apes in facial recognition internet searches (Noble, 2018, p. 6).
Anti-Indigeneity undergirded a variety of U.S. government policies that pressured Native Americans to assimilate. The Dawes Act of 1887, for example, authorized a division of tribal lands into individual plots to encourage Natives to farm and ranch like White homesteaders (https://www.nps.gov/articles/000/dawes-act.htm). Laws such as the Civilization Fund Act of 1819 funded schools and forced Native children to attend boarding schools where displays of Native culture and identity were forbidden. By 1925, some 60,000 Native children—about 80% of Native school-age children—had been forced to attend boarding schools. In keeping with the philosophy of assimilation, “Kill the Indian, Save the Man,” children in these schools were forbidden to speak their native language, wear traditional clothes (which were replaced by uniforms), or perform tribal practices (replaced by Christian practices). Long hair was cut, braids were prohibited, and tribal names were replaced by English-language names (Adams, 1995; Pember, 2019). Contact with family and community members was discouraged and sometimes forbidden altogether (Adams, 1995; American Indian Relief Council, n.d.; Pember, 2019). Evidence of abuses of students in off-reservation boarding schools led to passage of the Indian Child Welfare Act in 1978, which gave Native parents the legal right to refuse their child’s placement in off-reservation schools. Many large Native boarding schools closed in the 1980s and early 1990s. Some located on reservations were taken over by tribes. Still, as of 2021, 15 such boarding schools remain open (Blakemore, 2021; National Native American Boarding School Healing Coalition, 2020).
Forced assimilation is a form of structural racism whose psychological consequences for Native Americans is the focus of a growing number of studies. Compared with all other racial groups, Indigenous youth and adults have higher rates of suicide, substance use disorders, and mental health problems. Research has linked these disparities to both current and historical racial discrimination (Skewes & Blume, 2019) or “historical trauma,” conceptualized as “cumulative emotional and psychological wounding over the lifespan and across generations, emanating from massive group trauma experiences” (Yellow Horse Brave Heart, 2003, p. 7). The wounds include the loss of religion, language, and culture—as experienced by Native youth removed from their families to live in boarding schools—as well as loss of ancestral homelands.
Observational work suggests that Native parents who are alienated from Native cultural and spiritual traditions may be less able to provide their children with a supportive, nurturing family environment, putting their children at increased risk for mental and substance abuse disorders (Zimmerman &
Shannon, 2013). Evans-Campbell et al.’s (2012) study of Native Americans found that former boarding school attendees, compared with non-attendees, reported higher rates of current illicit drug use, alcohol use disorder, suicidal ideation, and attempted suicide. In addition, adults raised by former attendees of boarding schools, when compared with their counterparts, were more likely to have an anxiety disorder, PTSD symptoms, and suicidal thoughts in their lifetime. In a similar vein, there is evidence of deleterious multigenerational effects of relocation experiences on Indigenous families. In Walls and Whitbeck’s (2012) longitudinal study, grandparent-generation participation in government relocation programs, in which reservation-dwelling Native Americans moved to large urban areas for vocational training and job opportunities, not only harmed the well-being of the grandparent generation (e.g., alcohol and drug problems, depressive symptoms) but also rippled downward to harm the mental health of the parent and youth generations. These studies suggest that historical trauma could contribute to higher rates of intergenerational poverty among Native Americans by undermining the psychological functioning and nurturing capacities in the grandparent and parent generations, in turn increasing substance use and mental health problems in the child generation that ultimately lower educational and occupational attainment and reduce upward mobility.
For Black Americans, slavery and Jim Crow laws throughout the United States continued to shape economic and social opportunity with lasting impacts into the present day. Baker (2022) finds that a composite measure of Black people’s state-level exposure to slavery, sharecropping, disenfranchisement, and resistance to desegregation is significantly correlated with contemporary Black poverty and Black-White disparities in poverty. Similarly, Althoff and Reichardt (forthcoming) find that the socioeconomic status of Black families today depends strongly on their historical exposure to racially oppressive institutions. Research (Althoff & Reichardt, 2023) shows that Black people whose ancestors were enslaved up until the Civil War have lower education, income, and wealth today as compared with Black people who were free before the Civil War. While the direct effects of enslavement on these families continued through 1940, the ongoing effects are due to the disproportionate exposure to Jim Crow laws among those families who were enslaved until the Civil War. Thus, state-specific factors perpetuated the socioeconomic disparities that slavery had created among Black families. According to Althoff and Reichardt (forthcoming, pp. 3–4), Black families freed in states with more oppressive regimes experienced significantly lower rates of economic progress starting in the Jim Crow era (1877–1964). For example, consistent with Louisiana’s Jim Crow regime being far stricter than Texas’s, we find that families freed in Louisiana attained 1.2 fewer years of education by 1940 than families freed only a few miles away in Texas. The magnitudes of those border discontinuities are
virtually identical to the general state differences in how families fared after slavery, suggesting that Jim Crow single-handedly shaped the geography of Black economic progress. Althoff and Reichardt (2023, p. 5) conclude: “This result implies that systemic discrimination—the higher exposure to ongoing discrimination because of past discrimination (Bohren et al., 2022)—is at the core of the persisting legacy of racially oppressive institutions in the US.”
Contemporary Drivers of Racial Disparities in Intergenerational Poverty
As with the section above, we offer additional discussion and detail about some but not all of the domains covered in the main text, and add an additional section on Black immigrants. The first two subsections here are titled to correspond with their respective section in the main text.
Crime, Victimization, and Criminal Justice
Slavery and colonialism are intertwined systems of racialized economic oppression to benefit those in power. Power is maintained through violence and the threat of violence, often justified under the guise of punishment for supposed wrongdoing or crime (for historical overviews on punishment against Black and Native people, see Ross [2010], Thompson [2019], Ulmer & Bradley [2019], Hinton & Cook [2021]). Early regimes of punishment against Black and Native Americans were manifested in the physical acts of whippings, scalpings, and murders, and also in economic practices of dispossession and indebting. There was punishment for slow work, punishment for speaking one’s native language, punishment for playing musical instruments, punishment for leaving or staying on designated lands (territories, plantations, reservations, hunting grounds), punishment for reading or refusing to read, and punishment for using resources from the land for survival (Ross, 2010). Punishment is linked to intergenerational poverty because it limits or eliminates the ability of the parental generation to invest in children economically, socially, psychologically, and culturally. When state punishment is enacted against children, it stifles their educational, psychological, and economic growth.
The historical relationship between punishment and economic disfranchisement has been illustrated above through the example of convict leasing. Punishment was similarly used against Native Americans as a pretext for economic and land dispossession. California Statute Chapter 133 of 1850—very wrongly named “An Act for the Government and Protection of Indians”—deputized White settlers as police, judge, and jury, with the purpose of expropriating labor. The text of the law makes clear the connection
between criminal punishment and economic exploitation authorized in the 13th amendment:
When an Indian is convicted of an offence before a Justice of the Peace, punishable by fine, any white man may, by consent of the justice, give bond for said Indian, conditioned for the payment of said fine and costs, and in such case the Indian shall be compelled to work for the person so bailing, until he has discharged or cancelled the fine assessed against him (quoted in Teran, 2016, p. 24).
Unlike the convict leasing system in the South, individual settlers were enriched by the labor of supposedly criminal Native Americans, who were in turn deprived of the ability to sustain themselves and their families. A frequent grounds for conviction was the “hunger offense of stealing cattle” (p. 26), a crime that resulted from the systematic elimination of Native American food sources (Ross, 2010). In 1861, in Northern California, several hundred Native American men were killed for stealing cattle. In similar cases, the wives and daughters of slain Native American men were taken by White settlers for forced sexual and physical labor.
Law is used strategically to define “crime” in ways that facilitate the maintenance of power and economic hierarchies. Punishment against Black and Native peoples can be exacted to extract labor and land, or for managing periods when their labor was not required (Muller & Schrage, 2021; Western et al., 2006). The “crimes” for which punishment has been levied have been in response to Black and Native people’s attempts at bodily, cultural, economic, and spiritual freedom. These historical practices of shaping law and defining crime in anti-Black and anti-Indigenous ways reverberate today in widespread stereotypes about Black and Native lawlessness, disorder, aggression, and criminality (Muhammad, 2019; Ross, 2010), which justify tough-on-crime policies that target Black and Native communities for policing, punishment, and removal from their families and communities, including through supposedly supportive institutions such as schools and the child welfare system (Jacobs, 2014; Roberts, 2022).
This brief history challenges a common starting point when discussing race, crime, and punishment: the notion that Black and Native people commit more crime and therefore experience more punishment. The definition of crime and the accordant punishments are themselves tools of control—from the vagrancy and trespassing laws of the 19th century to the continued 18-to-1 sentencing disparity between crack and cocaine possession. Even using conventional definitions of crime, there appears to be a
weak and small relationship between an individual’s race and many areas of self-reported offending (Sohoni et al., 2021).
Disparities in incarceration rates between White and Black people are longstanding, dating back to the earliest record keeping in the 1800s. Figure C-3-1 (from Muller, 2012) compares Nonwhite and White incarceration rates from 1880 to 1950 (separate data for Blacks are not available). At the beginning of the time period, the Nonwhite incarceration rate is roughly two times the White rate, while by the end of the time period the gap had widened, with the Nonwhite rate roughly five times the White rate. The ratio (or disparity) of the Black:White incarceration rates peaked at about 7:1 in the early 2000s (National Research Council, 2014), and has declined to roughly 5:1 in the most recent period (Nellis, 2021). In other words,
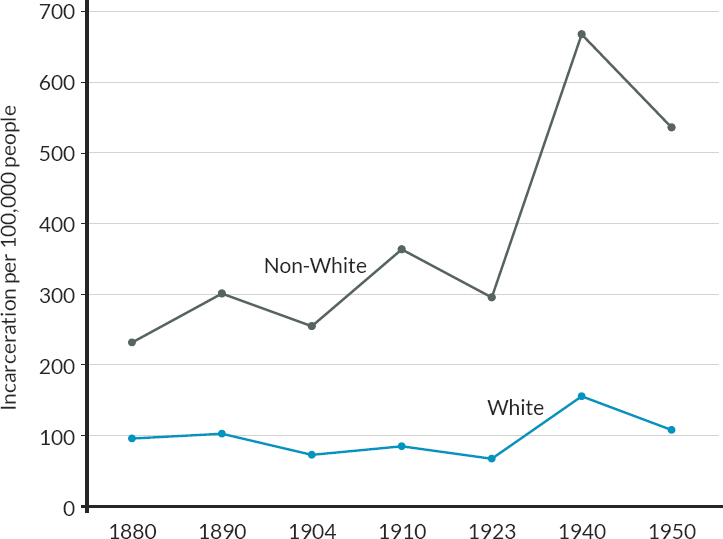
NOTES: The states included in the analysis are northern and southern U.S. states. Northern states include Connecticut, Illinois, Indiana, Maryland, Massachusetts, Michigan, Missouri, New Jersey, New York, Ohio, Pennsylvania, and Wisconsin. Southern states include Alabama, Arkansas, Florida, Georgia, Kentucky, Louisiana, Mississippi, North Carolina, Oklahoma, South Carolina, Tennessee, and Virginia.
SOURCE: Data from Muller (2012). The underlying data from the graph were obtained using the software WebPlotDigitizer. https://automeris.io/WebPlotDigitizer/
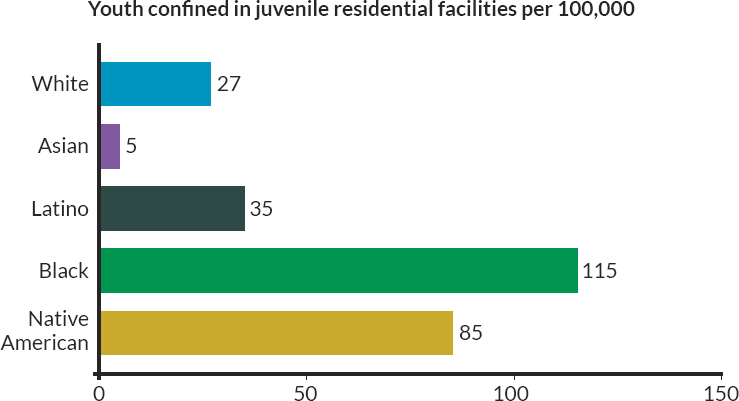
NOTE: Youth are defined as persons 17 years old and younger.
SOURCE: Data from the Prison Policy Initiative (2021).
contemporary Black/White disparities in incarceration are roughly equal to what they were in 1950. Figure C-3-2 shows that contemporary racial disparities in incarceration rates are also evident for juveniles, with Native and Black juveniles experience much higher rates than White, Asian, and Latino youth.
Racial disparities in offending and cumulative disadvantages across multiple domains reverberate through the stages of criminal processing (e.g., policing, arrest, prosecution, sentencing, incarceration) to produce racial inequality in the criminal justice system (Alexander, 2010; National Academies, 2022b). Researchers have discussed three policy changes that have been important for how structural racism has contributed to these racial disparities in the criminal justice system. The first policy change, collectively known as the War on Drugs, intensively criminalized drug use and drug sales disproportionately in Black communities (Provine, 2011; Tonry, 1996; Tonry & Melewski, 2008). The punitive effect of the War on Drugs can be seen in the increasing probability of imprisonment given a drug arrest and the growing share of people in prison convicted of drug crimes (Beck & Blumstein, 2018; Blumstein & Beck, 1999; Tonry & Melewski, 2008). Given the large racial disparity in drug arrests and prison
admissions, the growth in drug incarceration also tended to increase the racial disparity in incarceration through the 1980s and 1990s. The second major policy change contributing to racially disparate criminalization was the War on Crime, which encompassed a variety of changes in sentencing policy at the state and federal levels that increased the duration of prison sentences, particularly for violent offenses. Third, policing strategies changed in the final decades of the 20th century to focus more on crime prevention and to allocate resources more intensively to areas and people who were viewed as high risk (National Academies, 2022b).
Involvement in the criminal legal system has long-term economic effects for young people and adults. People with a conviction experience a cumulative loss of roughly $100,000 in earnings, and people who have experienced incarceration experience nearly $500,000 in lost earnings over their lifetime (Craigie et al., 2020). Incarceration and conviction have similar negative effects on wealth (Maroto, 2015; Schneider & Turney, 2015; Sykes & Maroto, 2016). Given the racial disparities in criminal justice processing, the negative effects on employment and earnings exacerbate racial gaps in socioeconomic outcomes (Gordon et al., 2021; Lyons & Pager, 2007; Pettit, 2011; Western & Sirois, 2019). There is little research on the socioeconomic outcomes after incarceration for Native Americans.
Housing and Neighborhood Environments
Racial disparities in housing are driven by the acts of both private citizens and state actors in coordinating efforts to exclude Black people from property ownership and White neighborhoods. For example, the Servicemen’s Readjustment Act of 1944, more commonly known as the GI Bill, offered preferred mortgage financing, tuition for college and vocational training, and enhanced unemployment benefits to returning veterans. While it was federal law, it was administered locally. Black veterans returning to the Jim Crow South in the 1940s, 1950s, and 1960s were denied access to mortgages—as well as to the college tuition benefits (Turner & Bound, 2003)—and thus to the wealth-enhancing possibilities of homeownership and education. Black veterans in the North faced less absolute exclusion, but the federally promoted practice of redlining (discussed in Chapter 3) similarly made the GI Bill widely inaccessible for broadly improving Black people’s housing situation (Agbai, forthcoming; Cohen, 2003; Delmont, 2022). Using conservative assumptions, Meschede et al. (2022) estimate that “Black veterans received at most 70% of the value that white veterans received,” and the gap was greatest for government spending on housing benefits.
Another example is racially restrictive covenants—agreements written into property deeds that prohibited owners from selling or renting to Black people and, in some places, other marginalized groups such as those of Mexican, Jewish, and Asian people (Jones-Correa, 2000). These agreements date from the late 19th century and were driven by antipathy to living near African Americans and by widespread assumptions that Black neighbors provoked falling property values. After racial zoning by municipalities was ruled unconstitutional in 1917 in Buchanan v. Warley, proponents read a 1926 Supreme Court decision in Corrigan v. Buckley as tacitly supporting private restrictive agreements. For example, one house in a White neighborhood in Chicago that abutted a growing Black neighborhood to the west was covered by two restrictive covenants—one in 1937 and another in 1944 (Pattillo, 2007). The covenant created an exclusionary bond and opened up any violators to legal action and damages. Racially restrictive covenants were supported and propagated by real estate boards, private institutions like universities, and federal agencies, even after the Supreme Court ruled them to be unenforceable in Shelley v. Kraemer (1948). There is no national accounting of the spread of these restrictive covenants, but Santucci (2020) documents at least 4,000 such agreements covering properties in Philadelphia alone, as just one example.
The federal government began to play a major role in housing policy after the Great Depression, creating a panoply of policies that reflected the racial prejudices and exclusionary biases of the era. The National Industrial Recovery Act (1933), the establishment of the Homeowners Loan Corporation (HOLC; 1933) and the Federal Housing Administration (1934), the U.S. Housing Act (1937), and the Servicemen’s Readjustment Act (the GI Bill that established “VA loans,” 1944) all set in motion a national building and financing program to stabilize the U.S. housing market and provide shelter for low- and moderate-income families and, later, for veterans returning from World War II.
The new regime of housing finance systematically disadvantaged African Americans. While working-class European-immigrant urban neighborhoods received low ratings in the rating system, their residents could assimilate and move into “White” neighborhoods where mortgage dollars flowed (Guglielmo, 2003). On the other hand, federal government guidelines warned against the presence of non-White residents. Historian Kenneth Jackson (1985) recounts the example of Lincoln Terrace in St. Louis. The development was intended for and marketed to middle-class White families but was unsuccessful in this plan, and Black families moved in. In 1937, even though the structures were only 10 years old, the federal HOLC gave the neighborhood its lowest rating and withheld mortgage financing, stating that it had “little or no value today, having suffered a tremendous
decline in values due to the colored element now controlling the district” (p. 200).
While the HOLC may have been relatively fair in some cities in apportioning home loans to Black households (Fishback et al., 2022; Hillier, 2003), the Federal Housing Authority (FHA) was certainly not. In Chicago in 1938, the Chicago Housing Authority created a map of mortgage-lending risk based on the FHA’s evaluations. The entirety of the city’s Black community was colored in red. The Chicago Housing Authority summarized the message of the map bluntly: “All Negro census tracts fall within the area where loans have not been made by the major loaning agencies, and loans will not be made” (quoted in Pattillo, 2007, p. 331).
Capitalizing on the exclusion of Black people from the conventional housing finance market, private investors created a shadow market selling “on contract” (Satter, 2009). White “sellers” retained the deed and imposed stringent requirements for maintenance and repayment. With the slightest infraction, owners repossessed properties and kept all of the payments made by the Black “buyer.” Contract selling extracted an estimated $3 billion (in 2019 dollars) in wealth from Black families in Chicago in the 1960s (Dubois Cook Center, 2019), and has re-emerged in the post-2008 housing collapse period in predominately Black cities like Atlanta (Immergluck, 2018).
The most recent episode of housing discrimination is the subprime and foreclosure crisis (Hwang et al., 2015; Rugh & Massey, 2010). In December of 2011, the U.S. Department of Justice issued a press release with the headline, “Justice Department Reaches $335 Million Settlement to Resolve Allegations of Lending Discrimination by Countrywide Financial Corporation; More than 200,000 African-American and Hispanic Borrowers who Qualified for Loans were Charged Higher Fees or Placed into Subprime Loans.” This was just one of many lawsuits and settlements to come.
Subprime loans are characterized by higher interest rates, payment plans that assume upward value trajectories, deferred or “balloon” payments, interest-only payments, prepayment penalties, and other complicated and disadvantageous arrangements that are often not fully disclosed or explained to the homebuyer. Contrary to the exclusionary practices wrought by redlining, predatory inclusion marks the targeting of Black households for financial instruments that prove detrimental to their socioeconomic well-being.
The rash of subprime lending eventually led to the foreclosure crisis. Black and Latino households were roughly twice as likely to be affected by foreclosure through home loss or serious arrears (Bocian et al., 2011), and Black and Latino neighborhoods were also disproportionately affected (Hall et al., 2015). Roughly 8% of Black households (240,000 households) lost their homes between 2005 and 2008 (Bocian et al., 2010). Disparities in
foreclosures and steep declines in housing values had a cascading effect on household wealth, since homes represent the major portion of most people’s wealth profile. The median net worth of Black Americans in the United States declined by 53% from 2005 to 2009 (and by an even larger 66% for Latino households), but declined by only 16% for White households. This represented a doubling of the racial wealth gap (Pew Research Center, 2011). The foreclosure crisis and recession were particularly pronounced among Black families with children, widening an already large Black-White wealth gap among such households. Percheski and Gibson-Davis (2020, p. 10) report that by 2016, “black child households had 1 cent of median wealth for every dollar of wealth held by non-Hispanic white child households.” The targeting of subprime mortgages to Black buyers negatively impacted Black wealth and Black neighborhoods, continuing a cycle of lowering household resources that might promote intergenerational mobility.
Comparisons with Black Immigrants
Although not included in the main text, a discussion of the socioeconomic status and mobility outcomes of Black immigrants offers additional evidence on racism and discrimination as drivers of intergenerational poverty. Black immigrants have been heralded as a “model minority” (Ukpokodu, 2018), and their success is often advanced as a counter-explanation for the poor social position of Black Americans. The logic goes like this: because both Black Americans and Black immigrants share similar phenotypic characteristics, both groups must suffer from similar levels of discrimination. Therefore, if Black immigrants can succeed despite the barriers of racism and discrimination, then cultural differences, rather than racism, must account for observed differences (Patterson, 2006, 2015; Sowell, 1979, 1981). Such arguments, however, omit important factors discussed here that help explain disparities between immigrant and native-born Black people (Hamilton, 2019; Model, 2008).
The Hart-Cellar Immigration Act of 1965 paved the way for large waves of Black immigrants to migrate to the United States (Portes & Rumbaut, 2014). In 1960, Black immigrants accounted for less than 1% of Black people residing in the United States. By 2010, almost 10% of Black people in the United States were foreign-born, a 10-fold increase in 50 years (Hamilton, 2019). When these new waves of Black immigrants arrived, scholars noted that some Black immigrants had better outcomes than Black Americans. For example, data from the 1980 U.S. Census showed that prior to adjusting for relevant human capital characteristics, Black immigrants from the English-speaking Caribbean were more likely to be in the labor force, had greater employment rates, and earned more than Black
Americans, findings that led some to conclude that culture, rather than racism, explained the poor outcomes of Black Americans (Sowell, 1979, 1981).
These early accounts of labor market disparities between Black immigrants and Black Americans severely overstated the advantages of Black immigrants. After controlling for a standard set of human characteristics, most subgroups of Black immigrants have similar or lower employment rates and earnings than Black Americans (Hamilton, 2019; Model, 2008). Black immigrants’ labor force participation rates are higher than those of Black and White Americans, which suggests that disparities in labor force participation likely result from different reservation wages between immigrants and natives, in general, rather than differences in cultural practices (Hamilton, 2019).
Early studies of labor market disparities between Black immigrants and Black Americans also ignored selection bias issues (Patterson, 2006; Sowell, 1981). Like other contemporary immigrants, Black immigrants are a self-selected group of movers (Feliciano, 2005; Feliciano & Lanuza, 2017; Hamilton, 2019; Model, 2008). Most Black immigrants are selected on a range of factors that are positively correlated with better labor market outcomes, including age, health, education, and social class position (Hamilton, 2019). For example, Black Jamaican U.S. immigrants have 13.13 mean years of education, compared with 9.64 years among individuals residing in Jamaica. Similarly, Nigerian U.S. immigrants have 15 mean years of education compared with 6 years among adults residing in Nigeria (Hamilton, 2019). Given the dramatic difference in the home country education distribution between the United States and most Black immigrant sending countries, most Black immigrants also occupy a more favorable social class position in their home country than in the United States (Feliciano, 2020; Hamilton, 2019). Studies have consistently found that the outcomes of Black immigrants are more similar to those of Black Americans who have also made a move across states since birth than to those of Black American nonmovers, which suggests that the favorable outcomes of Black immigrants result from unobserved factors associated with migration (both domestic and international) than from cultural differences between Black immigrants and Black Americans (Butcher, 1994; Hamilton, 2019; Model, 2008).
Any advantages experienced by Black immigrants do not apply to all Black immigrants, even those from the same region or country. For example, among Black women from the English-speaking Caribbean, early arrivals tended to have better labor market outcomes than more recent arrivals. Model (2008) argues that when the Hart-Cellar Act passed in 1965, there were relatively few immigrants from the English-speaking Caribbean residing in the United States to sponsor the visas of family members. As a
result, immigrants with skills needed in the United States were among the early drivers of migration after 1965. This fact generated a flow of women from the English-speaking Caribbean who were positive-selected on skills and education (many were employed in the health care sector) as well as risk taking and motivation, given that these women arrived in the country with a small or no established co-ethnic community. Over time, however, family reunification drove an increase in migration, which resulted in a less highly selected group of migrants.
Indeed, patterns of intergenerational mobility among immigrants highlight the role of contemporary discrimination in affecting the outcomes of Black immigrants. Using a century of U.S. censuses and contemporary tax records, Abramitzky and Boustan (2022) find that sons of immigrants raised in the bottom 25th percentile of the income distribution were in a more favorable position in the income distribution than the sons of U.S.born fathers. For the post-1965 immigration era, the only countries of origin whose immigrants’ sons were in a lower position than sons of U.S.born fathers were Haiti, Trinidad and Tobago, and Jamaica. Hence, Black immigrants differ from non-Black immigrants and seem to face similar barriers to upward mobility as Black natives.
| Driver | Program or policy example supported by direct evidence | Key reference(s) (and limitations) | Effect on Black people or mostly Black sample? | Effect on Latino people or mostly Latino sample? | Effect on Native American people or mostly Native American sample? |
|---|---|---|---|---|---|
| Education | |||||
| Early childhood | None identified in recent research | ||||
| K-12 education | Increase K-12 school spending in the poorest districts | Rothstein & Schanzenbach, 2022 | Significant impacts for Black students | Not assessed | Not assessed |
| Increase K-12 school spending | Johnson & Nazaryan, 2019; Johnson, 2011 | School funding is a mechanism by which school desegregation improves long-term outcomes for Black students | Not assessed | Not assessed | |
| Recruit Black teachers | Gershenson et al., 2022 | Significant impacts for Black students on high school graduation and college enrollment (for males) | Not assessed | Not assessed | |
| Driver | Program or policy example supported by direct evidence | Key reference(s) (and limitations) | Effect on Black people or mostly Black sample? | Effect on Latino people or mostly Latino sample? | Effect on Native American people or mostly Native American sample? |
|---|---|---|---|---|---|
| Reduce exclusionary school discipline | Bacher-Hicks et al., 2019 | Harsh disciplinary practices increase arrest and incarceration and school dropout, and decrease college enrollment, especially for Black and Latino males | Harsh disciplinary practices increase arrest and incarceration and school dropout, and decrease college enrollment, especially for Black and Latino males | Not assessed | |
| Develop Ethnic Studies courses | Bonilla et al., 2021 | Not assessed | Increases high school graduation and strong suggestive results for postsecondary enrollment | Not assessed | |
| Postsecondary education | Expand effective financial aid programs for low-income students and increase campus supports (such as tutoring and case management) | ASAP: Miller and Weiss, 2021; Buffett: Angrist et al. 2017; HAIL: Dynarski, 2022b | Significant impacts of ASAP for Black student attainment; significant impact of HAIL for Black students on application but not admission or enrollment | Significant impacts of ASAP for Latino student attainment; significant impact of HAIL for Latino students on application but not admission or enrollment | Not assessed |
| Career training | Expand high-quality career and technical education programs in high school and sectoral training programs for adults and youth | Fein et al., 2021 for Year Up; Roder & Elliott, 2019 for Project Quest | Significant impacts of Year-Up and Project Quest on earnings of Black youth | Significant impacts of Year-Up and Project Quest on earnings of Latinos | Not assessed |
| Child and Maternal Health | |||||
| Family planning | Increase funding for Title X family planning programs and ensure that Medicaid beneficiaries have access to family planning services | Bailey, 2013 does not show subgroup results by race/ethnicity | Not assessed | Not assessed | Not assessed |
| Health insurance | Expand access to Medicaid with continuous 12-month eligibility and 12-month post-partum coverage; expand access to Indian Health Service for all eligible mothers and children | Brown et al., 2020 does not show subgroup results by race/ethnicity | Wherry & Meyer (2016), larger improvements in life expectancy among Black children relative to White children | Not assessed | Not assessed |
| Pollution reduction | Support EPA to work with local partners to adopt and expand efficient methods of monitoring outdoor and—especially in schools—indoor air quality | Isen et al., 2017 document impacts for Black subsample; Currie et al., 2023 document the CAA disproportionately improved air quality among Black families | Significant impacts of pollution reduction on earnings of Black children; CAA accounts for 60% of the racial convergence in air pollution exposure in the United States since 2000 | Not assessed | Not assessed |
| Driver | Program or policy example supported by direct evidence | Key reference(s) (and limitations) | Effect on Black people or mostly Black sample? | Effect on Latino people or mostly Latino sample? | Effect on Native American people or mostly Native American sample? |
|---|---|---|---|---|---|
| Nutrition | Expand child access to existing nutrition programs for legal permanent residents and undocumented parents; increase WIC enrollment by extending infant certification, allowing adjunctive eligibility, and increasing remote access services | East, 2020 analysis of second-generation child health based on immigrant eligibility uses an 80% Hispanic sample | Not assessed | Significantly better birth outcomes for the children of women whose own mothers were eligible for WIC benefits when they were in utero | Not assessed |
| Family Income, Employment, and Wealth | |||||
| Work-based income support | Expand the Earned Income Tax Credit by increasing payments along some or all portions of the schedule and possibly by providing a credit to families with no earnings | Bastian and Michelmore, 2018 | Generally positive effects of EITC expansions on the educational attainment and earnings of Black children | Not assessed | Not assessed |
| Family Structure | |||||
| None identified by research to date | NA | ||||
| Housing and Neighborhoods | |||||
| Residential mobility | Expand coverage of the Housing Choice Voucher program and couple it with customized counseling and case management services | Bergman et al., 2019 do not show race/ethnicity-specific results or have majority-minority sample. | Not assessed | Not assessed | Not assessed |
| Neighborhood Crime and the Criminal Justice System | |||||
| Juvenile incarceration | Eliminate most or all juvenile detention and incarceration for non-felony offenses and for felony offenses, especially those that are nonviolent | Aizer & Doyle, 2015; Baron et al., 2023 | Significant negative effects of juvenile detention on the completed schoolings and adult crime for Black youth | Not assessed | Not assessed |
| Child investment strategies | Scale up evidence-based therapeutic interventions such as the Becoming a Man program; improve school quality and reduce lead exposure in ways identified in the education and health categories | Heller, 2017 uses a majority Black sample | Significant reduction in crime and increases in high school graduation for Black youth | Not assessed | Not assessed |
| Strengthen communities to reduce violent crime and victimization | Scale up programs that abate vacant lots and abandoned homes; increase grants to community-based organizations | Branas et al., 2018 sample was majority Black | Significant reductions in crime | Not assessed | Not assessed |
| Driver | Program or policy example supported by direct evidence | Key reference(s) (and limitations) | Effect on Black people or mostly Black sample? | Effect on Latino people or mostly Latino sample? | Effect on Native American people or mostly Native American sample? |
|---|---|---|---|---|---|
| Policing strategies | Expand funding for policing in high-crime neighborhoods and use of effective strategies like community policing | Chalfin et al., 2022 | Significant reductions in homicides for Black people | Not assessed | Not assessed |
| Reduce gun violence | Reduce access to guns in ways that pass constitutional review; promote child access prevention laws, restrictions on right-to-carry laws, limited access of domestic abusers, and sentencing add-ons for violence involving firearms. | DeSimone et al., 2013 do not show subgroup results for child protection laws; nor does Donohue et al., 2022 for right-to-carry laws, though the cities included in the analysis have large Black populations. | Not assessed | Not assessed | Not assessed |
| Child Maltreatment | |||||
| None identified by research to date | |||||
NOTES: ASAP = Accelerated Study in Associates Program; CAA = Clean Air Act; EITC = Earned Income Tax Credit; EPA = Environmental Protection Agency; HAIL = High Achieving Involved Leader program at the University of Michigan; WIC = Special Supplemental Nutrition Program for Women, Infants, and Children.
APPENDIX C: CHAPTER 4
CHILDREN’S EDUCATION
This appendix provides a broader literature review on several of the drivers discussed in Chapter 4 of the report, as well as on the interventions supported by direct or indirect evidence. In the case of early childhood interventions, we review the literature that led the committee to not propose any interventions.
Early Childhood Interventions
Several home visiting and early care and education programs have demonstrated long-term impacts on adult education, employment, incarceration, and health. In the case of contemporary early childhood programs, however, few rigorous evaluations have shown similar intermediate- or long-term impacts. Moreover, it is not clear how current programs might be changed in ways that would produce longer-term impacts. The committee was therefore unable to identify specific ways in which further investments in these programs, as currently implemented, would reliably reduce intergenerational poverty. This is not to say that all existing programs are ineffective or that additional investments during this childhood period are bound to fail, but simply that the current evidence base does not tell us how to make expansions of them succeed. Below we provide a review of the literature that leads us to our conclusions.
Home Visiting Programs
Home visiting programs typically involve trained professional or paraprofessional visitors who make regular visits to parents and young children. These home visitors coach parents, typically low-income mothers, on parenting during the prenatal period and early childhood years. As a prevention strategy, home visiting is designed to promote infant and child health, foster educational development, and help prevent child abuse and neglect. All 50 states have home visiting programs (Office of Planning, Research, and Evaluation, 2021). Some of these programs, like the Nurse Family Partnership home visiting program, have demonstrated long-term impacts on child outcomes like substance use and academic skills during the school years—impacts likely to reduce intergenerational poverty (Avellar & Paulsell, 2011).
The Patient Protection and Affordable Care Act of 2010 expanded federal funding for home visiting programs but also required that 75% of its funds be used for programs, and that the programs demonstrate their effectiveness in rigorous research studies. The Office of Planning, Research,
and Evaluation contracted to conduct a regular systemic review of home visiting research, the Home Visiting Evidence of Effectiveness (HomVee) review, and publish findings on its website (Avellar & Paulsell, 2011).
The 2021 HomVee review (Office of Planning, Research, and Evaluation, 2021) included 22 programs that reported statistically positive outcomes in randomized control trials (RCTs) or rigorous quasi-experimental studies. As of September 2021, the review included evaluations of 53 home visiting models, focusing on the 22 models that met the stringent Office of Planning, Research, and Evaluation criteria for evidence-based models. The impacts of those 22 programs on child outcomes were found to be ineffective much more often than effective: Approximately 130 impacts were “positive,” in 600 cases there was “no difference,” and in 7 cases the impact was “negative.” A broader look at the results shows limited evidence that programs changed parenting or child outcomes. Overall, they suggest that home visiting programs can, but typically do not, increase cognitive stimulation in the home and decrease the use of punitive, harsh punishment. Even when such programs are successful in changing parenting behavior, the size of their impacts is modest—about 0.10 standard deviations (Michalopoulos et al., 2019). In most cases, their positive impacts were limited to shorter-run improvements in birth outcomes, reductions in hospitalization, declines in behavior problems, or increased access to services like Temporary Assistance for Needy Families or Special Supplemental Nutrition Program for Women, Infants, and Children.
Table C-4-1 provides a broader overview of the HomVee results from the most promising home visiting programs that were evaluated between 2019 and 2020. Because the evaluations include so many parenting and child outcomes, we set a statistical significance threshold of p < 0.10 and simply count the number of impact coefficients that fall below that threshold. Given the nature of significance testing, we would expect to see 10% of the coefficients below p < 0.10 even if there were no true impacts.
Promising evidence of longer-term impacts on problem behaviors was reported for both the Nurse Family Partnership (NFP) and Attachment and Biobehavioral Catch-up–Infant (ABC). The NFP provides one-on-one home visits by nurses who focus on improving maternal and infant health and promoting family economic self-sufficiency during pregnancy and the child’s first 2 years. Follow-up studies of the NFP study participants in the early implementations of the programs showed reduced behavior problems at 15 years, reduced substance use at 12 years, and increased vocabulary and academic skills at 1 to 2 years post-intervention (Kitzman et al., 2010; Olds et al., 2002).
But these findings were not replicated in other NFP evaluation studies. As seen in Table C-4-1, a review of child impacts from a broader implementation of NFP found significant results less than 10% of the time—which
| Program cost per child per year | Positive parenting practices | Child development and school readiness | Reductions in child maltreatment | |
| Attachment and Biobehavioral Catch-Up | $7,000 to train parent coaches. Families receive 10 1-hour sessions | 11/23 | 8/19 | Not measured |
| Healthy Families America | $4,101a | 28/131 | 12/56 | 20/209 |
| Home Instruction for Parents of Preschool Youngsters | $4,246b | 1/1 | 11/49 | Not measured |
| Maternal Infant Health Program | $518c | Not measured | Not measured | 0/18 |
| Nurse Family Partnership | $6,000 (SC)–$9,600(NY)d | 7/37 | 13/142 | 7/26 |
| Parents as Teachers | $3,841e | 3/92 | 7/67 | 0/4 |
| Play and Learning Strategies (PALS) Infant | $3,206f | 1/13 | 6/14 | Not measured |
NOTES: ahttps://crimesolutions.ojp.gov/ratedprograms/200#programcost; bhttps://www.wsipp.wa.gov/BenefitCost/Program/748; cAdministration for Children and Families (2023); dwww.nursefamilypartnership.org/wp-content/uploads/2020/08/NFP-Benefits-and-Costs.pdf; ewww.wsipp.wa.gov/ReportFile/1020/Wsipp_Evidence-Based-Programs-to-Prevent-Children-from-Entering-and-Remaining-in-the-Child-Welfare-System-Benefits-and-Costs-for-Washington_Report.pdf; fhttps://www.utep.edu/education/cerps/_Files/docs/papers/CERPS_Working_Paper_2016_3.pdf
SOURCE: Adapted from Duncan et al. (2023).
could easily have occurred by chance. ABC–Infant provides trained parent coaches to mothers of infants, many of whom are either foster parents or parents deemed to be abusive. ABC focuses on promoting mutually responsive interactions by having parents and coaches watch videos of interactions together (Office of Planning, Research, and Evaluation, 2021). Follow-up studies of early implementations of ABC–Infant reported higher rates of attachment security at 9 years, higher levels of emotional regulation at 8 years, and higher vocabulary skills at 3 and 5 years (Raby et al., 2018; Zajac et al., 2019). Again, these promising findings were not replicated in other studies. Across all ABC-Infant studies, Table C-4-1 shows significant child impacts less than half of the time (Office of Planning, Research, and Evaluation, 2021).
An independent meta-analysis of home visiting programs, which was limited to randomized control trials (RCTs) and rigorous quasi-experimental studies, also showed mixed results (Fryer, 2016). Fryer (2016) concluded that home visiting, as currently implemented, was not generating statistically significant impacts on children’s development, perhaps partly because of problems conducting the regular visits with parents. Consistent with the HomVee review, he pointed out that widely touted programs like the NFP show promise in reducing child abuse and improving child outcomes, but even these programs show inconsistent findings of long-term impacts across follow-up studies (Fryer, 2016).
Some international at-scale programs have shown substantial impacts. For example, the Preparing for Life Program (Doyle, 2020) in Ireland incorporates home visiting, group parenting classes, and baby massage into an intensive 5-year intervention for economically disadvantaged Irish families. An RCT indicated the program raised children’s cognitive scores by two-thirds of a standard deviation and socioemotional/behavioral scores by one-quarter of a standard deviation. Earlier analyses indicated Preparing for Life improved parent-child interactions, cognitive stimulation, time use, nutrition, and discipline strategies, and these changes may mediate the cognitive gains but not the socio-emotional goals (Doyle, 2020).
In summary, home visiting is widely implemented in the United States. Careful evaluations of the funded programs in the country have yielded some promising findings but provide little cause for confidence that additional investments in scaled-up programs would consistently improve parenting and child outcomes. Some findings from a few programs in the United States and from programs in other countries provide evidence that home visiting programs can be successful, but further development is needed to develop at-scale home-visiting programs in the United States with sustained positive impacts.
Early Care and Education
Early care and education (ECE) programs are widely viewed as one of the most successful policy levers for promoting the educational success and social mobility of young children living in low-income homes (Heckman, 2011). Based in part on long-run evidence of early care and education programs impacts on adult outcomes, both state and federal governments have invested heavily in these programs to improve opportunities for children raised in poverty. The federal government spends about $9.66 billion annually to serve nearly 1 million infants, toddlers, and preschoolers and their low-income families (Barnett & Friedman-Krauss, 2016), and in 2019 state and local pre-kindergarten programs spent $8.75 billion to serve about
1.9 million preschoolers, most of whom are from low-income families (Friedman-Krauss & Barnett, 2020).
Perry and Abecedarian
The ability of intensive model programs to improve the life chances of disadvantaged children is illustrated by the well-known Perry Preschool and Abecedarian interventions. Perry was implemented in the 1960s in Ypsilanti, Michigan, while Abecedarian ran during the 1970s in Chapel Hill, North Carolina. Perry provided center care and home visiting to 65 3- and 4-year-olds from low-income Black families. The first Perry cohort received one year of program services, and the remaining four cohorts received 2 years. Costs across the five cohorts averaged $23,000 per child (Heckman et al., 2010). Heckman et al. (2010) estimate that the dollar value of benefits generated by the program amounted to between six and nine times the cost of the program, with benefits driven in roughly equal measure by increases in earnings and reductions in crime. When considering that high benefit/cost ratio, however, it is important to recognize that the home environments of the comparison group of children were of much lower quality relative to the home environments of today’s children. Only 21% of Perry mothers and 11% of Perry fathers had graduated from high school, and family sizes averaged 6.7—much larger than today (Schweinhart, 1993).1
Abecedarian provided considerably more services than Perry and over a much longer period. These included center care and pediatric care for about 100 low-income, predominantly Black children from 3 months of age to kindergarten entry. The per-child cost of this 5-year program has been estimated at $105,000 (García et al., 2021. Even given the program’s expense, its long-run benefits have been estimated to total more than six times its costs: More than two-thirds of the benefits were driven by crime reductions, and the remainder reflect differences in adult health and the
___________________
1 In the 1960s and 1970s, children from low-income families, especially Black children, faced conditions best described as deplorable. In the mid-1960s, the Food Stamp program and tax credit programs such as the Earned Income Tax Credit had not yet been introduced. Racial discrimination in parts of the country denied Blacks access to quality schools and hospital care, including childbirth in hospitals with a physician present. Parental schooling levels were much lower than they are today, and family sizes were much larger (Duncan & Magnuson, 2013). Today families, including low-income families, are about twice as likely to use child care, especially center-based child care (Duncan & Magnuson, 2013). These factors produced conditions that made it much easier for a Head Start or model program like Perry to demonstrate effectiveness for enrolled children when compared with children experiencing business-as-usual conditions. This explanation probably accounts, at least in part, for the fact that end-of-treatment impacts are substantially smaller in more recent evaluations (Duncan & Magnuson, 2013).
labor income of participants and their parents (the 5 years of full-time child care enabled parents to establish and maintain more continuous and higher-paying careers; García et al., 2020). As in the case of Perry, the low-quality nature of the home environments of children in the Abecedarian evaluation is reflected in the low average levels of mothers’ completed schooling (10.2 years), IQ (85.5), and age at their child’s enrollment (19.9 years; Ramey et al., 2000).
Both Perry and Abecedarian focused on encouraging adult-child interactions, hands-on learning activities, and frequent conversations between children and teachers (Schweinhart & Weikart, 1980; Ramey et al., 2012). The teachers, their supervisors, and researchers collaborated in developing the interventions and classroom activities that were later incorporated into many early childhood curricula. However, the evaluations were not designed to enable researchers to disentangle the separate contributions of these components to improving children’s development, and these programs differ in many ways from today’s early care and education programs (as discussed in more detail below).
Results from these two early RCT interventions provide convincing evidence that ECE programs can improve educational attainment, income, and health in adulthood (Heckman, 2011). The key policy and program issue for the committee is whether much larger-scale and less expensive versions of ECE programs—run or supervised by governments rather than researchers, provided to children from families with higher incomes and schooling levels, and living in communities with a much richer set of center-based child care options in programs that do provide the same types of educational experiences as Perry and Abecedarian—can generate impacts comparable to those of Perry and Abecedarian.
Head Start
Head Start began in 1965 as part of the War on Poverty and provided part-time center-based ECE to low-income children (Office of Headstart, 2023). It was offered to thousands of children in its early years, with a focus on promoting health and social skills. Strong quasi-experimental studies have demonstrated long-term benefits for children who attended Head Start during the period from 1965 to 1980 in terms of higher rates of college enrollment (Bailey et al., 2021; see also Johnson, 2011; Ludwig & Miller, 2007). Evidence from cohorts that entered Head Start in the 1980s and 1990s tends to show higher levels of education and reductions in special education and grade retention, even if impacts on academic and social skills fade out during elementary school (Deming, 2009; Garces et al., 2002).
Head Start has changed over time: It now provides longer hours of care, employs more teachers who have completed a bachelor’s degree, and includes a focus on promoting early academic skills (Office of Headstart, 2023). Evidence is mixed regarding the effectiveness of its more recent incarnations, which have been offered to low-income children in an environment with many more alternative center-based programs. The Head Start Impact Study (HSIS), a large RCT begun in 2001, was based on a random sampling of Head Start centers that reported waiting lists. HSIS showed consistent end-of-program impacts on language and literacy that faded out by third grade, no consistent impacts on math, and some mixed evidence on reducing problem behaviors (Table C-4-2, based on Puma et al., 2012).
A careful reanalysis of these data revealed larger gains for children who would not otherwise have used center care than for those who would otherwise have enrolled in other ECE centers, as well as for children who did not speak English at home (Feller et al., 2016; Kline & Walters, 2016). Finally, more recent analyses of adult outcomes suggest that the young-adult impacts reported for the earlier cohorts faded in later adulthood. Moreover, later Head Start cohorts did not show the same young-adult impacts as did the earlier cohorts, and there were even some negative impacts (Pages et al., 2023).
Public Pre-Kindergarten Programs
Public pre-K programs are public ECE programs that are typically funded by states or localities and often require local matching funds. Almost all states (44 out of 50, plus DC and Guam) provide pre-K programs. Overall, 34% of four-year-olds and 6% of three-year-olds were enrolled in state-funded preschools in the 2019–2020 school year (Friedman-Krauss et al., 2021). As of 2020, 35 of the 55 state and local programs were targeted to serve children from low-income families, albeit with qualifying incomes that were often twice the qualifying incomes for Head Start (35 state programs have income eligibility requirements; Friedman-Krauss & Barnett, 2020).
| End of Head Start year | End of 3rd grade | |
| Literacy | 11 of 16 | 1 of 6 |
| Math | 1 of 4 | 0 of 4 |
| Problem behaviors | 2 of 18 | 6 of 30 |
SOURCE: Data from Puma et al. (2012).
Promoting children’s school readiness skills, especially early literacy skills, is the primary goal of public pre-K programs (Phillips et al., 2017). Most offer few, if any, support services, such as transportation or health screenings and referrals (Friedman-Krauss et al., 2021). As state or local programs, their performance standards vary widely. Most pre-K programs have standards regarding curricula, teacher education, class sizes, and adult-child ratios. However, only about one-third of the pre-K programs have performance standards that meet or exceed those of Head Start, according to the National Institute for Early Educational Research (NIEER) (Friedman-Krauss et al., 2021). Not surprisingly, given substantial differences in the number of hours per week these programs provide care and in their performance standards, per-child costs to the state range widely, from under $4,000 for programs that meet fewer than half of the quality criteria recommended by NIEER to over $18,000 for programs that meet all those criteria (Friedman-Krauss & Barnett, 2020).
Evaluations of state pre-K programs suggest that children completing the programs show better school-readiness outcomes than similarly-aged children who had not (or not yet) enrolled in a pre-K program. A summary of the findings (Phillips et al., 2017) indicates that pre-K attenders entered kindergarten with much higher math and literacy skills (effects of 0.50 standard deviations or larger). Many evaluations also reported small to moderate impacts on language and executive functioning (effects of between 0.10 and 0.50 standard deviations; Phillips et al., 2017).
However, evaluations of longer-term impacts reveal that the advantages enjoyed by pre-K attenders often fade out or disappear completely as nonattenders catch up. Yet some evaluations show longer-run gains despite shorter-run fade-out. The most rigorous study of longer-term impacts examined Boston’s universal pre-K program (Gray-Lobe et al., 2021). It showed that pre-K attenders were more likely to enroll in and graduate from college than those who applied for but lost the attendance lottery. In the context of this report, it is important to note that impacts were generally smaller for participants whose families were in the lowest income categories.
It is striking to note that medium-term impacts shown in the most rigorous evaluations of recent pre-K studies include worrisome negative effects in elementary school. A random-assignment evaluation of the Tennessee pre-K program reported significant negative longer-term pre-K impacts on both academic and social-emotional outcomes in third through sixth grade (Durkin et al., 2022; Lipsey et al., 2018). In sixth grade, the English and math scores of pre-K children were 0.28 and 0.40 standard deviations lower than the scores of children who applied for admission but lost the lottery. Attenders drew significantly more disciplinary actions than non-attenders. An RCT evaluation of the North Carolina pre-K program (Peisner-Feinberg et al., 2020) reported that at the end of kindergarten, pre-K children had
lower scores (effect sizes of 0.24 to 0.28 standard deviations in math, executive functioning, and social skills) than non-pre-K children. However, these differences were not statistically significant after adjusting for the large number of comparisons in the study (Peisner-Feinberg et al., 2020).
Less rigorous studies provide inconsistent evidence regarding differences between pre-K attenders and nonattenders.2 The most promising results are from a follow-up study of children who were eligible in 2005–2006 for the Tulsa Universal Pre-K. Gormley et al. (2023) reports that pre-K attendees were more likely than nonattending children with similar demographic characteristics subsequently to enroll in college (increase of 12 percentage points). In other studies that attempted to match attenders and nonattenders using propensity score methods on school-age demographic characteristics, pre-K attenders in Boston, North Carolina, New Jersey, Maryland (Minervino, 2014) and Georgia (Early et al., 2019) showed slightly higher reading and math scores on state-mandated reading and math tests in third and fifth grade.
ECE programs in other countries provide some evidence of positive impacts on adult outcomes of their at-scale ECE programs. One of the ECE programs showing long-term impacts is the Norwegian program, which requires a college-educated teacher, good adult-child ratios (typically 16 children and 3 adults), and a play-oriented experiential orientation to instruction (Havnes & Mogstad, 2011). Uneven expansion of the Norwegian program during the 1970s allowed for a difference-in-difference analysis that demonstrated that attending preschool between the ages of 3 and 6 led to a substantial increase in completed schooling, labor market attachment, and earnings (Havnes & Mogstad, 2011).
Possible Explanations for Discrepant Findings on Long-Term ECE Impacts
Whereas the two large publicly funded ECE programs, Head Start and public pre-K, have shown positive impacts on school readiness, the evidence for medium- and longer-term impacts is mixed. The earliest ECE programs, like Perry and Abecedarian, were clearly effective at improving earnings, educational attainment, and health, as well as at decreasing crime and incarceration—all of which are factors that tend to lower the rate of intergenerational poverty (Campbell et al., 2012; Heckman et al., 2010). Earlier Head Start and pre-K programs also showed promising long-term impacts on educational attainment and crime (Bailey et al., 2021; Deming,
___________________
2 These studies use propensity score matching without having access to pre-treatment assessment of skills. The committee judged that this method was not as rigorous as random assignment or regression discontinuity methods.
2009; Gary-Lobe, 2021). In contrast, the most rigorous evaluations of today’s Head Start and pre-K programs suggest that they have null to negative medium-term impacts. It is possible that longer-run follow-up will show the kinds of positive impacts seen in Perry and Abecedarian. However, until the evaluation evidence shows more consistently positive impacts for these programs, the committee cannot, based on the evidence, confidently recommend expansions as an approach that is likely to reduce intergenerational poverty.
Transforming Model Programs into At-Scale Public Programs
Programs like Perry and Abecedarian were small, conducted by developmental researchers and led by trained ECE teachers. Classrooms were carefully monitored to ensure that the program was being implemented successfully and teachers were actively engaged in developing the curriculum. It is naïve to believe that findings from those programs will generalize to large public programs that serve millions of children each year (Tseng, 2017). Even replications like the Infant Health and Development Program, which used the Abecedarian curriculum and included almost 1,000 low-birthweight children, predominantly from low-income families, were led by researchers who continued to monitor the implementation carefully (Ramey et al., 2012). Today’s programs rely on performance standards that are less focused, yet more comprehensive. They include substantially less monitoring and supportive collaborative coaching than the early RCT studies (Friedman-Strauss & Barnett, 2020). Again, these factors are probably one reason why today’s programs have smaller impacts on the outcomes collected in early RCT studies, although they are unlikely to explain fade-out.
Targeting Recipients of ECE Services
Evidence shows that Head Start impacts were larger and more likely to be sustained when the children who attended Head Start would otherwise have stayed home with their parents or been cared for in a home-based ECE setting (Feller et al., 2016; Kline & Walters, 2016), and this suggests that increasing funding for Head Start might have longer-term impacts and reduce intergenerational poverty if the program could specifically target those children. However, a Head Start expansion could not be designed to exclude children who would otherwise be in other center-based care.
Growing evidence indicates that children who do not speak English at home may gain more and maintain those gains longer when they attend ECE programs (Phillips et al., 2017). In the RCT HSIS, children whose home language was not English showed larger gains in vocabulary skills if they attended Head Start, and those gains remained statistically significant
through first grade (Feller et al., 2016). The RCT evaluation of North Carolina pre-K reports statistically significant impacts on kindergarten language skills for children who did not speak English at home, even when those impacts faded in the sample as a whole (Peisner-Feinberg et al., 2020). These impacts were small in both studies (< 0.20 standard deviations), however, raising questions about whether they were sufficiently large to reduce intergenerational poverty even if maintained past first grade.
To What Extent Subsequent Experiences Support Initial Gains
The extent to which communities and schools support and build on the skills children have acquired in ECE programs is clearly important for maintaining the programs’ impacts and may play a role in fade-out. Children from low-income families who attend public ECE programs, especially if they are members of racially minoritized groups, tend to transition to lower-quality schools, encounter lower teacher expectations, and experience harsh punitive discipline in schools and by the local police (for details, see the sections on K-12 schools and juvenile justice). A lack of “sustaining environments” after low-income children leave their ECE programs makes it difficult for children to maintain the gains they have made in those programs.
The lack of sustaining environments to maintain ECE short-term impacts has been widely cited as an explanation for the fade-out of those impacts over time (Abenavoli, 2019). Despite some studies reporting that pre-K attenders continued to show higher levels of skills than nonattenders when they transition from pre-K programs into more effective schools or have more effective teachers (Abenavoli, 2019), this conclusion was not supported in a comprehensive meta-analysis of all studies testing the sustaining environment hypothesis published through 2018 (B. Bailey et al., 2020). Others argue that redundancy in instruction between pre-K and kindergarten, especially in literacy and math, accounts for the marked convergence in those skills, but pre-K fade-out did not diminish when pre-K and kindergarten instruction included less redundancy, despite wide-scale evidence of considerable overlap in early reading and math instruction (Burchinal et al., 2022). Thus, findings do not suggest that current “sustaining” elementary schools support learning more effectively for pre-K attenders than nonattenders. Nevertheless, it is logical to assume that there would be less fade-out of pre-K impacts if kindergarten teachers were encouraged to differentiate instruction based on entry skills (Cohen-Vogel et al., 2021).
Changes in Instructional Focus Over Time
Another explanation focuses on changes over time in the instructional content and approach of ECE programs. Abecedarian and Perry focused on strong caregiver-child relationships, with frequent multi-turn conversations, and on hands-on learning activities in which teachers scaffolded learning (Ramey et al., 2012; Weikart & Schweinhart, 1997). Head Start initially focused heavily on promoting health and social skills. Around 2000, ECE programs began to emphasize teaching early literacy and math skills to address kindergarten-entry gaps between low- and middle-income children (Office of Headstart, 2023).
Some have argued that preschool instruction in language, executive functioning, and social skills is more likely to be maintained over time than instruction in basic reading and math skills (McCormick et al., 2021). Early programs like Abecedarian did not teach the basic skills and children entered kindergarten with large treatment impacts on cognitive skills, no treatment impact on reading skills, and small impacts on math skills (Burchinal et al., 2022). Large differences in both reading and math skills emerged in second grade and were maintained through 21 years of age (Campbell et al., 2012). Similar adult impacts for the Abecedarian Project were reported for the Norwegian ECE program, which had a similar instructional focus on experiential learning and frequent teacher-child interactions (Havnes & Mogstad, 2011). In contrast, more recent evaluations of Head Start (Puma et al., 2012) and pre-K (Phillips et al., 2017) consistently show impacts at the end of the program on literacy and math skills that appear to fade out by second grade.
This focus on teaching these basic skills in preschool and the way they are too often taught is likely difficult for children. Teaching early academic skills often involves instruction to the entire class, with preschoolers being expected to sit still for relatively long periods (Bratsch-Hines et al., 2019). Focus on teaching these rote basic skills results in large gains in the pre-K year (Phillips et al., 2017), but these same skills are often taught again in kindergarten, once more typically in large groups (Cohen-Vogel et al., 2021). Sitting still in large group instruction is difficult for all children, especially very young children, and some teachers may become impatient and harsh, which may in turn exacerbate children’s problem behaviors (Christopher & Farran, 2020). The combination of redundant instruction and harsh interactions with teachers may cause children to disengage from learning, perhaps setting them on less positive academic trajectories during the early school years. Again, extensive time in whole-group instruction was not part of the Perry, Abecedarian, and Norwegian ECE programs. Those programs focused on hands-on learning, typically through individual or small group activities in centers.
Given all this mixed evidence, and especially given that positive long-term impacts have been largely limited to earlier programs that did not focus heavily on teaching basic reading and math skills (e.g., Campbell et al., 2012; Deming, 2009; Gormley et al., 2023; Heckman et al., 2010), or limited to programs that have made center-based ECE available to children who would otherwise have been cared for by parents or in a home-based setting (Feller et al., 2016), the committee was unable to recommend the expansion of Head Start or pre-K enrollment. However, we hope that these ECE programs will help us identify engaging teaching practices for promoting the skills that appear to be fundamental to subsequent learning, such as language and general knowledge, executive functioning, and social skills (Burchinal et al., 2020; Fuhs et al., 2014; Pace et al., 2019; Welsh et al., 2010), and enable us to coordinate learning experiences that allow children to use the skills they acquired in ECE when they transition to public school.
Quality Improvement Initiatives
Quality Rating and Improvement Systems (QRIS) are a policy initiative that rates the quality of ECE settings, using state-determined performance standards, and incentivizes improvement by making the ratings visible to parents and providing financial incentives for higher-quality programs.3 These state-level policies promote smaller class sizes, better-credentialed teachers, the high-quality implementation of proven curricula, and professional development programs for teachers. While there is considerable evidence that higher-rated programs do in fact provide higher-quality ECE, it has not been consistently shown that QRIS ratings are related to child outcomes, even by correlational studies based on national data (Sabol et al., 2013) or in state evaluations (Boller et al., 2015; Hong et al., 2015; Sabol & Pianta, 2015). Perhaps even more worrisome is correlational evidence that children do not benefit from attending programs with higher levels of “quality” in terms of most of the QRIS components (Hong et al., 2019).
Child Care Subsidies
Another approach to supporting out-of-home care for young children is through child care subsidies to low-income parents who work or attend school. Studies have shown that such subsidies funded by the Child Care and Development Block Grant increase the likelihood that recipient parents will enter the workforce or enroll in school or training programs (Herbst, 2017; Herbst & Tekin, 2010; Tekin, 2005).
___________________
3 For more information, see www.buildinitiative.org
But would subsidies reduce intergenerational poverty? The most direct evidence on child impacts comes from a study linking eligibility for subsidies to indicators of child development (Herbst & Tekin, 2010; see also Johnson & Ryan, 2015). It found a negative effect of subsidy receipt on reading and math test scores and an unfavorable effect on behavior problems, and some of these perverse effects were found to persist until the end of kindergarten. This may be because the original funding provided relatively low subsidies that led to enrollment in low-quality child care settings. Reauthorization addressed this issue, but too recently to allow us to examine impacts. Two Canadian studies reported positive links between subsidies and child outcomes among very-low-income children in Canada overall (Polyzoi et al., 2020) but negative impacts in Quebec among a largely middle-income population (Baker et al., 2019).
Increasing the nation’s investment in child care subsidies may benefit low-income families by increasing their resources, promoting parental education and training, and supporting parental work. As in the case of Head Start and pre-K expansions, however, we cannot conclude that the evidence supports subsidy expansions as a reliable way of reducing intergenerational poverty.
K-12 Education
Increase K-12 School Spending in the Poorest Districts
Plausible expansions of federal funding could make a difference at the margin to both between-state and within-state gaps, but only if they are not offset by reductions in state and local funding. Hoxby (2001) argues that many redesigned state funding formulas are poorly conceived, creating incentives for local districts to cut taxes when state funding is available and potentially reducing overall spending in targeted districts. Similarly, Gordon (2004) finds that changes in federal Title I spending are fully offset by reductions in local funding over the next few years. On the other hand, the examination by Lafortune et al. (2018) of more recent state finance reforms indicates 100% “stickiness” of the additional state funding, with no offset via reduced local funding even many years in the future. Thus, the literature does not fully resolve the question of “stickiness” of intergovernmental grants, though it seems likely that some maintenance of effort rules would be required for any federal program to be effective.
While the recent literature is clear that additional funding yields benefits for children that persist into adulthood, it does not provide clear estimates of optimal funding levels. Baker et al. (2021) estimate that the shortfall of education spending from a standard for “adequacy” totals $104 billion per year—substantially more than total current federal spending on
K-12 education of around $60 billion. It seems implausible that the federal role could expand that much.
We explore one potential federal policy change short of closing the entire adequacy gap. We base it on Lafortune et al.’s, (2018) analysis of post-1990 state finance reforms. They estimate that a typical reform raised spending in the lowest-income fifth of districts in the state by $1,377 per pupil (in 2013 dollars), or about 12% of the average of $11,595. Total public-school enrollment is about 50 million, so approximately 10 million students attend schools in the bottom fifth of districts. Thus, increasing spending in these districts by $1,000 per pupil would increase total spending by $10 billion per year.
As noted above, not all federal funding would “stick.” If we assume that changes in state and local effort reduce the effectiveness or intended concentration of federal spending by one-third, federal expenditures would need to rise by $15 billion to achieve the above increase in expenditures in low-income districts.
What would be the impact of this? Jackson et al.’s (2016) results indicate that a 12% increase in spending would reduce the adult poverty rates of low-income children growing up in these districts by 0.12 × 0.61 = 7 percentage points and increase their adult family incomes by 21%. Using more recent reforms, Rothstein and Schanzenbach (2022) find that exposure to a typical reform for 12 years raises average earnings of students in a state by 4% but note that this combines effects on low- and non-low-income students and on high- and low-income districts.
How many children would be affected? Approximately 17% of public-school students (8.5 million) are in poverty (Digest of Education Statistics, Table 102.70). Lafortune et al., (2018) finds that about one-third of free and reduced-price lunch students (a proxy for student poverty) attend school in the lowest-income fifth of districts. Thus, the above reform would reach approximately 2.8 million children from families below the poverty line. (Though note that above we assumed that states would divert one-third of spending to other districts than the lowest income. These districts have children in poverty as well, so the number of children in poverty who would be affected would be larger.) If this reform reduced their adult poverty rate by 7 percentage points, that would reduce intergenerational poverty by 16,000 students out of each birth cohort.
Promising Approaches Within K-12
As discussed in the report, there is limited evidence about long-term effects of specific programs or practices within the K-12 system, but there are a number of promising approaches that have been shown to have strong shorter-term impacts. If these early impacts are found to persist,
these approaches would be candidates for recommended interventions; in the meantime, we see them as promising and worth consideration, but not meeting our evidentiary standards for committee recommendations. We discuss several here, acknowledging that this list is not exhaustive.
High-dosage tutoring for struggling students
Evaluations have demonstrated that programs providing frequent tutoring sessions, individually or in small groups, to students with skills below grade level improves academic skills (Fryer, 2016). Although improved academic skills do not translate directly into lower poverty in adulthood, the evidence on shorter-run improvements from carefully crafted tutoring programs is promising enough to include in our list of profitable ways districts might promote school success among disadvantaged students.
The tutoring programs that appear to be successful involve sessions provided by trained volunteers or educators to struggling students, individually or in groups of six or fewer, for at least 50 hours over the school year (Fryer, 2016). They range from programs like Reading Recovery for early elementary students (D’Agostino et al., 2017) to tutoring sessions for high school students (Guryan et al., 2023). Rigorous evaluations summarized in a meta-analysis indicate that these programs have moderate short-term impacts and, in the studies with longer-term follow-ups, those impacts were maintained for at least a year and translated into higher rates of high school graduation. Tutoring programs that did not meet these two criteria showed neither short- nor long-term impacts (Fryer, 2016).
Based on this evidence, Kraft and Falken (2021) propose creating a national tutoring network that could be adopted by school districts and encouraged by federal funding. In the proposal, tutors could include high school students who tutor in elementary schools as an elective class, college students who tutor in middle schools via the federal work-study program, and full-time 2- and 4-year college graduates who tutor in high schools via AmeriCorps. Their estimates suggests that targeted approaches to scaling schoolwide tutoring nationally, such as focusing on K–8 Title I schools, would cost between $5 and $15 billion annually. They do not provide estimates of the impacts on either the tutors or the students being tutored.
Several large evaluations estimated both long-term impacts and program costs. A meta-analysis examined Reading Recovery, a widely implemented early-grade intervention in which struggling elementary school students receive 20 weeks of individually designed diagnostic teaching by trained professionals (D’Agostino et al., 2017). Synthesizing results from RCTs or high-quality quasi-experimental studies yielded an effect on reading achievement of 0.59 standard deviations at a cost of $2,500 to $9,000 per student. Guryan et al. (2023) report on a multi-study evaluation of
the Saga Education tutoring program, which provides similar high-dosage tutoring to 9th and 10th graders at a relatively low cost ($3,500 to $4,300 per participant per year) that yielded higher math test scores and increased grades in math and non-math courses, with estimated impacts of 0.37 standard deviation that persisted several years later.
In sum, high-dosage tutoring for struggling K-12 students that focuses on matching instruction to skills level appears effective at improving skills in the short-term and improving important young adult outcomes such as high school graduation. These programs may be cost-effective when educated young adults serve as the tutors and follow carefully crafted instructional plans.
Improving teacher quality
It has long been known that schools serving low-income students have a more difficult time attracting and retaining high-quality teachers and that students of color do better in school when matched with teachers of color (Gershenson et al., forthcoming, 2016; Lindsay & Hart, 2017). So, the problem is both one of allocating teachers across schools and school districts as well as increasing the supply of high-quality teachers, and in particular high-quality teachers of color.
One promising model for increasing teacher quality is university programs that encourage and facilitate science, technology, engineering, and mathematics (STEM) undergraduate majors to be certified as public-school teachers. The UTeach program at the University of Texas-Austin is an exemplar; as of 2018 programs similar to it are also available at 44 universities in 21 states. As explained in Backes et al. (2018), UTeach recruits math and science majors to pursue careers in teaching and offers free field-based courses that enable interested students to try out teaching before committing their early careers to it. It was funded by grants from, among other places, the nonprofit National Math and Science Initiative, but could presumably be supported in some way with federal money.
The Backes et al. (2018) non-experimental evaluation found that Texas students taught by UTeach graduates perform significantly better on end-of-grade tests in math in middle school and end-of-course tests in math and science in high school by 8% to 15% of a standard deviation on the test, depending on grade and subject. As to teacher diversity, UTeach increased the fraction of Hispanic (but not Black) science and math teachers in the schools they studied.
Other approaches to diversifying the teacher labor forces include urban teacher residency models, such as Alder Graduate School of Education and the Boston Teacher Residency programs. An evaluation of the latter found that program graduates were more diverse than Boston Public School teachers, were more likely to remain teachers and, after several years,
outperformed veteran teachers in the district (Papay et al., 2012). Teacher training and certification programs drawing students from community colleges and minority-serving institutions—such as the Department of Education’s Center of Educational Excellence for Black Teachers Program at Historically Black Colleges and Universities—are also likely to draw and train minority group teachers than traditional programs, but the evaluation literature on this is thin.
Reducing punitive school discipline
Experimental and correlational evidence reviewed in the main text shows that exposure to harsh discipline in schools leads to worse adult educational and criminal legal outcomes. Given the disproportionate experience of school discipline by low-income and Black, Latino, and Native American children—which is not accounted for by behavioral differences (Skiba et al., 2011)—this experience likely also contributes to these children’s lower rates of intergenerational mobility. Teacher-student race matching has been shown in both correlational and experimental studies to reduce punitive discipline for students of color (Lindsay & Hart, 2017; Shirrell et al., 2021). Another promising approach—and one of the few that includes outcomes for Native American students—is restorative justice practices (Anyon et al., 2016; Gregory et al., 2016).
A meta-analysis of RCT interventions to reduce harsh discipline found that students’ academic skills, counseling, mentoring programs, and teacher training all showed promising results for reducing in-school or out-of-school suspensions (Valdebenito et al., 2019). For example, Okonofua et al. (2016) tested a brief randomly assigned on-line intervention with math teachers in five middle schools in three school districts that “encouraged teachers to understand and value students’ experiences and negative feelings that can cause misbehavior and to sustain positive relationships when students misbehave.” This “empathetic mindset” reduced suspension of students of the treated teachers by half during the academic year as compared with the control group. The effect was consistent across racial, gender, and prior-year suspension groups. While this study had a 1-year observation period, Valdebenito et al. (2019) find that the effects of most interventions faded after 6 months, suggesting the importance of ongoing and repeated training and awareness.
A practice known as Positive Behavioral Interventions and Supports (PBIS) has been shown in RCTs to reduce exclusionary discipline (Bradshaw et al., 2010). PBIS is a schoolwide practice in which “schools establish a set of positively stated, schoolwide expectations for student behavior, which are taught to all students and staff” (Bradshaw et al., 2012, p. e1137; also see www.pbis.org). Descriptive studies in Canada and Oregon showed that
PBIS schools showed no Native American-White disparities in punitive discipline (Greflund et al., 2014; Vincent et al., 2015), and an RCT of PBIS with a racial equity focus showed greater reductions in punitive discipline for Black students (McIntosh et al., 2021). PBIS with added school mental health supports shows additional effectiveness. Weist et al. (2022) report RCT results that this “Interconnected Systems Framework” compared with either PBIS or just mental health services showed “reduced office discipline referrals (ODRs) and in-school suspensions, as well as reduced ODRs and out-of-school suspensions for African American students.”
There are no studies of the direct effects of discipline practices and interventions on children’s later adult outcomes. However, the evidence reviewed here and in the main section establishes a clear indirect relationship between school discipline and intergenerational mobility. There is causal evidence on policies and practices that effectively reduce punitive discipline and causal evidence that children who experience more punitive school discipline are less likely to graduate from high school and attend college and more likely to have criminal legal contact.
Smaller class sizes in the early grades
The well-known STAR evaluation used randomization to study the effect of small classes in K–3 on test scores of low-income students in Tennessee. Assignment to a smaller class had positive effects on test scores through these grades (Krueger 1999, 2003). Although there has been some criticism of the experiment on the grounds that it did not incorporate modern practices like careful collection of baseline data, subsequent reanalysis has shown both that the treatment arms were balanced (supporting the interpretation of the treatment effects as causal) and that the early-grade effects persisted to later grades and even to college enrollment (Chetty et al., 2011; Krueger & Whitmore 2001). There is also suggestive evidence of effects on adult earnings, though the sample was not large enough to measure these precisely (Chetty et al., 2011). In the case of class size reduction, there is little evidence about whether this is more or less effective than alternative ways of spending the same resources.
When California attempted to quickly reduce class sizes in the 1990s, districts had to hire many new, inexperienced teachers to fill the new classrooms, which may have offset the benefits of the small classes (Jepsen & Rivkin, 2009). This appears to be an implementation issue; in the longer run, there is no evidence that a gradual increase in teacher hiring requires bringing in lower-quality teachers.
Expand high-quality (“no excuses”) charter schools
Several recent evaluations of a group of charter schools in Boston have used admissions lotteries to identify the causal effect of enrollment in these
schools. The schools have in common a “no excuses” model, characterized by high expectations, rigid curricula, and strict discipline, and serve a high-poverty population. The lottery studies find very large positive effects on student test scores (Abdulkadiroğlu et al., 2011). Studies of other schools using similar models elsewhere also indicate large effects (e.g., Dobbie & Fryer, 2011). This stands in stark contrast to estimates of the effect of the average charter school, which is generally near zero (CREDO, 2013). Longer-term follow-ups indicate positive effects of the Boston no-excuses schools on students’ eventual 4-year college enrollment and persistence, an outcome that these schools specifically target (Angrist et al., 2016). There is not yet evidence of effects on college completion or adult poverty.
This evidence is strongly suggestive that it would be beneficial to expand the no-excuses charter school sector, though the absence of longer-term evidence prevents us from adopting this as a recommendation. Moreover, the rigorous studies to date examine high-poverty urban populations in a few large cities with struggling public school systems, and it remains unclear how specific the no-excuses effects are to these settings (Angrist et al., 2013).
Increase racial, ethnic, and socioeconomic diversity within schools
Another driver of disparities in educational quality is school segregation. In particular, majority non-White schools tend to have less funding, fewer resources, and less skilled teachers (Bischof & Owens, 2019). In 1954, the Supreme Court passed its landmark Brown v. Board of Education, and other subsequent court orders further reinforced it. This resulted in court-ordered desegregation in school districts around the country, which led to slow but substantial racial integration throughout the United States (Orfield et al., 2016; Reardon & Owens, 2014; Reardon et al., 2012). In studies using national data that exploited quasi-random variation in the timing of the initial court orders, the resulting desegregation in the 1960s and 1970s was found to improve educational and occupational attainment among Black adults (Johnson, 2011). Specifically, each additional year of exposure to court-ordered desegregation led to a 1.8 percentage-point increase in the likelihood of high school graduation, and the average effects of a 5-year exposure to court-ordered school desegregation led to about a 15% increase in wages. This study also found effects on potential mechanisms, including increased per-pupil spending and reduced class sizes, and it showed improvements in other downstream outcomes like overall self-reported health (Johnson & Nazaryan, 2019).
In 1991, the Supreme Court ruled in Board of Education v. Dowell that earlier court-ordered desegregation plans were not intended to be permanent. Roughly 600 of the nearly 1,000 school districts that were under court-ordered desegregation were subsequently released from oversight.
These more recent court decisions resulted in “resegregation” of the released school districts (Reardon & Yun, 2002; Reardon et al., 2012), and highly segregated schools with less than 10% White enrollment have more than tripled in recent decades to nearly 20% (Orfield et al., 2016). While no studies to our knowledge have examined the effects of these recent changes on adult earnings or poverty, a handful of studies have leveraged the longitudinal and geographic variation in the timing of these local court decisions to demonstrate worsened health among affected children while they are still in school (Wang et al., 2022) as well as negative effects on health as they age into adulthood (Kim et al., 2022; Shen, 2018). Another study examined the end of race-based busing in North Carolina during this period, exploiting changes in maps for school boundaries, and found that attending a more segregated school district resulted in decreased high school exam scores among both White and racial/ethnic minority students, deceased high school graduation and college attendance among White students, and increased crime among minority boys (Billings et al., 2013).
Postsecondary Education
Community college completion provides low-socioeconomic status (SES) students with meaningful economic returns relative to noncompleting students (Mountjoy, 2022), and 4-year degree completion provides low-SES students substantially larger returns (Card, 1999; Zimmerman, 2014). Even for low-SES students, higher education provides relatively greater returns when students enroll at higher-value universities (Black et al., 2023; Bleemer, 2021a, 2022) and in higher-paying fields of study (Bleemer & Mehta, 2021). Federal higher education policy would thus maximally promote economic mobility by increasing aggregate college-going, improving educational quality at institutions and in programs where low-SES students enroll, and shifting low-SES students toward higher-value institutions and programs.
Effective Financial Aid for Low-Income Students
The evidence on the effectiveness of the Pell grant program has been quite mixed (Eng & Matsudaira, 2021), though there is some support for increasing its maximum value while limiting offsets by states and localities by reducing their financial support (Denning et al., 2019). Stronger evidence on the effectiveness of scholarship assistance to low-income students include the HAIL program by the University of Michigan (Dynarski et al., 2021, 2022a) and the Buffett Scholarship in Nebraska (Angrist et al., 2022).
Direct Federal Support for Colleges and Universities That Enroll Low-SES Students
Increasing spending at less-selective colleges and universities has larger positive effects on completion than reducing tuition (Deming & Walters, 2017), and attending universities with greater support for student services to promote college engagement improves retention and degree attainment (Cohodes & Goodman, 2014). Federal funding targeted toward increased academic support at universities with large low-SES enrollment is therefore important. Increases in Pell grants often offset state educational funding instead of improving educational and support services (Turner, 2012, 2017), though there have been cases where such offsets are restricted and where increases in Pell grant generosity have led to higher attainment of credentials (Denning et al., 2019).
University enrollments are responsive to institutional incentives to increase low-SES enrollments (Hoxby & Turner, 2019). The universities that face the excise tax are well funded and likely very high-value for low-SES students (Chetty et al., forthcoming) but enroll relatively few low-SES students (Chetty et al., 2020).
College tutoring and other student services substantially increase retention and completion (Bettinger & Baker, 2014; Canaan et al., 2022a,b; Scrivener et al., 2015). AmeriCorps tutoring programs have also been very successful in improving low-SES student outcomes at younger ages (Markovitz et al., 2022). A range of support programs for low-income students in community college, including the Accelerated Study in Associates Program (ASAP; Azurdia & Galkin, 2020; Miller et al., 2020) and Stay the Course (Evans et al., 2020) have also been successful in raising student persistence and program completion (see also Dawson et al., 2020).
Our cost estimate of $8 to $10 billion a year for institutional supports to improve completion rates among low-income students is based on the facts that ASAP and Stay the Course cost about $10,000 and $6,000 respectively per student over 3 years, and a similar number of students in 4-year institutions with less-intensive supports (like Inside Track or Project STAR—see Dawson et al., 2020).
Minority Serving Institutions and Intergenerational Mobility
The evidence regarding the effects of attending minority serving institutions (MSIs) on graduation rates, earnings, and occupational status shows likely long-term occupational and graduation benefits, but mixed effects on earnings (Boland et al., 2021; Elu et al., 2019; Fryer & Greenstone, 2010; Gordon et al., 2020; Kim & Conrad, 2006; Park et al., 2018; Price et al., 2011; Strayhorn, 2008). However, MSIs enroll more than three times the
proportion of students from the lowest income quintiles and exhibit twice the mobility rates—defined as moving students from the lowest to the highest income quintiles by age 30—compared with predominately White institutions, despite having fewer resources (Espinosa et al., 2018). MSIs enroll and graduate a disproportionate number of Black, Hispanic, and Native American students. Chetty et al. (2017) show that five of the top 10 colleges and universities that promote upward intergenerational mobility are Hispanic-serving institutions. Black students who attend historically Black colleges and universities with high proportions of Pell-eligible students are more likely to graduate than Black students at similar but predominately White institutions (Education Trust, 2019). And Native Americans who attended tribal colleges and universities had lower debt loads compared with peers at non-tribal colleges and universities (Gallup, 2019). A National Academies of Sciences report (2019, p. 125) suggested seven steps to improve student success at MSIs, with a particular focus on improving STEM education and increasing STEM majors.
Beyond the upward mobility of their own students, MSIs can serve as important pipelines into professions that can increase the upward mobility of the next generation of low-income youth. Rigorous causal studies show that Black students—especially low-income Black boys—have better educational outcomes when they are taught by Black teachers in elementary school (Gershenson et al., forthcoming, 2016; Lindsay & Hart, 2017), just as racial concordance between patients and doctors has been found to improve health outcomes for adults and children (Alsan et al., 2019; Greenwood et al., 2020; Saha et al., 1999; Shen et al., 2018; Takeshita et al., 2020; Thornton et al., 2011; Traylor et al., 2010).
Adjustments to Federal Financial Aid Formulas and Integrated Postsecondary Education Data (IPEDS) Data Collection
Free Application for Student Aid completion is a substantial barrier to low-SES students’ college application and enrollment (Bettinger et al., 2012). Low-SES students become more likely to apply to and enroll in college if universities reveal their expected costs of attendance, net of financial aid, prior to application, at least in circumstances where those costs are low, as is often true for low-SES students (Dynarski et al., 2021, 2022b).
College major attainment is a first-order determinant of the return to higher education, with the relative economic return to certain majors (like economics and computer science) rivaling the baseline return to a college education (Altonji et al., 2016). Many universities restrict access to lucrative college majors on the basis of prior academic preparation and performance, and these restrictions disproportionately exclude low-SES students from lucrative fields of study (Bleemer & Mehta, 2021). Providing information
on major restriction policies through Integrated Postsecondary Education Data System (IPEDS) could better inform students about their access to lucrative fields of study and incentivize universities to widen access for low-SES students.
Target Federal Higher Education Funding Toward High-Value-Added College Programs
Information on which universities and university programs provide high-value education to low-SES students is improving over time (e.g. Chetty et al., 2020). It is important that federal support for higher education institutions be increasingly targeted toward high-value programs as such information becomes available. For example, community college nursing programs tend to provide outsized economic returns to relatively low-SES students (Grosz, 2020, 2021).
Career Education
Career and Technical Education Pathways in High School
There is rigorous evidence that high-quality career and technical education (CTE) improves higher education and labor market outcomes for disadvantaged students from a number of studies, all of which are based either on RCTs or lotteries among students who had applied to high school programs that were oversubscribed. For example:
- Career academies—Career Academies are programs within comprehensive high schools that orient CTE and work experience toward specific sectors of the economy—like health care, information technology (IT), or finance. Kemple and Willner (2008) shows that, 8 years after random assignment (and 5 years after the completion of high school), Career Academies raised the earnings of males by 18% and of students overall by 11%. They also improved marriage rates and stable household formation. But they had no lasting impact on educational attainment, either through dropout rates or higher education. But Hemelt and Lenard (2019) show that an IT academy in North Carolina increased high school graduation (by 7–8 percentage points) and postsecondary enrollments 3 to 6 years after entry in the 9th grade.
- Technical high schools—Studies by Dougherty (2018), Ecton and Dougherty (2023), and Brunner et al. (2021) of technical high schools in Massachusetts and Connecticut—the enrollments of which were oversubscribed—show evidence of lower high school
- P-Tech and other pathways—P-Tech is a program which began as a collaboration in New York between high schools, the City University of New York, and IBM. It is a program covering grades 9–14, where students engage in IT training and work experience along with their academic work. The model is now spreading to other locations and industries. According to Rosen et al. (2020), high school students in P-Tech had passed their New York regents exams and enrolled in postsecondary programs more frequently than students in other high schools. Bonilla (2020), in a study of a competitive grant to build pathways to postsecondary education and work in high-demand industries in California high schools, also found significantly lower rates of dropping out.
dropout rates and higher earnings for students who did not enroll in college. Seven years after enrollment, low-income students from technical high schools in Massachusetts had annual earnings approximately $3,500 higher than similar students from other high schools, among those who did not attend college (Ecton & Doughtery, 2023); on-time graduation rates were also 7–10 percentage points higher (Doughtery, 2018). Among male technical school attendees in Connecticut, dropout rates were 10 percentage points lower and earnings were $1,600 higher (Brunner et al., 2021).
If the impacts on dropping out and high school completion persist, then these programs generate large positive impacts. The total social and economic cost of high school dropout, analyzed by Belfield and Levin (2007) and updated to current dollars, suggests social costs of approximately $1 million in present discounted value over the life cycle for each dropout, in terms of lost earnings, higher costs to taxpayers, and higher nonpecuniary costs (with the last two primarily associated with crime and poor health).
Moreover, the costs of these CTE approaches per student are not terribly high. For instance, the marginal costs for each Career Academy student are roughly $1,100–2,400 per year (Hemelt & Lenard, 2018), while the overall costs of technical high schools are $6,000; assuming that the cost of high school without either program is nearly $5,000, the two figures suggest the costs of the two approaches are quite comparable. So, the expected value of a program that raises high school graduation rates by 10 percentage points would be at least $100,000 per person while costing vastly less. Also, while some models of CTE have traditionally produced evidence of lower enrollments in 4-year colleges, the studies above mostly show little evidence of this.
One concern about CTE programs has been that they might “track” students away from 4-year colleges and universities. As indicated, they appear to raise enrollments in 2-year colleges, especially when “career
pathways” are created that explicitly link students to programs there. But the studies above show little evidence that high-quality CTE lowers enrollment in 7-year programs or attainment of bachelor of arts degrees.
Postsecondary Sectoral Training Programs
A number of sector-based training program models have been developed in the past 20 years and have been subjected to rigorous random-assignment evaluations. Among the most successful, Per Scholas (one of the WorkAdvance4 programs), Project Quest,5 and Year Up6 generated average earnings gains for participants of approximately $5,000–$8,000 that last for at least 5 to 11 years in RCT evaluations, while direct costs of training and supports (but not employment under Year Up) are about $6,000 to $12,500 (see Table C-4-3).
It is important to note that not all sectoral training programs are as effective as these. For example, Per Scholas is one of four sectoral training programs evaluated by MDRC. Across all four, earnings impacts averaged about $2,500 per year. We do not understand enough about what made
Table C-4-3 Sector-based training program models
| Target population | Description of program | Direct cost per participant | Annual earnings gains | |
| Year Up | Ages 18–24, high school diploma or GED | 6 months of classroom training, 6 months of internship plus program-based supports | $23,000 total, of which employers cover all but 40% ($9,200) | Nearly $8,000 per year by year 5 |
| Per Scholas | Ages 18 and above, high school diploma or GED | Training in IT by private providers plus program-based supports | $5,800 | $4,800 in year 7 |
| Project Quest | Ages 18 and above, high school diploma or GED | Training primarily in health care certificate programs at community colleges with program-based supports | $12,500 | $4,600 in year 11 |
SOURCE: Committee generated, data from Year Up (2023); Kanengiser and Schaberg (2022); Order and Elliot (2021).
___________________
4 For more information see https://www.mdrc.org/publication/employment-and-earnings-effects-workadvance-demonstration-after-seven-years
5 For more information see https://economicmobilitycorp.org/eleven-year-gains-project-quests-investment-continues-to-pay-dividends/
6 For more information see https://www.yearup.org/about/newsroom/press/year-announces-significant-sustained-earnings-gains-young-adults-five-year
Per Scholas so effective, so it is important that the process of scaling up the program models we discuss be done in a way that carefully monitors implementation quality and program effectiveness.
Also noteworthy is that these programs have not been proven for general populations of disadvantaged youth. All employed careful screening, with some reporting acceptance rates ranging between 10% and 30% (Kazis & Molina, 2016; Maguire, 2016).
And finally, in addition to the direct costs listed in the table, all of these kinds of training programs carry an opportunity cost of lost earnings during the training period for participants, which can last six months to 2 years.
Details of Our Calculations
In arriving at our aggregate cost estimate, we assume an average direct cost of about $10,000 per trainee.7 Year Up—which involves about 6 months of classroom training and 6 months of paid internship at a private company for low-income high school graduates—costs a lot more if you include the costs of the internship. Employer payments tend to cover about 60% of its costs and we assume that would also be true for our scaled-up programs. (Year Up is also working on variations of its model, to see whether it can generate lower-cost versions.)
So, comparing benefits to costs, the very best programs can pay for themselves in roughly 3–4 years (if earnings are foregone for 1–2 years), while a somewhat wider range of programs can take more than 5–6 years to pay for themselves. Assuming no further fade-out of impacts, the present discounted values of future earnings streams for program participants generate substantial benefits for them and the public (especially if the earnings gains can reduce crime, poor health, or the need for participants to rely on public benefit programs in the future). Assuming some moderate fade-out can still generate public benefits that clearly exceed costs
At what scale would one need to provide these programs, and at what total cost?
- Youth—About 3.2 million students graduated from high school in 2019, and two-thirds of them enrolled right away in college. So just
___________________
7 For more information see https://www.mdrc.org/publication/employment-and-earnings-effects-workadvance-demonstration-after-seven-years. We include it in these options for the following reasons: (a) earnings impacts have been estimated over longer time periods than for the other programs; (b) students earn college credentials which might draw returns for longer periods and with greater portability; and (c) as a community college program, it might be easier to scale. And although Year Up is considerably more expensive than Per Scholas, we include the latter because of its exclusive focus on youth, its broad industry range, and its larger impacts to date on youth earnings.
- Adults—In this case, we use a stock estimate of the population of potential low-income participants in these programs, rather than a flow. We can consider offering something like Project Quest or Per Scholas to adults at ages 25–44 (or perhaps a bit lower) who have moderately young children (perhaps below age 13) and have incomes below 200% of poverty. Roughly 30% or so of such adults meet the income criteria, and we assume that around 60% have children in this age range (though the true number might differ). There are 88 million Americans in that age range, so about 15–16 million fit the additional eligibility criteria. If we offered one million of them entry into Per Scholas or Project Quest each year, that would also cost $10 billion a year.
over 1 million had no immediate chance of getting a postsecondary credential. If we add in high school dropouts who might get a GED, plus enrollees who will not complete any credential or earn enough credits to raise their earnings, plus those who obtain very weak credentials, we end up with about 1.5–2.0 million students every year who could benefit. On the other hand, Year Up and the other sectoral programs screen out many students (with poor cognitive skills and other barriers to work), so many of these youth would not be eligible to enter these programs, or might not even apply for other reasons. If we offer Year Up or another program to 1 million of these students per year, it would cost $10 billion annually (not including foregone earnings of the students)—or less if fewer are enrolled.
Scaling Challenges
In all cases, scaling these programs up while maintaining quality would be challenging—so the scaling would need to take place slowly and deliberately. The original sites that have been evaluated to date are fairly small. Each of the programs is now trying to replicate itself, but these efforts will not generate nearly enough scale to achieve our goals. The programs are also exploring ways to achieve more scale while maintaining quality, such as the use of online training to reduce cost, and partnerships with other providers (like community colleges) to expand their reach. The efforts of the city of San Antonio to scale up Project Quest have been described in presentations.8
___________________
8 For more information see https://www.bexar.org/DocumentCenter/View/30320/Project-QUEST---Bexar-County-SBED-Webinar
APPENDIX C: CHAPTER 5
CHILD AND MATERNAL HEALTH
This appendix provides details on a number of the driver sections and interventions in Chapter 5.
Inadequacy of Funding for the Indian Health Service (IHS)
Not all Native American individuals are eligible for the IHS, a direct provider of health care services for the IHS. Out of 5.7 Native American individuals, 2.7 are eligible. They include those who reside in geographic areas covered by the IHS. However, a recent government report concluded that “[f]unding for IHS addresses only an estimated 48.6% of the health care needs of Native American children and has historically been subject to year-by-year discretionary allocations from Congress, which creates substantial long-term uncertainty in funding and makes it challenging to maintain and modernize needed health care infrastructure” (U.S. Department of Health and Human Services, 2022). The IHS served 64% of the eligible population in 2020.
Per capita spending is considerably lower for the IHS, at $4,078, than it is for Medicaid ($8,109) and for the U.S. population more generally ($10,742). Multiple factors explain this difference. One has to do with the types of services provided, with IHS providing primary and emergency care but not tertiary care. Another is that IHS operates under a global budget, so that if the number of people served increases, per capita spending, by definition, declines. Medicaid and Medicare, in contrast, increase funding with the number of people and services provided. A tribal budget formulation workgroup concluded that nearly $50 billion is needed to adequately fund the IHS in fiscal year 2023. To put this in perspective, funding for the IHS in 2022 was $6.8 billion (IHS budget appropriation), plus an additional $1.26 billion in reimbursements from health insurance providers. This excludes temporary COVID-19 funding. Tribal priorities for IHS funding include mental health, alcohol/substance abuse, and health care facilities construction (U.S. Department of Health and Human Services, 2022).
Mental Health
Youth suicide rates have increased significantly over time for all racial/ethnic groups. In 1980, suicide was the seventh most common cause of death. By 2018, it had risen to the third most common cause. Importantly, the method of suicide has shifted to include more use of firearms, which are deadlier. Suicide by firearm among 10–14-year-olds increased 146% over the past decade and increased by 51% for 15–24-year-olds (Everytown,
2022). Differences in suicide rates by gender, race, and ethnicity underscore the disproportionate burden borne by Native American populations, for whom rates can be more than six times higher than the group with the lowest rate, Latino youth. The group with the next highest rate is White adolescents. While suicides among Black and Latino youth are less frequent, the rate for Black youth has risen more quickly over time.
There is some research showing that mental health treatment can make a difference. Analyses of multiple cognitive behavioral therapy (CBT) interventions, including CBT and interpersonal psychotherapy for adolescents, have found them to be effective for the treatment of adolescent depression (Klein et al., 2007). Research on the effectiveness of pharmacological treatments is more varied, with some of the stronger evidence for selective serotonin reuptake inhibitors (Cipriani et al., 2016; Strawn et al., 2015). Most research on the effectiveness of treatment focuses on mental health outcomes. Given the strong evidence that mental health affects educational attainment and earnings, research linking mental health treatment with future economic outcomes would be very informative.
The Centers for Disease Control and Prevention (CDC) and the Substance Abuse and Mental Health Services Administration (SAMHSA) have each developed evidence-based guidelines and strategies to address gaps in youth mental health care. The CDC has outlined the importance of early identification, providing resources to support families and identifying gaps in workforce development funding. This includes training professionals from fields that are connected to mental health and also integrating mental health care with routine health care. SAMHSA has focused on reducing emergency department utilization for children with mental health issues, reducing criminal justice interactions, and encouraging community-based care coordination.
With research pointing to the importance of location-based policy levers (e.g., So et al., 2019), SAMHSA has prioritized Certified Community Behavioral Health Clinics, which are a central part of the agency’s strategy, with 400 grantees nationally, but is also supporting school-based services. Another area where there is growing evidence of effectiveness in addressing both physical and mental health care needs, especially among low-income communities, is in school-based health centers (SBHCs). A review of the evidence on the effectiveness of SBHCs on educational and health outcomes led the Community Preventive Services Task Force to recommend continued implementation and maintenance of SBHCs (Community Preventive Services Task Force, 2016). SBHCs receive funding from multiple sources (50% from the federal government and the rest from local and state sources). From 1996 to 2017, total funds dedicated to SBHCs have increased from $42 to $91 million, and the number of SBHCs has grown from 900 to 2,584. However, this growth masks significant geographic
disparities: the number of states with SBHC programs declined over this period from 34 to 17.
Pollution
Federal clean-up of Superfund sites has been linked, causally, with important medium-term outcomes. Using data from 1994 to 2002 on the timing of Superfund site clean-up and comparing the outcomes of siblings born to the same family before and after a clean-up, researchers have linked Superfund site clean-ups with improved cognitive test scores and halving in the rate of children with a cognitive disability (Persico et al., 2020). If one only considers the reduction in special education expenditures associated with the clean-up, the researchers calculate that Superfund clean-ups would pay for themselves within 40 years. Researchers have also linked Superfund Site clean-ups with reduced child blood lead levels and improved infant health (Currie et al., 2011a; Klemick et al., 2020).
Children living in households below the poverty line and Black children are more likely to live near one of the 300,000 facilities that emit toxic chemicals, known as toxic release inventory (TRI) sites (Perlin et al., 1999). There is research linking childhood exposure to toxic chemicals at these sites to short-term, and more recently long-term, outcomes including educational attainment and wages. Researchers address the nonrandom placement of TRI sites in various ways. In the short term, evidence suggests that proximity to TRI sites increases infant mortality and reduces birthweight. In a recent working paper, Persico (2022) exploits variation in exposure across siblings derived from the opening of a plant and/or a family moving. Children exposed to a TRI site in utero complete 1.2 fewer years of school and have nearly 60% lower income in adulthood than their unexposed siblings. It is important to note that the TRI program, managed by the Environmental Protection Agency, tracks the management of 770 toxic chemicals and publishes this information for the public.1 The TRI program does not set standards for chemical emission levels.
Nutrition and Food Insecurity
For pregnant individuals, accessing healthy nutrition is critical to ensure healthy birth outcomes, such as lowering the risk of low birthweight (da Silva Lopes et al., 2017), as well as developmental outcomes into
___________________
1 Facilities that manufacture, process, or otherwise use these chemicals in amounts above established levels must annually report the amount released (i.e., emitted into the air or water) and/or managed through recycling, energy recovery, and treatment. According to Persico (2022), 221 million Americans lived in a zipcode with a TRI as of 2016.
childhood, such as cognition (Borge at al., 2017; Ramakrishnan et al., 2012; Veena et al., 2016). Nutritional status during pregnancy is also associated with overweight and obesity in children. For example, there is a correlation between obesity during pregnancy and poor neonatal outcomes, such as higher risks of having preterm birth, large for gestational age, and perinatal death (Aviram et al., 2011; Marchi et al., 2015). Obesity during pregnancy is also correlated with poor infant and childhood outcomes, including child obesity, and with poor health outcomes into adulthood (Langley-Evans, 2015; Poston et al., 2011).
The federal nutrition programs have been shown to be effective at reducing food insecurity in childhood and improving child health and future economic outcomes. Supplemental Nutrition Assistance Program (SNAP) in particular has been linked to improvements in newborn health, improved child outcomes, reductions in poverty, and improved economic and health outcomes in adulthood (Almond et al., 2011; M. Bailey et al., 2020; Hoynes & Schanzenbach, 2015; Hoynes et al., 2011, 2015, 2016). However, SNAP benefits are often consumed before the end of the month, resulting in increased food insecurity, decreased food consumption and other spending, and impaired dietary quality (Calloway et al., 2015; Franckle et al., 2019; Gregory & Smith, 2019; Hamrick & Andrews, 2016; Todd, 2015; Weinstein et al., 2009; Whiteman et al., 2018), which in turn have negative impacts on academic achievement (Bond et al., 2022; Cotti et al., 2018; Gassman-Pines & Bellows, 2018; Gennetian et al., 2016). Another complication is that SNAP benefits are to a large degree fungible with cash incomes, making it difficult to know to what extend intergenerational impacts are the result of increased food consumption or increased economic resources.
The Special Supplementation Nutrition Program for Women, Infants, and Children (WIC) is associated with positive impacts on nutrition, dietary intake, food security, and health, including birth outcomes, the latter of which is causally associated with educational attainment and later economic outcomes (Black et al., 2007; Royer, 2009). Improvements in 2009 to the nutritional content of WIC food packages—including the addition of a fruit and vegetable voucher and requirements that bread be whole grain and milk be low fat—have been found to improve dietary quality, perinatal outcomes, and early child development (Guan et al., 2021; Hamad et al., 2019a,b; Tester et al., 2016).
Despite these numerous benefits, participation rates among eligible children decline significantly after infancy (> 98%) across 1–4 years of age, (65%, 49%, 44%, 25%, respectively), and only 52% of eligible pregnant individuals participate (USDA, 2022). These numbers increased during the pandemic due to the multiple waivers that existed (remote benefits issuance, physical presence, allowance of uploading electronic certification
documents, etc.) that streamlined certification, but quantitative data on national impact does not yet exist. COVID-19 waivers increasing the WIC fruit/vegetable benefit also improved dietary intake, but evidence is still needed to prove its positive impact on health.
Factors contributing to the high numbers of children who are WIC eligible but not enrolled include concerns regarding immigration status, lack of transportation to attend in-person appointments, and administrative barriers that made it more difficult for families to enroll or stay enrolled in WIC (National Academies, 2017e; Vargas & Pirog, 2016). For SNAP, take-up rates are generally high (82% nationally, though they can be as low as 55% in some states). The main barrier to SNAP utilization among children is the ineligibility of many immigrant groups. Among immigrants, only those with permanent residency and those who are refugees can access SNAP benefits. The undocumented and those awaiting permanent residency are not eligible. Having parents or siblings in the latter categories affects the benefit levels of eligible children who are U.S. citizens. As a result, children in immigrant families are at higher risk for food insecurity (Capps et al., 2009; East, 2020; Kaushal et al., 2013; Van Hook & Balistari, 2006).
There is causal evidence that expanding coverage to immigrant families is effective in improving child outcomes. East (2020) examines the experience of U.S.-born children of immigrants whose parents were subject to changes in eligibility for SNAP over time, though the children maintained their eligibility throughout. Eliminating (restoring) parental eligibility for SNAP while maintaining child eligibility effectively reduced (increased) total monthly SNAP benefit payments. East (2020) also explores the impact of having SNAP from infancy through age 5 on health outcomes at ages 6–16, including parent reports of child health. She documents effects of SNAP benefit levels on parent-reported child health that are similar to the effects on self-reported health generated from the roll-out of SNAP as documented by Hoynes et al. (2018). An additional year of eligibility for SNAP reduces the probability of fair/poor health by 5% at ages 6–16 in the more recent study, compared with a 3% reduction in the same measure of self-reported health by adults associated with SNAP roll-out.
Paid Family and Medical Leave
There are some interventions that may be promising avenues for increasing intergenerational mobility through improvement in child and maternal health. These include paid family and medical leave. Only 23% of U.S. civilian workers report having access to paid leave for medical, caregiving, or parental obligations (Beach & Walsh, 2021). Lack of access to paid
leave disproportionately impacts low-income and racial/ethnic minority workers (Bartel et al., 2019; Boyens et al., 2022). Paid family and medical leave policies improve neonatal health outcomes, including reductions in rates of low birthweight and the risk of prematurity especially for unmarried and Black mothers (Rossin, 2011; Stearns, 2015), which in turn affect health in childhood (Lichtman-Sadot & Bell, 2017) and educational attainment and earnings later in life.
APPENDIX C: CHAPTER 6
CHILDREN’S FAMILY INCOME, WEALTH, AND PARENTAL EMPLOYMENT
This appendix first details the evidence regarding the likely impacts of expanding the Earned Income Tax Credit (EITC). Next, it describes the distribution of family wealth and reviews the correlational and causal evidence linking wealth to intergenerational outcomes. Finally, it provides more details on income and wealth interventions supported by direct or indirect evidence.
Impacts of the Earned Income Tax Credit on Child Outcomes
Much of the report’s discussion of the effects of family income and of income-oriented interventions centers around the EITC, which has been prominent in both policy and research for decades. There is an extensive literature on the EITC and its impacts (Hoynes & Rothstein, 2017; and Nichols & Rothstein, 2016, for reviews). The paper that most directly tackles the specific question of the EITC’s impact on intergenerational poverty is a working paper by McInnis et al. (2023). They relate variation in EITC receipt during childhood to the probability of being in poverty as an adult, between ages 25 and 45, and as measured by the Official Poverty Measure. They found that a $1,000 increase in annual EITC exposure during childhood reduces the likelihood of being in poverty as an adult by 9%.
They conclude that this effect is driven by increases in both children’s adult employment and earnings. They find that a $1,000 increase in annual EITC exposure during childhood increases adulthood employment by 4 percentage points and increases annual earnings by between 10% and 30%. They do not find evidence that childhood EITC exposure affects adulthood family structure (marrying or having children), which rules out one potential alternative mechanism.
Some papers have studied the effect of the EITC on childhood outcomes that plausibly affect whether children grow up to be in poverty as adults. Dahl and Lochner (2012) found that increases in family income due to EITC expansions raised math and reading test scores by about 0.06 standard deviations per $1,000; Chetty et al. (2011) found slightly larger effects, 0.06–0.09. Bastian and Michelmore (2018; see also Michelmore, 2013) showed that a $1,000 increase in EITC exposure boosts the odds of high-school completion by 1.3%, of college completion by 4.2%, and of young-adult employment by 1%. They suggest that the mechanism is through higher family income. Manoli and Turner (2014) found that an extra $100 of EITC rebate in a student’s senior year of high school increases college enrollment by 0.2 to 0.3 percentage points.
There are also studies that show effects of EITC on various aspect of health among recipients’ children, which may plausibly reduce later poverty as an adult (e.g., if child health improves subsequent education and employment; see Chapter 5). For example, Hoynes et al. (2015) showed that a $1,000 increase in EITC exposure is associated with a modest decline in low birthweight. Similarly, Klevens et al. (2017) found that state EITCs are associated with a decrease in pediatric abusive head trauma, while Batra and Hamad (2021) found reduced food insecurity in the months after EITC refund receipt, and Hamad and Rehkopf (2016) found reduced behavioral problems with increased EITC refund size.
Studies vary in whether they find that effects are larger for EITC payments received while young or later in childhood. With respect to heterogeneous effects by race, a handful of studies of nonpoverty outcomes have found larger effects for Black recipients. For example, Komro et al. (2019) and Batra et al. (2022) both found larger effects of state and federal EITC benefits, respectively, for birth outcomes among Black mothers.
An ambiguity in all of the work on the EITC’s impacts on child outcomes concerns whether the EITC’s impact derives from the additional resources available to families, from increased maternal employment in response to the EITC’s incentives or from a combination of the two. Although papers often describe their effects as reflecting the impact of $1,000, they all identify this from a policy that encourages greater work among mothers, but they cannot separately identify that effect. Distinguishing these effects is critically important to evaluating the potential impact of policies that might raise income with no or negative effects on employment. What evidence we have on this issue derives from other studies, for example of the effects of winning lotteries (Bulman et al., 2021; Cesarini et al., 2017).
Wealth
This appendix section focuses on the relationship between wealth and intergenerational poverty. We briefly cover trends in wealth and wealth inequality, followed by causes of these trends with a focus on differences by race and ethnicity. We then examine evidence from studies on parental wealth and adult child outcomes, and conclude with our suggested policy intervention, establishing federal child trust accounts or baby bonds.
Wealth-based metrics have become increasingly important for explaining the economic lives of Americans. They serve both as a mechanism of social mobility and as a means of solidifying social, political, and economic status. Studies have shown that differences in familial wealth holdings exist at birth. They persist across the life course and perpetuate intergenerationally; at least 25% of the younger generation’s wealth is directly attributable
to their parents’ level of wealth (Feiveson & Sabelhaus, 2018). As a result, the life chances of children from families at the lower end of the wealth distribution, on average, follow significantly different trajectories from those whose families were at the middle and top end (Pfeffer & Killewald, 2019). Lack of wealth constrains opportunities, inhibits choice, and increases economic vulnerability.
Trends in Wealth and Wealth Inequality
Wealth in the United States is highly skewed. Average household wealth was approximately $748,800 in 2019, while the median value was $121,700.1 These numbers are explained by two related phenomena. First, most households are concentrated at the lower end of the wealth distribution with a wealthy minority at the top. And second, the share of wealth held by the top 1% of U.S. families was 33.1%, while the top 10% held 71% of U.S. wealth, compared with the 27% and 2% held by the bottom 50–90th percentile and bottom 50% of U.S. households. The wealth distribution has become more unequal in recent decades, with the top 1% owning an increasing share of overall U.S. wealth. From 1989 to 2019 the share owned by the top 1% increased from 25 to 34% (Bricker et al., 2020). The Gini coefficient, a measure ranging from zero for perfect equality to one for maximum inequality captures how evenly distributed wealth is in an economy, provides another way of showing this trend. For the United States, the coefficient peaked in 2016 at 0.86 (last year calculated) yet it remained relatively unchanged between 1950 (0.83) and 2007 (0.82), rising most recently post-Great Recession (Kuhn et al., 2020).
Wealth holdings vary by many of the same group traits that cause income to vary including age, education, household composition, geography, and race/ethnicity. U.S. households with children are less wealthy than households without children. In 2019 they had a median wealth level of $64,050 compared with $114,850 of households with nonresidential children. They are also more unequal than nonchild households, with a Gini coefficient of 0.90 compared with 0.86 for nonchild households (Gibson-Davis & Hill, 2021).
Trends in Wealth and Wealth Inequality By Race/Ethnicity
A focus on wealth reveals extreme economic inequality by race/ethnicity. In 2019, median wealth for White households was $188,200 compared
___________________
1 These values do not include defined benefit pension assets. The Federal Reserve estimates that median wealth increases to $172,000 when inclusive of defined benefit reserves (Bricker et al., 2020).
with $24,100 and $36,100 for Black and Latino households, respectively (Bhutta et al., 2020). Few datasets are available that specifically track the wealth of Native Americans, but research from the National Longitudinal Survey of Youth estimated that in 2000, the median wealth for Native Americans in the survey was $5,700, compared with the median wealth of $65,000 for the sample overall (Zagorsky, 2006).
Percheski and Gibson-Davis (2020) found that between 2004 and 2016, Black-White wealth inequality grew faster in households with children than among all households. By 2016, they found, non-Hispanic White child households had a median wealth of $47,250, compared with a median wealth of $294 among Black child households. Pfeffer and Killewald (2019) found that Black children born in the middle 22% of the wealth distribution are 2.5 times more likely to fall into the bottom 20% of the wealth distribution than White children born into the same tier of wealth.
Causes of Wealth Inequality Trends
Kuhn et al. (2020) explored trends in household wealth inequality between 1950 and 2016, and the growing concentration of wealth at the higher end of the distribution. They found that private business revenue explains much of the increase for the wealthy minority. Growth in wealth among households in the middle of the wealth distribution has been driven by increases in homeownership and, more notably, home equity.
Several recent papers have examined the importance of intergenerational wealth on present wealth inequality (Adermon et al., 2018; Pfeffer and Killewald, 2018; Toney, 2022). Pfeffer and Killewald (2018) found that grandparent wealth is an independent predictor of adult grandchildren’s wealth using U.S. panel data, and Adermon et al. (2018) found the same with Swedish data. Pfeffer and Killewald (2018) found that for both White and Black families, education explains more of the intergenerational wealth gaps and social-class persistence than homeownership, bequests or inheritances, business ownership, or marriage. Toney (2022) showed that the composition of assets within wealth portfolios is static across generations, although the relationship is weaker among Black households.
Causes of Wealth Inequality By Race and Ethnicity
Racial/ethnic wealth gaps reflect historical and contemporary processes and policies that have predominantly supported wealth accumulation for White Americans and impeded or exploited wealth opportunities for Black Americans from slavery and sharecropping and debt traps to more recent evidence of biased home appraisal practices and targeted subprime
mortgage lending (Bayer et al., 2016; Berger, 2018; Faber, 2013; O’Connell, 2012; Perry et al., 2018; Reece, 2020). Black and Hispanic homeowners had much higher rates of delinquency and default in the downturn. These estimated differences are especially pronounced for loans originated near the peak of the housing boom. These findings suggest that black and Hispanic homeowners drawn into the market near the peak were especially vulnerable to adverse economic shocks and raise concerns about homeownership as a mechanism for reducing racial disparities in wealth. Racial differences in wealth accumulation and growing wealth gaps over time have been also attributed to differences in asset holdings and returns on those investments. In recent decades, greater amounts of financial asset ownership among White households and appreciation in stock equity have rewarded them over time. Returns to housing, where Black households hold much of their wealth, have appreciated less due to longstanding patterns of residential racial segregation (Boulware & Kuttner, 2020; Derenoncourt et al., 2022). Other contributing factors include differences in the incidence and size of inheritances (Bhutta et al., 2020). Not only are White households more likely to receive financial inheritances, but they are also more likely to expect them (Addo & Darity, 2021).
Obstacles to wealth accumulation have also operated partly through disparities in income throughout the life course, as income from employment and capital are the primary ways households are able to set aside money to save and build wealth via investments, educational attainment, and asset purchases (Elmi & Lopez, 2021). Derenoncourt et al. (2022) showed that Black-White differences in savings rates are explained by initial wealth levels, age, and education, and Gittleman and Wolff (2004) found no differences in savings after accounting for income.
Background Section for Interventions
EITC Proposal
Graphs depicting the three examples of modifications to the EITC are shown in text Figure 6-7. In the panels for Options 1-3, the 2022 EITC payment for a single parent with two children is shown as a solid line. The phase-in and phase-out rates (the slopes of the two lines), the maximum credit, and the exact locations of the earnings thresholds all vary with family size, but the general pattern is similar. The final graph shows only the incremental credit payments associated with each one.
Taking the example of Option 1, the solid line in the figure shows the current (2022) value of the credit as a function of family earned income. Families with zero earnings are not eligible for any EITC benefits. As family
earnings increase up to $15,410 (the “phase-in” portion of the schedule), EITC payments increase as well—up to a maximum payment in 2022 of $6,164. Between $15,410 and $20,130 (the “flat” portion), this maximum payment is constant. Once earnings exceed $20,130, the credit payment is gradually reduced, so that when earned income reaches about $50,000, EITC payments fall to zero. The dashed line shows how much higher tax credit payments would be if all payment amounts from the 2022 schedule were increased by 40%.
Combining the EITC with Other Programs to Increase Income Stability
The committee considered expansions along the lines of the 2021 Child Tax Credit, which made credits available to families without earnings without increasing the incentive to work. On the plus side, it would provide resources to more low-income families with children than the EITC alone, but it would probably lead to a reduction in maternal employment relative to the status quo. Option 3 in Figure 6-7 combines the addition of credits for families without earnings with an increase in the credit for those with earnings, in order to preserve (and indeed increase) the incentive to work relative to current policy.
The EITC’s annual payments are typically distributed as tax refunds 1 or 2 months after the end of the year in which the income is earned, which may limit the credit’s usefulness in financing recurrent monthly expenses, like child care. Prior work has shown that the lump-sum annual nature of the EITC leads to fluctuations in spending and food security across the year (Batra & Hamad, 2021; McGranahan & Schanzenbach, 2013). It also could limit the work-promoting effects insofar as this annual structure restricts the ability of new mothers to use the credit to finance child care during their first year as new parents. At the same time, the annual structure of the EITC makes it a form of involuntary savings, which people use to help purchase durable goods that are likely to increase workforce participation, such as vehicles (Goodman-Bacon & McGranahan, 2008). The temporary, 6-month-long expansion of the Child Tax Credit (CTC) in 2021 was implemented as a monthly advance payment, and early quasi-experimental evidence indicates that the 2021 expanded CTC improved household food sufficiency and parental mental health (Batra et al., 2023; Shafer et al., 2022). This indirect evidence suggests that more regular payments could help to provide more income stability, though there is no rigorous evidence of the effect of a monthly payment structure on employment, earnings, or multiyear poverty.
The report discusses several combinations of the EITC proposals with other programs that might help increase income stability. Here are more details for the three possible options listed in the text:
- Combine an expansion of the EITC with expanded coverage of the Child Care and Development Fund block grant. Evidence reviewed in the report suggests that the Child Care and Development Fund child care subsidies have raised maternal employment, especially in low-income families. Because these subsidies are paid when child care services are received, they help to address the mis-timing problem that arises between child care expenses and EITC receipt during a child’s first year of life.
- Combine an expansion of the EITC with a restructuring of the Child and Dependent Care Tax Credit (CDCTC) to provide more generous and timely reimbursement for the child care expenses of low-income parents. Following Ziliak (2014), the National Academies (2019a) report proposed making the CDCTC fully refundable and, for low-income families with children under age 6, reimbursing up to $4,000 per year in child care costs for the first child and a total of $6,000 for two or more children under age 6.
- Combine an expansion of the EITC with a monthly refundable CTC. An expanded CTC was also recommended in the 2019 National Academies report and was temporarily implemented for the 2021 tax year. This would be most feasible for an expansion such as EITC expansion Option 3. Past efforts to provide the EITC as a monthly payment have encountered resistance from recipients who were concerned that they might have to repay the credit if their earnings turned out to be lower than expected. Thus, this combination would be most feasible for expanding Option 3, which guarantees at least $1,000 per child for all families with earnings lower than $43,560.
The Minimum Wage
In theory, minimum wages have offsetting effects: They raise wages for some workers, but by increasing the cost to businesses of employing workers, they reduce employment. Thus, their impact on poverty is theoretically ambiguous.
It is worth noting that even the employment effect is itself ambiguous. While competitive models of the labor market yield an unambiguous prediction of negative effects on employment, in other models that allow for employer market power, job search, or other deviations from perfect competition, modest minimum wages can have small or even positive effects
on employment. Even in these models, though, sufficiently large minimum wage increases will reduce employment. These models are well reviewed by Dube (2019a) and Belman and Wolfson (2014).
It is thus an empirical question whether increases in the minimum wage will reduce employment, and by how much. There is no consensus in the economics literature about the exact amount, with high-quality studies reaching opposite conclusions. Neumark and Shirley (2021) observe that the minimum wage is an unusual research topic in that the state of the literature itself is under fierce debate.
Neumark and Shirley assemble the entire set of published minimum wage studies from the past three decades. They identify the “core estimates” from each study, in most cases identified by the authors of the studies. They find that 79.2% of estimated employment elasticities are negative, and that the evidence of negative employment effects is even stronger for teens and young adults, lesser-educated workers, and workers directly affected by the minimum wage. This is surprisingly consistent with other literature reviews. For example, among the 36 papers he considers, Dube (2019a) obtains a median estimate of the own-wage elasticity (the percentage employment reduction induced by a 1% increase in average wages induced by a higher minimum wage) of −0.17. Of those 36 studies, 26 are based on “narrow subgroups,” including teens, restaurant or retail workers, and lower-educated immigrants. Among those 26 studies, Dube reports a median own-wage elasticity of −0.19.
This negative average effect reflects a number of estimates indicating positive or zero effects. One prominent recent study (Cengiz et al., 2019) finds that each 1% increase in average wages induced by increases in the minimum wage actually raises employment by 0.41%, though the confidence interval includes some negative effects, as large as −0.45%. This implies that employment reductions offset no more than half of the effect of wage increases. Other studies come to similar conclusions as Dube’s (2019a) review. Clemens and Strain (2021) estimate own-wage elasticities of −0.26 for less-educated workers and −0.23 for younger workers.
In the committee’s view, the evidence supports an own-wage elasticity in a range that includes near-zero, that is centered around −0.2, and that includes larger magnitudes for certain subgroups of workers.
Some studies find that larger minimum wage increases are associated with relatively larger employment reductions—that is, the employment elasticity is nonlinear. The average minimum wage increase in the 138 state-level changes studied by Cengiz et al. (2019) was around eight log points. Clemens and Strain (2018, 2021) studied the last decade of minimum wage increases and found little evidence that “small” increases of under $1 are associated with disemployment effects. For “small” increases, Clemens and Strain’s results are qualitatively similar to the results in Cengiz et al. Dube
(2019a, p. 3) concludes that “the best evidence suggests that the employment effects are small up to around 59% of the median wage.”
However, Clemens and Strain find larger disemployment effects of “large” increases of over $1. Among individuals ages 16–25 with less education than a high-school degree, they find that a one percent increase in wages induced by a higher minimum wage reduces employment by around one percent. For workers ages 16–21, they find a reduction in employment of −0.4%.
Jardim et al. (2017, 2018, 2022) studied Seattle’s path to a $15-per-hour minimum wage, which reached as high as $11 in 2015 and $13 in 2016. Using administrative data from Washington State, Jardim (2022) found larger employment effects than are typically found. However, their point estimates have wide confidence intervals, and their results are also consistent with a selection effect deriving from the booming Seattle economy, or even spillovers from the minimum wage itself (Rothstein & Schanzenbach, 2017).
A contrasting result comes from Godoy and Reich (2021), who studied low-wage counties where minimum wages reached as high as 82% of the median wage. They did not find adverse effects of minimum wage increases on employment, hours, or annual weeks of work.
Another outstanding question is whether the long-run effects of minimum wage increases differ from the short-run effects that have been more studied. Clemens and Strain (2021) found that the medium-run disemployment effects of relatively large minimum wage increases are larger than the short-run effects. Meer and West (2016) argue that minimum wage increases affect employment by reducing its growth over time rather than by quickly reducing its level. Adjustment costs—driven in part by firm entries and exits within an industry—might help explain larger longer-term disemployment effects (Aaronson et al., 2015; Sorkin, 2015). Brummund and Strain (2020) found larger disemployment effects from the practice of indexing minimum wage increases to inflation, and speculate that modest, nominal increases are easier for firms to absorb without adjusting headcount than longer-lasting increases.
A minimum wage increase could reduce poverty even if it also reduces employment, if the benefits to the still-employed workers are larger than the costs to those who lose employment. (Note that for any own-wage elasticity above −1, the aggregate earnings of near-minimum-wage workers rise; the literature is clear that employment responses are much smaller than this threshold.) The picture is clearer here; studies generally find at least some poverty reduction (as measured by the Official Poverty Measure) from minimum wage increases, though there is disagreement about the magnitude. Dube (2019b) found that over three or more years, each 10% increase in the minimum wage reduces poverty by between 2.2% and 4.6%, a large effect. Godoy and Reich (2021) found substantial declines in both household and child poverty.
Other studies suggest much smaller effects. Using Survey of Income and Program Participation data from 1996 to 2007, Sabia and Nielsen (2015) found little evidence that federal or state minimum wage increases reduce poverty, material hardship, or receipt of public program benefits among workers, younger individuals without high school degrees, or younger black individuals. Neumark and Wascher (2002) concluded that the minimum wage redistributes income among low-income families. They found that minimum wage increases make it more likely that poor families escape poverty, but also more likely that families above the poverty line fall into poverty. These effects roughly offset one another.
As with employment effects, the best available option is to try to aggregate these disparate findings. The Congressional Budget Office (2019) concluded that the weight of the evidence points to modest effects on poverty. Using the TRIM3 model and the Supplemental Poverty Measure, the National Academies’ Roadmap to Reducing Child Poverty (2019a) estimated modest poverty reductions from minimum wage increases, as well.
Union-related Interventions
The Chapter 6 text discusses the contribution that the decline in unionization has made to low wages and poverty, particularly for non-college workers. An expansion of union representation in the U.S. labor market would lift the wage distribution and reduce both parents’ and children’s poverty. Policies to accomplish this are a perennial topic of discussion. Advocates for unions argue that the legal framework created by the National Labor Relations Act no longer works well, and that it is too easy for employers to prevent union recognition through both legal and extra-legal methods.
Proposals include changes in the union recognition process, changes in the rules governing union behavior, and changes in the way that union bargaining units are funded. In the former category are proposals like “card check” recognition, whereby unions can be recognized based on a majority of workers signing cards in support, outside of a formal election. Another proposal, contained in the Protecting the Right to Organize (PRO) Act introduced in 2021, would prohibit employers from holding mandatory meetings from which union representatives are barred, to argue against the union. The PRO Act also includes provisions that would permit secondary strikes to place pressure on employers to recognize or bargain with unions, increase fines for employers who violate labor law, and weaken state “right to work” laws. The evidence base for these proposals is limited, and the report does not include specific recommendations regarding unions or labor law.
Assisting and Incentivizing the Creation of More Good Jobs
Besides increasing union membership or raising the minimum wage, other proposals to help or incentivize employers to create more “good jobs”—jobs with atypically high pay relative to the skills of workers (Andersson et al., 2005)—have already been implemented or proposed and are under discussion.
For instance, the Biden Administration has created a Good Jobs Challenge at the U.S. Department of Commerce and a Good Jobs Initiative at the U.S. Department of Labor. The former is a competitive grants program to fund training explicitly linked to “good jobs,” using $500 million allocated to the Department of Commerce from the American Relief Plan Act of 2021.2 The latter seeks to improve worker awareness of ways to improve job quality, and also to form partnerships between the department and employers or various government agencies (with appropriate technical assistance) to help create more good jobs.3
Regarding incentives and assistance to firms, the idea of rewarding firms for creating good jobs is embodied in a legislative proposal called the Patriot Employer Tax Credit, proposed by Senators Brown (D-OH) and Durbin (D-IL) in 2021.4 Another approach is to provide tax credits to publicly owned firms that set themselves up as “B-corporations” (or “Benefit” corporations) rather than the more traditional “C-corporations”; the former allows firms to explicitly consider benefits conferred on workers and society among its goals, while the latter allows firms only to maximize shareholder value. Kim (2018) has called for encouraging the formation of more B-corporations through explicit corporate tax cuts.
Regarding assistance to state, local, and regional government agencies and their partners, Rodrik (2022) calls for assistance at the local level to economic development partnerships that will create more “good jobs,” while calling for federal creation of a new entity (which he calls the Advanced Research Partner Agency for Workers) to fund technological innovation that is worker-friendly and would therefore create more good jobs as firms automate. In addition, Congressman Ro Khanna (D-CA; 2022) has proposed a range of such efforts, though they are focused on smaller cities and rural areas that have suffered job and income loss in recent decades.
Of course, while these kinds of ideas have some broad support, we have virtually no rigorous evidence to date on their cost-effectiveness. Further
___________________
2 https://eda.gov/arpa/good-jobs-challenge
3 https://www.dol.gov/newsroom/releases/osec/osec20220121#:~:text=The%20%E2%80%9CGood%20Jobs%E2%80%9D%20initiative%2C,all%20workers%20and%20job%20seekers
4 https://www.congress.gov/bill/116th-congress/senate-bill/223/text?q=%7B%22search%22%3A%5B%22S.+524%22%5D%7D
experimentation with and rigorous evaluation of such efforts is justified and needed.
Improving Access of Disadvantaged Workers to Better Jobs
Proposed or actual efforts to improve employment opportunities for the most disadvantaged workers—such as returning citizens (people released to life in the community after incarceration) or those with particular disabilities, especially among people of color—take a variety of approaches. These include:
- Strengthening enforcement of federal Equal Employment Opportunity (EEO) law provisions that forbid broad discrimination against returning citizens;
- Providing direct assistance to workers who face employment barriers;
- Offering incentives or assistance to employers who hire such workers or are located in impoverished locales, where many such workers live; and
- Issuing federal “Second Chance” grants to states and localities or other partnerships that provide job training and other assistance to returning citizens or other hard-to-employ groups.
EEO law forbids employers to explicitly deny employment to anyone with a felony conviction or criminal record—since it creates a disparate impact on less-educated men of color—unless the decision to deny is explicitly tied to the requirements of a job, the offense committed by the job applicant, whether he or she has reoffended since that time, and the duration of time that has elapsed since the last conviction (U.S. Equal Employment Opportunity Commission, 2012). The Equal Employment Opportunity Commission has also brought some high-profile cases against major private firms that appeared to violate such rules (such as BMW and Dollar General) and obtained convictions against them.
Still, it is almost certainly true that many employers, especially in small- and medium-sized companies, violate these rules. There are also literally thousands of federal and state rules that explicitly bar returning citizens from particular occupations where they are perceived as being high-risk (especially those involving children or very elderly populations that are regarded as more vulnerable), and from obtaining occupational licensure. Scholars in this area understand that some of these restrictions are sensible, while others might be less so (Bushway et al., 2022). Thus, efforts to both increase enforcement of existing law and periodically review other barriers
created by various federal or state rules might constitute a reasonable way to reduce such barriers and hardships.
Direct assistance to workers who face these barriers to employment includes subsidized or transitional jobs, in which a public or nonprofit entity funds temporary jobs for these workers—usually for 6 to 9 months in duration—with a public or private employer, in the hope that the worker’s employability grows over time and might eventually be sustainable without any public assistance. The primary goal is therefore to raise employment and earnings during the time of the subsidy as well as afterwards, and to reduce long-term dependence on government benefits or incarceration. But, except for a few well-known success stories (like the Center for Employment Opportunity in New York or Recycle Force in Indiana), short-term employment improvements usually dissipate fairly quickly once the subsidy expires, and other outcomes, like recidivism, are not broadly improved except for specific populations (Cummings & Bloom, 2020).
Another approach involves efforts to allow more offenders to participate in work release programs while they are still incarcerated (Berk, 2008) or to facilitate their hiring through the issuance of “certificates of rehabilitation” or “certificates of relief” (Leasure & Anderson, 2016). Evidence suggests positive and cost-effective impacts of both approaches, though only small efforts have been rigorously evaluated to date.
Direct assistance to employers who hire returning citizens or others facing such barriers are provided by the Work Opportunity Tax Credit. This is a federal tax credit to companies that hire from a list of workers facing such barriers, including “returning citizens;” but take-up by employers is usually low, and evidence of its cost-effectiveness in expanding employment and earnings is quite limited (Hamersma, 2008).
Another body of policies includes incentives, like tax credits, to employers who locate in low-income parts of cities and want their concerns validated. Neumark (2018) reviewed the evidence to date on “enterprise zones” and other tax credits associated with location in or near neighborhoods, finding that such programs are generally not effective or cost a great deal of funding per net job created for the low-income adults. He also includes his own proposals for subsidies to firms that hire low-income local residents.
Finally, the federal government has funded some “second chance” programs with grants to states or to partnerships of employers and other community-based organizations. Examples include the Reentry Employment Opportunities (REO) program and Pathways Home, both administered by the U.S. Department of Labor. Rigorous evaluations of these efforts are in progress, though such evidence is not yet available to date.
Overall, more experimentation with and evaluation of a wide range of such policy efforts is encouraged, including attempts to scale programs like REO that appear successful.
Steps to Increase the Wealth of Low-Income Households
Attempts to increase the wealth of low-income households and improve short-term outcomes for their families and longer-term outcomes for their children have focused on building financial savings in preparation for paying for college. This is unsurprising given that a college degree remains one of the key engines of social mobility in the United States (Hout, 2012). Thus, intergenerational poverty is reduced through the educational attainment of one’s children. More specifically, in obtaining a college degree, that wealth is a necessary component for enrolling in, persisting through, and completing one’s degree. Proposals include expanding college savings plans (i.e., 529 plans), encouraging child development accounts (CDAs), and obtaining assets, such as by becoming a homeowner. Although promoting homeownership was not its original intent, the mortgage interest deduction is the main federal program associated with promoting homeownership. This tax benefit for homeowners with a mortgage is regressive, disproportionately benefits White households, and is not associated with reducing costs of entry for low-income households (Meschede et al., 2021; Sommer & Sullivan, 2018). Therefore, efforts to increase wealth through financial savings program are the focus.
Unlike 529 college savings plans, CDAs are savings plans primarily targeted at low- and moderate-income families. They are designed to reduce the barriers to long-term household savings by eliminating transaction costs while decreasing cognitive burdens. CDAs have been associated with college retention (Elliott & Beverly, 2011) and reduced college debt (Elliott et al., 2014). Evidence from national CDA studies on low-income households found that parents in the treatment group were more likely to open 529 plans and accumulate higher average balances. Except for the initial seed deposit, these initiatives rely on policy levers such as matching funds and the motivations of the parents to build savings. They draw upon the already limited resources of these households rather than increasing the inflow of assets into them. When initial seed money was provided, it was found to be low ($500–1000) and did not increase the average amount of personal savings held (Grinstein-Weiss et al., 2014).
To raise wealth among low-income households, especially those of Black and Native American families, the committee considered proposals to create Baby Bonds for children born in the United States, with the value of the bonds determined by the family’s income and net worth at the time of the child’s birth and targeting families with incomes below the SPM thresholds and total net worth less than one fourth of the federal poverty line.
Baby Bonds would address the intergenerational perpetuation of wealth inequality via familial inheritance and inter vivo wealth transfers (Darity & Hamilton, 2012; Hamilton & Darity, 2010). The approach recognizes
that a substantial wealth endowment is necessary for social and economic prosperity. Similar to CDAs, these funds would be earmarked for the child’s college costs, homeownership, or business investments, so they would not be accessible until young adulthood; in contrast to CDAs, the initial investment funds would be means-tested and require no additional monies from the households.
In the United States, the idea of Baby Bonds has captured the interest of scholars and politicians for many years. The idea is currently being tested in Washington, DC, and Connecticut. In fall 2007, as part of her 2008 presidential bid, Hillary Clinton proposed a $5,000-at-birth baby bond, which she mentioned again on the presidential campaign trail in the fall of 2016 (Matthews, 2019). In the 2020 presidential election, candidate and U.S. senator Cory Booker leveraged the research of economists Darrick Hamilton and William Darity (2010) to announce his new Baby Bond bill, American Opportunity Accounts (Kliff, 2018). Notably, the American Opportunity Accounts legislation calibrates the amount of the endowment based on parental income, although the original version of the proposal calibrates the amount based on parental wealth. The proposal had an estimated cost of 2% of federal expenditures.
There has been limited research conducted on the impact that Baby Bonds could have at a national level. Zewde (2020) used longitudinal data from the Panel Study of Income Dynamics to simulate wealth accumulation among young adults (18–25-year-olds in 2015) if they would have received Baby Bonds when they were newborns. Individuals were divided into five quintiles of household wealth at birth, with initial bond values defined categorically and tied inversely to household wealth at birth (from $200 for the top 20% of households to $50,000 for the bottom 20%). Bond values were assumed to grow at 2% annually through 2015. The estimated cost of this proposal is $82 billion per year.
The American Opportunity Accounts proposal is like Zewde’s with the exception that means-testing would be based on household income, not wealth. Households would receive $1,000 at birth and up to $2,000 every year through age 18, with 2% to 3% annual returns.
Baby Bonds are a universal wealth intervention program that could yield a disproportionate benefit for Black and Native American families, because their wealth (and income) levels are so low. However, even if the assumptions in Zewde’s simulation are basically sound, a Baby Bond program that markedly narrows the racial gap in wealth by early adulthood still leaves other drivers of the racial wealth gap in operation as youth move through adulthood (e.g., differential incomes, differential savings, differential rates of return on real estate, differential inheritances; Bruenig, 2019). This argues for considering Baby Bonds as part of a package of strategies to reduce racial/ethnic disparities in wealth (Cassidy et al., 2019).
APPENDIX C: CHAPTER 8
CHILDREN’S HOUSING AND NEIGHBORHOOD ENVIRONMENTS
This appendix provides details on a number of intervention areas mentioned in Chapter 8.
Evidence on Housing Assistance for Intergenerational Mobility
Housing assistance comes in many forms, including rapid housing services, housing choice vouchers (HCVs), public housing, project-based vouchers, tax credits, and other state and local programs for both renters and homeowners. In various ways, these means-tested programs reduce the cost of housing for low-income families. Currently, the largest federal housing subsidy is the mortgage interest deduction for homeowners, which mostly benefits middle- and high-income households. For low-income households, the Low-Income Housing Tax Credit program (LIHTC) is the largest housing subsidy program. LIHTC provides funding to investors for the costs of developing low-income rental housing.
It is possible that housing subsidies alone—without requirements about where recipients use them—might decrease intergenerational poverty; however, the evidence on this is mixed and limited. As an income subsidy alone, housing assistance lifted roughly three million people out of poverty in 2019, including 936,000 children (Fischer et al., 2021). This intervention interrupts child poverty and thus makes it more likely that children will remain out of poverty as adults. Furthermore, housing assistance is not merely an income subsidy, but may also improve housing quality, promote stability, and reduce parental stress (Gubits et al., 2018; Schapiro et al., 2022; Warren & Font, 2015; Wood et al., 2008).
Correlational studies of the effects of housing assistance on children’s outcomes show positive results, such as reduced blood lead levels (Ahrens et al., 2016), less overcrowding and grade retention (Currie & Yelowitz, 2000), and improved performance on standardized tests (Schwartz et al., 2020). Longitudinal studies find positive effects of growing up in various kinds of subsidized housing on educational attainment, employment, and earnings (Kucheva, 2018; Newman & Harkness, 2002). Using national data on over 1.7 million children eligible for or receiving housing assistance and using a between-sibling analytical model, Pollakowski et al. (2022) found that growing up in public or HCV housing increases earnings for all groups, and reduces adult incarceration at age 26, especially for Black women. In addition, a handful of quasi-experimental studies comparing families receiving Department of Housing and Urban Development assistance with families on a waiting list have consistently found improved
health outcomes, including better child mental health, and fewer missed school days and better physical and mental health among adults, a reduction in the uninsured rate, and fewer unmet medical needs (Fenelon et al., 2017, 2018, 2021; Simon et al., 2017).
However, the evidence from randomized trials or natural experiments regarding the long-term effects of housing subsidies on children does not show uniformly positive effects. The Welfare to Work Voucher Experiment offered vouchers to families receiving welfare in six cities. It reduced poverty, homelessness, crowding, and residential moves, but it showed no consistent direct effects on children’s educational or socioemotional outcomes (Wood et al., 2008). The authors of that study suggest that longer-term tracking of outcomes for children is warranted by the short-term housing impacts. A study of an HCV lottery in Chicago found no statistically significant effects of receiving a housing choice voucher for children’s long-run educational, criminal, or health outcomes up to 14 years after the lottery (Jacob et al., 2015).
On the other hand, the Family Options Study—which was a randomized controlled trial at 12 sites that offered permanent housing subsidies to families experiencing homelessness—reduced homelessness, food insecurity, the number of schools that children attended, school absences, and behavior problems among children by the 3-year follow-up. Other experimental and quasi-experimental research, such as studies of the Moving to Opportunity (MTO) experiment (discussed in Chapter 8) or public housing demolitions, cannot compare the effects of receiving or not receiving housing subsidies, since all participants were in either voucher or public housing at baseline. While MTO gave vouchers without restrictions on where they could be used, all families already had housing assistance by virtue of living in public housing. Although correlational and longitudinal evidence is available on the positive long-term effects of housing subsidies, there are few randomized studies. It is also important to note that although the LIHTC program has surpassed the HCV program in the number of households served, there is no correlational or causal evidence on the long-term effects of tax credit units.
There are many proposals for increasing housing subsidies for low-income families. Collinson et al. (2019) discuss a range of considerations in making the current policy landscape more effective. They believe that the variation in local markets renders a one-size-fits-all housing policy less effective. They also discuss the possibility of broadening the reach of current subsidy dollars by providing more “shallow” subsidies and possibly time limits, instead of the long and deep subsidies that the HCV, LIHTC, and public housing currently offer. Finally, they point out the need to address locational challenges with the disproportionate siting of public housing and LIHTC units and the disproportionate concentration of HCVs in
high-poverty neighborhoods, both of which contribute to intergenerational poverty.
In another proposal, Collyer et al. (2020) focus less on how housing subsidy programs function and more on expanding their reach. They propose combining a universal entitlement to housing assistance with increased Earned Income Tax Credit (EITC) and Child Tax Credit funding. They estimate that the expansion of the HCV alone would cut the national poverty rate by 9%. Overall, housing assistance is an area that needs a stronger causal evidence base. Several experts we consulted suspected there was promise for housing subsidies to improve long-term outcomes, but lacked the strong evidence to support that view without uncertainty.
Evidence on Improving the Housing Supply
It is important to complement efforts to increase demand for housing in high-opportunity neighborhoods by expanding the supply of housing overall, which could increase supply in neighborhoods that are good for children’s long-term outcomes. Researchers agree that there is a supply problem in the United States, but there is debate about the reasons for low supply and the consequences for affordability (Been et al., 2019; Schuetz, 2022). Boosting supply using existing policy might be achieved by incentivizing development through a targeting of LIHTC projects in opportunity-rich areas, as well as by relaxing zoning restrictions (i.e., “upzoning”) in high-opportunity neighborhoods. While we do not have direct evidence on the efficacy of such interventions, research shows that the price of opportunity—that is, the ratio of average levels of upward mobility to average rent—is currently much higher in metro areas that have stricter land use regulations (Chetty et al., 2016).
Evidence on Improving Neighborhood Characteristics
While the best evidence to date on the intergenerational mobility effects of improving housing and neighborhoods for children focuses on moving to higher opportunity neighborhoods, it is equally important to consider how to bring better opportunities to neighborhoods that currently do not offer good prospects for upward mobility. There is a growing body of strong experimental evidence that remediating vacant lots and abandoned buildings reduces crime and violence (Branas et al., 2018), and there is correlational evidence that increasing the density of community organizations and increasing community investments (e.g., through mortgage dollars) also reduces crime (Sharkey et al., 2017; Velez et al., 2012). This literature is reviewed in Chapter 9. There is also evidence that desegregating neighborhoods, improving the quality of schools, reducing pollution, and focusing
on factors such as social capital may help to promote intergenerational mobility (Ananat, 2011; Card & Krueger et al., 1992; Hohl et al., 2019; Isen et al., 2017; see Chyn & Daruich, 2022, for a simulation analysis).
Evidence on Improving Housing for Native Americans
Native American families face distinct housing-related barriers to intergenerational mobility. Overcrowding, poor housing quality, homelessness, infrastructural deficits, complex land ownership, and limited mortgage availability are acute issues for Native Americans, especially on reservation lands (Kunesh, 2021; Pindus et al., 2017). Advocacy organizations, such as the National American Indian Housing Council, call for the reauthorization of the Native American Housing Assistance and Self-Determination Act of 1996, which expired in 2013. Congress has continued to fund its programs every year, in any case, but continued appropriations have not kept up with housing needs (Walters, 2022). Moreover, self-determination and community control are important prerequisites for Native American housing justice (Kunesh, 2021). We could identify no studies on the short- or long-term effects of targeted housing interventions on Native American children.
APPENDIX C: CHAPTER 9
NEIGHBORHOOD CRIME AND CRIMINAL JUSTICE SYSTEM
This appendix discusses the nature and causes of trends in crime and incarceration, as well as racial/ethnic differences in those trends. It then provides details on a number of the intervention areas mentioned in Chapter 9.
Trends in Crime and Incarceration: Causes and Policy Implications
Declines in Crime Over Time
After peaking in the early to mid-1990s, crime in the United States fell dramatically to levels not observed since the 1960s (see Figure C-9-1). Between 1993 and 2019, violent crime per 100,000 declined from 747 to 379 and property crimes fell by a similar proportion, from 4,740 to 2,109
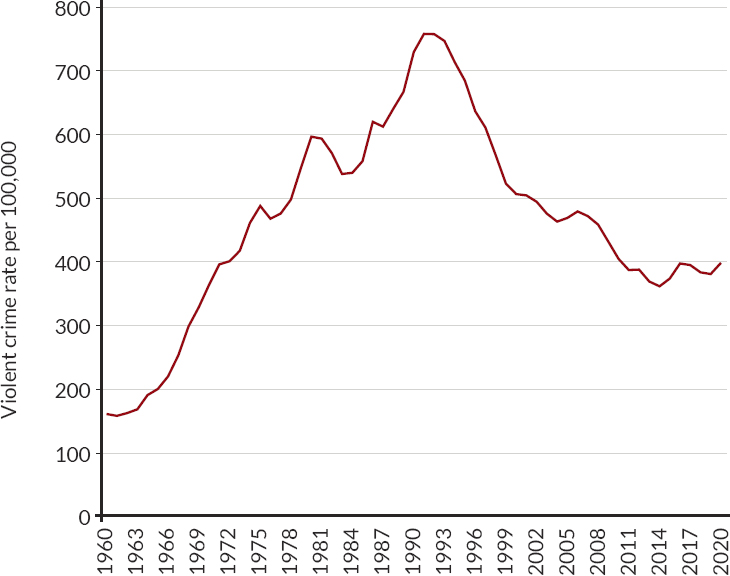
NOTE: The violent crime rate is the sum of reported homicides, rapes, robberies, and aggravated assaults per 100,000 people in the United States.
SOURCE: Figure adapted from James (2018) for years 1960–2016 and using data from the Federal Bureau of Investigation’s (2022) Crime Data Explorer for violent crimes for years 2017–2021.
(Gramlich, 2020). Violent crime has again risen somewhat since 2014 (FBI, 2019a, Table 1), and homicides have spiked since 2019, although those rates remain well below their peak in the early 1990s. Nearly 80% of all recent homicide victims are killed with guns (Johns Hopkins Center for Gun Violence Solutions, 2022), and new “right-to-carry” laws in many states have contributed substantially to the surge in gun violence (Donohue et al., 2022). One aspect of violent crime that has not declined over time is school shootings, which increased over the past 50 years more than tenfold, from 19 in 1970 to 240 in 2021 (Naval Postgraduate School, 2023)
Concurrent with the decline in crime has been unprecedented growth in incarceration in the United States, which increased by a factor of three or four between 1980 and 2013 (Figure 9-5). While crime began to fall starting in the early to mid-1990s, incarceration rates continued to increase through 2009, peaking at 1.61 million individuals in U.S. state and federal prisons. Some of the persistently high rates of incarceration in the United States can be traced to those cohorts coming of age in the 1980s and 1990s, when the punitiveness of the criminal justice system increased, resulting in high incarceration rates for these cohorts. Researchers have shown that even though current punitiveness has declined, because the current sentencing structure escalates punishment for those with prior offences, those who came of age in the 1980s and 90s have continued to be incarcerated at high rates for many years after (Shen et al., 2020).
The population of adults in prison is largely male, with low levels of formal education (the majority have less than a high school degree) and disproportionately Black, and to a lesser extent Latino (Raphael & Stoll, 2013; see Figure C-9-2). The increase in incarceration is explained in large part by tougher sentencing laws. Lofstrom and Raphael (2016, p. 123) conclude that “the vast expansions occurring during the 1990s and during the first few years of the new century have bought little in terms of crime reduction but imposed substantial costs on the sanctioned, their families, and their communities.” This suggests that most of the decline in U.S. crime over this period can be explained by other factors, such as the aging of the population, the waning of the crack-cocaine epidemic, a decline in blood-lead levels in children following the elimination of lead from gasoline, and policing practices (Lofstrom & Raphael, 2016).
Juvenile Crime and Confinement
Like adult crime, juvenile crime has been declining over time from a high in the mid-1990s through 2019. Unlike adult incarceration, however, juvenile confinement has decreased by 60% since 2000. This decline is primarily attributed to falling crime rates, though increasing reliance on
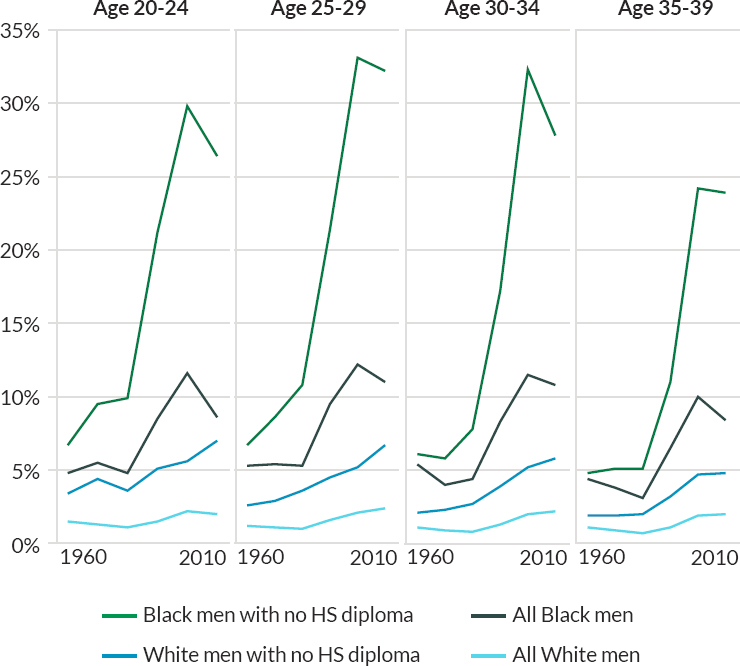
NOTES: Data represent the percentage of each group experiencing incarceration in a given year. Percentages were calculated using cohorts of births in 5-year increments. Data on incarceration come from 1960 to 2000 U.S. Census data and the 2010 American Community Survey from IPUMS.
SOURCE: Data from Neal and Rick (2014).
diversion and other alternatives to detention, as well as capping juvenile sentences, may have played a secondary role.
It is important to note that despite the decline in juvenile detention, youth are still incarcerated in the United States at rates far higher than in nearly all other countries (Nowak, 2019). Moreover, while for all young people involvement in the criminal justice system has fallen, Black, Latino and Native American youths are still significantly more likely than their White counterparts to be arrested, referred to court, and placed in out-of-home facilities after adjudication (Office of Juvenile Justice and Delinquency Prevention, 2022; see Figure C-9-3).
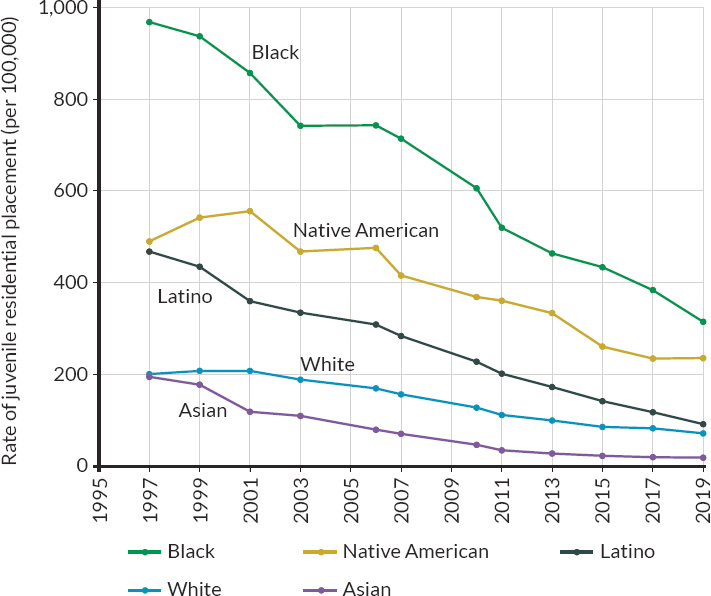
SOURCE: Data from Office of Juvenile Justice and Delinquency Prevention Statistical Briefing Book. https://www.ojjdp.gov/ojstatbb/special_topics/qa11801.asp?qaDate=2019
Disproportionate Impact on Communities of Color
The declines in crime experienced since the mid-1990s were felt most profoundly in poor communities and Black and Latino neighborhoods (Kneebone & Raphael, 2011). Cities with larger shares of households under the poverty line and of Black and Latino families experienced sharper declines in crime than did higher-income cities. This pattern is observed within cities as well; high-poverty, high-minority neighborhoods have experienced the sharpest declines in crime since the mid-1990s (Sharkey, 2018a). Individual victimization rates by income are not available, but rates by race can be found in the National Crime Victimization Survey. Between 1993 and 2013, the largest declines in violent and nonviolent victimization were experienced by Black and Latino individuals.
But declines in crime have also come at a cost to low-income communities. Incarceration rates tripled between 1980 and 2008, and the share of the adult population under criminal justice monitoring more generally
(probation, parole, prison, or jail) also tripled, with the result that three percent of the adult population in 2013 was being monitored or supervised. It is therefore estimated that 9% of children born between 1999 and 2005 had a caregiver in prison at some point during their childhoods (Finlay et al., 2022). Policing has become more aggressive in many cities. While some policing tactics appear to have reduced crime, not all have had that effect. Policing tactics such as stop-and-frisk, for example, do not appear to have reduced crime in New York City; instead, it appears that they have reduced the educational attainment of young people most likely to be affected by frequent police stops (Bacher-Hicks & de la Campa, 2020; Cullen & Grawert, 2016).
Overall, the increase in criminal sanctioning in the United States has been borne largely by poor, Black, Latino, and Native American families. This has imposed substantial costs on poor families, causing an increase in household debt from fines (Harris et al., 2010) as well as a decline in earnings and household resources owing to incarceration (Comfort et al., 2016; Johnson, 2009; Mueller-Smith, 2015). Research has documented strong correlations between parental incarceration and children’s problematic behavior and depression (Wakefield & Wildeman, 2013), leading to worse health, lower levels of education, and greater reliance on public assistance later in life (Miller & Barnes, 2015). Causal evidence on the intergenerational transmission of criminal justice involvement is mixed; some studies have found that children whose parents were incarcerated are more likely to be incarcerated themselves (Dobbie et al., 2018; Wildeman, 2020), while others have found that parental incarceration actually reduces the probability of child incarceration (Norris et al., 2021).
Underlying Causes
What’s behind recent trends in crime and incarceration for adults and juveniles? The divergence in those trends beginning in the early to mid-1990s, as crime fell but incarceration continued to rise, suggests that the increase in incarceration is driven not by rising crime rates, but by changes in criminal justice policy. Specifically, increasing bail amounts, mandatory minimum sentencing, three-strikes laws, truth-in-sentencing laws, increased plea bargaining, and longer sentencing more generally have all played a role in increasing rates of incarceration. State and local expenditures on jails and corrections rose from $5 billion in 1977 to $30 billion in 2017, with an average annual cost per person in jail of $34,000 (Pew, 2021). Spending on jails as a percentage of local spending is uncorrelated with state crime rates.
While incarceration during the 1980s may have played an important role in reducing the crime that peaked in the early 1990s, research suggests that while crime rates also dropped during the period that followed,
that cannot be attributed to the increased incarceration that occurred at the same time. Canada and Western European nations experienced similar declines in crime beginning in the mid-1990s without increases in incarceration, and California, forced to dramatically reduce the number of people imprisoned in the state, saw crime continue to fall (Sundt et al., 2016). In addition to the studies reviewed in the main text, research has identified other strategies to reduce neighborhood crime and violence:
- Mello (2018) reports that adding one police officer prevents four violent crimes and 15 property crimes.
- Reductions in lead pollution have been shown to have a causal impact on crime and disciplinary infractions in school (Aizer & Currie, 2019; Grönqvist et al., 2020; Reyes, 2007).
- Evidence on “proactive policing” methods like “focused deterrence” and “hot spots policing” is analyzed in Braga et al. (2019b); and a review of the cost-effectiveness of these and other tactics (like community policing) as well as negative evidence on “stop-and-frisk” can be found in the National Academies report on policing (National Academies, 2018).
- Braga et al. (2019a) argue that more effective and targeted policing could reduce gun violence and that more community policing might help repair frayed relationships between the police and residents of color in poor neighborhoods.
- Community efforts to reduce violence appear to be successful, according to Webster et al. (2012), who evaluated the Safe Streets program in Baltimore and showed the benefits of training local leaders to de-escalate situations where violence is likely.
- Safe lighting and environmental design has been shown to lower crime (Chalfin et al., 2021; Cozens et al., 2005).
Direct-Evidence Interventions
Reducing Juvenile Detention
The committee’s policy idea to reduce most or all juvenile detentions and incarceration is based on several bodies of evidence. Most importantly, juvenile detention and incarceration, even for short periods of time and for both nonviolent and violent crimes, is likely to increase the intergenerational persistence of poverty. Detention and incarceration have been shown to reduce the likelihood that a young person will complete high school by about 10 percentage points and increase the likelihood of incarceration in adulthood (Aizer & Doyle, 2015; Baron et al., 2023). Additional evidence shows that youth build “criminal capital” when they are detained; that is,
their arrests after detention or incarceration are influenced by the types of crime committed by the detained or incarcerated youth they interacted with (Bayer et al., 2009).
Furthermore, although impacts on public disorder are a very important issue, the committee knows of no strong research showing that the incarceration of juveniles for low-level offenses promotes public order. Causal studies show that the threat of juvenile detention or incarceration has little deterrent effect. Since more severe sanctions do not appear to significantly deter juvenile offending, it is likely that reducing reliance on prison for juveniles will not increase crime, but may well reduce it (Cullen et al., 2011; Lee & McCrary, 2017; Mulvey & Schubert, 2011).
It should also be noted that if incapacitation is the goal, there are many much cheaper ways to achieve it. Diversion programs for low-risk offenders in adult courts have been shown to reduce incarceration, increase future earnings, and reduce future recidivism (Mueller-Smith & Schnepel, 2021). These results are based on a sample of offenders over age 18, but roughly one-quarter of the sample is aged 18–22, and the impacts are largest for the youngest offenders. Nationally, 25% of juveniles are diverted. National Institute of Justice’s Office of Justice Programs rates juvenile diversion programs as “promising” based on two meta-analyses of evaluation studies that find negative effects on reoffending, although one meta-analysis finds no results (Schwalbe et al., 2012; U.S. Department of Justice, 2015; Wilson & Hoge, 2013). The Adolescent Diversion Program has shown statistically significant reductions in youth reoffending over multiple replication studies (Smith et al., 2004). The program relies on community-based interventions with families and working with young people to identify their goals. Given the high numbers of juveniles detained or incarcerated for nonviolent offenses, there is scope for expanded diversion.
However, diversion for juveniles must accord with best practices for supporting young people who are diverted. According to Schlesinger (2018, p. 60), “current eligibility rules and program requirements often lead to the de facto exclusion of youth of color from formal diversion programs, while punitive responses to small rule violations produce sometimes shockingly low completion rates.” High-needs youth, in particular, have struggled to complete diversion programs. Research suggests that diversion programs for youth should provide needed services in community and home-based settings free of charge and include only youth at high risk of detention or incarceration (and exclude low-risk youth who would otherwise be released on their own).
The Office of Juvenile Justice and Delinquency Prevention (OJJDP) provides grants to state and local agencies to support efforts to improve their juvenile justice system and support delinquency prevention programs. To receive grants, states must demonstrate that they are in compliance
with the core requirements of the OJJDP, which include deinstitutionalizing status offenders, reducing racial/ethnic disparities, and removing or separating all juveniles from adults. However, funding for the OJJDP has declined significantly over time, from $565 million in 2002 to $360 million in 2022. With less funding available to states, but significant monitoring and compliance costs, some states have chosen to forgo OJJDP funding altogether. As of 2019, 48,000 youth were still detained, often for nonviolent offenses or before they had had a hearing, which suggests that there is room for additional declines that would be unlikely to jeopardize public safety. The reduction in OJJDP funding will probably stall progress in this regard. Eliminating the detention of juveniles committing status offenses, technical violations, public order offenses, and nonviolent offenses would reduce juvenile detention rates by 45% (for as many as 13,380 of the 27,635 youth currently in such facilities).1
The committee disagreed about the precise implications of its recommendation. It agreed that the evidence indicates positive impacts on juvenile offenders of moving from detention and incarceration to proven monitoring, supervision, service, and programing strategies, but disagreed about the potential for possible impacts on crime and disorder (McCarthy et al., 2016; Shem-Tov et al., 2022). Thus, most committee members believed that the above principle would eliminate all detention of juveniles for non-felony and nonviolent offenses (and most detention for felony offenses), while others believed that it would merely eliminate most such detention, and less for serious offending.
Reducing Offending Through Human Capital Investments Such as Becoming a Man (BAM)
The committee identifies funding BAM so that it can eventually serve more of the population of at-risk adolescent boys, which is estimated to range between 300,000 and 500,000 annually. This range is based on those at risk of not graduating from high school and/or of arrest. The number of male high school dropouts (excluding those who had obtained GEDs) as of 2018 was approximately 300,000, based on a male graduation rate of 82% (Reeves et al., 2021). Half a million male juveniles were arrested in 2019, the last full year before the onset of the COVID-19 pandemic (Puzzanchera, 2021).
Scaling the intervention to serve this population will likely be challenging, given the need to identify appropriate partners for implementation, and
___________________
1 The remaining youth are in residential treatment (10,256), group homes (3,375), and adult prisons and jails (4,535; Sawyer, 2019).
must be done incrementally. It is important that funding be made available and provided gradually, as the program scales up appropriately over time.
Grants to Remediate Vacant Lots and Abandoned Homes
A possible grant program for neighborhood physical improvements would require cities to use funds to clean up, improve, and erect welcoming fencing around vacant lots or stabilize and treat the facades of abandoned or unsafe and deteriorating homes. Funds must be used in high-poverty (defined, for example, by a Census-based poverty rate of 20% or more) neighborhoods with above-city-average rates of violent crime. Jurisdictions would be allowed to partner with community-based organizations or provide grants for low-income property owners.
Grants to Community-Based Organizations
The American Rescue Plan Act (ARPA) allocated $350 billion to state, local, and tribal governments to support recovery from the global COVID-19 pandemic (U.S. Department of Treasury, 2023). Many cities have partnered with local organizations to address violence, but nonprofit growth in general (not just focused on violence) can decrease community violence (Sharkey et al., 2017). The National Council of Nonprofits has developed principles for distributing these funds, which include recommendations for appropriate (not prohibitive) application, monitoring, and reporting requirements that allow smaller organizations to compete. Existing ARPA money must be spent by 2024. Maintaining the level of funding to nonprofits achieved through ARPA would avoid a contraction of nonprofit capacity and a vacuum in services after this date.
Adopting Proven Policing Strategies
Although policing has been shown to lower crime, especially homicides, and can be an effective means of reducing premature death and victimization, any efforts to increase or enhance policing to reduce crime must consider the potential for strong negative impacts of aggressive policing and frequent stops and searches of low-income and particularly minority youth.
In the case of hiring additional police officers, the cost of each additional police officer in the United States is about $170,000 (in 2022 dollars; Chalfin & McCrary, 2018); every extra $1 billion spent will generate approximately 6,000 officers and save 600 lives (Chalfin et al., 2022), assuming that the crime-reducing returns to new officers do not diminish. Of course, the costs of policing vary greatly across geographic areas, so the
homicide-prevention gains would also be greater in areas where the police cost less.
Reducing Firearms-Related Deaths Among Children and Youth
The rise in firearm-related injuries has occurred against a backdrop of loosened gun restrictions and increased gun ownership: Between 2007 and 2017, the number of guns owned in the United States increased by one-third and now stands at 393 million (Ingraham, 2018).
Indirect-Evidence Interventions
A number of interventions that may be promising avenues for increasing intergenerational mobility by reducing crime and the footprint of the criminal justice system still lack strong evidence of their effectiveness. One set of interventions addresses parental and caregiver interaction with the criminal justice system, which can negatively impact child development through multiple channels, including, but not limited to, a reduction in household resources available for child investment. Another set of interventions provides additional supports to at-risk youth that have the potential to reduce offending and/or the negative impact of interaction with the criminal justice system. More research is needed to establish whether these interventions can increase intergenerational mobility.
Reducing the Negative Impact of Caregiver Involvement in the Criminal Justice System
The high level of caregiver involvement in the criminal justice system among low-income and especially minority children has implications for child well-being. Not only does incarceration reduce earnings during and after detention, but also court fees and fines increase household debt, further reducing the resources available for investing in children. While there is no evidence estimating the direct impact of fines and fees on children, and evidence of the impact of parental incarceration on children is mixed, the committee considered policy proposals that have the potential to increase intergenerational mobility by reducing the disruptions in resources caused by parental involvement with the criminal justice system. Policy proposals explored:
- Courts could consider the best interest of the child in pretrial detention and sentencing decisions.2 Illinois, for example, has recently
___________________
2 Lerer (2013) makes the legal case for why and how such considerations can be codified in law.
- Courts could consider financial obligations to children in setting court fees and fines. Correlational research shows that low-income defendants are less able to pay their court fines and fees (Bing et al., 2022; Sykes et al., 2022), and that legal financial obligations are associated with prolonged contact with the criminal justice system and an increased likelihood of technical violations for people on probation (Link, 2021; Pager et al., 2022; Ruhland et al., 2020). O’Neill et al. (2022) show that fines and fees are concentrated among residents of high-poverty and non-White neighborhoods, and that higher per-capita fines and fees in a neighborhood are associated with a higher neighborhood poverty rate in the future. Relief for parents with criminal legal debt would reduce families’ financial stress and free up resources for investments in children.
amended its state law to mandate that courts consider how a decision to detain or incarcerate a defendant will affect a dependent child. This “Best Interests of the Child Act” became effective in 2020 and has not yet been evaluated.3
Programs to Support At-Risk Youth: Mentorship, Community-Based Support, Restorative Justice, Reduction of Financial Hardship, Reduction in School Shootings
- Choose to Change4 targets at-risk youth and provides them with community-based, individualized support as well as cognitive behavioral therapy to help them process trauma and develop healthy decision-making tools.
- Mentoring. Mentoring relationships provided through programs or occurring naturally have a well-established potential to help reduce delinquent behavior and juvenile justice system involvement among youth. A recent comprehensive review of mentoring programs found evidence of potential benefits, but no evidence yet of reducing juvenile justice system involvement (Hawkins et al., 2020).
- Restorative justice in the juvenile justice system and schools. Restorative justice is defined as a system of justice that focuses on the rehabilitation of offenders through reconciliation with victims and the community at large. Restorative justice has been implemented
___________________
3 The law, Illinois Public Act 101-0471, can be found here: https://ilga.gov/legislation/publicacts/101/PDF/101-0471.pdf
4 https://urbanlabs.uchicago.edu/attachments/dd47d0bf9f85c9543e871d03b25fa1dcc8ee779f/store/cf2bff02b6f54df79d84cd3c2b20d7bd0ec398cdd7a4de0744e6e8860d6f/Choose+to+Change+Research+Brief.pdf
- Restorative justice in the criminal justice system. Meta-reviews (Kimbrell et al., 2022; Wilson et al., 2017) of the evidence on the overall efficacy of restorative justice in the juvenile justice system concluded that overall, it appears to lead to a “moderate reduction in future delinquent behavior relative to more traditional juvenile court processing”; however, there are large variations depending on the type of study and setting. The most promising programs seem to be those that incorporate victim-offender conferencing, arbitration/mediation, and circle sentencing programs. It is important to note that not all restorative justice programs aim to reduce juvenile detention; for some, the program offers an opportunity to remove a conviction from a juvenile’s record among those at no risk of detention. One such study is Make It Right, evaluated by a randomized controlled trial by Shem-Tov et al. (2022), which has been shown to reduce re-arrest after 6 months by 44% and after 4 years by 30%.
- Restorative justice in schools. Restorative justice is also being implemented in schools as an alternative to suspension, again with significant variation in effectiveness across programs and settings. A 2019 review (Fronius et al., 2019) of the evidence suggests that restorative justice does in fact dramatically reduce suspension (note that only one RCT was carried out [Augustine et al., 2018]). Few studies evaluate impacts on other domains.
- Eliminating fines and fees for juveniles. In 2016, Santa Clara County, California, spent nearly $450,000 to collect $400,000 in fines and fees assessed against juvenile defendants (Shapiro, 2019). In 2018, the State of California abolished all new juvenile fees (but not fines). Eliminating juvenile fines and fees has the potential to reduce the financial burden on low-income families (Chambers et al., 2021) and decrease recidivism. Given the high costs of collection, efforts are likely to be revenue-neutral in the short run and have the potential to lower costs in the long run if they reduce recidivism.
- Reducing school shootings. School shootings are the result of suicidal thoughts, despair, and access to guns, specifically assault weapons (Gius, 2017). Addressing mental health (see Chapter 5) and gun safety is key to reducing school shootings. Research is needed on the most effective ways to address both issues, and findings should be distributed widely to state and local governments.
within the criminal justice system and in school disciplinary settings (Shem-Tov et al., 2022).
APPENDIX C: CHAPTER 10
CHILD MALTREATMENT
This appendix presents details on the descriptive literatures on the causes and possible consequences of involvement in the child protective services (CPS).
Descriptive Studies of the Possible Consequences of CPS Involvement
Many, but not all, children who are maltreated are referred to CPS, also known as child welfare services. Font and Maguire-Jack (2020a) compared children who were reported to CPS—90% of whose families received Supplemental Nutrition Assistance Program (SNAP)—to children whose families received SNAP but were not reported to CPS. They excluded the relatively small subset of children who were reported to CPS and placed into foster care or group care. They found that children and youth reported to CPS had lower rates of high school graduation and employment, and higher rates of teen parenthood and incarceration, than youth without maltreatment allegations (see also Casanueva et al., 2014). Although correlational, their study confirms that low-income children involved with the child welfare system are at elevated risk of poor mobility-related outcomes in young adulthood, making them a group at high risk of intergenerational poverty. Using similar data and methods, Font et al. (2021) showed that child welfare involvement persists across generations.
Mental health is likely an important mechanism linking child maltreatment with intergenerational transmission of poverty (Chapter 5; Jones Harden & Slopen, 2022; Yoshikawa et al., 2012). Moreover, substantial literature links a child’s history of maltreatment with mental health challenges when they are older (Edwards et al., 2003; Jaffee & Maikovich-Fong, 2013; Negriff, 2020; Southerland et al., 2009). For example, Jonson-Reid et al. (2009) found that, even after controlling for family poverty, maltreated children were more likely to receive mental health services than their non-maltreated counterparts.
The research literature provides conflicting evidence on whether associations between maltreatment or child welfare involvement and both time in the system and later outcomes vary by race and ethnicity. In their review of outcomes for children in the child welfare system and differences by race, Barth et al. (2020, 2022) found that, once socioeconomic status and related risk factors are controlled, Black children’s trajectories through the child welfare system are similar to those of other racial/ethnic groups. An exception is Black children’s duration in foster care, which has been found
to be about 25% longer than that of children from other groups, potentially attributable to their reduced likelihood of experiencing reunification and adoption as permanency outcomes (Wulczyn, 2020).
In a large study of children in Mississippi, Yoon et al. (2021) documented that children involved in the child welfare system had worse educational outcomes than those who were not, specifically with respect to grade retention and chronic absenteeism. Further, they found that Black male children who were involved in the child welfare system had worse educational outcomes than either White males or Black or White females who were involved in the system.
Mersky and Topitzes (2010) analyzed data from the Chicago Longitudinal Study, which included 1,539 racial/ethnic minority children (93% Black; 7% Latino) from economically disadvantaged backgrounds. They found that children with substantiated reports of maltreatment had an increased likelihood of adverse education and employment outcomes during early adulthood. Jonson-Reid et al. (2009) found that, even after controlling for family poverty, Black youth who were maltreated were less likely to have obtained mental health services than White youth who were maltreated, suggesting racial disparities in mental health service receipt that may have implications for intergenerational poverty among Black children.
Descriptive Studies of the Possible Consequences of Foster Care Placement
Foster Care
Research using the National Survey of Child and Adolescent Well-being to examine outcomes of young adults who had been in foster care as adolescents indicates that greater than 40% lived as adults in households with incomes below the poverty line, which exceeds the proportion of youth living in poverty in the general population (Administration for Children and Families, 2008). Further, while the authors found no differences in adult poverty by race and ethnicity, they did find that young adult females who had been in foster care were more likely to be living in poverty than males. On the other hand, employment levels (approximately 58% working full- or part-time) of young adults who had been in foster care were similar to those of the larger population of young adults.
A recent meta-analysis by Kennedy et al. (2022) found that associations between having been in foster care and lower employment and financial stability in adulthood in the descriptive literature tend to be larger for Black youth than for White youth, although the reverse is true for associations with poor mental health; associations between foster care and educational achievement tend not to differ by race.
In a study comparing economic outcomes for Black, White, Latino, and Native American youth who had been in foster care, which used data from the National Youth in Transition Database, Watt and Kim (2019) found more educational attainment but less employment among Black than White youth who had been in foster care. White and Latino youth had similar educational outcomes, while Native American youth displayed worse educational outcomes than youth from other racial/ethnic groups. Native American youth also exhibited a higher likelihood of homelessness and incarceration after emancipating from foster care than other racial/ethnic groups.
Kinship Care
Kinship care refers to foster care by a relative, such as a grandmother, aunt, or uncle. The correlational evidence on the long-term poverty-associated outcomes for youth who have experienced kinship care is limited and ambiguous. Some studies document increased mental health challenges (Bramlett et al., 2017; Rufa & Fowler, 2016), whereas others point to enhanced mental health outcomes (Ehrle & Geen, 2002; Gleeson, 2012; Winokur et al., 2018). Similarly, some research suggests that kinship care is associated with criminal justice involvement for youth (e.g., Ryan et al., 2010), while other research documents that kinship care may protect youth from criminal justice involvement (e.g., Cutuli et al., 2016; Winokur et al., 2008). Noteworthy in this literature is that Black youth who have been in foster care have a much higher likelihood of involvement in the criminal justice system than White youth in similar circumstances (Barth et al., 2010; Boyd, 2014; DeFina & Hannon, 2013; Jonson-Reid et al., 2009; Ryan et al., 2016; Watt & Kim, 2019). And while Black and White male youth who had been in kinship care have been found to be at increased risk of delinquency, Latino males in kinship care were at reduced risk of delinquency (Ryan et al., 2010).
Apart from criminal justice involvement, some studies suggest that placement in kinship care (rather than placement with unrelated foster parents) confers benefits for children from racial/ethnic minority backgrounds that include increased placement stability, safety, and child well-being (Gleeson, 2012; Winokur et al., 2018). At the same time, however, other research suggests that the lower socioeconomic status of kinship care parents (e.g., poverty, food insecurity, reduced receipt of foster care payments; Fuller-Thomson & Minkler, 2000; Miller-Cribbs & Farber, 2008; Taylor et al., 2020) potentially contributes to the poverty rates found among young adults who have been in the foster/kinship care system (Harris & Skyles, 2008; Miller-Cribbs & Farber, 2008). Research is clearly needed in these areas, particularly regarding the family factors (e.g., poverty, service
utilization) that contribute to these conflicting outcomes (Coleman & Wu, 2016; Xu et al., 2021).
Background Sections for Interventions
Economic Support Policies
Theory suggests that parental income may impact maltreatment and child welfare involvement through the two primary mechanisms discussed in Chapter 6. The resource and investment model, which is rooted in economic theory (Becker, 1991), emphasizes the detrimental consequences of material resource deprivation. Such limited resources may directly constitute child neglect or may produce circumstances that prompt child welfare involvement, such as insufficient resources to provide safe child care. The family stress model described in Chapter 6 offers psychological and sociological perspectives (Elder, 1974; Masarick & Conger, 2017), highlighting the effects of stress produced by economic deprivation on parental and child behavior and mental health. Family stress may lead to parental maltreatment behaviors or produce mental health challenges that pose maltreatment risks or prompt child welfare involvement.
Evidence presented in the text on the impacts of economic support policies on child maltreatment was limited to areas with the strongest evidence—a child support experiment, the Earned Income Tax Credit program, Medicaid, and food and nutrition programs. Here we review evidence based on other economic support programs.
Studies of the Aid to Families with Dependent Children (AFDC) and Temporary Assistance to Needy Families Programs
A handful of studies (and many correlational studies, which are not reviewed here) have assessed the effects of the AFDC and Temporary Assistance to Needy Families (TANF) programs on child maltreatment. (Welfare reforms enacted in 1996 replaced the AFDC program with the TANF program.) For example, Paxson and Waldfogel (2002) leveraged state-level variation in combined AFDC/TANF and food stamps benefit generosity from 1990–1996, as well as a host of other state-level factors, to examine the association of benefit generosity with child maltreatment. They found that a 10% increase in a state’s maximum combined benefit was associated with a 24% reduction in its foster care caseload. However, they found nonsignificant associations of benefit generosity with both child maltreatment reports and substantiations.
Some AFDC-related studies have found welfare-related work requirements to be associated with fewer physical abuse investigations and foster
care entries, work incentives to be associated with reductions in overall and neglect substantiations, and time limits to be associated with increased substantiations. Ginther and Johnson-Motoyama (2017) used state-level variation data from 2004 to 2015 to examine the effects of TANF behavioral requirements on child welfare caseloads. They found that severe sanctions (e.g., loss of benefits if a household does not meet work requirements) are associated with greater maltreatment substantiations and foster care caseloads, and that time limits of less than 5 years are associated with greater substantiations. Consistent with this finding, Slack et al. (2007), using individual-level data from Illinois and fixed-effects models, found that welfare sanctions without income supplementation from other sources are associated with increased risk of a child neglect investigation.
Paxson and Waldfogel (2003) examined the impacts of the 1996 welfare reform on child maltreatment caseloads using data from 1990 to 1998. They found consistent evidence that more generous benefits are associated with large reductions in the foster care caseload, as well as some evidence that strict time limits and sanction policies are associated with greater rates of maltreatment substantiation.
Finally, in an individual-level analysis of Delaware’s randomized welfare reform experiment, in which families were assigned to either the AFDC program (unconditional cash benefit for families with children) or the TANF-like welfare program that included work requirements, a family cap, and a 24-month time limit on cash benefits, Fein and Lee (2003) found that participants assigned to the TANF-like program were more likely to experience sanctions, have their case closed due to sanctions, and reach the 24-month time limit. This group also experienced a large increase (on the order of 50%) in substantiated child neglect reports. Notably, however, this study did not directly examine the effect of income or benefit level on child maltreatment.
Minimum Wage Policy
The committee identified two studies that examined the link between minimum wage policy and child maltreatment. Raissian and Bullinger’s (2017) state-level regression analyses of change over time in the state minimum wage and in child maltreatment rates found that a $1 per hour increase in the state minimum wage (an increase of 16% on average) is associated with a 9% decrease in child maltreatment investigation rates (marginally significant at p < 0.10) and a significant decrease in neglect investigations of 10%. However, Schneider et al. (2022), using survey data from the Fragile Families and Child Wellbeing Study and behaviorally approximated measures of child maltreatment (parental physical aggression, psychological aggression, physical neglect, supervisory neglect) to examine
the effect of a $1 per hour increase in the local (city) minimum wage, found inconsistent results in terms of magnitude, direction, and significance of the estimates depending on model specification (lagged dependent variable, city fixed effects, individual fixed effects). While the two studies provide inconsistent evidence regarding the relation between the minimum wage and child maltreatment, Raissian and Bullinger’s findings employ a stronger and more representative approach and also analyze the impact of the minimum wage on child maltreatment rates rather than solely on self-reported parental behaviors.
Employment Conditions
Some rigorous evidence points to the importance of contextual economic factors in driving maltreatment and child welfare involvement. For instance, Raissian (2015) used variation in unemployment rates caused by the economic recessions and recoveries in the United States between 2000 and 2010 to examine the effects of county-level unemployment on county-level maltreatment and child welfare involvement rates. She found that a 1 percentage point higher unemployment rate was associated with a reduction in child maltreatment reports of just over 4%. She argues that these results may reflect unemployed parents’ increased ability to invest time in caring for children and to the context and stress of low-wage work. Additionally, Lindo et al. (2018) found differences in the relationships between county-level employment factors, including employment rates and mass layoff rates, and child maltreatment rates, suggesting that increased unemployment among men predicts greater child maltreatment while increased unemployment among women predicts lower rates of child maltreatment. Some data limitations, particularly around the sex of child maltreatment perpetrators, which is frequently missing in available data, complicate the interpretation of such findings.
Early Home Visiting Programs
As reviewed in the appendix to Chapter 4, early home visiting programs have gained popularity as a possible means of family intervention. It is important to recognize, however, that individual programs differ substantially in terms of target population, program quality and intensity, staff qualifications, and curriculum. As such, home visiting should be viewed as a catchall category of intervention, and it is not possible to determine whether home visiting, in general, serves to reduce child maltreatment. Rather the focus must be on the effects of specific programs.
The Chapter 4 review reached mixed conclusion regarding the overall efficacy of these programs. Here the focus is on their possible impacts on
child maltreatment. Two recent reviews of home visitation programs (Duffee et al., 2017; Sama-Miller et al., 2019) and three recent meta-analyses (Casillas et al., 2016; Gubbels et al., 2021; van der Put, 2017) yield several general conclusions. First, eight early home visiting programs have demonstrated meaningful reductions in child maltreatment through a rigorous randomized evaluation in at least one sample. These include Child First, Early Head Start Home Visiting, Early Start (New Zealand), Health Access Nurturing Development Services (HANDS), Healthy Families America, Nurse-Family Partnership, Parents as Teachers, and SafeCare Augmented. Second, average effect sizes are relatively modest. The mean effect sizes estimated in recent meta-analyses are 0.141 (Gubbels et al., 2021; program range: 0.01–0.68), 0.21 (van der Put, 2017; program range: 0.07–0.34), and 0.22 (Castillas et al., 2016; no program range provided). Third, effects tend to be larger for programs that serve a larger proportion of racial/ethnic minority families (Gubbels et al., 2021). Fourth, replication is relatively uncommon: many programs have demonstrated positive effects in some sites or samples that have not been replicated in other sites or samples (Sama-Miller et al., 2019). Note, also, that in addition to the programs included in these reviews, a recent randomized evaluation of the Family Connects universal (communitywide) nurse home visiting program for newborns in Durham County, North Carolina, using a sample of approximately 5,000 families randomized at birth to program eligibility or a status quo control group, found that treatment-group children had 39% fewer child welfare investigations than control-group children (Goodman et al., 2021).
These optimistic findings are not consistent with those from the rigorous U.S. HomeVee review of the effects of early home visiting models. The HomeVee review focuses on substantiated reports of child maltreatment (in contrast with other evaluations that have a lower bar for maltreatment measures), child welfare measures such as custody loss and placement outside the home, health care encounters that may occur specifically as a result of child maltreatment, such as treatment for injuries or ingestions, and indicators of child maltreatment on the Conflict Tactics Scale-Parent Child measure.2 Of particular note, unsubstantiated child maltreatment investigations were excluded as a potential outcome. Evaluations from 10
___________________
1 If the rate of child maltreatment reports in the comparison group is 15%, then an effect size of 0.14 translates into a 10% rate (a 5 percentage point reduction) for the group receiving home visitation services.
2 For more information see https://homvee.acf.hhs.gov/outcomes/reductions%20in%20child%20maltreatment/In%20Brief
of the program models provided information on impacts of at least some of these elements of child maltreatment.3
In contrast to results from the published reviews and meta-analyses cited above, the HOMVEE review found more favorable than null effects in only 2 of the 10 cases—Early Start (New Zealand) and the HANDS Program. For the most frequently evaluated programs, the number of favorable and null results were 20/188 for Healthy Families America (HFA)® and 7/19 for the Nurse-Family Partnership (NFP)® program.
Early Childhood Education and Care Programs
A relatively small literature has rigorously examined whether early childhood education and care program participation—including child care subsidies, prekindergarten programs, Early Head Start, and Head Start—may serve to reduce child maltreatment.4 Such programs have the potential to reduce maltreatment by providing access to consistent child care when parents may be working, reducing the time children spend with (potentially maltreating) parents (both of which may reduce parental stress) and, in some cases, intervening directly with parents around developmentally appropriate expectations and parenting strategies. At the same time, however, teachers and child care providers are mandatory child maltreatment reporters, such that exposure thereto has the potential to increase reporting.
On the whole, findings from studies examining the impact of such programs on child maltreatment have been inconsistent. Pac (2021), for example, in a state-level study leveraging exogenous variation across states and over time in access to early childhood education and care programs (child care subsidies, Head Start, Early Head Start, state prekindergarten programs) on child welfare investigations, found little evidence of the effects of these programs on investigations overall or for abuse or neglect. Nevertheless, correlational studies of several specific programs have yielded
___________________
3 The programs were Early Head Start Home-Based Option, Early Start (New Zealand), HANDS Program, HFA®, Healthy Steps (National Evaluation 1996 Protocol), Maternal Infant Health Program (MIHP), NFP®, Parents as Teachers®, Promoting First Relationships® - Home Visiting Intervention Model, and SafeCare Augmented.
4 There are also a handful of descriptive studies in this area. For example, Maguire-Jack et al. (2019) found an association of child care subsidy receipt with decreased supervisory (but not other forms of) neglect. Klein et al., (2017), using a sample of child welfare-involved children, find that whereas participation in an early childhood education and care program, in general, was not associated with the probability of a subsequent foster care placement, Head Start participating children were 93% less likely to be placed in foster care, and children experiencing multiple types of child care were seven times more likely to be placed in foster care, than children who were not participating in an early childhood education and care program. Ha et al. (2015) find associations of unstable child care arrangements with self-reported measures of maltreatment.
promising results. Zhai et al. (2013), for instance, used data from the Fragile Families and Child Wellbeing Study and propensity score matching to compare child maltreatment outcomes for children participating in Head Start with those for otherwise similar children. They found that Head Start-participating children were 45% less likely than those in parental care to be investigated for child maltreatment by age 5 but that the likelihood of investigation did not differ between children enrolled in Head Start and those enrolled in other (nonparental) forms of care.
The most rigorous evidence to date comes from evaluations of Early Head Start and the Chicago Parent-Child Centers early education programs. Green et al. (2014) linked child-level data on a subsample of children participating in the randomized Early Head Start Evaluation (those in seven of 17 sites) to state child welfare administrative data. Initial analyses found that, between ages 5 and 9, Early Head Start participants were approximately 36% less likely than control group members to have been involved with the child welfare system and had 38% fewer total child welfare system encounters. These differences were largely driven by reductions in physical and sexual abuse investigations, whereas neglect investigations were more likely among the treatment than control group. Effects were uneven across sites, however, perhaps reflecting differences in program structure or geographic factors. Moreover, follow-up analyses at age 15 found no treatment-control group differences in child welfare investigations, substantiations, or foster care placements, perhaps reflecting fade-out of the initial effects.
The randomized evaluation of the Chicago Parent-Child Centers program (Reynolds & Robertson, 2003) demonstrated long-term reductions in child welfare involvement. The Parent Child Centers provide both preschool and comprehensive family support to low-income families for up to 6 years. The evaluation found that between birth and age 17, participants were about 50% less likely to experience a child maltreatment investigation or substantiation than control group members, with similar effects for abuse and neglect. The study authors note that key elements of the program’s effectiveness include a focus on literacy, intensive parental involvement and well-trained staff. Notably, some 93% of the sample in the Chicago Parent-Child Center evaluation were Black children.
APPENDIX C: CHAPTER 11
RESEARCH AND DATA NEEDS FOR UNDERSTANDING AND AMELIORATING INTERGENERATIONAL POVERTY
This appendix includes the following: (a) a listing of all of the committee’s conclusions about drivers of intergenerational poverty in Chapters 2-10, organized by chapter; (b) a listing of the committee’s conclusions about research and data needs in Chapter 11; Table C-11-1, which lists tax return data available to the Census Bureau and not available but needed for linkage for statistical purposes, including research; and (c) Table C-11-2, which lists program records of nontaxable benefits for accurate measurement of family income over time available to the Census Bureau and not available but needed. The committee’s list of program and policy ideas, supported by direct evidence, for interventions to reduce intergenerational poverty is provided in Table 11-1 in the body of Chapter 11.
Report Conclusions About Drivers of Intergenerational Poverty
Chapter 2: A Demographic Portrait of Intergenerational Poverty
Conclusion 2-1: As measured by household income, rates of intergenerational persistence in low-income status in the United States differ starkly by race/ethnicity. The lowest rates are found for Asian children, followed by White and Latino children. In contrast, persistence rates are very high for Black and Native American children. When adult economic success is measured using individual earnings rather than household income, mobility patterns are generally similar. Black women who grew up in low-income households are an exception; their earnings in adulthood are just as high, on average, as those of White women who grew up in similar economic circumstances. This reflects the greater likelihood that they are the primary earners in their families.
Conclusion 2-2: Racial/ethnic disparities are an enduring feature of the intergenerational trajectories of children, with Black and Native American children experiencing much less upward mobility than White children growing up in the same economic circumstances.
Conclusion 2-3: Children of immigrants from almost every country of origin—rich and poor nations alike—experience greater intergenerational mobility than children of U.S.-born parents. This immigrant advantage is larger for children from lower-income households, and to a large extent it reflects the fact that immigrants are more likely to
settle in areas that offer their children better opportunities for upward mobility.
Conclusion 2-4: Children’s chances of growing up and escaping low-income status vary substantially depending on where they live. At both a broad regional level and within community boundaries, there are areas where low-income children tend to grow up and join the middle class, as well as areas where generations are more likely to remain mired in poverty. The spatial patterns of economic mobility vary by racial/ethnic group; nonetheless, disparities in economic mobility between Black and White children persist even within neighborhoods.
Conclusion 2-5: After declining over the past 75 years, the fraction of children doing better than their parents is now lower in the United States than in most other industrialized countries. The most likely cause is that gains from economic growth have been disproportionately enjoyed by higher-income families, which has made it even more difficult for those at the bottom rungs of the income distribution to work their way up.
Chapter 3: Racial Disparities in Intergenerational Poverty
Conclusion 3-1: The challenges that Black and Native American families face in propelling their children into socioeconomic security result from contemporary and historical disparities, discrimination, and structural racism. Behaviors and choices can also have major causal impacts on intergenerational mobility. Many factors influence the behaviors and choices of Black and Native Americans, including the experiences of historical violence, oppression, and marginalization manifested through mechanisms of contemporary structural racism. These factors are crucial in shaping the relevant determinants of poverty over generations.
Chapter 4: Children’s Education
Conclusion 4-1: By imparting skills and other capacities valued by employers, the education system is a key driver of upward intergenerational mobility for low-income children. Large gaps in school achievement and completed schooling persist across socioeconomic, racial, and ethnic subgroups, pose a key challenge for policy makers seeking to reduce intergenerational poverty, and underscore the importance of education-related interventions.
Conclusion 4-2: The vast U.S. education system is a potentially important factor in enabling individuals to escape from poverty. However, it
fails to equalize educational opportunities for students across socioeconomic and racial/ethnic groups. Research points to many possible ways to improve the quality of educational experiences offered to students in K-12 and postsecondary school settings, to create high-quality job training programs, and to prepare young people for the labor market.
Chapter 5: Child and Maternal Health
Conclusion 5-1: Improving the health of children experiencing poverty has been shown to improve economic status in adulthood as measured by future educational attainment, employment, earnings, and reduced reliance on public assistance. Two important mechanisms include access to family planning services and health insurance coverage in pregnancy and childhood, both of which are key to improving the short- and long-term health and economic outcomes of children. Yet many low-income families are still without health insurance coverage or access to family planning services. This is due in part to administrative barriers that reduce child Medicaid enrollment, the fact that Medicaid coverage for pregnancy often ends 2 months post-partum, an Indian Health Service that serves only half the eligible population, and declines in funding for Title X over time. For access to mental health, additional barriers include lack of providers.
Conclusion 5-2: A child’s environment (pollution, stress, and violence) exerts a strong influence on child health and development, with long-term economic consequences. Federal regulation of pollution has led to significant improvements in infant and child health and, ultimately, adult income. Due in large part to federal action, disparities in exposure to pollution by income, race, and ethnicity have declined significantly over time. While child mortality has been falling over time, firearm-related violence is on the rise and is now the leading cause of death among all children in the United States, with significant disparities by income, race, and ethnicity. Direct exposure to violence or victimization resulting in premature death and disability, as well as indirect exposure resulting in increased stress, anxiety, and depression with long-term consequences, both contribute to the intergenerational persistence of poverty.
Conclusion 5-3: Today, children living in poverty are still more likely to reside in households that experience food and nutrition insecurity than their better-off counterparts. Evidence from the introduction of the Supplemental Nutrition Assistance Program program in the 1960s and 1970s suggests that food supplements for children in low-income
families, both in utero and during childhood, can contribute to intergenerational mobility, improving child health and ultimately future adult health and earnings. Evidence on the impact of SNAP from a more recent period shows similar effects on child health, at least in the short to medium term, suggesting that long-term outcomes of enhancing child nutrition today may be similarly effective in promoting intergenerational mobility. Barriers to take-up in Special Supplemental Nutrition Program for Women, Infants, and Children and reduced eligibility among immigrant families limit the ability of children in the United States to benefit from federal nutrition programs.
Chapter 6: Children’s Family Income, Wealth, and Parental Employment
Conclusion 6-1: When tax credits, Supplemental Nutrition Assistance Program benefits, and other noncash sources are counted as part of income, the family incomes of children on the bottom rungs of the income distribution have nearly doubled over the past 40 years, and rates of child poverty have been cut in half. The family incomes of children on the middle rungs have grown a bit faster, while those of children on the top rungs have grown much faster. Child poverty in the United States is considerably higher than in other Anglophone countries when poverty is measured by relative income position.
Conclusion 6-2: Low wages among less-educated workers (including lower-skilled workers who are parents) over the last several decades in the United States can be attributed largely to three factors: competitive market forces, such as technological change and globalization, which have increased skill requirements for middle-class jobs; structural problems, as limited information for employees and the costs associated with changing jobs have strengthened the bargaining power of employers and reduced the power of employees; and weakening laws and institutions, such as federal minimum wages and unionization.
Conclusion 6-3: Earnings and employment gaps by gender, especially among less-educated women, can probably be attributed in part to difficulties securing affordable and high-quality child care. Gaps by race, especially between Black and other groups of men, reflect differences in skill and experience, but also reflect discrimination and other barriers to employment. Discriminatory barriers appear to be especially severe for previously incarcerated men, particularly Black men.
Conclusion 6-4: Evidence suggests that income transfer programs during childhood and adolescence have the potential to improve children’s
educational and labor market attainment, as well as their physical health, in adulthood. Studies examining policy changes over the past 30 years provide the strongest evidence for intergenerational impacts of expansions of the Earned Income Tax Credit, which increases both employment and income.
Conclusion 6-5: Higher parental earnings and employment among low-income families can potentially reduce intergenerational poverty by raising family income, increasing access to the Earned Income Tax Credit and other safety-net benefits, and—at both the family and neighborhood levels—providing positive role models and access to good jobs through social networks. Interventions such as the EITC that promote employment and increase income improve children’s long-run outcomes; interventions that promote employment in the absence of increased income do not appear to improve child outcomes; and evidence on whether income supplementation alone improves long-term child outcomes is inconclusive, with some studies showing positive effects and others showing no improvement.
Conclusion 6-6: Controlling for income, family wealth is strongly correlated with children’s adult outcomes. There is mixed evidence on the causal impact of wealth transfers on children’s long-run outcomes. Black families, having significantly less wealth than White families, are more likely to be both income- and wealth-poor, and more likely to experience downward intergenerational wealth mobility. No causal studies have examined differential wealth impacts by race.
Chapter 7: Children’s Family Structure
Conclusion 7-1: Single-parent families have become much more prevalent over the past 50 years, though largely among parents who lack community college or 4-year college degrees. Rising rates of incarceration account for some but not most of these trends. There is a strong association between growing up in a single-parent family and low-income status in adulthood. Evidence on causal links between growing up in a single-parent family and being poor as an adult is strongly suggestive.
Conclusion 7-2: While it appears that married, two-parent family structures may, in fact, reduce intergenerational poverty, we lack direct evidence of policies and programs that are capable of promoting such structures.
Chapter 8: Children’s Housing and Neighborhood Environments
Conclusion 8-1: The evidence on the effects of housing on intergenerational poverty is nearly all correlational or drawn from longitudinal panel surveys. The most consistent correlational evidence is on the effects of housing quality on children’s short-term outcomes, with the strongest evidence on the long-term effects of lead exposure. There is also correlational evidence on the negative effects of homelessness, overcrowding, residential mobility, and very low or high housing costs on children’s short and long-term outcomes.
Conclusion 8-2: Strong evidence shows improvements in low-income children’s long-term economic, educational, and health outcomes when they move to less disadvantaged neighborhoods. Less is known regarding which characteristics of neighborhoods foster upward mobility.
Chapter 9: Neighborhood Crime and the Criminal Justice System
Conclusion 9-1: Crime victimization and exposure have negative consequences for children’s development and long-term economic outcomes. Gun violence is now the leading cause of death among American children. Low-income, Black, and Native American youth are more likely to have these exposures. Rigorous research shows that neighborhood violent crime can be reduced through community investments and engagement, certain kinds of policing, and gun safety regulations.
Conclusion 9-2: While reductions in crime and victimization clearly benefit children, some efforts to reduce crime also have the potential to harm them. Aggressive policing has been linked to worse educational outcomes for youth, especially Black and Latino youth. Juvenile detention lowers the rate of high school completion and increases the likelihood of incarceration in adulthood. Declines in juvenile offending, stemming in part from increased investment in children’s education and health, have lowered juvenile detention rates, although significant disparities by race and income remain. Finally, the rise in adult incarceration has increased the number of low-income children with parents/caregivers under supervision, reducing household earnings and increasing household debt. As a result, fewer resources are available to invest in children.
Chapter 10: Child Maltreatment
Conclusion 10-1: Children who have been maltreated and (or) involved with child welfare are at elevated risk of intergenerational poverty.
However, high-quality research provides mixed evidence on the effects of foster care (occurring in only 3% of all child welfare cases) on subsequent outcomes in adolescence and adulthood and almost no evidence regarding the impact of child protective services more generally.
Conclusion 10-2: Causal evidence on factors leading to maltreatment and child welfare involvement is limited, although most evidence points to household economic hardship as elevating the risk of child welfare involvement and to income support and income-support policies reducing risk for child welfare involvement. Evidence on the likely favorable impacts of Medicaid and food and nutrition program eligibility is also relatively strong.
Chapter 11: Research and Data Needs for Understanding and Ameliorating Intergenerational Poverty
Conclusion 11-1: In many domains, such as education, there is a lack of strong causal evidence about the effects of policies and programs on intergenerational poverty at the needed scale. Sometimes this is because careful research has failed to establish long-term effects. More often, the issue is a lack of data that would support estimates of long-run program impacts.
Conclusion 11-2: For many reasons, it is difficult to conduct research on intergenerational poverty and effective policies and programs to reduce it. Owing to the scale of effort required, it is suggested that funding organizations (public and private) consider joint grantmaking and the adoption of the following funding principles and research best practices to maximize the likelihood of achieving valid results:
- Funding principles: (a) prioritize strong research designs that provide causal estimates of program impacts, (b) set aside funding, not only for rigorous, small-scale experiments, but also for replications and long-term follow-ups of promising programs, and (c) fund research arms for specific communities that are at highest risk of intergenerational poverty (e.g., American Indians on tribal lands, rural Black people).
- Evaluation research can often be enhanced by (a) the use of mixed research methods (qualitative, quantitative including rigorous controlled experiments) to ensure to the extent possible that all relevant attitudes, behaviors, and outcomes are addressed; (b) multidisciplinary and diverse research and implementation teams to facilitate communication with the communities being studied and ensure that experiments include
important control variables; and (c) the incorporation of community input through long-term, two-way dialogue to gain informed participation of community members throughout the life of a study and to tailor the research design for maximum effectiveness in the particular setting.
Conclusion 11-3: Existing census, survey, and administrative data linked for families over time and across subject domains—income, wealth, demographics, health, education, and others—can facilitate cost-effective research and evidence building on intergenerational poverty and socioeconomic mobility, looking both backward and forward in time. The research and policy analysis community needs timely, cost-efficient access to linked datasets with appropriate confidentiality protection.
Conclusion 11-4: At present, data for studying intergenerational poverty and related topics are controlled by a variety of federal and state agencies and are difficult to link or use for research or policy evaluation. Recent developments designed to ameliorate this situation include the Foundations for Evidence-based Policymaking Act of 2018, which presumes access to federal data by statistical agencies for evidence-building and calls for a streamlined process for researcher access to such data; supportive reports of the Commission on Evidence-based Policymaking and other organizations; and innovative projects at the Census Bureau and other agencies aimed at building linked datasets.
Conclusion 11-5: Significant challenges remain for access to linked datasets for analysis of intergenerational poverty and related topics. They include technical issues related to constructing and evaluating linked datasets; technical and policy issues regarding new methods of privacy protection and their effects on data accuracy; making access feasible in terms of cost, timeliness, and adequate budgets for the agencies linking the data; and legal barriers (e.g., research and evaluation must be justified in terms of agency benefits).
| IRS or SSA Form/Years Covered | Items Currently Available to Census Bureau | Additional Data Elements Needed |
|---|---|---|
| IRS W-2 Forms (feed into SSA Detailed Earnings Record [DER]—see below), 1999–present | Wages, tips and other compensation; Social Security wages; Deferred wages—2005 to present |
Information back to 1999 (from IRS) and 1978 (from SSA); employee deductions (e.g., for health insurance); employer contributions to health insurance; other employer benefits (e.g., moving expenses) |
| SSA DER, 1978–present | Wages and salaries, including deferred wage contributions to 401(k), 403(b), 408(k), 457(b), and 501(c) plans Self-employment earnings (sole proprietor/independent contractor, covered earnings only) | Information needed for the Current Population Survey Annual Social and Economic Supplement (CPS ASEC) for 1980, 1992, 1993, 1995; for the American Community Survey for 2005–2018; for the Survey of Income and Program Participation (SIPP) for 1985–1989; for the decennial census for 1980–2020 |
| IRS 1040 Form, 1999–present | Marital status Number/type of exemptions Wage and salary income (taxable) Dividend income Interest income Gross rent and royalty income (no expenses) Total of wages, interest, dividends, alimony, business income, pensions and annuities, rents and royalties, farm income, unemployment compensation, and total Social Security benefits Adjusted gross income Number of Earned Income Tax Credit-qualifying children Whether filed Schedules, A, C, D, E, F, or self employment (SE) or Form 8814 (children’s income)—2000–present) |
Rental expenses Unemployment compensation Pensions and annuities Capital gains/losses Deductions Credits Total tax owed Occupation (text field) |
| IRS 1040 Form, Schedule SE, 1999–present | Net earnings from farming Net earnings from nonfarming activities Taxable self-employment |
| IRS or SSA Form/Years Covered | Items Currently Available to Census Bureau | Additional Data Elements Needed |
|---|---|---|
| IRS 1099 Forms, 1999 (or year form initiated)–present | Retirement, disability, survivors (except Social Security, Veterans Administration) (1099-R)—limited information Miscellaneous—receipt but not amounts |
Capital gains (1099-B) Dividends (1099-DIV) Government payments (e.g., state tax refunds) (1099-G) Interest (1099-INT) Credit card and 3rd party network transactions (1099-K) Miscellaneous (1099-MISC) Tax-deferred educational accounts spending (529, Coverdell) (1099-Q) Retirement, disability, survivors (1099-R)—additional information Unemployment compensation (1099-U) 1098-T (educational financial aid) |
| IRS—Other Common Forms | Not available | Form 1098 (mortgage interest payments) Form 5498 (Individual Retirement Account contributions) |
| SSA Payment History Update System | Social Security Payments (for use in CPS ASEC and SIPP only) | Approval for use in all surveys and linkage projects |
| SSA Supplemental Security Income (SSI) Record | SSI payments (for use in CPS ASEC and SIPP only—not taxable, so not on any IRS form) | Approval for use in all surveys and linkage projects |
SOURCE: Bee and Rothbaum (2019, Table 1) for items available to the Census Bureau (see also Code of Federal Regulations, Title 26, Chapter F, Section 301.6103(j)(1)); the committee determined the need for additional items.
| Program—Custodian | Currently Available to Census Bureau | Additional Records Needed |
|---|---|---|
| Public Assistance—States | Some states, some cash assistance | All states, all types of cash assistance |
| Veteran’s Benefits—Veterans Administration | Some benefit data available for limited uses | All benefit data for all approved linkage projects |
| Supplemental Nutrition Assistance Program—States | Available for some states for some years | All states, all years |
| Women, Infant, and Children Supplemental Nutrition Program—States | Available for some states for some years | All states, all years |
| National School Lunch Program—States | Not available | All states, all years |
| Low Income Home Energy Assistance Program—States | 1 state for some years | All states, all years |
| Medicare/Medicaid—Department of Health and Human Services/Centers for Medicare & Medicaid Services | Available | |
| Housing Assistance—Department of Housing and Urban Development | Some housing programs available | All programs |
| Educational Loans—Department of Education | Not available | National Student Loan Data System information |
SOURCE: Bee and Rothbaum (2019, Table 1) for records available to the Census Bureau; the committee determined the need for additional records.