


Below is the uncorrected machine-read text of this chapter, intended to provide our own search engines and external engines with highly rich, chapter-representative searchable text of each book. Because it is UNCORRECTED material, please consider the following text as a useful but insufficient proxy for the authoritative book pages.
14 chapter two Current Full-SCale aCCelerated Pavement teSting ProgramS and equiPment introduCtion Chapter two provides a summary of the current U.S. and inter- national full-scale accelerated pavement testing (f-sAPT) programs and organizations identified in the study, as well as the sensors and instruments used by f-sAPT programs and the databases employed for data management. This includes contact details, history, major achievements, testing device information, instrumentation information, environmental con- trol, and future plans. Detailed information is captured in Appendix C. Details on all the programs and stakeholders contacted for this synthesis are listed in Appendix B, with an indication of their respective roles (i.e., owner, sponsor, researcher, etc.). The objective of this chapter is to indicate the range of devices and test conditions used by the various programs, and how these relate to each other and test out- comes. It covers traffic loading equipment, environmental control systems, instrumentation, and analysis equipment and is based on the questionnaire survey results, literature review, and selected discussions. The chapter is structured to provide information on the f-sAPT programs, cooperative associations, instrumentation, and databases. APT systems can be divided into full-scale systems (f-sAPT) and small-scale systems. F-sAPT systems are those where a standard truck tire (or combination of tires) applies the loads to the pavement, whereas small-scale systems are those where a scaled-down version of a truck tire and tire load is applied to the pavement (this synthesis focuses only on f-sAPT). F-sAPT can again be divided into tests tracks, cir- cular and linear tracking devices. The objective of APT is to apply traffic loads and sometimes also environmental effects to a pavement at an accelerated rate compared with normal loading, and to determine the reaction of the pavement and its constitutive layers to this loading in a shorter time than would normally occur on a pavement under typical traffic and environmental conditions. Acceleration of traffic load- ing is attained through the repeated loading by a set of truck tires over a short section of pavement, most often at increased loads. These increased load levels cause the number of traffic loads applied to the pavement to be multiplied by a factor of typically between 1 and 40. Through this process the response (mostly structural) of the pavement can be quantified during a much shorter time than would be the case if a normal road was monitored under standard load applications. Full-SCale aCCelerated Pavement teSting ProgramS Implementation of an f-sAPT facility and associated test program is a long-term action that requires considerable investment (Balay and Mateos 2008). The cost of such a program largely exceeds the initial price of the facility and the construction cost of the experimental pavements, as issues around activities such as laboratory testing, pavement surveys, pavement and facility maintenance, data analysis, and reporting have to be considered. A solid relationship with the academic and research environment will always be profitable and essential as it greatly facilitates access to accompanying services through cooperation with other teams. Both direct and indirect advantages of the project have to be anticipated from the beginning of the feasibility study. Road authorities need to be involved from the start to assist in defining the broad scope of the project, support during the research, and implementation of the outputs to common pavement practice. The process of developing an f-sAPT program provides information on the status quo of pavement engineering in the community and allows for a detailed analysis of needs to improve the local pavement infrastructure and knowledge. In recent years, increased emphasis has been placed on f-sAPT with various f-sAPT facilities utilized throughout the United States and internationally. Brown et al. (2004) views the primary reason for this increase in the use of f-sAPT facilities as the need to quickly and safely develop answers to emerging pavement issues within a reasonable period of time. Harvey (2008) evaluated the benefit of f-sAPT from an f-sAPT operator viewpoint and identifies the unique capa- bilities offered to rapidly move technology from computers and laboratory analysis to full-scale use at attractive BCRs. F-sAPT also offers the ability to attract and focus attention on pavement problems and their solutions. F-sAPT operators are urged to increase their attention to moving results into practice through documenting the major benefits that they produce. Opportunities exist to mine f-sAPT results to obtain additional benefits if results are fully captured and archived, allowing for the combination of f-sAPT results from different types of facilities and field studies to be combined to increase the benefits from f-sAPT experiments. Researchers should
15 think strategically in terms of the problems they choose to invest in to be sure that they are solving future pavement problems. In 1996, there were 35 f-sAPT facilities around the world, of which some 19 had active research programs in place (Metcalf 1996). Since then there has been an increase in interest in f-sAPT and a move to enhance national and inter- national interaction. This has led to two broad cooperative activities: in the United States, the creation of the TRB tech- nical committee on Full-Scale and Accelerated Pavement Testing (AFD40), and in Europe, the establishment of the COST Pavement Research with Accelerated Loading Test- ing Facilities Program (COST 347). Much of the benefit from f-sAPT has been derived from comparison studies of known materials and configurations against new and innovative materials and configurations where some equivalency between the two has provided sufficient confidence to apply the novel solution. This short-term pay- off has been complemented by progress in the understanding of material behavior and pavement performance. There is a large amount of data, and efforts should focus on ensuring that these data become widely available as these outputs are related to the public investment in pavements and the outputs should benefit the public in general. A substantial improvement in the combination of labora- tory materials characterization, f-sAPT experimentation, and full-scale pavement performance observations has occurred during the last decade. Uncertainties related to f-sAPT traffic versus real traffic and the effects of real-time environmental cycles still require improved understanding and modeling. general questionnaire Feedback on Full-scale accelerated Pavement testing Programs General feedback from the questionnaire regarding f-sAPT programs, equipment, and related issues are described here. Thirty-two of the respondents to the questionnaire own an f-sAPT device, while 38 of the respondents have some form of access to an f-sAPT device. Of those respondents who have access to an f-sAPT device, 23 own, 2 rent, and the remain- der access the device through other means (i.e., sharing, part of a consortium, etc.). Selected details regarding the actual f-sAPT device characteristics are summarized in Table 1. Analysis of the instrumentation used by the various pro- grams indicated that most make use of the standard types of measurements (i.e., permanent deformation/strain, elastic deflection/strain) in some form, as well as basic environmental data (moisture and temperature, depending on the material and test conditions). The nature or purpose of the various f-sAPT programs is primarily focused on state department of transportation (DOT) programs, followed by national and commercial programs (Table 2). Local and academic research needs are relatively low. Feedback on the current research programs focused on a wide scope of all the major possible topics also reported in literature. The majority of the focus is on hot mix asphalt (HMA) as well as studies with environmentally focused topics such as warm mix asphalt (WMA) and recycling. Evaluation Description No. of Respondents Type of f-sAPT device 22 Mobile 10 Fixed Linear or nonlinear trafficking 29 Linear 3 Nonlinear Uni- or bi-directional loading 29 Uni-directional 3 Bi-directional also Own power or shore* power 27 Own power 5 Shore power Field site or fixed site 28 Field site 4 Fixed site Roads or airfields 31 Roads 1 Airfield Fixed device or trucks 30 Fixed device 2 Trucks *Shore power is the term indicating that the device is running off an external power source (i.e., the main electrical grid) instead of its own power supply (i.e., built-in generator). TABLE 1 DETAILS OF TyPE OF FULL-SCALE APT DEvICES Primary Nature No. of Programs State DOT research program or roads agency 19 National research program 11 Commercial research plan 9 International cooperative program 8 Ad hoc use of deviceâno specific program 8 Partnership program 6 Local research needs 6 Academic research plan 4 Other 2 TABLE 2 PRIMARy NATURE OR PURPOSE OF FULL-SCALE APT PROGRAM
16 of new f-sAPT devices (at least three programs), improve- ments in control and load monitoring systems and software, upgrades of data acquisition system and instrumentation pack- ages (in-depth deflection, dynamic rutting, wireless technol- ogy, moisture and pressure sensors, fiber optic sensors, etc.), installation of camera systems for identifying and measuring cracks, commissioning of a dedicated materials testing labora- tory, and f-sAPT device automatic fault finding systems. Twenty programs use a combination of f-sAPT and lab- oratory testing to augment their data generation for analysis process, while selected use of LTM data [referring to both Strategic Highway Research Program (SHRP) Long-Term Pavement Performance (LTPP) sections as well as local field sections monitored over a number of years that are not part of the SHRP LTPP sections] and field studies also occur (12 programs). F-sAPT programs use various methods to disseminate the outputs from their programs to industry. The most common of materials models for the Mechanistic Empirical Pave- ment Design Guide (MEPDG) is also quite common. Future research programs might focus on similar topics, although some programs mentioned a decline in funding and a lack of future planning after current work is completed. Table 3 is a summary of the types of f-sAPT experiments typically conducted by the various programs. The majority of the focus is on dedicated constructed test sections. Fund- ing types are reported in Table 4 with the majority of the programs funded by local, state, and national governments. It was reported that 44% of the funding is short term, with 33% long term and the remainder (23%) intermittent. Respon- dents mainly select projects based on official research pro- grams (19); however, there are still 7 programs selecting projects an ad hoc basis (Table 5). various programs are consistently upgrading and improv- ing their f-sAPT devices and instrumentation. Examples of currently planned new developments include implementation Often Infrequently Never Dedicated constructed test sections (normal construction) 16 5 4 Dedicated constructed test sections (test pit) 9 9 5 In-service field test sections 6 9 9 Rehabilitation option comparison 10 9 5 Other 4 4 2 TABLE 3 TyPES OF FULL-SCALE APT TyPICALLy CONDUCTED Funding Type No. of Respondents Local/state government 8 National government 7 Commercial 6 International 4 Consortium 3 Academic 2 Other 2 TABLE 4 BREAkDOWN OF FUNDING TyPES Selection Basis No. of Respondents Official research program 19 Ad hoc test selection 7 Academic interest 4 Other 1 TABLE 5 BASIS FOR SELECTION OF FULL-SCALE APT TESTS
17 mechanism is conferences, meetings, and journals (21 pro- grams), with the least common websites and news releases (8 programs). Programs view the main opportunities to dis- seminate f-sAPT research information as focused pavement engineering conferences and journals, with 28 respondents indicating that they have been actively involved in the vari- ous international APT conferences since 1999. A variety of responses were received on the reasons why programs are currently continuing with their research. Most responses (18) indicated that a need still exists to generate knowledge and expand the understanding of materials and pavements in an environment where traffic demands evolve and constant improvements in performance models poten- tially lead to more cost-effective application of limited road infrastructure budgets. Spreadsheet-based systems are used to store data at some stage of the research. Approximately 50% of respondents have dedicated databases where all data are ultimately stored and from where further analyses are conducted. Sixteen of the f-sAPT device owners make data available to non-APT users for analyses, whereas 12 programs share their data with other f-sAPT programs. Consequently, 52 of the respondents use data from their own f-sAPT programs or databases for research, whereas 19 use data from other orga- nizations. The majority of respondents (50) combine data from more than one test section in their research. united States Programs The U.S. f-sAPT programs included in this synthesis are listed in this section with a summary on each of their capabilities (Tables 6 to 17 and Figures 4 to 16). These programs are listed alphabetically. The information supplied by each of the respondents regarding their f-sAPT devices is reflected in the summaries. Where no feedback was received from a specific facility, no details are supplied, except where such details may have been available through public domain liter- ature, where a short summary is provided. Where additional information was available through papers, this is also added in the summary. The full responses received from each of the facilities are provided in Appendix D. The California DOT (Caltrans) together with the Univer- sity of California, Davis and Berkeley, Dynatest, and the Com- monwealth Scientific and Industrial Organization (CSIRO; South Africa), have conducted a three-phased program com- bining the results of analytical developments, laboratory test- ing of pavement materials, and f-sAPT to assist Caltrans in moving toward its goal of improved pavement performance on the approximately 80 000 lane-km of the California highway system since 1994 (Figure 4 and Table 6). The key elements identified through this process as vital for achieving a cost- effective f-sAPT program include adequate funding, commit- ments for long-term operations and analysis, long-term goals, an overall strategic plan, and well-planned partnering to lever- age funds and knowledge (Monismith et al. 2004; Harvey et al. 2007). The FAAâs National Airport Pavement Test Facility (NAPTF) was commissioned in 1999 with the first construc- tion cycle consisting of three rigid and six flexible pavement test items (Figure 5 and Table 7). This was followed by the second construction cycle consisting of a rigid pavement test strip, a free-standing test slab, and three rigid pave- ment test items, as well as four flexible pavement test items. Uniformity of construction and reliability of the apparatus for applying the loads to the pavements have been good enough to allow the results of the traffic tests to be incorpo- rated in the FAA layered elastic flexible pavement design procedure. Test results are also being used to establish appropriate factors for four- and six-wheel landing gears in the California Bearing Ratio method of flexible pavement design (Hayhoe 2004). The need for faster and more practical evaluation methods under closely simulated in-service conditions prompted the Florida DOT (FDOT) to initiate an f-sAPT program in 2000. The f-sAPT facility is housed within the State Mate- rials Research Park in Gainesville (Figure 7 and Table 9). The testing site consists of eight linear test tracks, each being 150 ft (6 m) long and 12 ft (3.7 m) wide. Two addi- tional test tracks have water table control capabilities within the supporting base and subgrade layers. A heavy vehicle simulator (HvS) Mark Iv is used for the f-sAPT. The development, planning, and execution of the program have been conducted with support from the FDOT central offices and districts and partnerships with the Florida Uni- versity system, industry, and FHWA. The primary objective of the program is to continuously improve the performance of Floridaâs pavements through acquiring and implementing knowledge and technology to extend the useful service life of pavements and prevent premature distress cost-effectively. The FDOT f-sAPT program has investigated flexible, rigid, and composite pavements over the last decade with a focus on HMA mixture gradation, the use of polymer-modified binders, damage resulting from tire types, the effect of stress- absorbing layers, HMA aging, and early strength gain of concrete. Thirteen full-scale pavement testing projects were con- ducted at the kansas State University (kSU) APT facility between 1998 and 2008 (Figure 9 and Table 11). The Mid- west States Accelerated Pavement Testing Pooled Funds Program sponsors the APT program at this facility. The f-sAPT program continues to be a cost-effective method of evaluating pavement performance as evidenced by the sponsorsâ continuous commitment to fund the program. The lessons learned during the first ten years helped to ensure continued success (Lewis 2008).
18 The original vision for MnROAD was a facility that would facilitate pavement research in a real world labora- tory with research results that would change the way engi- neers design, construct, and maintain the highway system. Although many of these changes may be incremental when looked at individually, large savings may result when these improvements are spread out over a massive national high- way network (Worel and Eaton 2004). MnROAD was con- structed in the early 1990s to contribute to the development of an M-E pavement design method for Minnesota. Nine of the test sections were located on an interstate highway, while the remaining five test sections were low-volume road designs (Figure 11 and Table 13). The test cells were exposed to natural weather conditions experienced daily and seasonal stresses from slab warping and curling. Lon- ger exposure to the environment also revealed potential ten- dencies toward loss of support and pumping in the designs. MnROAD is trafficked by a wide variety of actual vehicles and therefore the performance of the test cells truly repre- sents the behavior of pavements in Minnesota. The continu- ing archive of ride quality, distress, and load response data from the MnROAD project is valuable in calibration of the MEPDG designs (Burnham 2005). MnDOT intended MnROAD as a site for collaboration on the state, local, and federal levels in the study of pavement and pavement technologies. This desire for collaboration was first realized in planning and later the construction of MnROAD, which was funded by MnDOT, FHWA, and the Minnesota Local Road Research Board, a consortium of mem- bers interested in research of municipal and county roads, and FIGURE 4 Caltrans/UCPRC HVS. Located in Davis, California Parameter Selection Mobile/fixed Mobile Linear/nonlinear (circular, elliptical) Linear Uni-/bi-directional Both Number of axles 1 Own power (diesel/electric/other)/shore power Both Field site/fixed site Both, UC Davis and various locations in California Roads/airfields Roads, can do airfields but not the focus Fixed device/trucks (automated or manually driven) Fixed Load range (range in kNâindicate full load for all tires as well as range per tire) 6.7 to 45 kip (30 to 200 kN) for two tires Tire details (size, type, inflation pressure range, other) Truck (Goodyear G159) and aircraft 101 psi (700 kPa) Tire wander options Yes, programmable Suspension (present or not, types possible, permanent or not, etc.) No Temperature control options Heating and cooling. 50°F to 122°F (10°C to 50°C) pavement temperature Speed range 2 to 12.4 mph (3 to 20 km/h) Dedicated operational data collection on full-scale APT device during operation (i.e., applied speed, load, location etc.)? Yes APT webpage link http://www.ucprc.ucdavis.edu/ TABLE 6 CALIFORNIA DOT (CALTRANS)/UNIvERSITy OF CALIFORNIA PAvEMENT RESEARCH CENTER (UCPRC)
19 the early spirit of partnership in full-scale pavement testing has continued to this day through MnROADâs participation in Transportation Engineering and Road Research Alliance (TERRA) and various pooled fund studies (Tompkins et al. 2008). Several research projects were initiated that necessitated the reconstruction of pavement test sections as MnROAD entered Phase II of its existence. This included study plans to test various configurations of heavy farm equipment and assess the resulting damage in comparison with a typical truck. A second study plans to stabilize a full-depth reclamation base material with out-of-specification fly ash and compare its performance with both a nonstabilized full-depth recla- mation and conventional aggregate base. A third study is a field validation of previous laboratory work on polyphos- phoric acid-modified HMA binders. Finally, a field valida- tion of an innovative diamond grinding pattern for concrete pavements developed by Purdue University has been evalu- ated. These projects are the result of partnerships between MnDOT and private industry, government agencies, and other state DOTs through the Transportation Pooled Fund Program (Clyne et al. 2008a, b). The second generation of the Minnesota Accelerated Load- ing Facility (Minne-ALF-2) constitutes a laboratory-based loading pavement test stand that simulates the passage of heavy wheel loads moving over a small full-scale pavement test strip. In addition to testing of long-term performance of concrete pavement joints, Minne-ALF-2 may be used for an investigation of the fundamentals of concrete joint behavior to support the development of improved M-E models of pave- ment joints (khazanovic et al. 2005). FIGURE 5 FAA NAPTF. Located at Atlantic City International Airport Parameter Selection Mobile/fixed Fixed Linear/nonlinear (circular, elliptical) Linear Uni-/bi-directional Uni- and bi-directional loading Number of axles 10 Own power (diesel/electric/other)/shore power Shore power Field site/fixed site Fixed site Roads/airfields Airfields Fixed device/trucks (automated or manually driven) Fixed device (automated) Load range (range in kNâindicate full load for all tires as well as range per tire) 901 kip (4 008 kN) [75 kip (334 kN) per wheel] Tire details (size, type, inflation pressure range, other) Radial tires, 52 x 21.0R22 Inflation pressure depends on wheel load and rated deflection, can go up to 250 psi (1723 kPa) Tire wander options Wander can be programmed Suspension (present or not, types possible, permanent or not, etc.) No Temperature control options No Speed range 15 mph (24 km/h) maximum Dedicated operational data collection on full-scale APT device during operation (i.e., applied speed, load, location etc.)? Yes APT webpage link http://www.airporttech.tc.faa.gov TABLE 7 FEDERAL AvIATION ADMINISTRATION
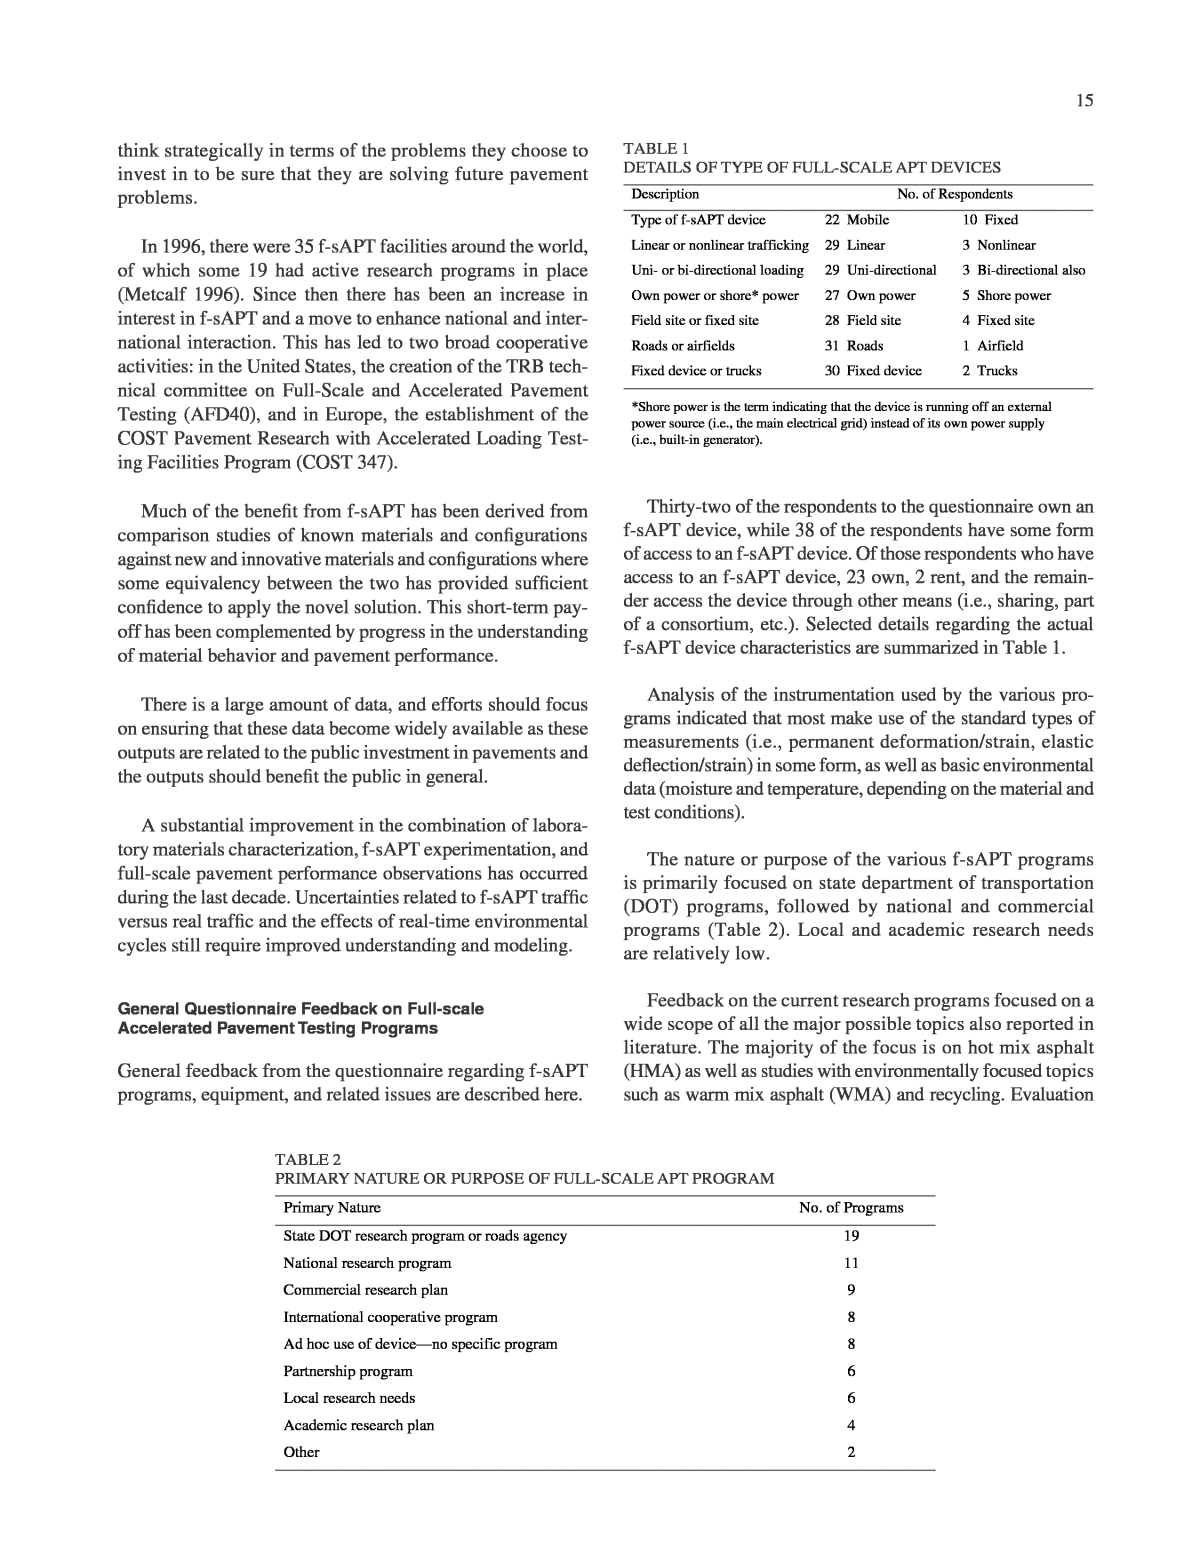
20 Located in McLean, Virginia Parameter Selection Mobile/fixed Fixed Has mobile capabilities but has only rarely been used in the very beginning of the program Linear/nonlinear (circular, elliptical) Linear ALF, Australian designed system Uni-/bi-directional Uni-directional Number of axles 1 Own power (diesel/electric/other)/shore power Electric Field site/fixed site Fixed Has mobile capabilities but has only rarely been used in the very beginning of the program Roads/airfields Roads Fixed device/trucks (automated or manually driven) Wheels are self-powered and driven rather than the wheel carriage pulled or pushed Load range (range in kNâindicate full load for all tires as well as range per tire) 9.9 to 16.6 kip (44 to 74 kN) Uses steel plates (dead weight) on suspension Tire details (size, type, inflation pressure range, other) Dual 11R22.5 Super single 425 Typically between 100 and 120 psi (690 kPa to 827 kPa) Tire wander options Lateral wander with three options. No wander (channelized), random tables with normal distribution for 2 in. (50 mm) standard deviation and 5.2 in. (133 mm) standard deviation Suspension (present or not, types possible, permanent or not, etc.) Standard air bags and shock absorber suspension Requires landing of wheel to be tuned and minimize or eliminate load spike Temperature control options Radiant heaters connected to temperature controllers and thermocouples can control pavement temperature at 0.8 in. (20 mm) depth. Rutting can be performed any time of year as high as 169°F and intermediate temperatures [50 to 82°F (10 to 28°C)] loading for fatigue cracking can be conducted when ambient temperatures allow radiant heaters to heat pavement up to intermediate temperature; usually spring, winter and fall. Speed range As low as 2.5 to 3 mph (4 to 5 km/h) and high as 10 to 11 mph (16 to 18 km/h) Dedicated operational data collection on full-scale APT device during operation (i.e., applied speed, load, location etc.)? Speed, position and load can be measured during operation Pavement layer instrumentation is independent from ALF operation (not integrated) APT webpage link http://www.fhwa.dot.gov/research/tfhrc/labs/pavemen t/index.cfm TABLE 8 FEDERAL HIGHWAy ADMINISTRATION FIGURE 6 FHWA ALF. mississippi department of transportation Mississippi DOT f-sAPT is conducted at National Center for Asphalt Technology (NCAT) (Figure 12 and Table 14). texas department of transportation The Texas DOT (TxDOT) evaluated a modification of the Rolling Dynamic Deflectometer (RDD) for use as a super- accelerated pavement tester where the truck-mounted dynamic loading system was operated in a stationary mode (Figure 14). The servo-hydraulic actuator is used to apply harmonic load- ing to a wheel footprint on the pavement surface, applying hundreds of thousands of load repetitions in a matter of hours. This system may allow TxDOT to increase cost-effectively the number of accelerated tests that can be performed. Initial tests indicated similar results with the Texas Mobile Load Simulator (MLS) (Stokoe et al. 2000).
21 Located in Gainesville, Florida Parameter Selection Mobile/fixed Mobile (HVS) Linear/nonlinear (circular, elliptical) Linear Uni-/bi-directional Uni- and bi-directional Number of axles 1 Own power (diesel/electric/other)/shore power Diesel CAT Generator/480V Electric Shore Power Field site/fixed site Fixed site Roads/airfields Roads Fixed device/trucks (automated or manually driven) Fixed Load range (range in kNâindicate full load for all tires as well as range per tire) 7 to 45 kip (31 to 200 kN) Tire details (size, type, inflation pressure range, other) Dualâ(11R22.5) Super singleâ(425/65R22.5) New wide-base tiresâ(445/50R22.5 and 455/55R22.5) Tire wander options 0 to 30 in. (0 to 762 mm) Suspension (present or not, types possible, permanent or not, etc.) Hydraulic front suspension for turning and raising the front while moving to different test sections Temperature control options Radiant heaters installed on both sides of test beam Insulated panels maintain temperature. No cooling device Speed range Up to 8 mph (12.8 km/h) Dedicated operational data collection on full-scale APT device during operation (i.e., applied speed, load, location etc.)? Typically collect load, speed, tire location. Also collect HVS system information APT webpage link http://www.dot.state.fl.us/statematerialsoffice/pavem ent/research/apt/index.shtm Other Report on loading assessment (http://www.dot.state.fl.us/statematerialsoffice/admin istration/resources/library/publications/researchreport s/pavement/03-463.pdf) TABLE 9 FLORIDA DEPARTMENT OF TRANSPORTATION (FDOT) FIGURE 7 Florida DOT HVS. A fixed location f-sAPT center opened in January 2004. Work began on the program in January 2002, when the Texas Accelerated Pavement Testing (TxAPT) Center was funded by TxDOT at The University of Texas at Austin. The pri- mary test equipment was a refurbished MLS that TxDOT used on its field highway system for six years, but with a test program at the fixed site. A new TxDOT f-sAPT research project was initiated in September 2011. It is envisaged that Project 0-6682 (vali- dation of the Maximum Allowable Amounts of Recycled Binder, RAP & RAS Using Accelerated Pavement Testing)
22 FIGURE 8 Indiana DOT APTF. Located in West Lafayette, Indiana Parameter Selection Mobile/fixed Fixed (Accelerated Pavement Testing FacilityâAPTF) Linear/nonlinear (circular, elliptical) Linear Uni-/bi-directional Bi-directional Number of axles 1 Own power (diesel/electric/other)/shore power Electric Field site/fixed site Fixed site Roads/airfields Roads Fixed device/trucks (automated or manually driven) Fixed device Load range (range in kNâindicate full load for all tires as well as range per tire) 20 kip (89 kN) for half axle Tire details (size, type, inflation pressure range, other) Dual, 11R22.5, 100 psi (689 kPa); Dual, 11R24.5, 100 psi (689 kPa); Super single, 425/65R22.5, 120 psi (827 kPa) Tire wander options 5 in. (0.13 m) left and right Suspension (present or not, types possible, permanent or not, etc.) Not Temperature control options Yes, radiant heater and air conditioner Speed range 5 to 10 mph (8 to 16 km/h) Dedicated operational Dedicated operational data collection on full-scale APT device during operation (i.e., applied speed, load, location etc.)? Yes APT webpage link http://rebar.ecn.purdue.edu/APT/ TABLE 10 INDIANA DEPARTMENT OF TRANSPORTATION will be used to develop an f-sAPT facility. The f-sAPT device is funded by the University of Texas at Arlington, while TxDOT is funding the testing. international Programs The non-U.S. f-sAPT programs included in this synthesis are listed in this section with a summary on each of their capabil- ities (Tables 18 to 37 and Figures 17 to 37). These programs are listed alphabetically. A similar process was followed in the summaries as that for the U.S. programs. For some countries, questionnaire responses lacked the facilities current activities and information on f-sAPT devices (Table 18 and Figure 17). Where it was apparent that facili- ties were still active during the past decade, information for these facilities has been extracted from their websites and the summary of f-sAPT facilities provided as part of the 2008 3rd International Conference on Accelerated Pavement Testing. Since 1996, a linear traffic simulator has been loading full-scale test sections in an f-sAPT facility built at the Federal
23 University of Rio Grande do Sul in Porto Alegre, Brazil (see Figure 18 and Table 19). The facility includes the traf- fic simulator, test sections, and a control center and is part of a cooperation agreement between the University and the Rio Grande do Sul State Roads Department. Output highlights during this process include a design equation for low-volume roads, improvements in the specification for dry-bound macadam, evaluation of the influence of soil suction in subgrades, evaluation of the benefits of paving fabrics between cracked HMA pavements and HMA overlays, and evaluation of the efficiency of asphalt rubber over- lays. Two additional mobile traffic simulators have been designed and built since 2003 (Núñez et al. 2008). The School of Transportation at Southeast University owns an f-sAPT device (see Tables 20â24 and Figures 19â23). It has a 7.9-ft (2.4-m)-deep circular trough with an outer diam- eter of 31 ft (9.5 m) and an inner diameter of 18 ft (5.5 m). The circular test section is 6.5 ft (2 m) wide. The load is provided through two arms with a standard axle with full-sized dual tires on the outer edges of the arms. The speed is adjustable up to 12.4 mph (20 km/h). A load of 11.2 kip (50 kN) can be applied per side. The maximum tire inflation pressure is 101 psi (700 kPa). No wander can be applied. Infrared radia- tion is used to increase pavement temperature to a maximum of 140°F (60°C) (Jun et al. 2008). China Changsha CSuSt (Changsha Science and technology university) The linear accelerated loading system is located in Changsha CSUST. It is a full-scale linear test track consisting of a test pit, loading vehicle, artificial rain device, and a control and monitor console. Tests are conducted in uni- or bi-directional FIGURE 9 Kansas APT device. Located in Manhattan, Kansas at KSU Parameter Selection Mobile/fixed Fixed Linear/nonlinear (circular, elliptical) Linear Uni-/bi-directional Bi-directional Number of axles One or two Own power (diesel/electric/other)/shore power Electric Field site/fixed site Fixed site Roads/airfields Roads Fixed device/trucks (automated or manually driven) Fixed device Load range (range in kNâindicate full load for all tires as well as range per tire) 1 to 5 kip (5 to 22 kN) single axle Double for tandem axle Tire details (size, type, inflation pressure range, other) Conventional over the road Tire wander options Yes, up to 6 in. (0.15 m) Suspension (present or not, types possible, permanent or not, etc.) Conventional air bag Temperature control options Radiant heat and cooling panels Speed range 5 to 6.8 mph (8 to 11 km/h) Dedicated operational data collection on full-scale APT device during operation (i.e., applied speed, load, location etc.)? Dedicated data collection, speed, load, position, and strain APT webpage link http://www.k-state.edu/pavements/ TABLE 11 kANSAS DEPARTMENT OF TRANSPORTATION
24 mode with a wheel load of between 6.7 and 22.5 kip (30 and 100 kN). Traffic wander can be defined (Cui et al. 2007). China Harbin institute of technology F-sAPT has been recognized as the most important and direct way to obtain structural behavior information on pavements subjected to traffic loading; therefore, a new f-sAPT facility has been designed in China as part of the Eleventh Five-year National Grand Technology Infrastructure Program. The final design is based on 3-dimensional (3-D) analysis of different types of test tracks, and is to be located at the Harbin Institute of Technology in Harbin, China (Dong et al. 2009). Colombia universidad de los andes This test track consists of an 11.5-ft (3.5-m)-wide ring and is 115 ft (35 m) long (measured at the center of the lane). The carousel equipment can load the pavement at a rate FIGURE 10 Louisiana DOTD ALF. of 200,000 repetitions per week using a dual-tired, single axle. The carousel can apply loads of up to almost 33.7 kip (150 kN). The wheel speed can be set up to 24.9 mph (40 km/h), and wheel wander is adjustable within a range of 39.4 in. (1.0 m) (Reyes and kohler 2006). In Japan, a systematic change from recipe-based to performance-based specifications has been progressing since 2001. As a result, f-sAPT has experienced increased signifi- cance and opportunity, particularly in the development of inno- vative pavement materials. The importance of performance evaluation of the entire pavement layer system increased, and f-sAPT is used for proofing evaluations of structural designs as well as the final evaluation of new pavement materials and func- tions. Based on this background, demand for f-sAPT increased significantly. A linear (reciprocating)-type f-sAPT facility has been built at the Public Works Research Institute (PWRI) to supplement the existing circular-type facility, while the circular- type facility has been upgraded (Sasaki and Nishizaki 2004). South Korea, Korea Highway Corporation test road The korea Highway Corporation (kHC) initiated the kHC Test Road construction project in 1997 with the objective of devel- opment and validation of the korean Pavement Design Guide. It consists of 4.8 miles (7.7 km) of two-lane highway next to the Jungbu Inland Expressway. It is made up of 25 concrete and 15 HMA test pavement sections and contains numerous Located in Louisiana Parameter Selection Mobile/fixed MobileâALF Linear/nonlinear (circular, elliptical) Linear Uni-/bi-directional Uni-D Number of axles 1 Own power (diesel/electric/other)/shore power Electric Field site/fixed site Roads/airfields Road Fixed device/trucks (automated or manually driven) Automated Load range (range in kNâindicate full load for all tires as well as range per tire) 9 to 13.5 kip (40 to 60 kN) Tire details (size, type, inflation pressure range, other) 11R22.5 Dual Tire wander options Yes Suspension (present or not, types possible, permanent or not, etc.) Not applicable Temperature control options No Speed range 10 to 12 mph (16 to 19 km/h) Dedicated operational data collection on full-scale APT device during operation (i.e., applied speed, load, location etc.)? Yes APT webpage link None TABLE 12 LOUISIANA DEPARTMENT OF TRANSPORTATION AND DEvELOPMENT
25 FIGURE 11 MnROAD test track. sensors to capture the behavior of pavement systems under traf- fic load and environmental change. The design parameters of the portland cement concrete (PCC) sections are concrete slab thickness, base type, base thickness, and pavement type, while the parameters for the HMA sections are base type, base thick- ness, subbase thickness, and wearing course type. The new M-E design guide will optimize pavement design and improve pavement performance in korea and will also reduce pave- ment construction and maintenance costs. It is anticipated that the effort will strengthen the pavement research infrastructure and that the test road database will provide valuable research resources to the pavement community (kim et al. 2004). The South African HvS Program has had a major techno- logical and economic impact on the design, construction, and maintenance of South African roads since the 1970s. It has impacted the development of national and regional pavement design standards and guidelines, the development of material specifications and guidelines, the development of human resources, capacity building in the road construction industry, the development of innovative products and designs, and the provision of cost-effective infrastructure engineering solu- tions (verhaeghe et al. 2006; Du Plessis et al. 2008a). Switzerland has a tradition of f-sAPT since the beginning of the 1970s when the Swiss Codes for road design were affected by the outcomes of seven test campaigns on more than 35 pavement structures tested with the Rundlauf circu- lar test track. This device has recently been replaced with the MLS10 (mobile lad simulator full-scale), which represents a reliable substitute (Rabaiotti et al. 2008). Located in Maplewood, Minnesota Parameter Selection Mobile/fixed Not applicable Linear nonlinear (circular, elliptical) Not applicable Uni-/bi-directional Not applicable Number of axles MainlineâLive traffic Low volume roadâ5 axle semi-tractor trailer Farm loop and other studiesâdifferent equipment types Own power (diesel/electric/other)/shore power Not applicable Field site/fixed site MnROAD Roads/airfields Mainline interstate and low volume road, farm loop Fixed device/trucks (automated or manually driven) Manual driven Load range (range in kNâindicate full load for all tires as well as range per tire) MainlineâLive traffic up to 88 kip (391 kN) gross vehicle weight Low volume roadâ80 and 102 kip (355 kN to 450 kN) gross vehicle weight Tire details (size, type, inflation pressure range, other) Real traffic tires http://www.dot.state.mn.us/mnroad/data/pdfs/semide scription.pdf Tire wander options Live traffic Suspension (present or not, types possible, permanent or not, etc.) Real traffic suspension http://www.dot.state.mn.us/mnroad/data/pdfs/semide scription.pdf Temperature control options None Speed range Low volume roadâ40 mph (64 km/h) Mainlineâ70 mph (112 km/h) Dedicated operational data collection on full-scale APT device during operation (i.e., applied speed, load, location etc.)? Not applicable APT webpage link http://www.dot.state.mn.us/mnroad/ TABLE 13 MINNESOTA DEPARTMENT OF TRANSPORTATION (MNROAD)
26 aSSoCiationS and CommitteeS Formation of associations of f-sAPT programs has occurred actively during the last decade. These associations are formed around specific loading devices or funding programs with the general objective of improving the cost-effectiveness of the overall programs through cooperative efforts of program planning, data analysis, and device improvements. This sec- tion provides details around activities in these associations. NCAT is excluded from this section because it is treated as a program in this synthesis, whereas the COST (Coopera- tion for Science and Technology) program has been included although it was officially terminated following completion of its original tasks. For each of the summaries the website address is provided as well as a short description of its back- ground and objectives (where available). Consortium of accelerated Pavement testing In 2007, FHWA and state DOTs from nine of the 15 U.S. Pavement Testing Facilities created a pooled fund program to encourage coordination among the pavement testing facil- ities. The program provides resources and management for collaborative studies and support and sharing of f-sAPT tech- nologies (http://rip.trb.org/browse/dproject.asp?n=27614). A significant number of f-sAPT programs in the United States are funded by state DOTs with the rest being fed- eral, academic, and private facilities. The Consortium of Accelerated Pavement Testing (CAPT) consists of a group of f-sAPT facility owners and operators in the United States that seeks to generate coordinated impacts through f-sAPT. CAPT attempts to provide continuous attention to f-sAPT Located at Opelika, Alabama Parameter Selection Mobile/fixed Fixed Linear/nonlinear (circular, elliptical) Oval Uni-/bi-directional Uni-directional Number of axles 8 axles on 5 trucks (40 axles total) Own power (diesel/electric/other)/shore power Diesel Field site/fixed site Fixed site Roads/airfields Roads Fixed device/trucks (automated or manually driven) Manually driven trucks Load range (range in kNâindicate full load for all tires as well as range per tire) 4.8 to 9.4 kip (21.5 to 41.8 kN) per tire Tire details (size, type, inflation pressure range, other) 275/80R22.5 at 100 psi (689 kPa) Tire wander options Real world Suspension (present or not, types possible, permanent or not, etc.) Spring and air Temperature control options Ambient Speed range Up to 50 mph (80 km/h) Dedicated operational data collection on full-scale APT device during operation (i.e., applied speed, load, location etc.)? Climate and high speed response APT webpage link www.pavetrack.com TABLE 14 NATIONAL CENTER FOR ASPHALT TECHNOLOGy (NCAT) PAvEMENT TEST TRACk FIGURE 12 NCAT pavement test track.
27 with a forum-like structure to discuss and improve relevant issues and is operated under the Transportation Pooled Fund program (www.pooledfund.org) [Pooled Fund TPF-5(127)] sponsored by the FHWA, TRB, and AASHTO that enables technology transfer activities to be jointly funded by several federal, state, regional, and local transportation agencies, academic institutions, foundations, or private firms. CAPTâs mission is to share and develop best practices and collaborate in experimental design, data acquisition, data sharing, and validation of findings. Their vision is that owners and opera- tors will improve and economize their operations and acceler- ate acceptance of pavement performance findings. Through communication and collaboration it is envisaged that these facilities can make greater impacts (Gibson et al. 2008). CAPT developed ten key emphasis areas to balance and focus efforts because the scopes and objectives of the vari- ous participantsâ programs vary significantly. Overall, CAPT focuses its future efforts on overall coordination of f-sAPT research in the United States, as well as day-to-day activities outlined as needs and gaps by the participants. Instrumentation needs and gaps is one of the areas that affect all partici- pants, including common installation methods, data collec- tion methods, and equipment and analysis of the data files. Cooperation for Science and technology COST is an intergovernmental framework for European Coop- eration in Science and Technology, allowing the coordination of nationally funded research on a European level; contribut- ing to reduction in fragmentation in European research invest- ments (http://www.cost.eu/domains_actions). It provides a FIGURE 13 Ohio DOT APT facility. Located in Columbus, Ohio Parameter Selection Mobile/fixed Fixed Linear/nonlinear (circular, elliptical) Linear Uni-/bi-directional Uni- or bi-directional Number of axles 1 Own power (diesel/electric/other)/shore power Hydraulic Field site/fixed site Fixed site Roads/airfields Roads Fixed device/trucks (automated or manually driven) Fixed device Load range (range in kNâindicate full load for all tires as well as range per tire) http://www.ohio.edu/orite/facilities/accelpaveload.cfm Tire details (size, type, inflation pressure range, other) http://www.ohio.edu/orite/facilities/accelpaveload.cfm Tire wander options Yes Suspension (present or not, types possible, permanent or not, etc.) Air bag Temperature control options http://www.ohio.edu/orite/facilities/accelpaveload.cfm Speed range http://www.ohio.edu/orite/facilities/accelpaveload.cfm Dedicated operational data collection on full-scale APT device during operation (i.e., applied speed, load, location etc.)? Yes APT webpage link http://www.ohio.edu/orite/facilities/accelpaveload.cfm TABLE 15 OHIO DOT
28 Located in Hanover, New Hampshire Parameter Selection Mobile/fixed Mobile Linear/nonlinear (circular, elliptical) Linear Uni-/bi-directional Uni- and bi-directional Number of axles 1 Own power (diesel/electric/other)/shore power Both shore and from generator Field site/fixed site Fixed site with option of field sites Roads/airfields Roads and airfields Fixed device/trucks (automated or manually driven) Self-drive for short distance, truck driven for long distance Load range (range in kNâindicate full load for all tires as well as range per tire) 2.2 to 46 kip (10 to 205 kN) Range/tire depends on gear/tire configuration Tire details (size, type, inflation pressure range, other) Truck (super single, single axle) Tire wander options 35 in. (0.9 m) wander Suspension (present or not, types possible, permanent or not, etc.) None Temperature control options 14°F to 140°F (â10°C to 60°C) Speed range 0.6 to 7.5 mph (1 to 12 km/h) Dedicated operational data collection on full-scale APT device during operation (i.e., applied speed, load, location etc.)? Yes APT webpage link http://www.crrel.usace.army.mil/facilitieslabstestsites /ferf.html TABLE 16 US ARMy CORPS OF ENGINEERS (EDRC) COLD REGIONS RESEARCH AND ENGINEERING LABORATORy (CRREL) FIGURE 14 Refurbished TxDOT MLS. FIGURE 15 USACE CRREL HVS.
29 and technical research by increasing European cooperation and interaction in this field. COST Action 347 [Improvements in Pavement Research with Accelerated Load Testing (ALT)] was initiated in October 2000 with a scheduled duration of 3.5 years. The main objective of COST 347 was to develop a European code of good practice to optimize the use of f-sAPT facilities and improve the application of results from these facilities, leading to a more harmonized approach to f-sAPT in Europe. It had six main work packages, comprising inventory of existing ALT facilities in Europe, previous and current research in the field of ALT, comparison between ALT and RLT (real-time load testing), development of a common code of good practice for ALT, future use of ALT, and finally dissemination. The major benefits from f-sAPT are often obtained through national research programs that tailor the research to the FIGURE 16 USACE WES HVS. Located in Vicksburg, Mississippi Parameter Selection Mobile/fixed Mobile Linear/nonlinear (circular, elliptical) Linear Uni-/bi-directional Uni- and bi-directional Number of axles 1 or 2 Own power (diesel/electric/other)/shore power Both shore and from generator Field site/fixed site Fixed site with option of field sites Roads/airfields Roads and airfields Fixed device/trucks (automated or manually driven) Self-drive for short distance, truck driven for long distance Load range (range in kNâindicate full load for all tires as well as range per tire) 2.2 to 99 kip (10 to 440 kN) Range/tire depends on gear/tire configuration Tire details (size, type, inflation pressure range, other) Truck (super single, single axle, dual axle) Aircraft (C17 single tire, F-15 single tire) Tire wander options 35 in. (0.9 m) wander Suspension (present or not, types possible, permanent or not, etc.) Suspension for self-drive/steering Temperature control options 14°F to 140°F (â10°C to 60°C) Speed range 0.6 to 7.5 mph (1 to 12 km/h) Dedicated operational data collection on full-scale APT device during operation (i.e. applied speed, load, location etc.)? Yes APT webpage link http://pavement.wes.army.mil/apt/ TABLE 17 U.S. ARMy CORPS OF ENGINEERS (EDRC) WATERWAyS ExPERIMENTAL STATION (WES) flexible, fast, effective, and efficient tool to network and coor- dinate nationally funded research activities, bringing scientists together under light strategic guidance, based on networks, centered on research projects. The goal of COST is to ensure that Europe holds a strong position in the field of scientific
30 Located in Melbourne, Australia Parameter Selection Mobile/fixed Fixed (ALF) Linear/nonlinear (circular, elliptical) Linear Uni-/bi-directional Uni-directional Num ber of axles 1, 2 or 3 axles Own power (diesel/electric/other)/shore power Electric Field site/fixed site Currently on fixed site Roads/airfields Yes Fixed device/trucks (auto ma ted or m anually driven) Fixed Load range (range in kNâindicate full load for all tires as well as range per tire) 9 to 20 kip (40 to 90 kN) for whole axle group Load per axle or tires is lower and dependent upon num ber of axles and tires in configuration Tire details (size, type, inflation pressure range, other) Various dual or single Tire wander options Y es Suspension (present or not, types possible, perm anent or not, etc.) Yes Tem perature control options Yes, use heaters Speed range 0 to 12.5 m ph (0 to 20 k m/ h) Dedicated operational data collection on full- scale APT device during operation (i.e., applied speed, load, location etc.)? Separate logging data dependent upon experi me nt Dedicated control system that automatically logs speed, longitudinal and transverse location, pavement and surface temperatures, machine specific parameters (e.g., hydraulic oil temperature, state of fans and motors, etc.), and dynamic load applied to pavement. APT webpage link http://www.arrb.com .au/Infrastructure/Accelerated- Pavem ent-Testing.aspx TABLE 18 AUSTRALIA, ARRB GROUP (ARRB) FIGURE 17 ARRB Group ALF. specific interests of the country concerned (Balay and Mateos 2004; Hildebrand 2004). Through the Pan-European approach of COST 347, a more robust outcome with wider acceptance and reduced cost to the individual countries has been attained. COST 347 accomplished its goals regarding improved and increased European and International cooperation in f-sAPT as some 20 countries worked together in the action and new professional relationships developed that are expected to be useful in the future. Europe experienced growth in coopera- tive projects with the SwedishâFinnish HvS being used for projects in Poland and Denmark. Since the end of the COST 347 project the use of f-sAPT in Europe has declined, some operations curtailed or termi- nated (Hildebrand and Dawson 2008). The current main use of f-sAPT is special product approval and validation as well as calibration of research modeling of pavements. F-sAPT
31 operators and road owners agree that the topics proposed by the COST 347 Action (i.e., new and alternative pavement materials, environmental issues, effects of maintenance treat- ments, effects of new types of vehicles, and pavement design methods) continue to be relevant for their countriesâ needs. Since the termination of COST 347 in 2004 a formal f-sAPT network in Europe has not existed. Forum of european national Highway research laboratories Forum of European National Highway Research Laborato- ries (FEHRL) is a registered international association with a permanent secretariat based in Brussels (www.fehrl.org). It was formed in 1989 and is governed by the directors of each of the national institutes. FEHRL provides a coordi- nated structure for the interests of more than 30 European national research and technical centers, together with associ- ated institutes from around the world. It is engaged in road engineering research topics including materials, safety, envi- ronmental issues, telematics, and economic evaluation, with research capacity provided by the national institutes and their available test facilities. FEHRL and its institutes pro- vide research services and advice to road administrators and industries for the safe and efficient operation and manage- ment of Europeâs road network. FEHRL focuses its efforts on pavement and bridge engineering, construction materials, environmental issues, maintenance management, traffic load- ing, safety, telematics, and geotechnics. The current (May 2011) European members of FEHRL owning f-sAPT devices are Austria, Denmark, France, Ger- many, Ireland, the Netherlands, Spain, Sweden, Switzerland FIGURE 18 Brazil f-sAPT device. Located at Federal University of Rio Grande do Sul, Brazil Parameter Selection Mobile/fixed Fixed, at the university cam pu s Linear/nonlinear (circular, elliptical) Linear Uni-/bi-directional Uni- and bi-directional Num ber of axles O ne (half axle) Own power (diesel/electric/othe r)/shore power Own electric Field site/fixed site Fixed Roads/airfields Roads Fixed device/trucks (autom ated or m anually driven) Autom ated driven Load range (range in kNâindicate full load for all tires as well as range per tire) 9.5 to 13.5 kip (42 to 60 kN) half axle 4.7 to 6.7 kip (21 to 30 kN) per wheel Tire details (size, type, inflation pressure range, other) Ply tires, Inflation pressure between 81 and 101 psi (560 and 700 kPa) Tire wander options W anders Suspension (present or not, types possible, perm anent or not, etc.) Perm anent Tem perature control options N o Speed range 3 to 3.7 m ph (5 to 6 km /h) Dedicated operational data collection on full-scale APT device during operation (i.e., applied speed, load, location etc.)? â APT webpage link N one TABLE 19 BRAzIL
32 and United kingdom. In addition South Africa (CSIRO) and the United States (FHWA) are members and own f-sAPT devices. Heavy vehicle Simulator international alliance The Heavy vehicle Simulator International Alliance (HvSIA) is a voluntary association of HvS users, established to pro- mote interaction between users and to coordinate testing and the dissemination of test results (http://www.hvsia.co.za). The website captures pertinent information and displays meta-data with respect to the results of tests. The objec- tives of the HvSIA are to promote and share knowledge related to HvS technology; establish a structure for ongo- ing interactions focusing on HvS technology; establish mechanisms for funding, monitoring, and completion of Located in Xiâan, China Parameter Selection Mobile/fixed Mobile, HVS MkVI Linear/nonlinear (circular, elliptical) Linear Uni-/bi-directional Uni- and bi-directional Number of axles 1 Own power (diesel/electric/other)/shore power Shore power (also diesel generator possible) Field site/fixed site Fixed, field is possible Roads/airfields Roads and airfields Fixed device/trucks (automated or manually driven) No Load range (range in kNâindicate full load for all tires as well as range per tire) 6.7 to 45 kip (30 to 200 kN) Tire details (size, type, inflation pressure range, other) Single 12R22.5 Dual 12R22.5 Super single 425/65 R22.5 super single truck tire Single aircraft tire 58 to 145 psi (400 to 1 000 kPa), temperature and pressure sensors Tire wander options Yes, automatic indexing or tracking between passes from side to side for a total lateral coverage of 30 in. (762 mm) adjusted in 1 in. to 4 in. (25 to 100 mm) increments Suspension (present or not, types possible, permanent or not, etc.) No, axle mounted directly to carriage Temperature control options â Speed range 1.2 to 8 mph (2 to 12.8 km/h) Dedicated operational data collection on full-scale APT device during operation (i.e., applied speed, load, location etc.)? Yes APT webpage link University webpage: http://www.at0086.com/chanu/ TABLE 20 CHINA, CHANGâAN UNIvERSITy FIGURE 19 China Changâan University HVS.
33 Located in Shenyang, Liaoning, China Parameter Selection Mobile/fixed MobileâMLS Linear/nonlinear (circular, elliptical) Linear Uni-/bi-directional Uni-directional Number of axles 6 Own power (diesel/electric/other)/shore power Both Field site/fixed site Both Roads/airfields Both Fixed device/trucks (automated or manually driven) Fixed Load range (range in kNâindicate full load for all tires as well as range per tire) 11 to 19 kip (50 to 85 kN) per tire Tire details (size, type, inflation pressure range, other) â Tire wander options Yes Suspension (present or not, types possible, permanent or not, etc.) Present Temperature control options Ambient to 158°F (70°C) Speed range 1,500 to 6,000 repetitions per hour Dedicated operational data collection on full-scale APT device during operation (i.e., applied speed, load, location etc.)? Applied speed APT webpage link â TABLE 21 CHINA, LIAONING PROvINCE COMMUNICATION RESEARCH INSTITUTE FIGURE 20 China Liaoning Province Communication Research Institute f-sAPT device. studies on common issues through participation of mem- bers; provide expertise to expeditiously define, manage, and review studies of interest and optimize resource use through coordination of HvS-related research. All HvS owners continue with their own research programs, while the HvSIA activities complement and support the efforts of individual members. Membership of the HvSIA as of May 2011 was South Africa (CSIRO/Gautrans), California (UCPRC), FDOT, EDRC (CRREL), EDRC (WES), Sweden (vTI), Costa Rica, China (Changâan University), and India (Central Road Research Institute). Collaboration between f-sAPT programs is often sug- gested as a method to encourage cost efficiencies, but is usu- ally difficult to implement (Harvey et al. 2008). The HvSIA has, with no formal budget, organized nine successful inter- national meetings and has been effective in encouraging interaction between users of HvS equipment. It has produced a number of very useful products, including: ⢠The HvSIA activity matrix provides a quick reference to all research performed by HvSIA members by focus and competency area with links to access reports that are available on this research. It also includes planned HvS research projects that are likely to lead to collabo- ration on actual research projects by HvSIA members and, possibly, others. ⢠The HvSIA instrumentation matrix provides informa- tion on instrumentation used by HvSIA members. ⢠Workshop and specialty sessions were held on topics of interest to the HvSIA members including HvS tests
34 FIGURE 21 China Merchants Chongqing Communications Research & Design Institute f-sAPT device. Located in Chongqing, China Parameter Selection Mobile/fixed Fixed Linear/nonlinear (circular, elliptical) Circular Uni-/bi-directional Uni-directional loading Number of axles Two Own power (diesel/electric/other)/shore power Electric Field site/fixed site Fixed site Roads/airfields Roads Fixed device/trucks (automated or manually driven) Fixed device Load range (range in kNâindicate full load for all tires as well as range per tire) 24.7 to 33.7 kip (110 to 150 kN) for all tires, 6.1 to 8.4 kip (27.5 to 37.5 kN) per tire Tire details (size, type, inflation pressure range, other) 900-20-14, C856 Tire wander options 2 in. (50 mm) Suspension (present or not, types possible, permanent or not, etc.) No Temperature control options 41 to 158°F (5 to 70°C) Speed range Up to 37 mph (60 km/h) Dedicated operational data collection on full-scale APT device during operation (i.e., applied speed, load, location etc.)? â APT webpage link http://www.ccrdi.com/Category_96/Index_1.aspx TABLE 22 CHINA, MERCHANTS CHONGqING COMMUNICATIONS RESEARCH & DESIGN INSTITUTE versus field performance, analytical and performance issues, data collection issues, evaluation and quantifica- tion of HvS test benefits, stiffness related to structural design, linkages between f-sAPT and LTM, and M-E design and calibration. The somewhat intangible benefit of ongoing interest and inter- action between HvSIA members is viewed as the HvSIAâs greatest success. This interaction is actively fostered within the HvSIA as members share a focused common interest. mobile load Simulator user group A MLS user group consisting of owners of full-scale and scaled MLS devices is being developed (www.mlsglobalusers.com). Feedback from the activities is typically provided during annual TRB AFD40 committee meetings. transportation engineering and road research alliance TERRA is a partnership of government, industry, and aca- demia that continuously advances innovations in road engi- neering and construction (http://www.terraroadalliance.org/ about/index.html). It was conceived in 2004 as a new road research governance structure to facilitate a comprehensive research program, with strategic focus to take advantage of the MnROAD test facility and associated resources. In addition to MnROAD, TERRA works with researchers and facilities at the University of Minnesota and across the world to include transportation organizations in other states and in Europe. TERRAâs mission is to develop, sustain, and communicate a comprehensive program of research on
35 and synergistic research program, implementation of research results, setting up activities to enhance TERRAâs role as a forum for research interchange, expanding TERRAâs mem- bership proactively, and developing governance and operat- ing structures to ensure a thriving, changing, and sustainable organization. midwest States accelerated Pavement testing Pooled Funds Program This program consists of a consortium of the DOTs in Iowa, kansas, and Missouri, and the Nebraska Department of Roads with the objective of supporting pooled fund f-sAPT research. No website could be found for this group for this synthesis. transportation research Board Committee on Full-Scale/accelerated Pavement testing (aFd40) Committee AFD40 is concerned with the full-scale testing of traditional and innovative pavement systems that reflect vari- ous construction conditions and maintenance practices (http:// wweb.uta.edu/faculty/sroman/AFD40/). Testing can be per- formed using conventional or accelerated methods utilizing Located in Nanjing, China Parameter Selection Mobile/fixed Fixed Linear/nonlinear (circular, elliptical) Circular Uni-/bi-directional Uni-directional Number of axles Single Own power (diesel/electric/other)/shore power Electric Field site/fixed site Fixed site Roads/airfields Roads Fixed device/trucks (automated or manually driven) Fixed device, automated driven Load range (range in kNâindicate full load for all tires as well as range per tire) The facility uses dual tires single axle to simulate the load of 22.5 kip (100 kN), and axle load of each side is 11.2 kip (50 kN). Tire pressure is 101 psi (700 kPa) Tire details (size, type, inflation pressure range, other) Type 11.00R20 (China standard) with a diameter of 42.7 in. (1 085 mm) Tire wander options No Suspension (present or not, types possible, permanent or not, etc.) Permanent Temperature control options Infrared radiation Speed range 0 to 37 mph (0 to 60 km/h) Dedicated operational data collection on full-scale APT device during operation (i.e., applied speed, load, location etc.)? Data are manually collected when the testing is paused APT webpage link None TABLE 23 CHINA, SOUTHEAST UNIvERSITy FIGURE 22 Southeast University F-sAPT device. pavement, materials and related transportation engineer- ing challenges, including issues related to cold climates. TERRA had 22 members from government, industry, and academia in 2011. The current strategic plan outlines five major strategic directions for the organization: definition and launch of a bold
36 mobile or fixed equipment under in situ or controlled condi- tions. The committee is also concerned with the test results to assess long-term pavement-system performance for improved modeling, design, construction, and management of pavement systems, thereby optimizing their life-cycle costs. APT is generally defined as a controlled application of a realistic wheel loading to a pavement system simulating long- term, in-service loading conditions. This allows the monitoring of a pavement systemâs performance and response to accu- mulation of damage within a much shorter time frame. Such information is critical to support informed highway planning, policy, and decision making. General feedback on f-sAPT programs and associations as well as sensors is regularly provided during the annual TRB AFD40 committee meeting and sessions. Most of this feedback is through presentations that are available on the committeeâs website. A summary of the major topics on which presentations are currently available include general f-sAPT program and association feedback, calibration issues around the MEPDG models, the development of design catalogues based on f-sAPT databases, and conference feedback. SenSorS and inStrumentation Background The topic of sensors is regularly covered during conferences. In the 2008 Madrid 3rd APT conference a workshop was held on the topic. Saeed and Hall (2003) also covered the Located at Tongji University, Shanghai, China Parameter Selection Mobile/fixed Mobile (MLS) Linear/nonlinear (circular, elliptical) Linear Uni-/bi-directional Uni-directional Number of axles 6 Own power (diesel/electric/other)/shore power Diesel power and shore power Field site/fixed site Field site Roads/airfields Roads Fixed device/trucks (automated or manually driven) Trucks (manually driven) Load range (range in kNâindicate full load for all tires as well as range per tire) 4.5 to 16.9 kip (20 to 75 kN) for all tires or per tire Tire details (size, type, inflation pressure range, other) 305/70 R22.5 Maximum inflation pressure of 189 psi (1 300 kPa) Tire wander options â1.5 ft to +1.5 ft (â450 mm to +450 mm) Suspension (present or not, types possible, permanent or not, etc.) Present Temperature control options Yes Speed range 3.4 to 13.4 mph (5.4 to 21.6 km/h) Dedicated operational data collection on full-scale APT device during operation (i.e., applied speed, load, location etc.)? Set speed, applied speed, load, location APT webpage link No TABLE 24 CHINA, TONGJI FIGURE 23 Tongji MLS device.
37 topic in detail. This section first focuses on sensors used directly on f-sAPT test sections, followed by complimentary instrumentation and information on databases. Pavement parameters that are typically measured in f-sAPT include strains, stresses, deflections, moisture, and temperature (Weinmann 2004). Simulation of in-service pavement condi- tions, loading configurations, and loading methods, must be representative of that encountered by in-service pavements. In situ measurements during f-sAPT allow for the develop- ment of accurate performance models and the calibration of mechanistic pavement design approaches. It appears that most programs conduct detailed laboratory evaluations of their materials to support the analysis of the f-sAPT data using standard laboratory tests. The compli- mentary use of field instruments such as the Falling Weight Deflectometer (FWD), Ground Penetrating Radar (GPR), and Portable Seismic Pavement Analyzer (PSPA) is also evident from responses, probably in an attempt to develop links between the f-sAPT responses and real pavement data. Analysis of the instrumentation used in the various f-sAPT programs did not indicate any unexpected instruments, with a range of different instruments being used to obtain similar properties (i.e., different types of profile measurement devices, mostly being laser-based). For elastic deflection data both high frequency (i.e., FWD) and low frequency (i.e., Road Sur- face Deflectometer) instruments are used, which may com- plicate the analysis data as most of the pavement materialsâ elastic responses are frequency dependent. A range of typical Located in Lyngby, Denmark Parameter Selection Mobile/fixed Fixed Linear/nonlinear (circular, elliptical) Linear Uni-/bi-directional Bi-directional Number of axles Single Own power (diesel/electric/other)/shore power Electric Field site/fixed site Fixed site Roads/airfields Roads Fixed device/trucks (automated or manually driven) Fixed device Load range (range in kNâindicate full load for all tires as well as range per tire) 9 to 29 kip (40 to 130 kN) Tire details (size, type, inflation pressure range, other) Truck tires Tire wander options ±7.9 in. (200 mm) Suspension (present or not, types possible, permanent or not, etc.) None Temperature control options Indirect control Speed range Up to 15.5 mph (25 km/h) Dedicated operational data collection on full-scale APT device during operation (i.e., applied speed, load, location etc.)? Yes APT webpage link None TABLE 25 DENMARk, DANISH ROAD INSTITUTE FIGURE 24 Danish road testing machine.
38 Located in France Parameter Selection Mobile/fixed Fixed Linear/nonlinear (circular, elliptical) Circular Uni-/bi-directional Uni-directional Num ber of axles 4 x 1 (single) to 4 x 3 (tridem) combinations Own power (diesel/electric/other)/shore power Electric Field site/fixed site Fixed site Roads/airfields Roads/airfields Fixed device/trucks (autom ated or m anually driven) F ixed device Load range (range in kNâindicate full load for all tires as well as range per tire) 8.9 to 31.5 kip (40 to 140 kN) Tire details (size, type, inflation pressure range, other) Truck Tire wander options ±19.6 in. (500 mm) Suspension (present or not, types possible, perm anent or not, etc.) Present Tem perature control options R egistered Speed range U p to 62 mph (100 km/h) Dedicated operational data collection on full-scale APT device during operation (i.e., applied speed, load, location etc.)? Yes APT webpage link h ttp://www.ifsttar.fr/en/home/ TABLE 26 FRANCE, FRENCH INSTITUTE OF SCIENCE AND TECHNOLOGy FOR TRANSPORT (INSTITUT FRANçAIS DES SCIENCES ET TECHNOLOGIES DES TRANSPORTS, DE LâAMéNAGEMENT ET DES RéSEAUx) (IFSTTAR) [Previously Laboratoire Central Des Ponts et Chaussées (LCPC)] FIGURE 25 French Manège de Fatigue. strain gauges are used, as is also visible from the reported data in literature cited. F-sAPT facilities can be used to help with the integration of the MEPDG through embedding instrumentation in pave- ment structures to measure pavement responses under load- ing (Willis 2008; Willis and Timm 2008). F-sAPT facilities have come together through CAPT to help develop prac- tical and appropriate instrumentation uses based on posi- tive and negative experiences at the various facilities. Using these insights ensures that an f-sAPT facility may be able to determine answers to questions such as the type of instru- ment required for a specific outcome before designing its instrumentation plan. Using experiences from other suc- cessful f-sAPT facilities to bolster success will increase the amount of valuable findings and improve effectiveness of these programs. Selected guidance from these experiences includes: ⢠Horizontal strain gauges are used to quantify pavement responses predicting pavement fatigue life. ⢠vertical strain is rarely measured; however, linear vari- able displacement transducers can be used to measure pavement deflection. ⢠Pressure cells are more commonly incorporated into pavement research. ⢠Accurate installation of gauges is one of the most impor- tant factors in determining if a gauge is going to behave correctly. ⢠Sensors with appropriate working ranges and qualities for the expected parameter range should be selected.
39 Located in Bergisch Gladbach, Germ any Parameter Selection Mobile/fixed M obile and fixed, MLS and im pulse generator Linear/nonlinear (circular, elliptical) Linear Uni-/bi-directional Uni- and bi-directional Num ber of axles 4 Own power (diesel/electric/other)/shore power Diesel and electric Field site/fixed site Fixed site Roads/airfields Roads Fixed device/trucks (autom ated or ma nually driven) F ixed Load range (range in kNâindicate full load for all tires as well as range per tire) 6.7 to 14.6 kip (30 to 65 kN) Tire details (size, type, inflation pressure range, other) Single/dual truck tires Tire wander options Y es Suspension (present or not, types possible, perm anent or not, etc.) No Tem perature control options Yes, indoor test section Speed range C reep to 13.7 m ph (22 km /h) Dedicated operational data collection on full-scale APT device during operation (i.e., applied speed, load, location etc.)? Detailed data collection APT webpage link http://www.bast.de/cln_007/nn_169964/DE/Aufgaben/ abteilungs/$abteilung-s-node.html?__nnn=true TABLE 27 GERMANy, FEDERAL HIGHWAy RESEARCH INSTITUTE/BUNDESANSTALT FüR STRASSENWESEN (BASt) FIGURE 26 BASt impulse generator device. FIGURE 27 BASt MLS.
Located in New Delhi, India Parameter Selection Mobile/fixed Mobile Linear/nonlinear (circular, elliptical) Linear Uni-/bi-directional Uni- and bi-directional Num ber of axles 1 Own power (diesel/electric/other)/shore power Diesel generator or shore power, self-propelled also Field site/fixed site Fixed, field possible Roads/airfields Roads and airfields Fixed device/trucks (autom ated or m anually driven) N o Load range (range in kNâindicate full load for all tires as well as range per tire) 6.7 to 22.5 kip (30 to 100 kN). Load levels of up to 44.9 kip (200 kN) can be achievable for short duration, special tests Tire details (size, type, inflation pressure range, other) Single 12R22.5 Dual 12R22.5 Super single 425/65 R22.5 truck tire Single aircraft tire, 58 to 145 psi (400 to 1 000 kPa), temperature and pressure sensors Tire wander options Yes, autom atic indexing or tracking between passes from side to side for a total lateral coverage of 29.5 in. (0.75 m ) in increm ents of 2 in. ± 0.2 in. (50 ± 5 mm ) Suspension (present or not, types possible, perm anent or not, etc.) No, axle mounted directly to carriage Tem perature control options â Speed range Maximu m wheel speed of 7.5 m ph ± 1.9 mp h (12 ± 3 km /h) for loads in the range of 6.7 to 22.5 kip (30 to 100 kN) and 4 m ph ±1.2 m ph (6.5 ± 2 k m/ h) for loads above 22.5 kip (100 kN) Minim um of 1.2 m ph (2 k m/ h) (creep speed possible) Dedicated operational data collection on full-scale APT device during operation (i.e., applied speed, load, location etc.)? Yes APT webpage link http://www.crridom .gov.in/facilities.html TABLE 28 INDIA, CENTRAL ROAD RESEARCH INSTITUTE (ICRRI) FIGURE 28 India HVS.
41 ⢠Gauges should be calibrated and checked before being installed in pavements for research. ⢠Duplication of gauges allows researchers to check the quality of the data. It is suggested that at least two strain gauges be placed in the transverse and longitudinal direc- tion of HMA layers to allow for functionality checks, while additional gauges should be considered if wheel wander is present and uncontrolled. ⢠Further research is required on developing accurate and reliable devices for measuring soil moisture contents. Sensor location and installation Burnham (2004) evaluated the load proximity correlation of dynamic strain measurements in concrete pavements at the MnROAD project. As the magnitude of a measured strain in a pavement is related to the proximity of the tire load, tire load wander is a necessary component of load testing. Best-fit curves and equations were developed for correlating dynamic strain data to tire load proximity with polynomial curves found to achieve good fit with the data. The maximum dynamic strain response did not occur when the reference point was at the location of the sensor, but rather when the tire reference point was located approximately 150 to 300 mm toward the roadway centerline. Tracking the location of individual vehicles during load response testing is vital in operating a test track, as the location of a vehicleâs tires has a profound effect on the values obtained from embedded sensors. In an effort to improve the efficiency Located in Tsukuba, Japan Parameter Selection Mobile/fixed Fixed Linear/nonlinear (circular, elliptical) Circular Uni-/bi-directional Uni-directional Nu mb er of axles 4 00,000 per year Own power (diesel/electric/other)/shore power Diesel Field site/fixed site Fixed Roads/airfields Roads Fixed device/trucks (auto ma ted or m anually driven) A uto mate d trucks Load range (range in kNâindicate full load for all tires as well as range per tire) 7.1 to 35 kip (31.85 to 156.8 kN) wheel load Tire details (size, type, inflation pressure range, other) 295/80 R2 2.5 Tire wander options Automatically controlled to wander ±9.8 in. (±250 mm) around the center Suspension (present or not, types possible, perm anent or not, etc.) Sam e as actual truck Tem perature control options N one Speed range Less than 24.8 m ph (40 km /h). Dedicated operational data collection on full-scale APT device during operation (i.e., applied speed, load, location etc.)? Speed, location, and number of passes APT webpage link http://www.pwri.go .jp/team/pavement/eindex.html TABLE 29 JAPAN, PUBLIC WORkS RESEARCH INSTITUTE (PWRI) FIGURE 29 PWRI f-sAPT device.
42 of load response testing at MnROAD a Global Positioning System-based vehicle tracking system was developed and tested (Burnham et al. 2010). The vehicle tracking system demonstrated its capability of tracking vehicle motion with an accuracy of ±1 in. (25 mm) at speeds of up to 43.5 mph (70 km/h), at least matching the accuracy obtained with a high- definition video camera previously used. These capabilities spawned the development of a wireless triggering system (triggering data acquisition as a test vehicle passes through an area containing pavement sensor) and a vehicle guid- ance system (guides test vehicle drivers through various predetermined paths). Sensor installation requires extreme care to ensure that the material surrounding the sensors correctly represents the material in the rest of the layer. It is desirable to have many sensors embedded in the test sections; however, too many sensors may significantly disturb the material density and moisture and thereby decrease the test data reliability. Using the assumption that stress and strain would reach maximum values at points under the center of the tire path, Cortez and Janoo (2008) installed sensors only at these locations and devised a method to create a system of virtual sensors that generated detailed contour cross sections of stress and strain without the expense of more sensors and without risking dis- turbance to the material layers. Embedded instrumentation is an important tool at f-sAPT facilities as M-E pavement design and analysis methodolo- gies are implemented. It is critical to determine the accuracy and precision of response measurements. Willis and Timm (2009b) established the practical level of within-gauge preci- sion for HMA strain measurements at NCAT by conducting Located in Canterbury, New Zealand Parameter Selection Mobile/fixed Fixed Linear/nonlinear (circular, elliptical) Circular Uni-/bi-directional Uni-directional loading Number of axles 2 Own power (diesel/electric/other)/shore power Own power (electric) Field site/fixed site Fixed site Roads/airfields Roads Fixed device/trucks (automated or manually driven) Fixed device Load range (range in kNâindicate full load for all tires as well as range per tire) 4.7 to 13.5 kip (21 to 60 kN) Tire details (size, type, inflation pressure range, other) Truck tires Tire wander options 39 in. (1 m) wide wander Suspension (present or not, types possible, permanent or not, etc.) Full suspension systems available Temperature control options Yes Speed range 3 to 31 mph (5 to 50 km/h) Dedicated operational data collection on full-scale APT device during operation (i.e., applied speed, load, location etc.)? Yes APT webpage link None TABLE 30 NEW zEALAND, CANTERBURy ACCELERATED PAvEMENT TESTING INDOOR FACILITy (CAPTIF) FIGURE 30 CAPTIF facility.
43 FWD testing on strain gauges and calculating the abso- lute differences to determine individual gauge variability. Within-gauge variability was not significantly affected by gauge orientation, load level, or pavement condition. Over- all, strain readings with differences of less than 12 µe were set as a practical benchmark for NCAT for within-gauge variability. During future research cycles, FWD on-gauge testing will be conducted before trafficking occurs to ensure the gauges are working properly. If more than 90% of the absolute differences within a single gauge are over the pre- scribed benchmark, further testing and analysis will be con- ducted to validate the gaugeâs measurements. F-sAPT facilities are typically designed to test pavements from an original condition to a failed state in a relatively short time period while utilizing embedded instrumentation to monitor pavement responses. It is important for research- ers to be able to evaluate data quality obtained from the pave- ment. Fourteen test sections at the NCAT Pavement Test Track were investigated to better understand the inter action between pavement distress and response measurement (Tay- lor and Timm 2008). Prior to distress, the measured vertical pressures were typically a function of temperature. How- ever, after major distresses were evident in many sections, the measured responses became highly erratic. Analysis of the temperatureâpressure relationship data from the NCAT sections using the representative pressure value for a given dayâs data collection and a representative HMA temperature was used to evaluate pressure gauge behavior. It was shown that a low (<0.7) R2 value from the relationships indicated potential gauge malfunction or pavement damage. Located in Delft, Netherlands Parameter Selection Mobile/fixed Fixed to test area, but mobile within test area Linear/nonlinear (circular, elliptical) Linear Uni-/bi-directional Bi-directional loading Num ber of axles 1 Own power (diesel/electric/other)/shore power O wn power (electric) Field site/fixed site Fixed site Roads/airfields Roads Fixed device/trucks (autom ated or m anually driven) F ixed device Load range (range in kNâindicate full load for all tires as well as range per tire) 5.6 to 22.5 kip (25 to 100 kN) Tire details (size, type, inflation pressure range, other) All types of wide base and dual tires Inflation pressure up to 130 psi (900 kPa) Tire wander options A ny lateral wander distribution Suspension (present or not, types possible, perm anent or not, etc.) No suspension Tem perature control options Only heating [up to 86°F (30°C) above amb ient temperature], no cooling Speed range 0 to 12.4 m ph (0 to 20 k m/ h) Dedicated operational data collection on full-scale APT device during operation (i.e., applied speed, load, location etc.)? All available APT webpage link Available but not up to date TABLE 31 NETHERLANDS, DELFT UNIvERSITy OF TECHNOLOGy FIGURE 31 LINTRACK f-sAPT device.
44 traffic loading measurements and Control Piezoelectric sensors used for collecting Weigh-in-Motion (WIM) data were evaluated by Alavi et al. (2001) under controlled laboratory and f-sAPT loading conditions in both HMA and PCC pavements. The HMA installation was done at the WesTrack test facility and the PCC installation at a Cal- trans HvS test site. The results indicated no problems with the durability of the WIM sensors, and bonding materials per- formed well. The study indicated that the piezoelectric WIM sensors evaluated can withstand real loading conditions in both HMA and PCC pavements. The Public Works Research Institute developed a new system for controlling the automatically driven trucks (four loaded vehicles with double rear axles at a time) on their pavement test field, increasing the accelerated loading test capacity by three over the previous system. When loaded vehicles are constantly operated, 8,610,000 wheel passes equivalent to 11 kip (49 kN) (250 days/year, 10 h/day) were applied. The system allows vehicles to stop and go at various points such as crossroads, and manned traveling is also pos- sible (kido and Ito 2004). De Beer et al. (2004) described the development of the Stress-in-Motion (SIM) system as well as the application of the technology in f-sAPT applications. The SIM system assists in improving the definition of the tire/pavement inter- action to gain an improved quantification of the shape and magnitude of the 3-D tire/pavement forces measured from real trucks. Typically, Maximum vertical Contact Stresses (MvCS) appear to be as much as twice the inflation pressure Located in Ansan, Gyeonggi-do, South Korea Parameter Selection Mobile/fixed Fixed Linear /nonlinear (circular, elliptical) Linear Uni-/bi-directional Uni- and bi-directional Num ber of axles 1 Own power (diesel/electric/other)/shore power Electric Field site/fixed site Fixed Roads airfields Roads Fixed device/trucks (autom ated or m anually driven) F ixed device Load range (range in kNâindicate full load for all tires as well as range per tire) 15.7 to 56.2 kip (70 t o 250 kN) Tire details (size, type, inflation pressure range, other) Truck, dual Tire wander options ±13.8 in. (±350 mm) Suspension (present or not, types possible, perm anent or not, etc.) Yes Tem perature control options C ontrolled heating Speed range 7 .5 mph (12 km/h) Dedicated operational data collection on full-scale APT device during operation (i.e., applied speed, load, location etc.)? Yes APT webpage link N one TABLE 32 SOUTH kOREA, HANyANG UNIvERSITy FIGURE 32 Hanyang Accelerated Pavement Tester (HAPT).
45 (at extremely high levels of loading), while it exceeds the inflation pressure by approximately 30% for normal loading conditions. The length of the tire contact patch increases with increased loading while the width remains constant. quan- tification of the horizontal interface shear stresses between the tire and the road surface could assist in understanding the horizontal stress regime of a moving tire with lateral and longitudinal stresses as high as 36.2 (250 kPa) and 23.9 psi (165 kPa), respectively. Strain measurements During a comprehensive f-sAPT program at Laboratoire des voies de Circulation (LAvOC) in Switzerland (as part of COST 347), a pavement was instrumented using a range of strain sensors (Wistuba 2004). Both longitudinal and trans- versal signals were measured, resulting from the different strain gauges and the loading conditions. Laboratory tests were initially conducted on the different strain gauges to determine their response, and their accuracy was verified in the laboratory using a 4 point bending strain test. Burnham et al. (2007) described a procedure developed at MnROAD to efficiently extract peak and baseline values from dynamic sensor responses. The procedure performs automated identification of peak and baseline responses and has significantly increased dynamic response data processing from MnROAD, specifically with the large volumes of data collected from the facility. Located in Pretoria, South Africa Parameter Selection Mobile/fixed Mobile HVS Mk III and IV+ Linear/nonlinear (circular, elliptical) Linear Uni-/bi-directional Uni- and bi-directional Number of axles 1 Own power (diesel/electric/other)/shore power Both Field site/fixed site Both Roads/airfields Roads and airfields Fixed device/trucks (automated or manually driven) Fixed device Load range (range in kNâindicate full load for all tires as well as range per tire) 4.5 to 45 kip (20 to 200 kN) Tire details (size, type, inflation pressure range, other) Dual, wide base, aircraft Tire wander options Yes, 0 to 4.9 ft (0 to 1.5 m) wide Suspension (present or not, types possible, permanent or not, etc.) No Temperature control options Yes, hot and cold Speed range 0 to 5 mph (0 to 8 km/h) Dedicated operational data collection on full-scale APT device during operation (i.e., applied speed, load, location etc.)? Yes APT webpage link www.gautrans-hvs.co.za www.csir.co.za TABLE 33 SOUTH AFRICA, COUNCIL FOR SCIENTIFIC AND INDUSTRIAL RESEARCH (CSIR) AND GAUTENG DEPARTMENT OF PUBLIC ROADS AND WORkS (GAUTRANS) FIGURE 33 CSIR/Gautrans HVS.
46 kim et al. (2008) observed variations between the mea- sured and predicted strains in compression when gauges installed on the surface of an HMA f-sAPT section underwent a significant amount of shear strain. Further analysis associ- ated with these observations implies that the transverse strains measured in compression included approximately 20% shear strains and that the errors in the strain measurements appeared to be caused by the complexity of the strain state, occurring before and after the loading. Because the surface strain gauge was designed for measuring only axial strains, the shear strains might be the cause of the unknown strains and over- estimation of compressive strains. The evaluation indicated that strain measured in the multiple-strain state may include potential errors and over- or underestimate the true strain. Literature regarding repeatability of pavement strain mea- surements is limited although it is necessary to have a high degree of confidence in these data. Gokhale et al. (2009) described a parametric experiment conducted by FDOT in an effort to evaluate the repeatability of strain gauges currently used in their f-sAPT facility. Strain measurements using 28 strain gauges were made at five different pavement temperatures, three levels of load, three levels of tire pressure, and three levels of speed with loading applied using the HvS (five replicate load passes per variable combination). Statistical analysis showed that the surface strain gauges are repeatable under the vari- ous conditions of temperature, load, speed, and tire pressure and that strain measurements did not vary significantly with a change in the internal tire pressure (for the specific pavement structure and materials). They concluded that, if installed prop- erly, surface strain gauges can be repeatable and yield reliable measurements, although the strain gauges evaluated were not repeatable at operating temperatures greater than 104°F (40°C). Located in Madrid, Spain Parameter Selection Mobile/fixed Fixed Linear/nonlinear (circular, elliptical) Linearâcircular combined Uni-/bi-directional Uni-directional Num ber of axles 1 Own power (diesel/electric/other)/shore power Electric Field site/fixed site Fixed site Roads/airfields Roads Fixed device/trucks (autom ated or m anually driven) Autom atically driven vehicles Load range (range in kNâindicate full load for all tires as well as range per tire) 24.7 to 31.5 kip (110 to 140 kN) axle 12.4 to 15.7 kip (55 to 70 kN) per wheel Tire details (size, type, inflation pressure range, other) Conventional truck wheels, typically dual wheels Tire wander options ± 14 in. (±360 mm) Suspension (present or not, types possible, perm anent or not, etc.) Conventional trucks, air spring type Tem perature cont rol options N o controlâonly shedding Speed range 0 to 28 m ph (0 to 45 k m/ h) Dedicated operational data collection on full-scale APT device during operation (i.e., applied speed, load, location etc.)? Autom ated syste m based on the following variables (or variable combinations): asphalt temperature, vehicle speed, vehicle transverse position, time, and num ber of cycles APT webpage link Not available TABLE 34 SPAIN, CENTRO DE ESTUDIOS DE CARRETERAS (CEDEx) FIGURE 34 CEDEX f-sAPT facility.
47 Strain magnitude increased with an increase in surface temper- ature and load and decreased with an increase in wheel speed. rutting measurements MnROAD developed an Automated Laser Profile System to replace the 6-foot straight edge rutting measurements conducted on the HMA test cells (Worel et al. 2004). The Automated Laser Profile System data compared well to 6-foot straight edge data when each measurement type and equipment was reviewed, although the ALPS measure- ments tend to be greater than straight edge measurements as a result of edge effects, the measurement increment used for straight edge measurements and straight edge wear. The use of laser-based profiling systems has become pre- dominant in the characterization of the permanent deformation of test pavements. FDOT developed and installed a two-laser profiler on its HvS (Byron et al. 2005). This system proved to be effective for profiling f-sAPT sections, accurately map- ping the entire test surface at a reduced time and effort. FDOT employed the profiling system in a wide variety of research studies, including the measurement of rutting rate in flexible pavement systems, measurement of slab curling and faulting in rigid pavements, and determination of deformation and settlement of raised pavement markers. Multiple-Depth Deflectometers have been implemented for measuring rutting in pavement layers by FAA during various tests (Garg and Hayhoe 2008). instrumented Pavements and airfields Twelve different flexible pavement designs have been built at the virginia Smart Road (Al-qadi et al. 2000). The varia- Located in Linköping, Sweden Parameter Selection Mobile/fixed Mobile, HVS IV Linear/nonlinear (circular, elliptical) Linear Uni-/bi-directional Bi-directional Number of axles One Own power (diesel/electric/other)/shore power Diesel or electric Field site/fixed site Field Roads/airfields Roads Fixed device/trucks (automated or manually driven) Fixed device, automated driven Load range (range in kNâindicate full load for all tires as well as range per tire) 6.7 to 24.7 kip (30 to 110 kN) Tire details (size, type, inflation pressure range, other) Single or dual truck tire Tire wander options 0 to 28 in. (0 to 0.7 m) Suspension (present or not, types possible, permanent or not, etc.) Hydraulic feedback Temperature control options Yes, pavement temp between 32 and 86°F (0 and 30°C) Speed range 0 to 12 km/h Dedicated operational data collection on full-scale APT device during operation (i.e., applied speed, load, location etc.)? Speed, load, location, number of repetitions APT webpage link www.vti.se TABLE 35 SWEDEN, vAG-OCH TRANSPORTFORSkNINGSINSTITUT (vTI) FIGURE 35 VTI HVS.
48 tions in the 12 pavement sections include layer thickness, drainage, subgrade strength, HMA wearing surface design, and inclusion of geosynthetic materials for reinforcement and/or moisture barrier/strain energy absorption. The sec- tions were heavily instrumented with pressure cells, strain gauges, Time Domain Reflectometry probes, thermocouples, liquid levels, and frost probes during construction and con- nected to a data acquisition system housed in an underground bunker. There was a need to check the response and integrity of the sensors before the completion of the road construc- tion and a truck was driven over the instrumented sections with varying load, tire pressure, and speed. The pressure cell (located in the subgrade) response was good and the response resulting from each tire loading was symmetric, confirming the pressure cell calibration findings that there is no hyster- esis. Response from the strain gauge (perpendicular to traf- fic direction) under the HMA base layer showed tension measured from all three axles of the truck, with the steering axle driving directly on top of the strain gauge, whereas the response from a longitudinal strain gauge under the HMA base layer showed compression in the gauge as the vehicle approaches. As the vehicle passes on top of the gauge, it causes tension at the bottom of the base layer, as would be expected. The testing plan included measuring pavement response to truck loading at different axle loading, tire pres- sure, and speed under different environmental conditions as well as periodic GPR, FWD, and laboratory material testing and evaluation. Located in Empa Dübendorf, Switzerland Param eter Selection Mobile/fixed Mobile (MLS10) Linear/nonlinear (circular, elliptical) Linear Uni-/bi-directional Uni-directional Nu mb er of axles 4 Own power (diesel/electric/other)/shore power O wn power (diesel/electric/other)/shore power Field site/fixed site Field site/fixed site Roads/airfields Roads/airfields Fixed device/trucks (auto ma ted or m anually driven) F ixed device Load range (range in kNâindicate full load for all tires as well as range per tire) Up to 65 kN per axle Tire details (size, type, inflation pressure range, other) Dual tired 295/60 R22.5 Tire wander options Available Suspension (present or not, types possible, perm anent or not, etc.) Hydro-pneumatic Tem perature control options Available Speed range Up to 22 km/h Dedicated operational data collection on full-scale APT device during operation (i.e., applied speed, load, location etc.)? Dynamic loading, speed APT webpage link http://www.empa.ch/plugin/tem plate/e mp a/*/71452 http://www.sf.tv/sf1/einstein/index.php? docid=20071 220 Super single 385/65 TABLE 36 SWITzERLAND, SWISS FEDERAL LABORATORIES FOR MATERIALS SCIENCE AND TECHNOLOGy (EMPA) FIGURE 36 EMPA MLS10.
49 Al-qadi et al. (2008, 2010) discussed ongoing research to measure the in situ response to airplane traffic of flexible pavement on a runway at CagliariâElmas airport in Italy where the runway pavement layers were instrumented during construction with 149 instruments (Linear variable Displace- ment Transducers, pressure cells, Time Domain Reflectom- etry probes, thermocouples, and HMA strain gauges). The objective of this detailed installation was measuring the pave- ment responses during takeoff, landing, and taxiing. Prelimi- nary data acquired during and after the runwayâs construction and before opening to airplane traffic showed that the instru- mentation process was a success and that data could success- fully be compared with preliminary numerical simulations. It demonstrates that complicated instrumentation programs can be successfully run during f-sAPT on runways. The FAA has instrumented various runways and taxi- ways for APT, using commercial aircraft such as B-777, B-747, A-340, and A-380. Data from these tests were used in calibration of 3-D FEM (NIkE-3D). valuable pavement response and performance data were collected and are con- tinuously analyzed for heavy commercial aircraft and dif- ferent climatic condition combinations (Rufino et al. 2002). Construction measurements Emissions from the production and paving of HMA are con- stantly being scrutinized. Introduction of WMA technologies is seen as potentially leading to a reduction in some of these emissions. The University of California Pavement Research Center (UCPRC) has developed a protocol and equipment for accurately measuring surface emissions during both HMA and Located in Crowthorne, United Kingdom Parameter Selection Mobile/fixed Fixed Linear/nonlinear (circular, elliptical) Linear Uni-/bi-directional Uni-/bi-directional Number of axles 1 Own power (diesel/electric/other)/shore power Electric Field site/fixed site Fixed site Roads/airfields Roads Fixed device/trucks (automated or manually driven) Fixed device Load range (range in kNâindicate full load for all tires as well as range per tire) 10.3 to 45 kip (46 to 200 kN) Tire details (size, type, inflation pressure range, other) Truck, dual Tire wander options None Suspension (present or not, types possible, permanent or not, etc.) None Temperature control options Dedicated temperature control Speed range Up to 12.4 mph (20 km/h) Dedicated operational data collection on full-scale APT device during operation (i.e., applied speed, load, location etc.)? Yes APT webpage link http://www.trl.co.uk/facilities/pavement_testing/ TABLE 37 UNITED kINGDOM, TRANSPORT RESEARCH LABORATORy (TRL) PAvEMENT TEST FACILITy FIGURE 37 TRL pavement test facility.
50 WMA paving operations (Farshidi et al. 2011). The equipment consists of a transportable flux chamber to obtain direct mea- surements of reactive organic gas emissions and to estimate the fluxes of volatile organic compounds and semi-volatile organic compounds. The applicability of the method in characterizing organic compounds in emissions during construction was veri- fied on an f-sAPT site during construction of test sections, and although emission reduction trends from the time of placement until after final compaction were similar for all the mixes, sig- nificant differences were noted in the alkanesâ concentration of the emissions from the HMA and the WMA mixes, respec- tively. These preliminary results indicated that the method is appropriate for accurately quantifying and characterizing vola- tile organic compounds and semi-volatile organic compounds emissions during asphalt paving. Complementary instrumentation Complementary instrumentation is that equipment often used in conjunction with f-sAPT, although it does not form part of the normal f-sAPT sensors and can typically be used inde- pendently. In this regard, the focus is on the FWD, GPR, Lightweight Deflectometer, PSPA, and Model Mobile Load Simulator (MMLS) as references are specifically made to these devices in the literature. Falling Weight deflectometer The FWD is commonly used to evaluate structural character- istics of pavements simulating vehicular loads at typical high- way speeds. The data are typically used to back-calculate layer moduli and design overlays (Howard and Warren 2008). With f-sAPT typically conducted at slow speeds, measured responses from traffic loads are typically greater than those from the FWD loads, with the extent of the difference becom- ing more pronounced with depth. The release of the MEPDG generates a strong need for identifying and evaluating the way that FWD testing is oper- ated and integrated in the new design procedure with one of the key inputs for HMA pavements the dynamic modulus (E*) mastercurve. A more accurate prediction of its remaining service life can be achieved if the damaged E*mastercurve of the HMA in an existing pavement can be obtained from FWD deflections. kutay et al. (2011) developed a methodol- ogy to backcalculate the E*mastercurve of the HMA pave- ment layer using the time history of FWD surface deflections, implementing a layered visco-elastic forward algorithm to be used in an iterative backcalculation procedure for linear visco-elastic properties of HMA pavements. Donovan and Tutumluer (2009) presented a methodology based on analyzing FWD test data between the trafficked and nontrafficked lanes to determine degradation and rut- ting potential of flexible pavement unbound aggregate lay- ers in comparison with the subgrade damage. The validity of the approach is demonstrated by analyzing Heavy Weight Deflectometer (HWD) data obtained from NAPTF flexible airport pavement test sections constructed with substantially thick unbound aggregate base/subbase courses. Clear evi- dence was obtained of the increased base damage induced in the NAPTF layers during trafficking resulting from the applied aircraft gear load wander through determining the modified Base Damage Index and Base Curvature Index defined from HWD pavement deflection basins. Garg and Marsey (2004) used the HWD at the NAPTF, both on the wheel paths and pavement centerline (nontraf- ficked) to study the effect of traffic tests on the pavement structure. The full pavement deflection basin was characterized at three different load levels [12, 24, and 36 kip (53, 107, and 160 kN)]. Analyses of deflection data from the trafficked and nontrafficked areas showed that the HWD could be effectively used to evaluate the effect of traffic on the pavement structure. ground Penetrating radar Hugo et al. (2008) and Partl (2008) described case studies where the simultaneous evaluation of measured performance trends using GPR and seismic stiffness improved understand- ing and quantification of performance of pavement systems. This was supported by vulcano-Greullet et al. (2010) who stated that more work is required to develop specific pro- cesses to detect risk areas in pavements where, for instance, trapped water is present using GPR surveying. light Weight deflectometer The use of a portable Light Weight Deflectometer (LWD) for construction quality control and material investigation for earthworks and road construction is increasing interna- tionally. Fleming et al. (2007) reviewed the LWD as a field evaluation tool and evaluated the test variables and data qual- ity. They concluded on its usefulness and limitations for a variety of earthwork and road assessment scenarios. They indicated that the correlation of the LWD to FWD stiffness (using the central geophone only) appears to be variable and perhaps site and layer thickness dependent. Brill and Guo (2009) described the use of both LWD and PSPA measurements conducted for subgrade characterization, demonstrating stress-softening behavior in cohesive soils. Portable Seismic Pavement analyzer De vos et al. (2007) used the PSPA for monitoring stiff- ness changes resulting from trafficking under f-sAPT, suc- cessfully detecting increased distress in the pavement layers before manifestation on the surface. It was possible to dis- cern the nature of the distress, lending support for the use of the PSPA as a nondestructive accessory tool with f-sAPT.
51 Gibson et al. (2011) also mentioned the use of the PSPA in evaluation changes in HMA modulus with increasing fatigue. dynamic Cone Penetrometer Four forensic studies on MnROAD demonstrate that forensic investigations are valuable tools in determining the causes of premature pavement failures. Field testing methods such as Dynamic Cone Penetrometer (DCP), cores, laser profiler systems, and visual observation are quite effective in measur- ing pavement material properties and performance, whereas laboratory testing parameters such as asphalt binder grading, HMA performance testing, and aggregate properties provide additional information on pavement material properties. Proper compaction of all pavement layers is crucial during construction to prevent consolidation and rutting (Clyne et al. 2008a, b). model mobile load Simulator The MMLS is a one-third scale device that is used for scaled APT. Epps et al. (2001, 2002) reported on stress analyses to explore the hypothesis of comparable stress distribution between scaled APT and f-sAPT. Application of the MMLS to predict rutting performance is based on the hypothesis that for a simple pavement structure (only a single HMA layer) and similar tire pressures, the distribution of MvCS beneath the MMLS will be comparable to that beneath a single truck tire with a standard load of one-quarter equivalent single-axle load (ESAL), considering the scaling factor and considering dimensionless depth. For the hypothetical structures evalu- ated, the comparable stress hypothesis was upheld. The full procedure for validating a performance prediction methodol- ogy based on stress analysis and MMLS testing is described in the cited references and not directly relevant in all details for this f-sAPT synthesis. Ebels et al. (2004) evaluated the response obtained with the MMLS and HvS on a thin HMA pavement with stabilized base and found that under ambient temperature conditions similar surface rutting was observed; however, at elevated temperatures the MMLS ruts were sig- nificantly higher. Application of the method for comparing MMLS rutting with full-scale rutting did not provide satis- factory answers, and the authors stated that âone of the main factors that influence the reliability of the Prediction Ratio method is the fact that the pavement tested on the N7 is a composite pavement with a flexible hot-mix asphalt surfac- ing on a rigid granular base. This type of pavement differs from the full depth HMA type of pavement structures that have been used to develop and validate the adopted theory of comparison between the two types of loading.â In a com- parison of the maximum vertical contact stresses of the one- third scale test tires of the MMLS with those measured for three types of full-scale test tires of the HvS using the SIM technology (De Beer et al. 2006; De Beer and Sadzik 2007), analysis indicated that the MvCS increased linearly with tire inflation pressure for the MMLS test tires and full-scale test tires. Further, the MvCSs for the diamond patterned square profile scale tires were much lower than those of the full- scale test tires as they represented, at most, only 52.5% of those measured for the 11R22.5 (full-scale HvS) test tire, 37.5% for the single 315/80 R22.5 (full-scale HvS) test tire, and 12.5% and 20%, respectively, for the smooth and rough- texture tests on the 12R22.5 (full-scale HvS) test tire. For the scaled-down tires the MvCS was roughly equal to inflation pressure, whereas for the full-scale HvS tires the MvCS was approximately 50% higher. databases The Spanish Centro de Estudios de Carreteras (CEDEx) test track uses software to measure and manage the data from the six pavement sections of the facility enabling the planning of measurements for specified conditions of speed, offset, pave- ment temperature, date or number of cycles, and the analysis of the registered data (Ayuso et al. 2008). The system can manage up to 256 sensors and typically around 250,000 measurements are carried out in a complete test. The data acquisition system enables full-automatic sensor measurement, and all data are stored in a database together with summary data (such as maxi- mum peak value, zero reference, etc.) for each record. The soft- ware enables analysis of the stored data allowing the response of any sensor to be plotted against test-related variables such as pavement temperature, vehicle speed, or transverse position. Evolution of data versus number of test cycles can also be dis- played. Output ASCII files can be also generated so that data can be evaluated outside the database environment in statistical packages or pavement design programs. Lea and Popescu (2003) described the design, implementa- tion, and use of the UCPRC HvS database that is used to store all of the data collected directly from HvS test sections. The same database is used to store data from both flexible and rigid pavement sections. Besides the raw data files collected during testing, the database consists of a Microsoft Access® database and a Microsoft Excel® spreadsheet. The database is stored in an Oracle® database, which is used to drive an HTML site used to view the data. The database structure enforces many relationships to ensure that the data are consistent. Worel (2006) described the MnROAD database as a col- lection of data originating from a number of different methods and processes and stored in a commercial database, offline data system, project reports, website, individual researcher files, and a geographical information system database. The many formats and sources impact the methods that are used to store the data (both calculated and raw). As MnROAD is a state-run public-funded facility, all data and reports are available at no cost. Although some data are available on the website, access to the MnROAD database is limited to key researchers at MnROAD. This allows controlled access to the detailed data and researchers have the opportunity to explain both methods and any quality issues that might impact the potential use of the data requested to potential users.
52 Lea (2008) also shared lessons learned in the design and operation of the database. Over 12 years of operation, UCPRC have operated two HvSs and tested more than 90 sections, accumulating nearly 70 million passes, resulting in a 12 GB database. The most important consideration is that the data- base must form an integral part of the workflow in the day- to-day running of an APT project. It is thus important that the database be adapted to the changing needs of the project, argu- ing against standardized databases across various APT proj- ects. This results in the quality control of the data also being a standard part of the day-to-day operations. It is important to have the primary storage of data be in human readable and editable text files that can be used to populate a relational data- base, as this allows a clean separation of the data from the form of the database, and protects against database corruption and difficulties with managing a large amount of information in a relational database. The FAAâs NAPTF database (http://www.airporttech. tc.faa.gov/naptf/databases.asp) is a full-scale airfield testing database that is open for use by international researchers. Researchers from the United States, China, and France have already used data from this resource. CHaPter Summary Chapter two provided information on the various f-sAPT pro- grams, associations, equipment, and instrumentation. It sum- marizes information obtained from the questionnaire, as well as selected public domain literature and the websites of the various associations. The information indicates that there are 19 U.S.-based and 24 international f-sAPT programs that are actively conducting f-sAPT research. Most of the programs are using sensors and instruments that were developed over a number of years, mostly well-described in previous synthe- ses as well as program websites. The use of complementary instruments (i.e., FWD, GPR, LWD, PSPA, etc.) forming the link between the f-sAPT sections and real pavements (where these instruments are typically used) was highlighted. Detailed information on questionnaire feedback on the topics covered in this chapter is provided in Appendix D.
