
6
Indoor Exposure to Particulate Matter: Metrics and Assessment
The second session of the day featured three speakers. William W. Nazaroff (University of California, Berkeley) discussed indoor PM2.5 measurement, exposure, and control. Kirsten Koehler (Johns Hopkins Bloomberg School of Public Health) then addressed the challenge of moving from measuring indoor PM2.5 to evaluating a building occupant’s exposure. Dusan Licina (Swiss Federal Institute of Technology, Lausanne) spoke about low-cost indoor particulate matter sensors and how they can be used and misused. Following the three presentations, Elizabeth Matsui moderated an open discussion.
TRANSCENDING COMPLEXITY: INDOOR PM2.5 MEASUREMENT, EXPOSURE, AND CONTROL
William Nazaroff opened by noting that an estimated 6 million of the 55 million deaths worldwide in 2016—more than 10 percent—were associated with air pollution, and 4.1 million were tied to ambient particulate matter pollution. Secondhand tobacco smoke, a major contributor to ill health, was linked to nearly 1 million deaths, primarily because of its PM2.5 content. For context, he noted that some 2.9 million people worldwide had died of COVID-19 as of April 9, 2021. Again, the majority of deaths associated with exposure to PM2.5 are most likely caused by indoor exposure and most likely by residential exposure, given the percentage of time that people typically spend in that environment.
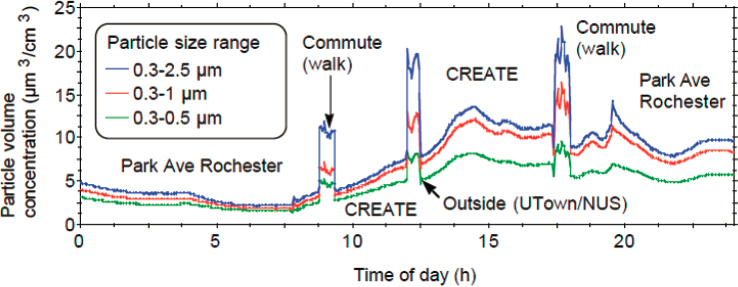
For a time, Nazaroff worked in Singapore, where there is seasonal wildfire smoke from agricultural burning, and during one of these smoke
episodes several of his collaborators carried personal particulate matter monitors with them as they went about their daily routines. Figure 6-1 shows one day’s results for someone who spent the night in a hotel, walked to a building called the CREATE (Campus for Research Excellence and Technological Enterprise) Tower, spent time in the tower, took a break at lunch and walked outside for a time, and then after another period of work in the tower walked back to the hotel and spent the night (Zhou et al., 2015). Overall, the hotel and the research tower afforded about a 50 percent reduction in the indoor concentration of PM2.5.
While indoor sources of PM2.5 were not particularly important in this case, indoor emission sources such as smoking, burning candles, cooking, breathing, humidification, and vacuum cleaning can be important contributors in the home. In Nazaroff’s view as an engineer, there are four dimensions of complexity when thinking about indoor PM2.5: size, temporal, chemical, and spatial complexity. For the bulk of the PM2.5 mass, particles range in size from 0.01 to 2.5 microns, a 250-fold span in diameter and a 16 millionfold span in mass between the largest and smallest particles, which Nazaroff pointed out is the same mass ratio between an Etruscan shrew and a gray whale.
Chemically, the composition of fine particles incudes elemental and organic carbon, with vastly diverse chemical composition, as well as crustal materials, inorganic salts, metals, microbes, and other constituents. Temporal complexity arises from the fact that indoor concentrations can change
SOURCE: Nazaroff slide 4, adapted from Figure 2 in the cited publication.1
1 Reprinted from Building and Environment, vol. 93, Zhou J, Chen A, Cao Q, Yang B, Chang VWC, Nazaroff WW. 2015. Particle exposure during the 2013 haze in Singapore: Importance of the built environment, pp. 14–23, Copyright (2015), with permission from Elsevier.
by a factor of 100 in a matter of minutes, in response, for example, to an episodic emission event such as cooking. Spatially, each building is its own distinct entity with its own fine indoor particulate matter level, and even within a building concentration may vary among rooms and within a room.
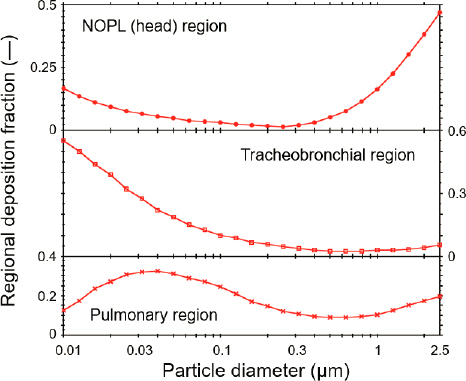
Size and spatial complexity exist, too, in the distribution of different size particles in the three major regions of the respiratory tract (Figure 6-2) (Yeh et al., 1996). Nazaroff explained that this differential distribution of particles has consequences for the body’s physiologic response, as there are different clearance mechanisms and different disease sensitivities in different regions of the lung.
Chemical complexity occurs in multiple forms. For example, when outdoor PM2.5 comes indoors, its chemical composition changes as the temperature and humidity change and those changes alter the equilibrium partitioning for semivolatile species, including water. Particle surfaces take up and emit gaseous species indoors, which can affect the condensation to and evaporation from the particles, and there can be shifts in aerosol liquid water and pH, which can alter the size and composition of the particles (Goldstein et al., 2021).
SOURCE: Nazaroff slide 7, adapted from Figure 1 in the cited publication.1
1 Comparisons of Calculated Respiratory Tract Deposition of Particles Based on the Proposed NCRP Model and the New ICRP66 Model. Yeh H-C, Cuddihy RG, Phalen RF, Chang IY. Aerosol Science and Technology 25(2):134–40. ©The American Association for Aerosol Research; http://www.tandfonline.com on behalf of The American Association for Aerosol Research, reprinted by permission of Taylor & Francis Ltd.
Activity and Occupancy Produce Complexity
Concentrations vary markedly indoors, mostly in response to changing indoor conditions, especially indoor emission activities, said Nazaroff (Patel et al., 2020). He reminded listeners that the data Marina Vance presented from the HOMEChem study (see Chapter 3 for details) clearly showed the variations in indoor particulate matter concentrations throughout the day as different activities occur inside the home. He explained that what this highlights about temporal variability is that relying on time-averaged indoor concentration measurements without accounting for the correlation with occupancy can mischaracterize indoor exposure.
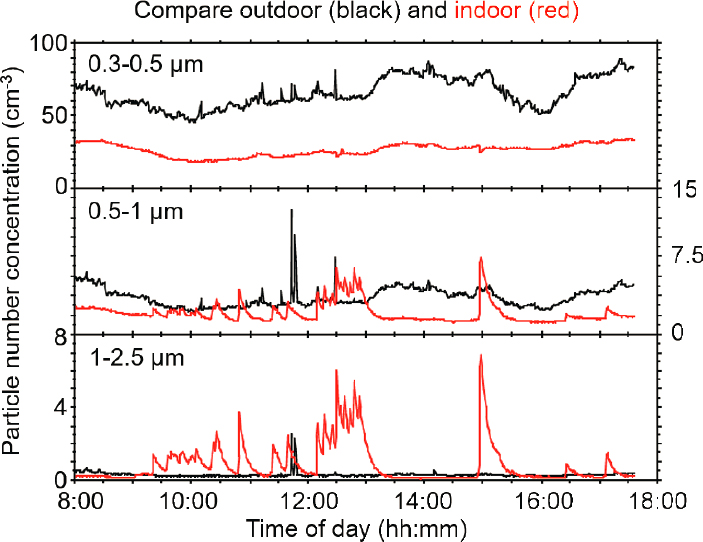
As an example, Nazaroff discussed the results of a study in which his research group outfitted a small university classroom with a particle sensor and measured particle distribution throughout the day as the classroom sat empty or was occupied (Figure 6-3) (Qian et al., 2012). The results showed that smaller particles, those 0.3 to 0.5 microns in diameter, were not influenced by the occupants, while the largest particles were strongly influenced
SOURCE: Nazaroff slide 10, from Qian et al. (2012), adapted from Supplementary Figure S7; reprinted with permission from John Wiley and Sons, Inc.
by occupants and movement in the classroom thanks to particle shedding from the occupants and resuspension of particles from the floor.
In another study using a well-controlled chamber to study spatial complexity, Nazaroff and his collaborators had subjects conduct different activities while the research team measured particle levels in their breathing zones and in the background room air (Figure 6-4). Levels in the breathing zone were considerably higher than the room average levels when the occupants were seated, but when they walked around the room the personal particulate matter cloud dissipated because the room floor was clean and the room air became relatively well mixed by their movement. He noted that the spatial variability between what is measured in the breathing zone and room background is referred to as the “Pigpen effect,” after the Charles Schultz character in Peanuts.
Simplifying the Complexity
Nazaroff discussed several approaches for getting past the complexity. For size complexity, he suggested using PM2.5 mass concentration or some suitable proxy as the source of best information if the aim is practicality. For ultrafine particles (PM0.1), it is probably best to use number concentration, though this is an area of ongoing challenge, he said. For chemical
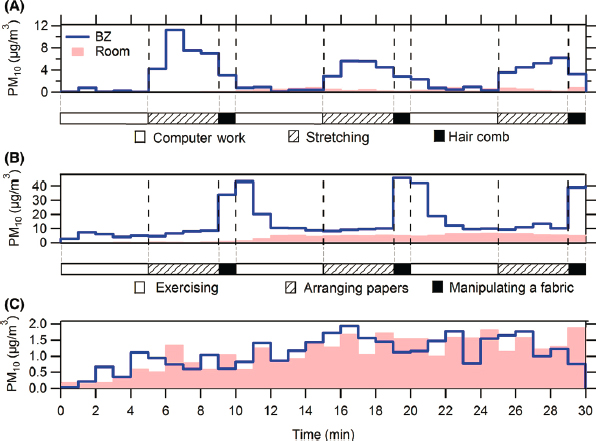
SOURCE: Nazaroff slide 11, from Licina et al. (2017) Figure 2; reprinted with permission from John Wiley and Sons, Inc.
complexity, he noted that the evidence to date does not implicate any compositional factors as a primary reason for adverse health consequences from particulate matter exposure. “I would say that from a practical orientation right now, if we aim to improve indoor environmental conditions, chemical complexity should be made secondary,” he said, adding that this is an active research area and that perspective could change with more information.
Addressing temporal complexity requires being mindful that measurements effectively represent conditions during occupancy and not misinterpreting time-averaged data to represent what occurs when people are present. In terms of spatial complexity, Nazaroff explained that personal monitoring is better than stationary monitoring, and that indoor data are better than outdoor data.
He cautioned that no instrument is capable of measuring every aspect of particulate matter. The key considerations when choosing a particular measurement method for the indoor environment include the particle size range and size resolution to be studied, if time-resolved versus time-integrated sampling is needed, whether chemical composition information is desired, and device cost, portability, and performance stability. Among the alternative measurement methods are
- light scattering, which is good for particle sizes ranging from 0.3 to 10 microns
- electrical mobility to produce size-resolved data for ultrafine particles
- condensation particle counters for measuring ultrafine particle number concentrations
- filter-based sampling, a standard method for time-integrated mass concentration and some chemical composition data.
He noted that practical constraints are different for personal monitoring compared to indoor air sampling.
Twelve Words to Improve Indoor Air Quality
Nazaroff spent the final portion of his presentation on ways to close the gap between what we know about improving indoor air quality and what we should do to achieve improvement. This is different, he clarified, from the gap between what we ought to know and what we do know, which is the subject of ongoing research.
His guideposts for improving indoor air quality come down to four ideas encapsulated in 12 words:
- minimize indoor emissions,
- keep it dry,
- ventilate well, and
- protect against outdoor pollution.
Minimizing indoor emissions is not new guidance. The biggest improvement in indoor air quality that has occurred in his lifetime is the massive reduction in exposure to environmental tobacco smoke resulting from a combination of actions, including public messaging and regulation. Cooking is another target that could be addressed with a range hood and its effective use, and personal emissions of infectious agents can be controlled with masking. Keeping the environment dry can avoid mold and related bioaerosol problems.
Ventilation is a complex issue that is hard to simplify. If the air exchange rate is too low indoor pollution sources will dominate, but if it is too high it will take too much energy and outdoor pollution sources such as wildfire smoke will dominate. “We need to find the Goldilocks solution here, which is to ventilate sufficiently but not excessively,” said Nazaroff, noting that research has yet to identify a solution.
For the final guidepost, protecting against outdoor pollution, filtration is one solution, and it can take two forms that Nazaroff called the closed and open paths. In a closed-path intervention, protecting occupants of an indoor space from outdoor pollution involves putting a filter in a mechanical supply air stream that would remove particles with some efficiency. If the intervention can avoid bypass and leakage, the goal would be to strive for the most efficient and practical device. This approach, however, does not protect occupants from indoor sources.
An open path intervention uses a recirculating air filter with a fan unit indoors, and efficiency is measured by the fraction of particles removed as the air passes through the filter. Nazaroff explained that it is possible that this control measure will both reduce exposure to outdoor originating particles and reduce the effect of emissions indoors on exposure, but it is an open path because both the outdoor particles and indoor particles can get to a susceptible individual without having passed through the filter. He also noted three possible performance metrics for indoor particulate matter filtration: efficiency, clean air delivery rate, and effectiveness. Efficiency is the fractional removal of particles, the clean air delivery rate combines efficiency with the flow rate through the device, and effectiveness refers to the extent to which the controlled condition is better than the uncontrolled condition.
When protecting against outdoor pollution, efficiency is the same as effectiveness for a closed-path intervention. The key to performance, then, is to make the fractional removal of particles as high as possible. With
the recirculating systems used in an open-path intervention, efficiency and effectiveness are not the same, and the goal should be to achieve a high clean air delivery rate compared to the removal rates that occur by other processes, explained Nazaroff. An important point here, he added, is that effective particle filtration can trade off higher flow rate for somewhat lower efficiency to obtain good effectiveness.
In closing, Nazaroff cited a quote attributed to Albert Einstein: “Everything should be made as simple as possible, but not simpler.” The intervention opportunities with the biggest potential to improve human health include a combination of resident and school environment improvements.
THE CHALLENGE OF MOVING FROM THE MEASUREMENT OF INDOOR PM2.5 TO EVALUATING OCCUPANT EXPOSURE
Kirsten Koehler began by presenting an environmental health paradigm developed some 30 years ago (Figure 6-5) (Sexton et al., 1992). It shows the trajectory of a contaminant released from some source and transported or transformed in the ambient environment (air, water, and/or land). Once it comes in contact with an individual, there is a potential for exposure, which can occur at the individual, community, or population level. Inside the body, a contaminant can lead to a dose, and ultimately to altered structure and function, and adverse health outcomes. Koehler clarified that for particulate matter, “dose” may not be the best measure of exposure because the relationship between exposure and dose is a strong function of particle size. “Dose is not as easy for biomarker indicators for particulate matter…

SOURCE: Koehler slide 2 (https://www.epa.gov/report-environment/human-exposure-and-health).
there is not some magic bullet we can measure in urine that tells us everything about particulate matter exposure,” she said.
For particulate matter, it can be useful to add more steps to the paradigm, such as transformation in the environment that leads to some distribution of air pollution exposures across a city. A person in that city would breathe a fraction of those particles, which would deposit in different regions of the respiratory tract, producing a dose and ultimately a health effect, said Koehler. In the United States, regulations control the emissions from some sources and industries, but many factors can affect the relationship between emissions and ambient concentrations, even close to sources.
Exposure, which can have many meanings, often refers in this case to a so-called “ecological estimate” in which exposure estimates for groups of people are based on some common location, activity, or source. This conceptualization of exposure is most useful, said Koehler, when assigning exposure estimates to large groups of people. For PM2.5 exposures, the data for these estimates might come from the widely distributed EPA Air Quality System database and be determined using information from the monitor nearest a group’s neighborhood. A low-cost sensor network could enable a more detailed mapping of PM2.5 concentrations and support interpolation across a city to the level of an individual’s home, but few cities have a suitable density of monitors to achieve that degree of resolution for all their residents.
Such monitoring is important, Koehler noted, as there can be large-scale changes in particle concentration and composition even close to a source such as a major roadway (Zhu et al., 2002). “We expect that there are large spatial gradients and concentrations, and this provides an opportunity to think more about how low-cost sensor networks could help us understand this variability,” said Koehler.
Personal Exposure Monitoring
Even a dense network of low-cost sensors would not yield information on all the important sources of indoor particulate matter or the various discrete exposures an individual experiences during the day. This is where personal monitoring comes into play. Koehler noted that by pairing personal monitor measurements with GPS data and air pollution measurements of high enough temporal resolution it would be possible to attribute exposures to the different microenvironments in which people spend time. There are a number of sensors on the market, she added, that can collect data at a per-second temporal resolution.
When conducting exposure assessments, it is important to consider whether an acute or chronic exposure is the more important factor in terms of health effects. Koehler said that the time between exposure and
the onset of a health outcome is another important consideration, and, because it is unlikely that researchers will ask people to carry air quality monitoring equipment with them for an entire year, it may be necessary to take an ecological approach to assessing the link between exposures and health outcomes.
To illustrate the type of data that personal exposure monitors can generate, Koehler described the results of a study in which she and her collaborators asked 44 healthy adults in Fort Collins, Colorado, to carry personal monitors with them for 8 nonconsecutive days (Figure 6-6). The results show the large variability from the lowest to highest cumulative exposures as well as the variable proportions of exposures from different microenvironments (Koehler et al., 2019). Cumulative exposures, she explained, reflect the fact that people do not spend the same amount of time in each microenvironment and that one microenvironment can make a large contribution to total exposure even if the time spent in it is brief. When she and her colleagues conducted a similar study, in which 50 asthmatic children in Baltimore carried a backpack with air sampling equipment for 4 consecutive days, they found that home exposures were higher than ambient exposures for some of the children.
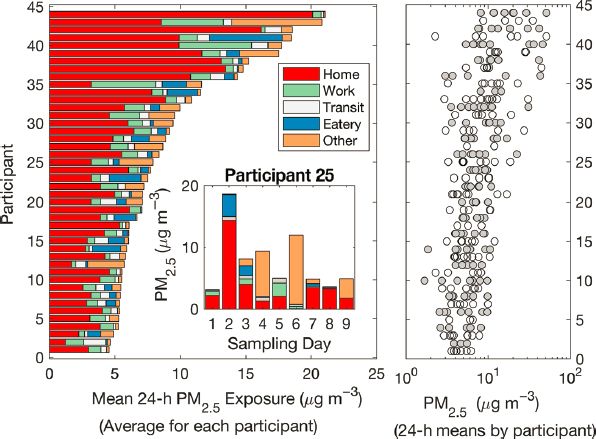
SOURCE: Koehler slide 13, from Koehler et al. (2019) Figure 3; reprinted with permission from John Wiley and Sons, Inc.
As other speakers noted, not all particle sizes penetrate to all regions of the respiratory tract. Close to 100 percent of particles smaller than 1 micron and 50 percent of 100 micron particles are able to penetrate into the respiratory tract. From there, only about half of 10 micron particles can make it into the thoracic region, and about half of the particles that are 4 microns or smaller can penetrate deep into the lungs. Koehler noted that not all the particles that deposit in the body stay there, however, depending on how far into the respiratory tract they go; a respirable cyclone sampler is a suitable device for making these measures. In fact, inhalable sampling and respirable samples are common in occupational environments, where PM10 and PM2.5 are measured for environmental exposures. Adding particle deposition in the airways and in the tracheobronchial and alveolar regions provides the total deposition as a function of particle size.
This analysis shows that almost all large particles and a large proportion of very small particles are deposited, but there is a clear minimum in the deposition of particles around 0.2 microns. Fortunately, said Koehler, this minimum overlaps with the common size distribution of a combustion aerosol, which means that a large proportion of those particles would be exhaled and not contribute to the dose.
To better understand what proportion of particles do stay in the respiratory tract, she and her colleagues developed a sampler that uses a piece of foam to serve as an inefficient filter—it captures only a fraction of particles that deposit in the respiratory tract (Koehler et al., 2009). It turns out that polyurethane foam has a similar open-cell, irregular structure as alveoli and, as Koehler explained, the mechanisms by which particles move and are lost through the different twists and turns of both systems are similar.
Her team tested this sampler in a cohort of stainless steel welders to assess exposures to nickel and chromium; exposure to these two metals is common among stainless steel welders, and both have important health consequences (Newton et al., 2021). Given their relatively short half-lives in the body, Koehler expected to see changes in dose over short-term changes in exposure. Urinary concentrations of chromium and nickel showed no association between the inhalable fraction of chromium and nickel and the urinary estimates of dose. However, examination of the lung-deposited fraction revealed a statistically significant association between the lung-deposited chromium or nickel and urinary biomarkers.
In closing, Koehler reiterated the complexity of extrapolating from particulate matter measurements to exposure, and the fact that exposure has different meanings according to where it is monitored and over what time frame. “For particulate matter, we might want to think carefully about the metric of exposure that we use…not just PM10 and PM2.5, but thinking more about lung deposit or ultrafine particles that deposit at higher fractions.”
THE UTILITY, USE, AND MISUSE OF LOW-COST CONSUMER INDOOR PARTICULATE MATTER SENSORS
There are a few important caveats in the field of low-cost, indoor particulate matter sensing, said Dusan Licina. The first is that this is a recent and rapidly growing field, with a majority of the published papers dating from the past 5 years. What this means, he said, is that what is relevant today might be outdated in just a few years. The second caveat is that more research is available on low-cost sensors used for outdoor particulate matter monitoring, and the result is that the type of monitoring networks established for outdoor air are not available for indoor particulate monitoring with low-cost sensors.
Licina then presented some definitions of terms he’d be using in his presentation:
- A reference instrument is associated with a federal reference or equivalent method, though many studies use laboratory-based instruments that are calibrated to function as a reference instrument.
- A monitor is an integrated device that comprises at least one sensor and other supporting components that create a fully functional air quality data collection system.
- A sensor is a subcomponent of a monitor that detects particles.
- A high-cost, laboratory-grade instrument typically costs between $3000 and $50,000.
- A low-cost monitor typically costs between $100 and $500, with a median price of around $200, and they mostly function as bulk particle detectors.
- A low-cost particulate matter sensor typically costs between $1 and $100.
Licina explained that there are different approaches to evaluating particulate matter sensors and monitors, and he noted that only about 10 percent of the published studies referred to a published protocol, such as the EPA’s air quality specifications (Morawska et al., 2018). “Researchers typically adopt their own protocol for assessment of sensors and monitors, and this unfortunately results in variable judgment criteria for ‘what do we consider to be good enough,’” he said. There is also great variability in methodology among research teams, including with regard to duration of testing, the environments in which they made their measures, the number of different technologies used, and the reference method they used. In addition, there is a range of factors to consider in terms of comparison with reference measurements, repeatability and reproducibility, limit of
detection, dependence on particle size and composition, and dependence on indoor climate.
Assessing the Performance of Low-Cost Sensors
Researchers have found a generally high correlation between low-cost sensor readings and reference measurements, though such sensors typically perform much better in a laboratory environment than in the field (Demanega et al., 2020). “In the field, these sensors can suffer significant response changes, which can be attributed to changing conditions for particle composition, particle size, but also dynamic variable factors such as indoor climate,” explained Licina. When comparing the use of these sensors in the laboratory versus a field setting, it is difficult to maintain a low particulate matter concentration over a long time in the laboratory, and the composition and concentration of a test aerosol in the lab may not be representative of aerosols in the study area. On the other hand, in the field it is necessary to account for variable particle composition, size, and changing environmental factors.
In terms of repeatability and reproducibility, most sensors demonstrate high intramodel consistency (Mukherjee et al., 2017; Zou et al., 2020), though these tests are usually performed in the lab, not in the field. Licina noted that repeatability and reproducibility could be influenced by the particulate matter concentration, range, source type, and drift. For example, the reproducibility for cigarette smoke is higher compared to Arizona test dust,1 and most sensors detect higher concentrations of organic than inorganic particulate matter at identical concentrations because of differences in the absorption and scattering properties of these two types of particulate matter.
Low-cost sensors can have use issues related to their limit of detection, and their performance at concentrations lower than 20 μg/m3 is often compromised (Holstius et al., 2014; Jayaratne et al., 2020; Jovašević-Stojanović et al., 2015; Kumar et al., 2015). Licina said it is important to calibrate sensors individually for each environment of intended use. His group in Switzerland, for example, has been field testing sensors in relatively pristine environments, where many of the sensors reported a value of zero for PM2.5 concentrations. At higher PM2.5 mass levels, low-cost sensors consistently report values that compare well to the reference value.
Environmental factors such as humidity and temperature also play a role in sensor output. Low-cost sensors, Licina explained, do not dry particles, unlike more traditional instruments, and this can compromise their
___________________
1 Arizona test dust is a standardized dust that is used in filter and environmental contaminant tests.
accuracy due to particle hygroscopicity. Studies have found that humidity matters more than air temperature for sensor performance, which may be compromised at 85 to 90 percent relative humidity (Wang et al., 2015). In addition, a particle’s composition can affect its hygroscopicity, so certain mixtures of aerosols could be more susceptible to relative humidity.
Suggestions for Stakeholders
Licina then provided a few suggestions for different stakeholders. For standards and guideline developers, he urged them to formulate guidelines for assessing short- and long-term performance sensors that everyone can use. He proposed that researchers standardize performance testing and allow comparisons between studies, and pretest and calibrate their sensors under the conditions in which the instruments will be used. For sellers and manufacturers, Licina’s view is that they should offer a selection of sensors and monitors that are precalibrated for various types of indoor and outdoor environments, and provide more transparency regarding their calibration algorithms. For nonexpert users, he suggested making friends with an air quality expert who has experience with these sensors and monitors.
He then touched on several deployment challenges and needs. Currently, no local building, health, or safety code requires continuous monitoring of indoor particulate matter. The US Green Building Council’s WELL Building Standard, a performance-based system for measuring, certifying, and monitoring features of the built environment that impact human health and wellbeing, does not require indoor monitoring of particulate matter, but it does offer an option to earn additional points on their rating system if one PM10 or PM2.5 sensor is in place for every 325 square meters of space, a figure that Licina characterized as arbitrary. The following research questions may provide the data to develop more accurate and more precise guidelines:
- What are the best ways to ensure long-term sensor performance in field environments?
- What is the optimal time resolution for low-cost particulate matter sensors?
- What is the optimal sensor placement and density to capture human exposures?
Challenges also arise from the fact that indoor aerosols are episodic in nature and that indoor spaces are frequently subject to strong spatial gradients that are typically associated with humans and their activities. As a result, every person is enveloped in their own unique cloud of PM2.5, and stationary indoor and outdoor monitors cannot capture that type of effect.
Solving that challenge will require developing portable, inexpensive, and robust continuous particulate matter sensors. This is a growing field, said Licina, and it will be important for improving the nexus between indoor spaces and exposures to particulate matter.
Other needs include developing low-cost sensors for ultrafine particulate matter, a challenge given that particles smaller than 0.3 microns do not scatter enough light and cannot be detected reliably using inexpensive optical methods. Licina noted that, depending on the source of particulate matter, low-cost PM2.5 sensors may in fact detect agglomerated ultrafine particles. He also raised the questions of whether low-cost sensors need to be as good as high-grade equipment and whether sensor data can serve as a new class of measurements rather than a proxy for traditional measurements. He believes that the answer to the first question is “probably not” and that they need to go through further refinement. The answer to the second question is “yes,” given that low-cost particulate matter sensors enable new types of observations that were not possible with traditional snapshot measurements.
Concluding his presentation, Licina noted that no currently available sensor is ideal for all applications, so it is necessary to find the optimal trade-off for the desired application. For indoor particulate matter management, low-cost PM2.5 sensors are probably good enough, except in instances that require precise and absolute quantification. Regarding research needs, he singled out the need for more long-term field validation studies, as well as studies to assess the suitability of new sensors and monitors for health-related studies. “Advancing knowledge in low-cost measurement techniques for indoor particulate matter increases the likelihood that future control interventions can be used both to prevent undesired health consequences and to promote beneficial health outcomes,” said Licina.
DISCUSSION
Moderator Elizabeth Matsui summarized her impression from the perspective of someone interested in the health effects of indoor particulate matter. This session, she said, highlighted opportunities to fill in information gaps identified in the day’s first session by, for example, using low-cost air quality monitors to generate or refine indoor exposure data.
Howard Kipen observed that Nazaroff’s presentation suggested that the chemistry of individual particles was of secondary concern when evaluating exposure impacts. Nazaroff responded that this is a judgment call and that reasonable people could disagree on that point. From his reading of the literature, his sense is that the physiologic response to particles is driven by the body sensing the particle as a foreign body and prompting an inflammatory and immune response. He wondered whether the chemical
content of the small amount of material inhaled is sufficient to trigger what toxicologists would see as a response to a poison. Matsui explained that allergens or microbial agents such as endotoxins, which can be components of PM2.5, can trigger adverse health effects through various immunologic and inflammatory pathways.
A workshop participant asked if there is value in using lung-deposited surface area as a metric for measuring ultrafine particles and comparing that with the foam sampler Koehler developed. Koehler thought that would be a useful comparison, but had not seen evidence that lung-deposited surface area is the “right” metric to use when trying to relate ultrafine particle exposures to health consequences. However, the devices used to make that measurement could prove useful for providing a better understanding of the spatial and temporal patterns in ultrafine particle deposition.
Rengie Chan asked the panelists to talk about the advances needed for low-cost particulate matter sensors to be ready for routine use in classrooms. Licina replied that some people in the field believe that the current crop of low-cost PM2.5 sensors are ready, given that when it comes to managing indoor levels it is not necessary to know the exact concentration. It is useful, however, to know if the air quality is better now than an hour or day ago. Manufacturers of these devices are not always striving for higher accuracy but rather the best trade-off between a number of different goals, he noted. Nazaroff agreed and echoed Licina’s idea of low-cost sensing providing a different category of data that would be useful for public messaging and public information. He would like to see research to identify the type of information that low-cost sensor networks can provide to help manage particulate matter levels in schools. “I do not think we are at the point yet where we can say we understand what these monitors can do such that we are ready to recommend to school districts that they buy a bunch of monitors and use them to help manage their indoor environmental air quality,” said Nazaroff.
The speakers were asked what they thought about the use of a benchmark strategy for an indoor environment as a guide for identifying what constitutes good indoor air quality. Nazaroff replied that the indoor landscape includes public and private spaces where individuals have varying degrees of control over their environment and make decisions based on their own interests and knowledge; in contrast, everyone shares the outdoor environment and researchers and regulators can work effectively and collectively toward a common good. The indoor space has a mixture of individual actors making decisions based on their own interests and also their own knowledge, perceptions, or beliefs. This plays into the question of how to rationally devise an overall program to address indoor environmental quality, something that has been up for discussion for decades with no collective action at the governmental level.
One possibility, he said, is to look at other types of intervention programs in the built environment that help ensure safety, to provide guidance for moving forward on steps such as requiring regular inspections to ensure that ventilation systems are working properly and that filters are appropriately replaced. He also suggested that certification programs, and posting that information in a prominent manner based on an inspection protocol, could raise public awareness and trigger public cooperation. Koehler agreed and added that until low-cost sensors are of sufficient accuracy to be a compliance tool, perhaps the best approach is to provide concrete guidelines and recommendations to individuals and building managers on ways to improve air quality.
Asked about the long-term performance of low-cost, consumer-grade sensors and monitors, Licina said that this needs to be assessed, although manufacturers are improving their products on such a short timeframe that such tests are often outdated by the time they are completed. Regarding a question about how to convert particle counts to mass, some low-cost sensors do not measure levels but instead use algorithms to generate mass estimates. This is an issue that the research community is considering, to help ensure that these devices can be calibrated and adjusted to measure particles of different size and composition.
In response to a question about particulate matter exposure on weekdays versus weekends, Koehler acknowledged that there probably are differences. She also addressed an inquiry about whether the high concentration of small particles in rural areas could be soluble organic aerosols from trees or forests instead of resuspended particulate matter from roads, agreeing that this could be the case but adding that “these measures are mass based and there is very little ability to distinguish between the different sources.”
A workshop observer asked the panelists to list approaches for identifying sources of particulate matter that have the most potent health effects, as a step to targeting those sources for control. Koehler replied that this is a difficult problem given the variety of potential sources and the data that Nazaroff showed regarding the short timescales over which particle concentration can significantly change. Nazaroff observed, though, that real-time monitoring, coupled with some combination of occupant diaries and real-time metadata measurement, does provide an opportunity to disentangle the contributors of indoor sources to indoor exposures without having to rely on chemical speciation of sources; this has been done to a limited extent and could be expanded to larger populations. The challenge, said Matsui, would be conducting those studies on a large enough scale, and Licina added that current technology struggles to characterize temporal, size-distribution, and compositional variability.
A final question from the audience asked the panelists to talk about the importance of measuring the ultrafine particle component of PM2.5. Koehler
replied that ultrafine particles represent an interesting exposure, but the sensors that differentially detect that fraction cost around $10,000 USD. For epidemiologic studies, this cost is prohibitive. Kipen added that ultrafine particles have proven to be a big challenge in the outdoor monitoring space because the numbers fluctuate very quickly, making it hard to use them to characterize an exposure. Their numbers vary more slowly indoors, so this may be less of a challenge in the indoor environment. Nazaroff pointed out that the building envelope does a good job of stopping ultrafine particles from infiltrating to the indoor environment and that indoor sources seem to dominate, which should make their assessment more feasible. Given the ways in which these particles can affect humans, he concluded that “ultrafine particles are another big world that is on the horizon in terms of public health concern.”


