
Chapter 2
Environmental Trends and Indicators
INTRODUCTION
Large-scale, long-term changes in hydrology, geomorphology, biogeochemistry, trophic status, and species range distributions have been occurring in the U.S. Gulf of Mexico (GoM) in response to both natural and anthropogenic forces. These forces are themselves impacted by system-wide stressors, such as the Deepwater Horizon (DWH) oil spill (see, e.g., Carl Kraft and Crandall, 2019; NRC, 2013), and the rate of change is accelerating due to climate change (see, e.g., Comeaux et al., 2012; Dee et al., 2019; Fujiwara et al., 2019; IPCC, 2021; Kemp et al., 2016; Moser et al., 2014).
Predominant natural influences in the GoM include temperate and tropical influences, ocean dynamics created by the Loop Current, hurricanes, subsidence, and freshwater influences that come primarily from the Mississippi River. These influences are all associated with and affected by a changing climate. The combined effects of these influences have created an ecologically varied and productive Large Marine Ecosystem (UNIDO, 2014). At 1.5 million km2 (Turner and Rabalais, 2019), the subtropical GoM is large enough to include a high diversity of habitats, from coral and oyster reefs and seagrass to sawgrass. GoM estuaries make up nearly 42 percent of continental U.S. estuarine areas (excluding Alaska) (EPA, 1999) and are nurseries to vast numbers of commercially and recreationally important fish, crab, and shrimp, with functional food webs that support them.
In its Statement of Task (see Box 1.1 in Chapter 1), the committee was asked to “examine the cumulative effects of multiple restoration projects (e.g., regional-scale benefits or improvement in ecosystem function) within the context of long-term environmental trends.” In this chapter, the committee focuses on the latter part of this charge. The chapter first defines several terms used throughout the report (drivers, pressures, stressors, and indicators) (see Box 2.1). It then summarizes the current understanding of indicators that would be needed to assess cumulative effects of multiple restoration efforts relative to background trends, identifies spatial and temporal gaps in existing data collection and interpretation, and discusses the need for robust environmental data to assess critical background environmental trends that impact restoration efforts.
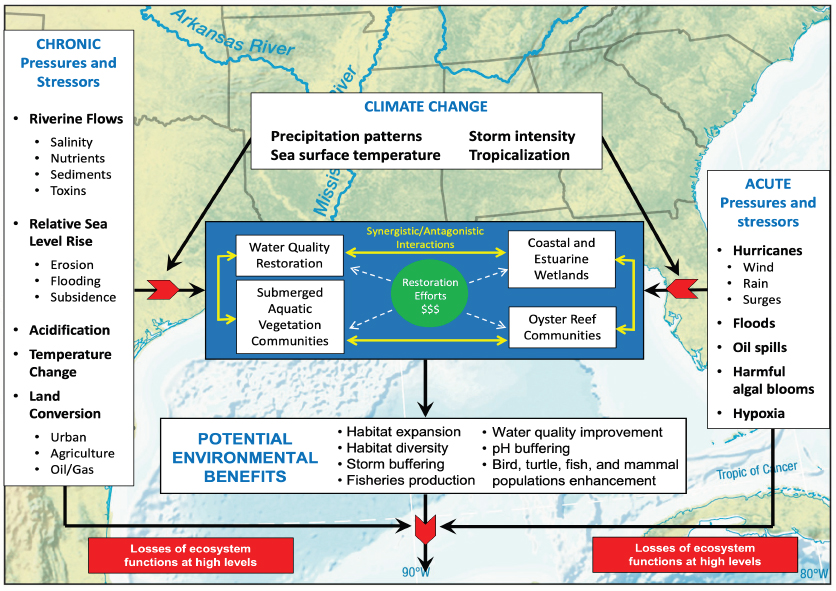
The committee identified long-term trends and indicators that are grounded in science and can provide decision makers and restoration practitioners with useful insight in assessing opportunities for positive cumulative effects of multiple restoration actions, recognizing that these trends differ across the Gulf region—in terms of which trends are driving change and to what extent. The committee also developed a conceptual diagram to help visualize the effects of these long-term trends, as well as acute and chronic pressures and stressors, on restoration efforts in the GoM (see Figure 2.1). These trends and indicators provide important information about ecological processes that occur across multiple disciplines, at regional or Gulf-wide scales, and across political boundaries. Collecting, analyzing, synthesizing, and reporting robust long-term environmental data are critical components necessary for assessing cumulative effects of multiple restoration projects (Beck et al., 2019; Carl Kraft and Crandall, 2019; Schiff et al., 2016).
Indicators are organized into two broadly defined categories: those that reflect the status of background drivers, pressures, or stressors (e.g., climate change, riverine inflows, land cover, oil spills), and those that are indicators of specific value to the assessment of progress toward regional-scale environmental benefits and improved ecosystem function (e.g., coastal and estuarine habitats; fisheries, birds, turtles, and mammals; water quality).
CLIMATE CHANGE INFLUENCES ON LONG-TERM ENVIRONMENTAL CHANGE
Changing climate is a major factor driving change in the GoM. The committee focused on both natural and human-induced climate change effects on GoM coastal environments, including relative sea level rise, tropical storms and hurricanes, sea surface temperature, ocean acidification, and tropicalization. Some of these drivers or pressures, like relative sea level rise, can reflect both natural and anthropogenic forces. Considering the impacts of climate change at the restoration program scale can be particularly challenging due to nonstationarity—the concept that what was once considered a normal time series is not normal or stable any longer. Taking nonstationarity into account when planning restoration projects and programs can improve the likelihood of successful outcomes, even as ecological processes and conditions become less stable over time (Rollinson et al., 2021).
Relative Sea Level Rise
Relative sea level rise (RSLR) is the combination of global sea level rise (GSLR) (e.g., from reduced glacial ice volume and the thermal expansion of water) and the changes in an area’s land surface elevation, such as subsidence (see, e.g., Sweet et al., 2018). These two drivers function differently in different parts of the GoM—GSLR is generally the dominant factor in Florida, Alabama, and Mississippi, while subsidence is a more important factor in Louisiana and much of Texas.1
As a result of increases in oceanic thermal expansion, along with ice loss from the Antarctic and Greenland glaciers and ice sheets, the rate of GSLR increased from 1.7 mm/yr in the 20th century to 3.1 mm/yr in the early 21st century (Argus et al., 2018). Concurrently, the World Climate Research Programme produced an averaged global mean sea level rise estimate of 3.35 mm/yr (WCRP Global Sea Level Budget Group, 2018). More recently, the Intergovernmental Panel on Climate Change (IPCC) found that GSLR averaged 3.7 [3.2 to 4.2] mm/yr between 2006 and 2018 (IPCC, 2021). While the current rates of GSLR are somewhat lower in the GoM, it cannot be assumed that this is a permanent trend.2
___________________
1 Information from Torbjörn Törnqvist, Tulane University (September 29, 2020).
2 Information from Torbjörn Törnqvist, Tulane University (September 29, 2020).
In comparison with GSLR, subsidence has significant spatial and temporal variation, presents challenges for accuracy and precision of measurement, and will therefore need additional monitoring to assess and predict regional and local impacts (Cahoon et al., 2020; Lane et al., 2006; NASEM, 2018a; Nolte et al., 2013; Russell et al., 2022). This is due to the multiple factors that can result in subsidence, as well the temporal and spatial scales on which these factors operate. Subsidence is caused by the interactions of at least six factors: tectonics, Holocene sediment compaction, sediment loading, glacial isostatic adjustment, anthropogenic fluid adjustment, and surface water drainage and management. Estimates for subsidence rates from these factors range from 0.6 to 2.0 mm/yr for glacial isostatic adjustment, which occurs across the Gulf, to as high as 23 mm/yr for anthropogenic fluid withdrawal, which is focused in areas of hydrocarbon production (Yuill et al., 2009).
The relative significance of these factors depends partially on the general characteristics of GoM geomorphology, geology, and ecology (summarized in NASEM, 2018a). For example, Florida is mostly built on a geologically inactive substrate, which results in hard-bottom reef and seagrass habitats with sandy barriers and spits and less than 1 mm/yr of subsidence. In contrast, Louisiana and northeastern Texas have a mud substrate with a variable sand veneer. There are extensive areas of coastal wetlands and marsh, many of which are subsiding and converting to open water, and subsidence can be greater than 20 mm/yr in various locations (NASEM, 2018a).
RSLR is generally estimated through the use of tide gages. Particularly common is the use of a subset of National Oceanic and Atmospheric Administration (NOAA) tide gages that have periods of record of more than 30 years and in some cases up to 50 years.3 There are only nine sites along the GoM coast that meet these criteria.4 While there are many other tide gages on the GoM coast, most have short or incomplete records that make them currently unsuitable for measuring RSLR (NASEM, 2018a).
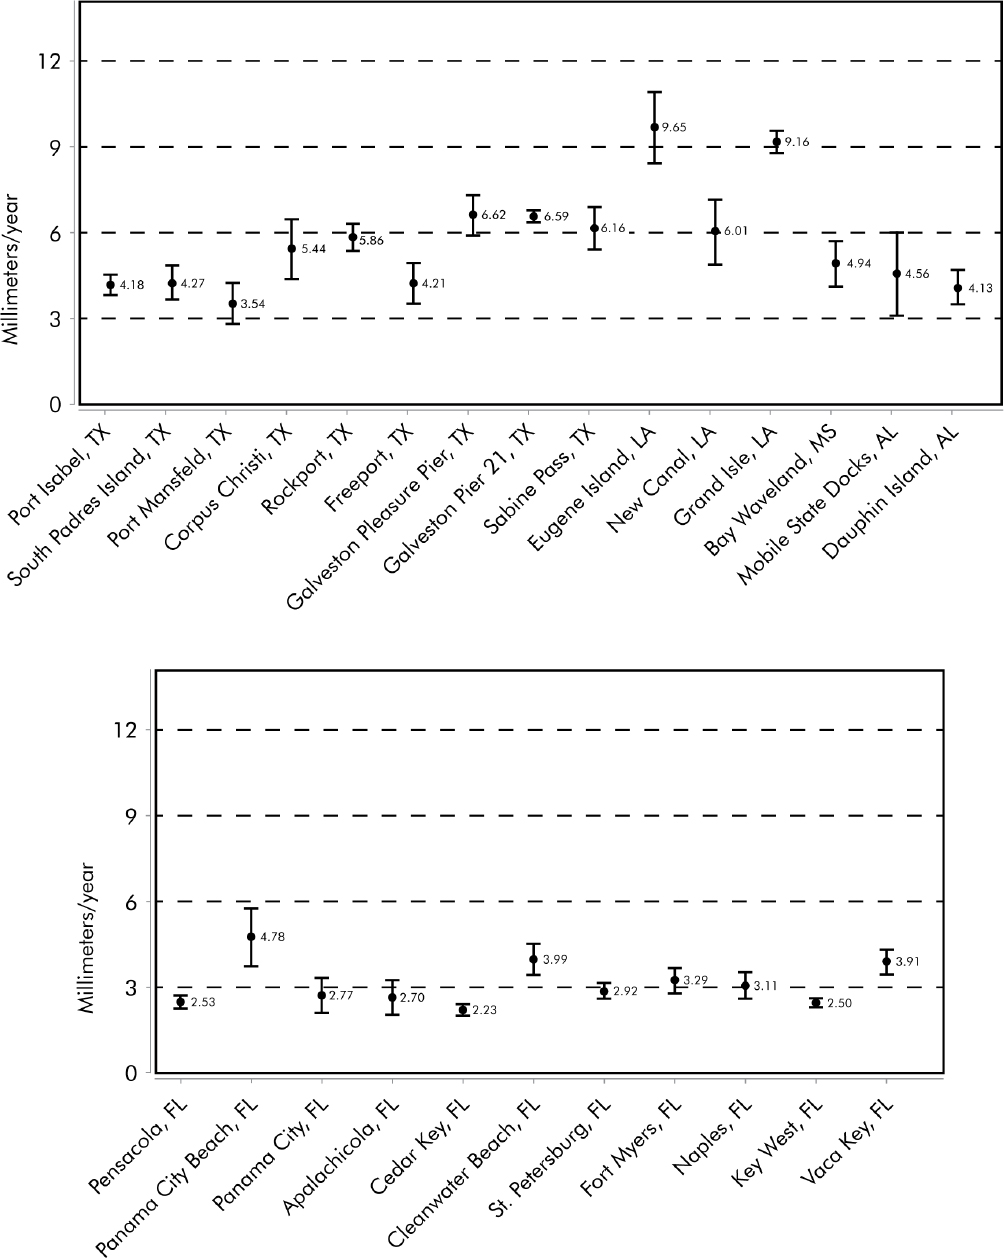
Tide gage measurements from different parts of the GoM can provide insight into regional or local water level trends. For example, in addition to the use of NOAA gages, there have been efforts by the U.S. Army Corps of Engineers (USACE) to document, provide quality control, and publish records from over 30 local tide gages in Louisiana (Veatch, 2017). The USACE analysis of these gages suggests that while the long-term Louisiana NOAA gage at Grand Isle records one of the highest rates of RSLR in the United States (9.16 mm/yr)—see Figure 2.2—the limited NOAA tide gage coverage may fail to identify some of the most problematic areas. Two USACE gages at the mouth of the Mississippi River (Southwest Pass at East Jetty and South Pass at Port Eads) have 50-year subsidence estimates of greater than 22 mm/year, a measure that has implications for marsh persistence, the long-term viability of towns near the mouth of the river, and even the navigation of the lower Mississippi River. In spite of these extreme values, research suggests that tide gages in Louisiana systematically underestimate subsidence (Keogh and Törnqvist, 2019), especially shallow subsidence in low-elevation coastal areas.
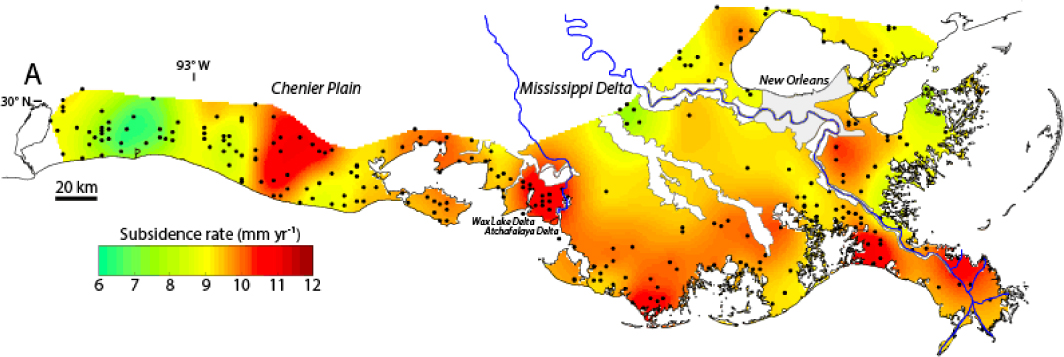
By using an alternative approach that directly measures shallow subsidence using rod surface-elevation table-marker horizons, deep subsidence using the global navigation satellite system stations, and sea level rise from satellite altimetry, Nienhuis et al. (2017) created a new subsidence map of Louisiana (see Figure 2.3). Rates of subsidence using this methodology are typically substantially greater than those inferred from tide gage data. The high rates of subsidence along the Louisiana and northeast Texas coasts are expected to continue to constitute most of the RSLR in these areas over the next 50 years (Boesch, 2020).
Elsewhere in the GoM, GSLR will play a somewhat less drastic but still significant role in future decades (Argus et al., 2018). As noted by Törnqvist et al. (2020), long-term trends in RSLR have to be factored into all present and future wetland restoration projects in the GoM. Maintenance of coastal marshes depends on an equilibrium between RSLR and the vertical accretion of organic material through primary productivity of marsh plants and organic matter from elsewhere in the system (e.g., Bianchette et al., 2016; Glick et al., 2013; Nyman et al., 2006; Van de Broek et al., 2018) and sediment deposition from settling processes, including marsh plants trapping sediment (e.g., Fagherazzi et al., 2013). Marsh progradation, erosion, and
___________________
3 See https://tidesandcurrents.noaa.gov/sltrends/sltrends.html.
4 See https://tidesandcurrents.noaa.gov/sltrends/regionalcomparison.html?region=USTG.
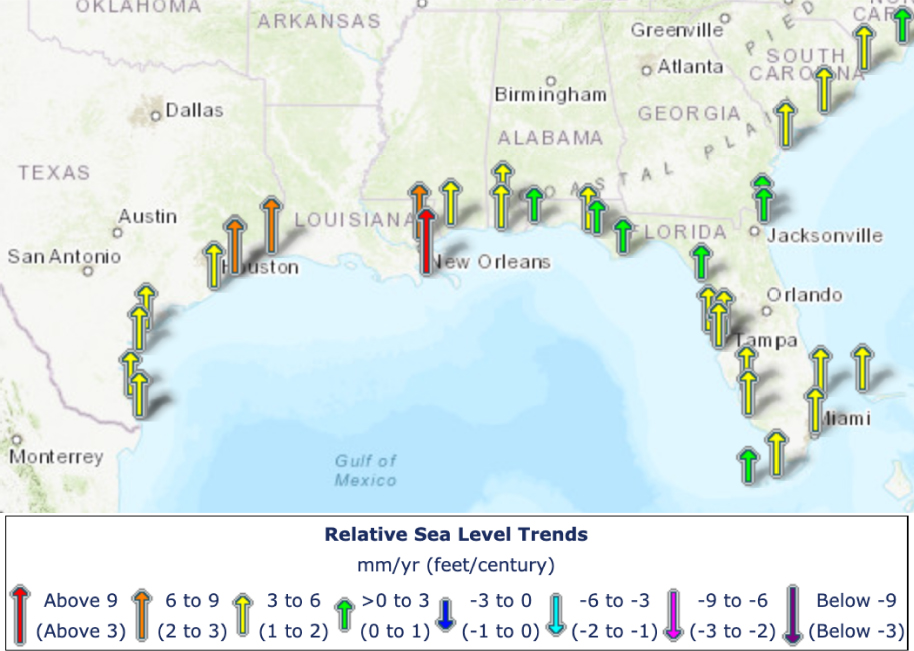
collapse are also important processes in microtidal environments (Ganju et al., 2017). The 2017 Louisiana State Master Plan utilized a “marsh collapse value” of 7 mm of RSLR/year and showed that for marshes in Louisiana to survive at rates beyond this, sediment replenishment would be necessary (White et al., 2019b). Others posit that if RSLR is greater than 3 mm/yr, marsh drowning occurs within a few centuries, and if relative sea level rise exceeds 6–9 mm/yr, Louisiana marsh conversion into open water could happen within a 50-year timeframe (Jankowski et al., 2017; Törnqvist et al., 2020). Many locations within Louisiana and Texas are at the 6–9 mm/yr5 rate (Figure 2.2), which has serious implications for the viability of restoration projects within the western GoM when considering the future of wetland restoration projects. Although subsidence is not as prevalent in states like Florida, Alabama, and Mississippi, the 3 mm/yr threshold has also been reached in many locations in those states.6
Subsidence is the principal stressor causing RSLR in Louisiana and the northern Texas coast. RSLR rates in this region are among the highest in the nation. Long-term trends in other areas in the GoM also show an increase in RSLR, a trend that is expected to continue.
The current rate of RSLR is already considered a major stressor on the decline of marsh area and resilience. There are areas in the GoM where marsh plant growth and organic matter accumulation cannot keep up with RSLR rates without additional inputs of sediment, resulting in marsh collapse. This is a critical issue in environmental restoration planning.
___________________
5 See https://tidesandcurrents.noaa.gov/sltrends/regionalcomparison.html?region=USTG.
6 See https://tidesandcurrents.noaa.gov/sltrends/regionalcomparison.html?region=USTG.
Tropical Storms and Hurricanes
Hurricanes and tropical storms not only endanger human life and infrastructure, but also dramatically reshape or change physical landscapes and coastal ecosystems, creating hot moments of substantial change (discussed in Chapter 3). Thus, hurricanes are critical to consider when assessing restoration success and determining potential cumulative effects. Prior studies have developed empirical relationships between sea surface temperatures (SST) and the maximum potential intensification rate of tropical cyclones (DeMaria and Kaplan, 1994; Whitney and Hobgood, 1997; Xu et al., 2016; Zeng et al., 2007), leading to heightened concern of the effect of future hurricanes on the GoM coast. However, the current understanding of the situation is somewhat more complicated (Berardelli, 2019). One of the difficulties is that satellite-derived intensity data has only been collected since the early 1980s and therefore only span about four decades; this relatively short period of record makes it difficult to distinguish clearly between trends because of anthropogenic climate change and natural trends that occur on decadal to multidecadal time scales (Ramsay, 2017).
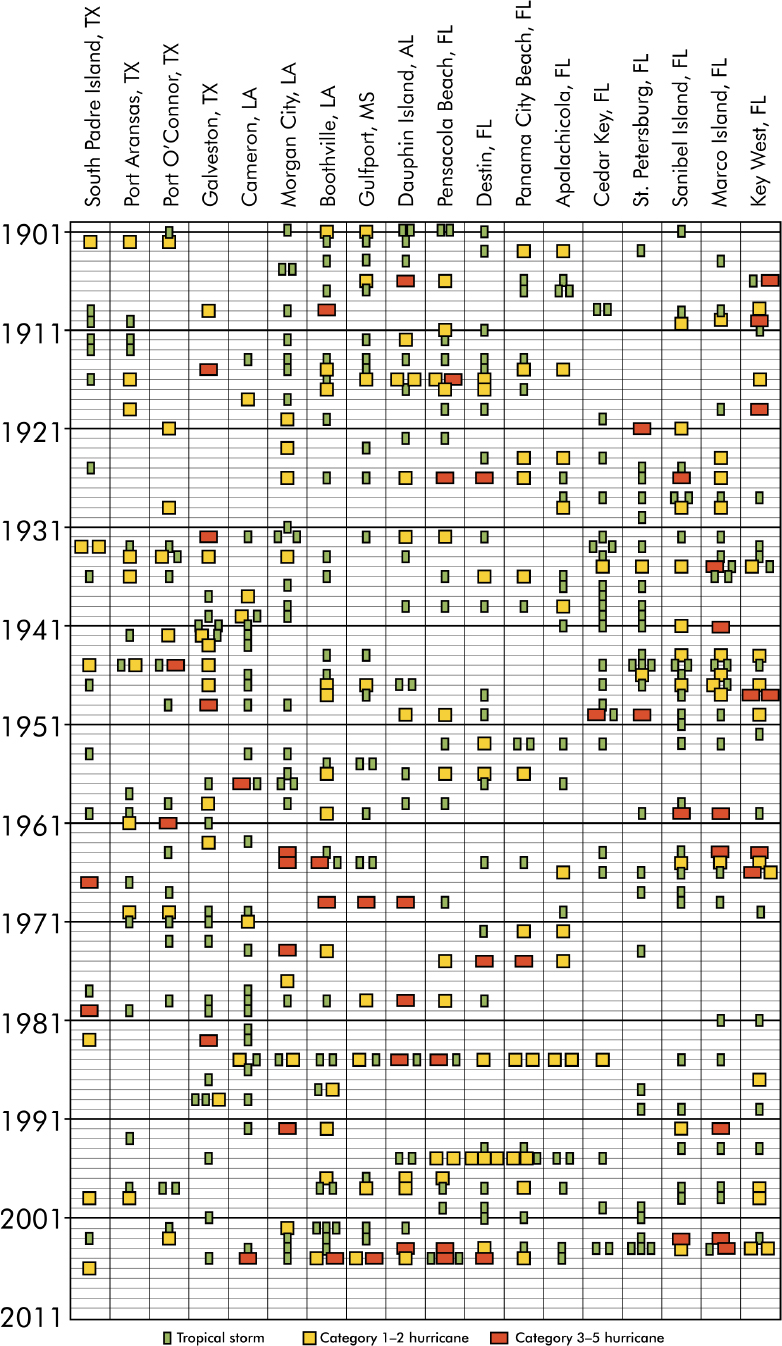
Since 1985, hurricane frequency has remained consistent, with an average of about 80 tropical cyclones forming globally each year (Ramsay, 2017). Holland and Bruyère (2014) found “no anthropogenic signal in annual global tropical cyclone or hurricane frequencies” (p. 617). However, they did find a strong signal in the proportion of both weaker and stronger hurricanes. Category 4 and 5 hurricanes have increased at a rate of about 25–30 percent per °C of global warming, and the proportion of Category 1 and 2 storms have decreased a similar amount (Holland and Bruyère, 2014). The increased frequency of stronger hurricanes means that the intensity of the “common hurricane” has become stronger. Tropical storms and hurricane strikes also vary over time and space. Temporally, periods of hyperactivity were seen in south Florida from the 1920s through the 1950s and then again in the 2000s (Figure 2.4) (Keim et al., 2007). According to Landsea et al. (2010), century-scale analysis of SST and hurricane frequency is needed to establish the decade-to-decade shift in hurricane frequency and intensification trends due to climate change.
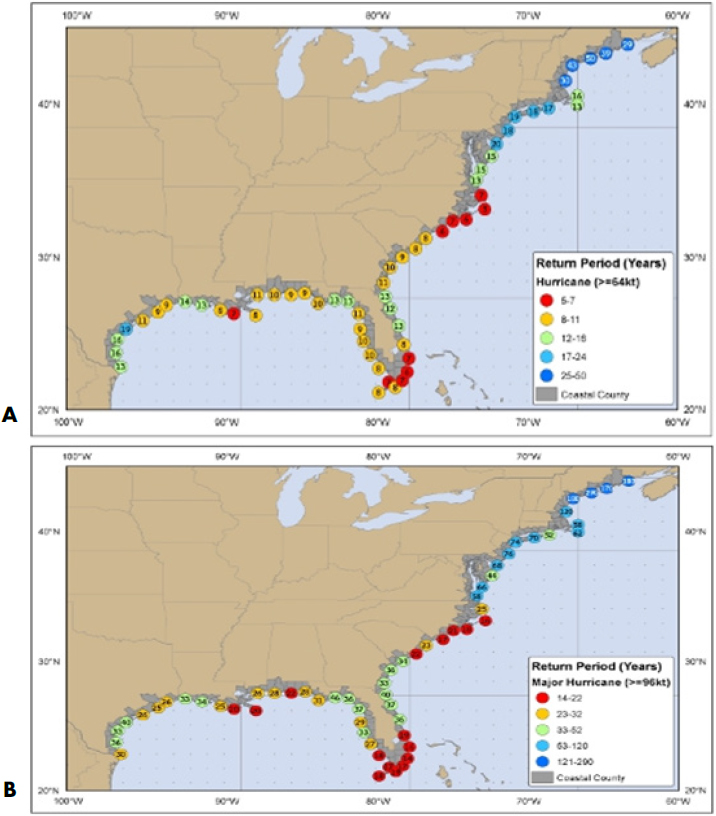
The effects of hurricanes and tropical storms do not uniformly affect the GoM; the southern part of Florida and the north-central Gulf are disproportionately affected by both (Figure 2.5). When planning restoration projects, practitioners need to be aware of the timespan for developing resilience of their projects to hurricane conditions, a critical consideration in areas where the return period is between 5 and 7 years for a hurricane and 14 and 22 years for a major hurricane landfall.7
___________________
Hurricanes can also destroy monitoring equipment, creating data gaps and hampering the ability to measure the effects of restoration efforts. For example, Hurricanes Katrina and Rita hit in 2005, the year that the initial Coastwide Restoration Monitoring System in Louisiana was being constructed. Many stations were destroyed, causing the system to have to be reestablished in 2006 and 2007.8
Needham and Keim (2012) provide a comprehensive overview of storm surges from tropical storms and hurricanes in the GoM. Storm surges have dramatic effects on coastal environments, damaging habitat, destroying forests and crops, inundating the coastline with saltwater, and moving and cutting channels through barrier islands. These effects are also not uniformly distributed across the GoM. In addition to hurricane strikes, coastal geomorphology, water depth, and man-made features such as levees can all influence storm surge. Texas, Louisiana, and Mississippi coasts tend to have the greatest depths of storm surge, with both the first and second greatest storm surge depth ever measured (8.47 and 7.5 m) occurring in Pass Christian, Mississippi (Needham and Keim, 2012). Knowledge of the depth and probability of storm surge is critical to ecosystem restoration planning. Some restoration projects are also designed with the idea that the presence of wetland and coastal features will serve to minimize the effects of storm surge. A meta-analysis of coastal marshes conducted by Shepard et al. (2011) concluded that marshes beneficially attenuate waves from storm surges and provide shoreline stabilization across a range of different environments. According to Wamsley et al. (2010), the magnitude of the attenuation is dependent on the surrounding coastal landscape and the strength and duration of the storm forcing, with some coastal/wetland configurations actually increasing surge.
___________________
8 Information from Gregory Steyer, U.S. Geological Survey, personal communication, October 11, 2021.
Hurricanes can have far reaching impacts on restoration efforts, particularly wetland restoration projects. For example, at a site in Barataria Bay, Louisiana, Sapkota and White (2019) documented average marsh erosion of 0.35 cm/day between 2015 and 2019. Based on measurements taken immediately following Hurricane Laura in 2020, these same marshes eroded at 22 cm/day during the storm, a rate 63 times faster than the 4-year period immediately prior (Gibbens, 2020). The effect of acute events like hurricanes on coastal ecosystems can cause large-scale disruption of the system (Conner et al., 1989; D’Sa et al., 2011; Mo et al., 2020; Reja et al., 2017) and potentially impact restoration efforts.
Morton and Barras (2011) suggest that 25–35 percent of all wetland loss in Louisiana since the 1940s was due to direct and indirect storm-induced losses. These damages range from winds and waves physically stripping the vegetation from the marsh, to storm surges bringing saltwater into freshwater wetland areas, resulting in salt-induced diebacks. Conversely, there have been several accounts of hurricanes bringing sediment and nutrients into wetland systems through freshwater influx, providing benefits to the surviving wetlands (Castañeda-Moya et al., 2020; Nyman et al., 1995b; Turner et al., 2006, Box 2.2).
Hurricanes are becoming more intense and destructive in the GoM, a trend that is expected to continue. Wind and wave energy; storm surge; and freshwater, sediment, and nutrient inflows associated with storm-related rainfall have potential to significantly disrupt coastal ecosystems and restoration efforts.
Sea Surface Temperature
Like much of the global ocean, the GoM is experiencing rising sea surface temperatures (Figure 2.6), although rates of increase in the GoM are less than in many other regions (Huang et al., 2015). Using monthly offshore SST calculated from satellite data, Karnauskas et al. (2017) found that SST has gradually increased in the GoM since the early 1980s and that the western GoM has warmed more rapidly than the eastern Gulf. Changes in GoM SST are generally driven by anthropogenic climate change (e.g., Gil-Agudelo et al., 2020) as well as climate variations. The Atlantic Multidecadal Oscillation state has been shown to affect several elements of the GoM physical system, including ocean currents, freshwater inflows, and SST (Karnauskas et al., 2017). SST can also be affected by episodic factors, including weather fronts (e.g., Wang et al., 2020b). Rising SST can increase coastal hypoxia (areas of low dissolved oxygen) by decreasing oxygen solubility in the water column as well as by contributing to stratification (Altieri and Gedan, 2014; discussed further in a later section).
Sea surface temperatures in the GoM have gradually increased since the 1980s. Annual average SST is as much as 2° F higher than the historical mean SST. Increased water temperature may affect fisheries restoration efforts, and hypoxia and stratification in coastal waters, resulting from increasing temperatures, could impact restoration efforts for living resources.
Temperature and Precipitation Patterns
The IPCC Sixth Assessment Report estimated that global surface temperatures were 1.09 oC higher during the last decade (2011–2020) compared with the historical past (IPCC, 2021). The temperature increases were even higher over land than over oceans and primarily driven by further warming of the atmosphere. These warming trends are significant everywhere, including in the GoM. There are many physical manifestations of these increasing temperature trends, from observed temperature extremes to the duration of heatwave days during summer, from longer summers to warmer nights and frequent flash droughts, and from record freezing temperatures in winter to sudden cold snaps (Biasutti et al., 2012). The mostly human-induced warming trends will result in extreme variability in precipitation patterns (IPCC, 2021), which would result in fluctuations in freshwater flow to GoM coastal ecosystems.
BOX 2.2
Acute and Chronic Environmental Events in the GoM: A Hurricane Case Study
Climate change controls both the magnitude and frequency of acute environmental events, and in some cases, they are turning into chronic events (USGCRP, 2017). As an example, hurricanes in the GoM are considered acute environmental disturbances that adversely impact coastal habitats. However, increases in the number of high-intensity hurricanes in the last few decades due to climate change has turned them into a chronic series of events, causing irreversible change to some ecosystems (USGCRP, 2017). Further, as concluded in the Intergovernmental Panel on Climate Change’s (IPCC’s) recently released Sixth Assessment Report, frequency of tropical cyclones and hurricanes will increase in future El Ni o years (IPCC, 2021).
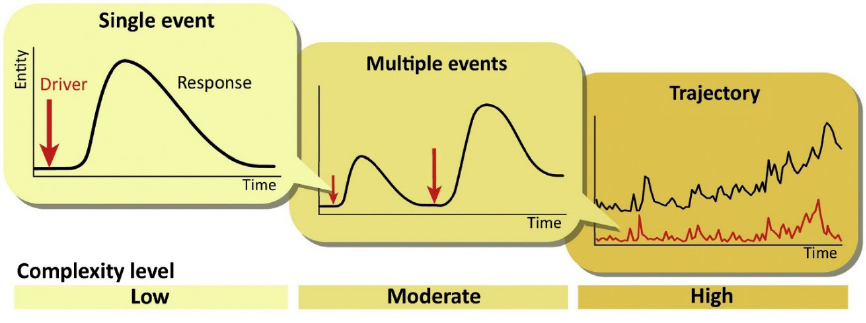
A similar argument can be made for droughts, which alter estuarine water quality and wetland productivity. One of the positive effects of the high frequency of these acute events is that it can reverse the course of existing chronic trends at a site by temporarily alleviating them. For example, a wetland site suffering from a chronic lack of freshwater can be temporarily altered due to the impact of a hurricane producing massive freshwater runoff to the wetlands. However, high frequencies of these acute events can create irreversible damage, hampering the resiliency of the ecosystem. The decline in ecosystem functions and resiliency can result in either a state change (a complete change in the ecosystem type), or an alternate stable state (the ecosystem will continue to oscillate between a number of possible locally stable configurations) (Beisner et al., 2003). Ryo et al. (2019) demonstrated the concept in the following figure.
As an example, because of climate change, hurricanes are becoming stronger in the U.S. Gulf Coast (Holland and Bruyere, 2014). The 2020 hurricane season was one of the worst on record, with several severe storms that hit the southeast Atlantic coast. The wind and wave energy associated with these storms can produce severe damage, su√Ωch as defoliation in the mangrove ecosystem. However, a study by Casta eda-Moya et al. (2020) showed that hurricanes can be natural fertilizing events that contribute a significant proportion of phosphorus to the nutrient-limited mangrove soil. Their study revealed that Hurricane Irma supplied as much as 49–98 percent of the annual phosphorus to the Everglades mangrove’s soil nutrient pool. Vertical soil accretion in that event alone was 6.7 to 14.4 times more than the past 100-year annual accretion rate. It shows that one hurricane can episodically supply nutrients and freshwater that compensates for the structural damage to the vegetation canopy and, in the long term, will enhance gross primary production of the ecosystem. But if the annual frequency of these hurricanes increases (as seen in the last decade), the compounding effect may no longer allow the ecosystem to bounce back from its structural damage, ultimately causing an irreversible loss in net and gross primary production and habitat shrinkage due to erosion.
Biasutti et al. (2012) provided a comprehensive summary of GoM climate trends and projections. According to their study, “In the Gulf, a typical winter in the last decades of this century will be as warm as the warmest winter ever recorded, and the coolest summers will be as hot or hotter than any summer in the last century; in 95 percent of the years, summer temperatures will be unprecedented” (Biasutti et al., 2012, p. 827-828). Seasonal mean precipitation will experience a modest change in magnitude, but not in the frequency distribution. However, the driest seasons will be extraordinarily dry, leading to flash droughts and extreme variability in soil moisture conditions.
These extreme fluctuations in temperature and precipitation patterns will have a significant impact on GoM wetland ecological functions and biophysical status (Comeaux et al., 2012; Osland et al., 2017a). Alterations in precipitation-induced freshwater flow will alter nutrient and sediment supply to the Gulf Coast estuaries (Kemp et al., 2016; McCarthy et al., 2018a). Temperature fluctuations and longer summer seasons will affect salt marsh biomass and productivity patterns, since both are strongly coupled (Feher et al., 2017).
Air temperatures have increased and precipitation patterns have shown extreme fluctuations in recent decades, and both are projected to become more extreme over time, with many associated effects. Restoration efforts may be impacted, as increased air temperature will affect marsh plant productivity and biomass, and changes in freshwater flows will alter nutrient and sediment supply delivery patterns to marshes and estuaries.
Coastal Ocean Acidification
Rising atmospheric carbon dioxide (CO2) levels due to anthropogenic activities and the ability of the ocean to partially absorb this CO2 increase has led to alterations in the chemistry of seawater, including decreasing pH (Doney et al., 2020). In coastal systems, the amplitude of variability in the carbonate system (including pH) is generally much greater than in the open ocean (Carstensen and Duarte, 2019). This phenomenon is driven by several interacting factors, most notably land-based inputs of nutrients, organic matter, and freshwater. Nutrient input leads to increased primary production and in turn, pH, while the decomposition of this newly produced or land-derived organic matter by heterotrophs leads to increased acidification (e.g., Cai et al., 2011; Gilbert et al., 2010). Freshwater contributes to decreasing pH because it lowers the alkalinity (buffering capacity) of seawater. Each of these factors is in varying degrees controllable
by management strategies. In the northern GoM in particular, eutrophication-induced acidification due to decomposition processes is likely widespread, given the common occurrence of seasonal hypoxia both on the GoM shelf and within its estuaries (e.g., Laurent et al., 2017; Wang et al., 2020a).
Ecological effects of ocean acidification are many and include impacts from species level (e.g., metabolic and developmental effects) to community level (e.g., phytoplankton species composition) to ecosystem scale (e.g., coral reef health, pelagic food webs). Understanding the nuances of these effects is an area of active research, especially in the context of multiple stressors (e.g., acidification plus warming) (Doney et al., 2020, and references therein). Acidifying seawater has been shown to affect the formation of calcium carbonate shells and skeletons in a range of organisms, including reef-building corals and commercially important mollusks such as oysters and mussels (Doney et al., 2020). In addition, ocean acidification can affect fish metabolism (e.g., Heuer and Grosell, 2014) and behavior (e.g., Leduc et al., 2013), with potential implications for fisheries. Some organisms, however, have demonstrated the capacity to adapt to a more acidified environment (e.g., Engström-Öst et al., 2019). Some ecosystems have also shown the potential for adaptation; for example, seagrass ecosystems can modify pH within their canopy, potentially offsetting acidification effects on their associated communities (e.g., Bergstrom et al., 2019; Hendriks et al., 2014).
Monitoring of coastal acidification is also increasing. NOAA’s Ocean Acidification Program has funded deployments of pCO2 (partial pressure of carbon dioxide) and pH sensors at a limited number of locations in the northern GoM since 2009. And since 2002, NOAA has also collected underway sea surface pCO2 data on some ships of opportunity, including cruise liners (Gledhill et al., 2008) and NOAA fishery survey vessels, which have been incorporated into the global Surface Ocean CO2 Atlas database (Bakker et al., 2016). However, especially in the southern GoM, many coastal and estuarine areas and subsurface waters currently have few or no measurements.
A recent study based on the Surface Ocean CO2 Atlas revealed that sea surface pCO2 trends are higher in the northwestern GoM and the West Florida Shelf but lower in the central GoM compared with the extent of pCO2 increase due to air CO2 uptake (Kealoha et al., 2020). Subsurface waters in the northwestern GoM are acidifying at a rate greater than the global surface ocean rate, with the majority (59–70 percent) of the acidification being respiration driven (Hu et al., 2018). Multidecadal acidification has also been reported for a majority of the Texas and Florida estuaries, based on state agency–collected data (Hu et al., 2015; Robbins and Lisle, 2017).
Although data are scarce or lacking for many coastal and estuarine areas, recent observations indicate that acidification has been occurring in many Texas and Florida estuaries and that subsurface waters in the northwestern GoM are acidifying at a rate greater than the global rate. Increased acidification affects the formation of calcium carbonate shells and skeletons in corals and mollusks, potentially impacting the long-term success of oyster reef restoration and coral reef recovery.
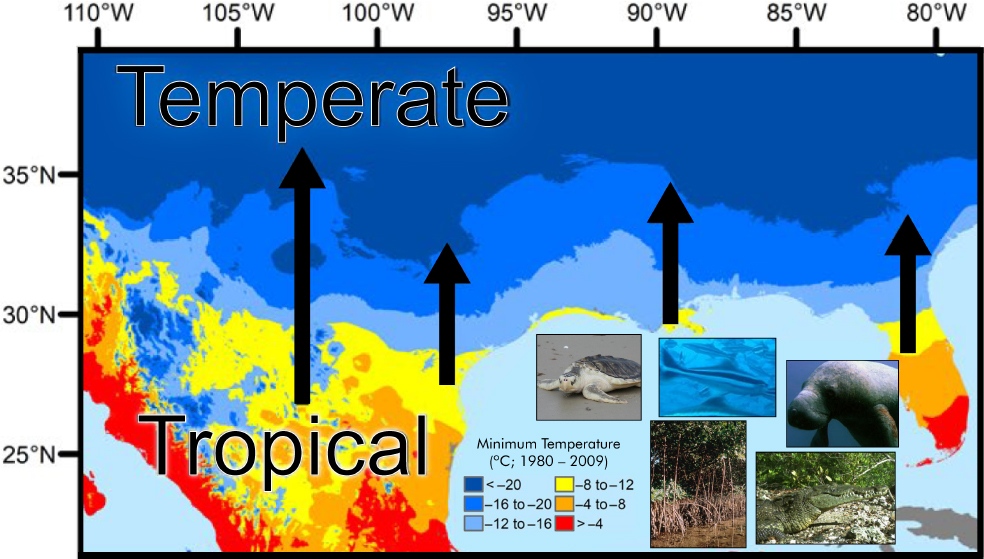
Tropicalization
Climate-driven changes in species composition and the novel ecological interactions that follow them are occurring throughout the world. As pointed out by Hyndes et al. (2016), a rapidly expanding literature has documented poleward range shifts in terrestrial and marine plants and animals; changes in their body sizes; and altered behavioral and ecological interactions, such as competition, herbivory, and predation (e.g., Pecl et al., 2017; Poloczanska et al., 2013; Vergés et al., 2014, 2018; Wernberg et al., 2013). Collectively, such changes have been termed tropicalization, defined as an increase in the ratio of tropical to temperate taxa in a given region (cf. Wernberg et al., 2013) or as the entire suite of changes in species composition, abundances, and interactions (Vergés et al., 2014). The latter, more comprehensive definition is used here.
Tropicalization has repeatedly been documented to produce rapid shifts in marine ecosystem structure and functioning (Hyndes et al., 2016; Scott et al., 2018; Vergés et al., 2014). Examples of recent GoM tropicalization include the replacement of temperate salt marsh species by tropically associated mangroves in many eastern and northwestern Gulf locations (Jackson et al., 2021; Osland et al., 2017b, 2020, 2021) and
the occurrence of tropically associated fish species that now occur consistently in the northern Gulf (Fodrie et al., 2010; Marshak and Heck, 2017; Purtlebaugh et al., 2020). For other coastal fish species like Southern flounder, tropicalization is generating range-wide declines due to increased climate vulnerability (Erickson et al., 2021; Montalvo et al., 2012).
A direct pathway from the tropical Caribbean to the GoM is provided by the Loop Current, a mass of warm water that carries larval, juvenile, and adult organisms from the tropics northward. Many tropical organisms transported into the GoM have until recently been unable to survive its winter temperatures. However, the decreasing frequency of lethal temperatures has allowed many formerly rare tropical species to become increasingly common in coastal waters of all five Gulf states (Osland et al., 2021) (Figure 2.7). As global climate change continues to alter climate conditions, such as temperature regimes, it is very likely that increasing numbers of tropical species will become established throughout the GoM, and this will produce changes in the relative abundance and species composition of, for example, wetland plants and seagrasses (Osland et al., 2021; Rodriguez and Heck, 2020), corals (Aronson and Precht, 2016), and fishes (Fodrie et al., 2010; Purtlebaugh et al., 2020).
These changes can produce large and cascading effects in the abundance and composition of the many species of organisms that occupy these habitats, with large shifts in their structure and function (Heck et al., 2015; Scheffel et al., 2018). In their review article, Vergés et al. (2014) note that climate-driven interactions can profoundly alter ecological communities, particularly when they affect foundation species. They cite overgrazing of temperate microalgae by tropical herbivorous fish as an example. Hyndes et al. (2016), in their overview assessment of the poleward movement of tropical seagrasses and herbivores, conclude that novel ecosystem configurations are likely to appear. All have implications for the long-term sustainability of habitat restoration in the GoM.
Data from fisheries surveys and habitat monitoring programs will be of critical importance for tracking tropicalization within the GoM. These data can provide information needed to model expected changes in future finfish and shellfish harvests, as well as the value of ecosystem services provided by historically productive wetlands, seagrass meadows, and reefs.
Evidence of GoM tropicalization includes replacement of temperate salt marsh species by tropically associated mangroves and the occurrence of tropical fish species in the northern GoM throughout the year. Increasing tropicalization effects can impact restoration objectives, approaches, and outcomes.
WATER, NUTRIENT, AND SUSPENDED SEDIMENT INFLOW TRENDS
Inputs of freshwater, dissolved and particulate nutrients (primarily nitrogen and phosphorus), and suspended sediments are important drivers of estuarine and coastal marine ecosystems (Hobbie, 2000). These inputs influence salinity regimes, water residence times, and other features of physical circulation, trophic status and keystone habitats, and water clarity and sediment accretion rates. Changes in land uses and human activities have modified and will continue to modify the annual patterns and magnitude of these inputs. Current and projected climate change effects will further influence these trends.
Anthropogenic alteration of rivers and streams has affected streamflow in more than 86 percent of streams in the United States (Carlisle et al., 2011). These alterations may cause ecological impairment in river and stream ecosystems, but also affect water quality, salinity, sediment transport, and ecology of the receiving estuaries. Historic alterations in streamflow, along with future modifications, are likely to influence the success or failure of ongoing and future GoM restoration projects.
Freshwater inflows control salinities in GoM estuaries and shallow coastal waters, thus defining, at least in part, environments and habitats. Riverine inputs largely dominate nutrient loading to coastal waters (NRC, 2000; Oelsner and Stets, 2019). Additionally, suspended sediments and bed materials carried by rivers can influence GoM restoration efforts (Allison et al., 2012). Clays and fine suspended materials may affect turbidity and light penetration and can negatively impact algal primary productivity, seagrass beds, and filter feeders. Conversely, efforts to compensate for land loss by diversions or dredging and barrier island restoration are highly dependent on sediments transported by rivers.
Freshwater Inflows
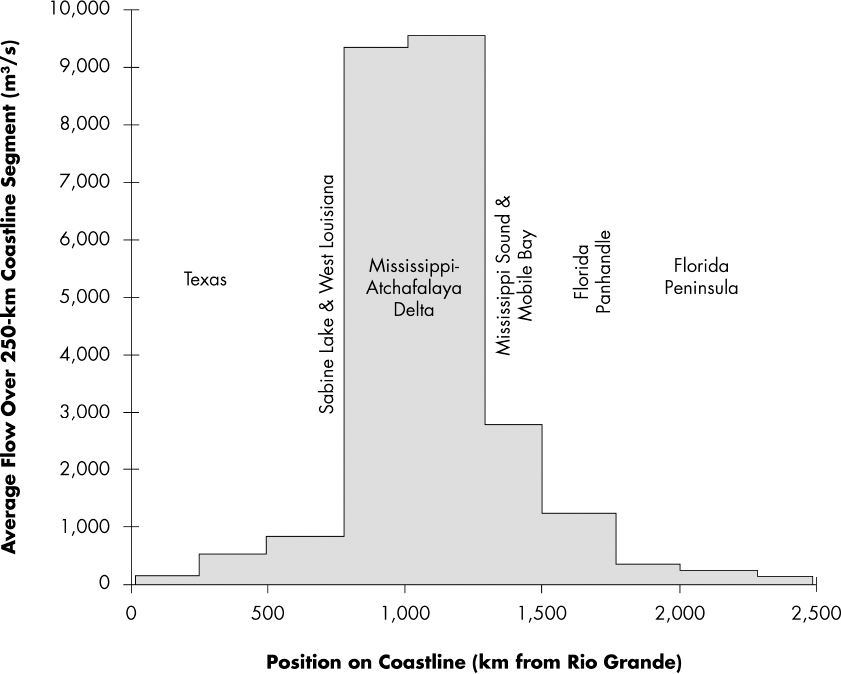
Rodgers et al. (2018, 2020) assembled daily streamflow discharge data from 139 stream gages located on tributaries and streams flowing into the GoM with continuous daily flow data from 1950 to 2015. A model was developed to estimate streamflow from ungaged streams. Since 1950, the sites showed a downward trend in streamflow (Rodgers et al., 2020), which appears to strongly contrast with the steadily increasing streamflow trends for the Mississippi River (Zhang and Schilling, 2006). The Rodgers et al. (2020) study was funded through the RESTORE Council;9 however, this valuable synthesis is currently not scheduled to be updated with additional data. The Mississippi and Atchafalaya River system is by far the greatest source of freshwater to the GoM, contributing an estimated range of 79–90.5 percent of all freshwater streamflow between 1990 and 2019 (USGS, report in preparation, 2021). The outsized impact of the Mississippi and Atchafalaya River system on freshwater flows is illustrated graphically in Orlando et al. (1993): see Figure 2.8.
Increasing flows of the Mississippi River seem to be associated with increased runoff from the upper Mississippi and Ohio River basins and have been attributed to changes in climate and land use (Schilling et al., 2010; Tao et al., 2014). One stark indication of these increased discharges is the increase in the operation of the Bonnet Carré Spillway. The spillway is designed to divert about 20 percent of the floodwaters from the Mississippi River through Lake Pontchartrain into Mississippi Sound and the Gulf of Mexico, relieving stress on the river levees and reducing flood risk for the City of New Orleans.10 Although the spillway was opened only eight times from 1931 (when it was completed) until 2008, it has been opened seven times since then (2008, 2011, 2016, and consecutively in 2018, 2019 [twice], and 2020). Gledhill et al. (2020) detail the
___________________
9 See https://www.usgs.gov/centers/lmg-water/science/streamflow-alteration-assessments-support-bay-and-estuary-resto-ration-gulf.
10 See https://www.mvn.usace.army.mil/Missions/Mississippi-River-Flood-Control/Bonnet-Carre-Spillway-Overview.
deleterious effects of the two 2019 openings of the spillway—an unusual mortality event for dolphins, a harmful algal bloom, and the decimation of the oyster population in western Mississippi Sound. A freshwater plume extended as far away as 180 km from the spillway.
Daily streamflow discharge data (excluding the Mississippi River) generally document a downward trend in freshwater inflow to the GoM since 1950. Conversely, there is evidence that Mississippi River discharge has increased during this period. Freshwater inflow controls salinity in downstream coastal waters and nutrient and sediment input, which can affect the restoration success of marshes, submerged aquatic vegetation, and in particular, oyster reefs.
Nutrient Inputs to the GoM
Nutrient inputs or loading (nitrogen and, to some degree, phosphorous) from terrestrial sources as well as from atmospheric deposition are critical to the function of coastal and estuarine systems. However, excessive nutrient inputs, especially in more recent decades, have led to eutrophication via increased organic matter production (Nixon, 1995; NRC, 2000). This excessive nutrient enrichment has contributed to widespread effects on coastal habitats, including decreased water clarity, increased acidification due to organic matter decomposition, hypoxia, and shifts in species composition (e.g., phytoplankton and fish), among other effects (Diaz and Rosenberg, 2008; Dorgham, 2014). In addition, Montagna et al. (2018) found that the likely effects of climate change on regional GoM hydrology will influence nutrient input rates and sub-
sequent effects on estuarine and coastal habitats and restoration projects.
Hypoxia, in particular at the mouth of the Mississippi River, is one of the most visible effects of excessive nutrient inputs in the GoM (e.g., Rabalais and Turner, 2019) and the source of much study. Several time series have been developed using flow and concentration data (e.g., Whitall, 2008 [1974–2008]; Murphy et al., 2013 [1980–2010]). These data have also been used for statistical modeling of loads, which emphasize interannual variation over decadal time periods. Modeling has also been used to link nitrogen loads to hypoxia and to better understand dominant nitrogen and phosphorus sources in the basin (e.g., Robertson and Saad, 2021). Kleiss et al. (2021) demonstrated statistical tools for use in Mississippi River water quality trends, including loads during the past 40 years, at numerous sites throughout the basin.
Long-term temporal estimates of nitrogen and phosphorous loads to other parts of the Gulf system are not as comprehensive as those for the Mississippi River, but several studies with more limited spatial and temporal scope have been completed. For example, Dunn (1996) developed nutrient inflows to the GoM for the time period from 1972 to 1993 and found that median yields of total nitrogen and phosphorous were significantly lower in the 13 streams west of the Sabine River (in Texas) than in the 24 streams to the east. Turner and Rabalais (1999) measured or modeled load data for 32 of 39 GoM systems located between Florida Bay and the Yucatan. They found annual nitrogen loads ranging from 1.4 to 70 g N m–2 yr–1 and a Gulfwide average of 22 g N m–2 yr –1, within the ranges reported by Boynton and Kemp (2008) based on a global sampling of nutrient loading rates. Rebich et al. (2011) modeled annual nutrient loads for nine Texas systems, with highest yields from the Trinity/Galveston Bay systems. Harned et al. (2004) developed a model of nutrient loads from 18 sub-basins of Mobile Bay as part of the U.S. Geological Survey (USGS) National Water Quality Assessment program and reported a decline in nitrogen loads between 1975 and 1997, from both agriculture and urban areas, and found a clear link between stream water quality and adjacent land uses. Montagna et al. (2018) developed modeled nutrient yields to four Texas estuaries ranging from mesohaline to hypersaline systems and used this spatial gradient as a substitute for expected hydrologic changes due to climate change. USGS researchers have used the SPARROW (SPAtially Referenced Regression On Watershed attributes) model to estimate sources of nutrients and sediments in rivers and streams throughout the United States (e.g., Hoos and Roland, 2019; Robertson and Saad, 2019; Wise et al., 2019). USGS has also assembled a dataset of regional patterns of anthropogenic influences on U.S. rivers and streams from the 1970s through 2012 (Falcone et al., 2019). Additional applications of this dataset to GoM issues could prove useful. Despite these efforts, a need still exists for better coverage of nutrient inputs and analysis and interpretation of their effects both in space and time in GoM ecosystems.11
When nutrient inflow data is collected over decades, it can be very useful for assessing management actions related to restoration. For example, in Tampa Bay, Florida, Greening et al. (2014) used long-term (1976–2010) nutrient loading rates and other water quality data to evaluate restoration progress and found that despite lag times on the order of a decade, submerged aquatic vegetation (SAV) expansion did occur following a 50 percent reduction in nitrogen loading. Similar results occurred in Sarasota Bay Florida (Tomasko et al., 2005), as well as for Chesapeake Bay in more recent years (Lefcheck et al., 2018). More recently, Beck et al. (2019) were able to evaluate broad regional outcomes of restoration in Tampa Bay with a focus on best management actions and found that nutrient point source reductions were most effective in restoring water clarity and SAV.
Gulfwide nutrient loading to the GoM has been modeled for specific points in time, but trends are not available. From the limited number of estuaries and the Mississippi River system where long-term loading estimates exist, trends are variable. Nutrient load reduction has been found to be the most effective restoration technique for water quality and SAV in several Florida estuaries.
___________________
11 Kirk Rogers, presentation to committee, September 29, 2020.
Sediment Inflows
Sediments transported by rivers play a critical role in coastal regions by building land, supporting healthy wetlands, and bringing nutrients into coastal ecosystems (Anderson et al., 2016; Elsey-Quirk et al., 2019; Keogh et al., 2019). River-transported sediment supports building and replenishing barrier islands, which are important for storm surge mitigation, maintenance of estuarine salinity gradients (Montagna et al., 2018), and habitat for beach-nesting birds.12 However, sediments suspended in the water column may have detrimental effects on some restoration or species recovery projects. Suspended sediments, particularly clays from fine alluvial soils, can interfere with filter feeders, such as oysters, and bury the hard substrate needed for their reproduction. SAV communities may also be negatively affected due to decreased light penetration into the water column (Adams et al., 2016; Carr et al., 2010; Choice et al., 2014).
Trends in sediment inflow estimates are less readily available than nutrient estimates, both in long-term measurements and in analysis of the data to produce loads and trends. Efforts were made to include sediment in the USGS SPARROW modeling efforts. Hoos and Roland (2019) discuss the variability and uncertainty of the sediment data. Some data and trends exist for major rivers, such as the Rio Grande, the Brazos, and the Apalachicola,13 although long-term efforts to establish suspended sediment budgets and trends have been largely restricted to the Mississippi River (Allison et al., 2012, 2017; Keown et al., 1986; Meade and Moody, 2010; Mize et al., 2018). The Mississippi River is the principal contributor of suspended sediment to the GoM; however, annual riverine inflows of freshwater and sediments have varied over the past several decades (Allison et al., 2017) and are anticipated to be further affected by factors such as climate change, which may impact storm frequency and intensity as well as regional to continental-scale rainfall patterns.
Declines in suspended sediment loads in the Mississippi River, decreased connectivity between the river and its floodplain, sea level rise, and subsidence have contributed to the loss of Louisiana coastal wetlands (Kesel, 1988; Tweel and Turner, 2012). These declines are particularly evident in the lower part of the river, where floodplain trapping, loss of stream power, and existing natural and man-made diversions contribute to channel aggradation (Allison et al., 2012). A principal concern for Louisiana is whether enough river-transported sediment is available to support restoration plans (Allison et al., 2012, 2017; Blum and Roberts, 2009), especially plans to construct large-scale diversions of river water to augment wetland acreage in coastal marshes.
Long-term trends in sediment inflow are limited to the few estuarine rivers where long-term sediment data have been collected; these trends show annual variations over time. Declines in Mississippi River sediment loads have contributed to marsh loss and may affect restoration plans by reducing the expected amount of sediment transported from the river.
AMBIENT WATER QUALITY OF ESTUARINE AND COASTAL RECEIVING WATERS
Changes in ambient water quality14 in estuaries are largely driven by the inputs discussed above, namely, hypoxia and harmful algae blooms (HABs) (denoted as acute pressures and stressors in Figure 2.1). These can directly affect the success of restoration projects, individually and collectively. These projects include seagrass restoration, which depends on such factors as water transparency (summarized in Larkum et al., 2006; Choice et al., 2014) and oyster reef creation, which is sensitive to salinity, dissolved oxygen, and water temperature (Coen and Luckenbach, 2000; NASEM, 2017). Trend analyses of water quality measurements in GoM coastal and estuarine waters can provide a means to assess change in ecosystem services and can serve as an indicator of cumulative effects of multiple habitat restoration and water quality improvement projects (see Figure 2.1) (Lester and Fairweather, 2011; Sherwood et al., 2016).
___________________
12 See https://la.audubon.org/news/barrier-islands-critical-restoration-project-people-and-birds.
13 See https://nrtwq.usgs.gov/nwqn/#/.
14 As defined by the U.S. Environmental Protection Agency (EPA): “[A]mbient refers to open waters such as rivers, lakes, and streams, as opposed to closed water supply systems that distribute treated water or wastewater” (https://www.epa.gov/wqs-tech/supplemental-module-human-health-ambient-water-quality-criteria, para. 1).
Assessing cumulative effects of multiple restoration projects using water quality indicators has been successfully applied in regional GoM examples, including Tampa Bay (Greening et al., 2014; Tomasko et al., 2018) and Galveston Bay (HARC, 2020). Water quality monitoring can provide information to assess the effects of acute events on habitats; for example, tracking sediment plumes after hurricanes or heavy rainfall (Moreno-Madrinan et al., 2010), or oil spills (summarized in NRC, 2013). Monitoring and tracking water quality parameters can also show effects of long-term environmental trends, such as changing land use patterns, improvements in wastewater treatment, or shifts in the use of onsite septic systems (Lusk et al., 2017; McCarthy et al., 2018b; Withers et al., 2014. However, Baldera and colleagues (2018) found that ongoing and planned restoration programs will likely not be sufficient to fully restore water quality in areas larger than individual estuaries and waterbodies.
NASEM (2017) recommended that restoration programs “would greatly benefit from working together to identify strategic opportunities in the Gulf of Mexico to maximize the effectiveness and utility of monitoring while also reducing the overall cost of long-term monitoring across the Gulf region” (p. 4). Toward that end, NOAA and USGS formed the collaborative Council Monitoring and Assessment Program (CMAP) to prepare an inventory of existing habitat and water quality monitoring and mapping programs for GoM programs, to provide “essential information to support the development, selection, and application of effective management and restoration alternatives, and inform adaptive management decisions at the local, state, and regional levels” (NOAA and USGS, 2019, p. 1). To date, the CMAP inventory assessment of water column monitoring programs has found that 68 percent (247 programs) are conducted at the local (rather than state or federal) level. The majority of the water column monitoring is done in estuarine, nearshore marine, and riverine settings (NOAA and USGS, 2019).
Salinity
Although salinity in the open Gulf is generally constant, GoM estuaries reflect the integrated effects of highly variable mixing processes, including freshwater inflows; connectivity between estuaries and the open ocean; physical forcing from wind, currents, and tides; and precipitation and evaporation (Solis and Powell, 1999). Changes and trends in salinity are a critical aspect of understanding the ecological structure of faunal communities (Christensen et al., 1997).
Orlando et al. (1993) provided a synthesis of salinity information for 26 principal GoM estuaries. At the time of their study, the authors noted the inadequacy of standardized salinity data for GoM estuaries and said that “the characterization of salinity variability at certain time scales is limited or impossible” (Orlando et al., 1993, p. v). Their report supplies typical seasonal distributions of salinity within the estuaries under normal hydrologic conditions at that time. They also proposed a classification of estuaries by salinity behavior, which included magnitude of variability and average annual salinity.
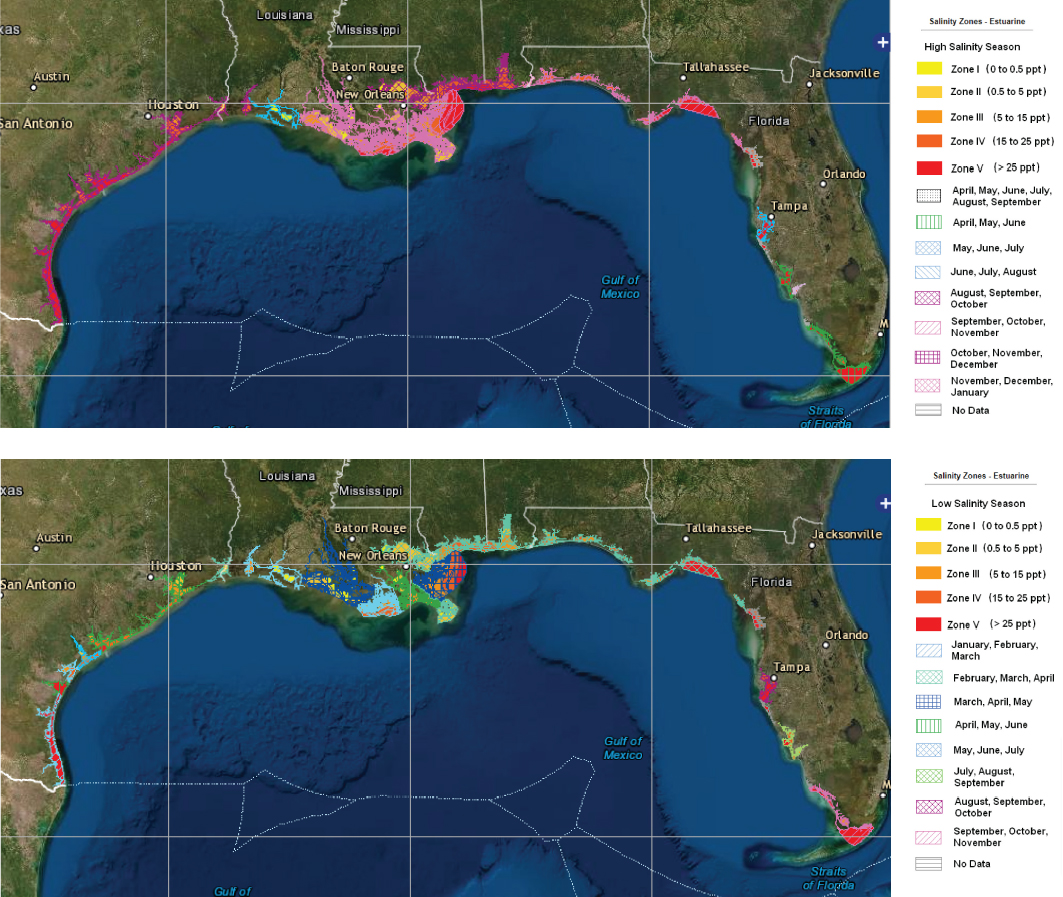
The Naval Research Laboratory processed MODIS-Aqua satellite imagery covering the Gulf of Mexico for a 5-year period ( January 2005 to December 2009). The resulting maps provided a broad overview of GoM spatial salinity patterns and indicated seasonal fluctuations in the extent of salinity ranges associated with rainfall and runoff patterns: see Figure 2.9. Similar to those efforts, the National Aeronautics and Space Administration (NASA) conducted a series of successful efforts to measure sea surface salinity and temperature, capturing events such as the 2011 Mississippi River flood and the effects of Hurricane Katia.15 Additionally, Vazquez-Cuervo et al. (2018) compared in situ salinity measurements to four remotely sensed salinity datasets to help describe seasonal variability.
As part of an analysis of the effects of drought, Petkewich and colleagues (2019) developed a Coastal Salinity Index that included some GoM stations. More recently, in situ monitoring data compiled by Rodgers and Swarzinski (2019, revised 2021) included available salinity measurements from Upper Laguna Madre, Texas, to Rookery Bay, Florida, over the period 1990–2019. They found that while the overall station coverage was sufficient to assess regional trends, several spatial gaps remain, including the absence of monitoring
___________________
15 See https://salinity.oceansciences.org/science-results.htm.
stations in the Florida Panhandle (USGS, report in preparation, 2021). In addition, spatial distribution within the estuaries is often incomplete and does not cover the range of salinity zones from freshwater to marine waters.
Climate change has the potential to cause changes in streamflow, sea level, oceanic salinity, wind stress, and hurricane intensity, all of which can affect coastal salinity (Ross et al., 2015). Severe tropical storm events have the potential to decrease the salinity of waters over oyster reefs due to heavy rainfall (ADCNR et al., 2021), while also pushing saline water far inland into brackish and freshwater wetlands (Middleton, 2009). The IPCC found that recent observations support that sea level rise (SLR) increases seawater intrusion and raises estuarine salinity, and noted that salinization in estuaries is projected to continue in response to SLR, warming, and droughts. This will cause stress to ecosystem functions and biodiversity (IPCC, 2019). GoM estuaries can be expected to exhibit a range of conditions—those with increased freshwater inflows may experience decreases in salinity, while estuaries primarily driven by SLR and oceanic salinity are likely to increase in salinity.
While salinity data are available, gaps remain in their collection and analysis. This limits time-series analyses of salinity for the major estuaries. Changes in salinity due to climate change are likely to affect the extent of saltwater intrusion in GoM estuaries, which will affect plant and animal distribution and thus impact restoration and recovery efforts.
Nutrients, Eutrophication, Hypoxia, and HABs
Although a number of regional and statewide water quality datasets have been used to track trends in ambient water quality both before and after DWH, an assessment of GoM-wide trends in water quality is not readily available. EPA’s National Coastal Condition Assessment (NCCA) reports are currently available for four periods (1999–2001, 2005–2006, 2010, and 2015). They provide a snapshot of conditions at locations across the GoM and allow statistical changes to be estimated, but are not adequate to provide trends (EPA, 2015, 2021). The GoM estuaries show steady increases in the percent area rated “poor” for the estuarine eutrophication index from 2005 (14 percent) to 2010 (25 percent) to 2015 (28 percent) (EPA, 2021). Nutrients, chlorophyll a, water clarity, and dissolved oxygen are included in the estuarine eutrophication index (EPA, 2021).
Kennicutt (2017) summarized water quality results from local, state, and federal sources for the 1990s through the mid-2000s (prior to DWH). This includes two NOAA National Eutrophication surveys (Bricker et al., 1999, 2008), NCCA reports (EPA, 2015), and regional and local water quality programs. The NOAA 1999 National Eutrophication Survey collated water quality information collected by local and regional programs for 38 estuarine areas around the GoM (Bricker et al., 1999). Their assessment concluded that “the expression of high eutrophic conditions is extensive, and human influence is substantial, in the Gulf of Mexico region” (Bricker et al., 1999, p. 32). The most significant issues were low dissolved oxygen and loss of submerged aquatic vegetation. The 2007 assessment (Bricker et al., 2008) found similar results, with few areas exhibiting improved eutrophic conditions since the 1999 assessment.
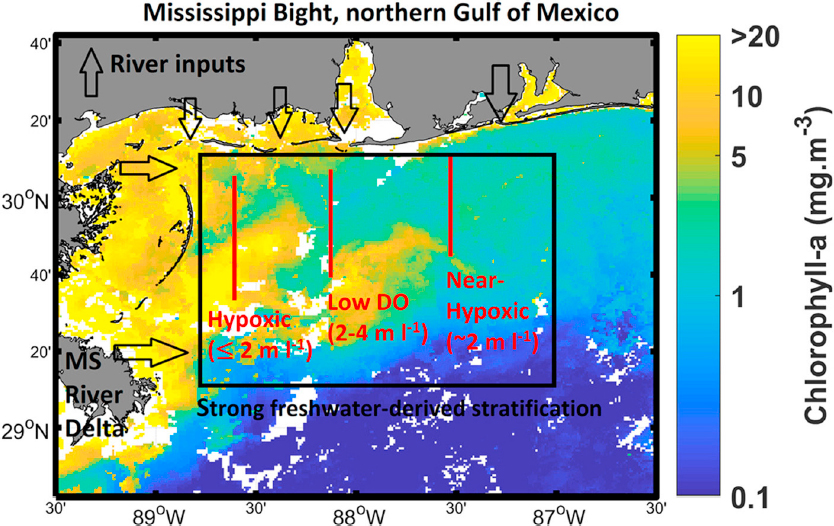
Large areas of seasonal bottom-water oxygen deficiency and hypoxic conditions on the northern GoM continental shelf adjacent to the Mississippi River have been documented since the 1950s, shown in Figure 2.10, with an acceleration of worsening severity during the 1970s (Rabalais and Turner, 2019). The area of hypoxic bottom waters in the GoM west of the Mississippi River can reach up to 23,000 km2 in midsummer16
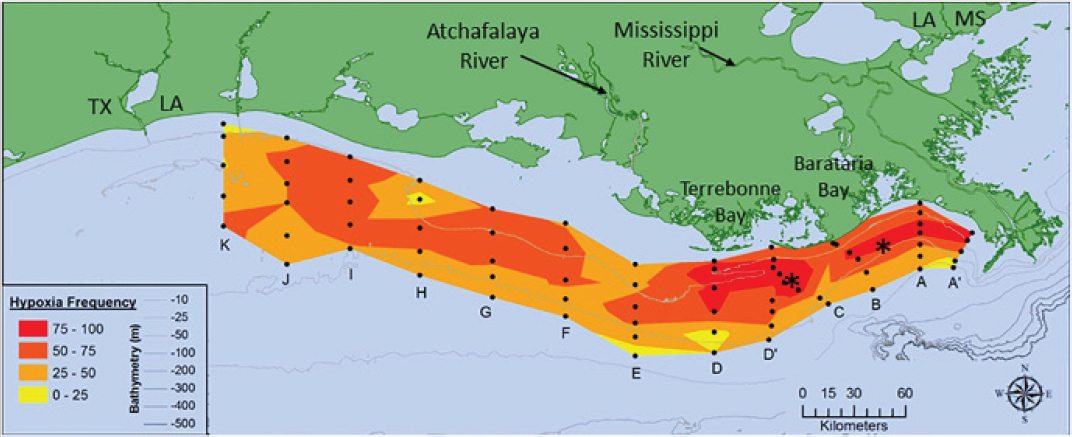
SOUCRE: Rabalais and Turner, 2019.
___________________
and correlates best with the nitrate-nitrogen load of the Mississippi River in the previous May (Turner et al., 2012). Openings of the Bonnet Carré Spillway have also been associated with bottom-water hypoxia in the Mississippi Sound (Gledhill et al., 2020): see Figure 2.11. Hypoxia also occurs east of the Mississippi River, where it is becoming more frequent (Dzwonkowski et al., 2018), and in nearshore GoM waters where it can impact nearshore and estuarine restoration efforts (NASEM, 2017).
Rising SST can increase coastal hypoxia by decreasing oxygen solubility in the water column as well as by contributing to stratification (Altieri and Gedan, 2014). Stratification isolates waters of differing physical characteristics, such as temperature and salinity, which can allow biological processes to deplete oxygen (DiMarco et al., 2012; Rabalais and Turner, 2019) and result in the production of hypoxic waters. The GoM’s northern shoreline prevents aquatic species sensitive to hypoxia from migrating further north in response to warming temperatures and hypoxia events. Their options are to adapt, to spend more time deeper in the water column, or to die off (Roman et al., 2019). Coastal zooplankton and fish do not appear to have adapted to the increasing frequency of low dissolved oxygen and seasonal hypoxia (McBryan et al., 2013). Current research suggests that warming SST and hypoxia will affect the entire coastal food web, from primary producers to zooplankton to commercially important shrimp, oysters, and fish species (Karnauskas et al., 2017; Rybovich et al., 2016; Trifonova et al., 2019).
HABs can also be fueled by eutrophication (summarized in Anderson et al., 2021). HABs occur when unusually large numbers of specific phytoplankton come to dominate nearshore, estuarine, bay, or lagoonal waters, displacing the normal seasonal association of algae and causing harm to humans or other species (Anderson et al., 2012; Backer et al., 2013). Red tides caused by Karenia brevis are the most well-known and can result in fish kills, respiratory irritation in humans and mammals, and neurotoxic shellfish poisoning (NRC, 2000). The GoM also experiences a variety of other HABs, including several that can directly affect human health and result in shellfish harvesting closures and fish species consumption bans.17 HABs have increased in coastal waters (Anderson et al., 2021; Glibert et al., 2014) and will likely continue to increase (Schmale et al., 2019). HABs are also occurring more frequently with climate change (Griffith and Gobler, 2020).
SOURCE: Dzwonkowski et al., 2018.
___________________
17 See https://oceanservice.noaa.gov/hazards/hab/gulf-mexico.html.
In addition to having significant human health effects, high concentrations of chlorophyll a in HAB blooms can directly affect coastal restoration efforts via reduced light availability for submerged aquatic vegetation restoration (summarized in Anderson et al., 2021). HAB and macroalgae blooms in Tampa Bay and Sarasota Bay have been associated with a reduction in mapped seagrass acreage between 2016 and 2020 (Beck et al., 2021). Increased oxygen demand as HAB cells die and decompose can result in low dissolved oxygen, impacting restored and created oyster reefs and other living resources (Coen and Luckenbach, 2000).
NOAA routinely monitors18 and forecasts19 red tide blooms in the GoM, more frequently during periods of likely occurrence and when a bloom is reported; this is the only extant Gulf-wide HAB monitoring effort. All Gulf states have shellfish and beach monitoring programs that can detect HABs, but they are not designed to directly monitor HAB occurrence. A number of efforts have been undertaken to develop monitoring programs, most notably the Gulf of Mexico Coastal Ocean Observing System (GCOOS)’s Harmful Algal Bloom Integrated Observing System, but none have yet moved beyond planning proposals (e.g., Nowlin et al., 2015). Regional monitoring and assessment products developed by NOAA’s National Centers for Coastal Ocean Science Algal Bloom Monitoring System20 deliver near real-time products for use in locating, monitoring, and quantifying algal blooms. Products are currently available for selected regions, including Lake Pontchartrain in Louisiana and the Southwest Florida coast.
Statistically significant decreases in the area percentage rated “good” by the eutrophication index developed by the National Coastal Condition Assessment were observed between two periods, from 1999–2001 to 2005–2006 (16 percent) and from 2005–2006 to 2010 (10 percent), although these data are not adequate to detect long-term trends. Annual assessment of the extent of hypoxia in the nearshore northern GoM show variability associated with spring rainfall in the Mississippi River watershed.
Factors contributing to difficulties in synthesizing water quality monitoring in GoM coastal and estuarine areas include lack of consistent data collection and analysis methods, intermittent funding resulting in spatial and temporal gaps in data collection efforts, and lack of coordinated monitoring objectives that do not include current priority issues such as assessing the cumulative effects of multiple restoration projects. Excess nutrient inputs can result in reduced water clarity, hypoxia, and increases in HABs, which affect restoration efforts for submerged aquatic vegetation.
OTHER SIGNIFICANT GULF OF MEXICO ENVIRONMENTAL TRENDS
Shifting environmental trends driven by climate change are significant in the GoM, as in many parts of the world. However, other anthropogenic drivers, pressures, and stressors also affect coastal resilience in the region, including changing land use patterns, habitat loss, and impaired water quality. In addition to indicators associated with long-term environmental trends, other indicators that illuminate the status and trends of important GoM foundation species are considered below.
Coastal and Estuarine Habitats
A significant percentage of the RESTORE, Natural Resource Damage Assessment (NRDA), and National Fish and Wildlife Foundation (NFWF) funds expended for ecological purposes thus far have been focused on habitat restoration activities (see Chapter 1), including land acquisition, restoration, and enhancements of wetlands and barrier islands; projects to improve water quality; and projects to restore and replenish living coastal and marine resources, including oysters and birds (ELI, 2020). Changes in the occurrence and distribution of GoM salt marshes, seagrass meadows, mangroves, oyster reefs, and barrier islands are useful
___________________
18 The NOAA Harmful Algal BloomS Observing System contains information for the Gulf of Mexico: https://habsos.noaa.gov/.
19 See https://coastalscience.noaa.gov/research/stressor-impacts-mitigation/hab-forecasts/gulf-of-mexico/.
20 See https://coastalscience.noaa.gov/research/stressor-impacts-mitigation/hab-monitoring-system/.
indicators of long-term environmental trends because of their broad distribution, their well-understood relationships with economically important finfish and shellfish (recently summarized by Hollweg et al., 2020), and the availability of historical information about their areal extent (Dahl and Stedman, 2013).
Emergent wetlands of the GoM make up around 55 percent of total U.S. salt marshes (e.g., Duke and Kruczynski, 1992; Mendelssohn and McKee, 2000) and are most common in the northern Gulf. Seagrass meadows are broadly distributed across the GoM (Handley and Lockwood, 2020) but are abundant along the Florida coasts and, to a lesser degree, those of Texas. Mangroves now occur across the entire GoM but are patchily distributed across the northern Gulf and usually only represented there by Avicennia germinans (the black mangrove), the most cold-tolerant mangrove species (Osland et al., 2013, 2020), while multispecies, mature mangrove forests are currently found only in south Florida. Oyster reefs occur across the entire GoM (Beck et al., 2011), but they are especially widespread in the northern Gulf.
Emergent Wetlands
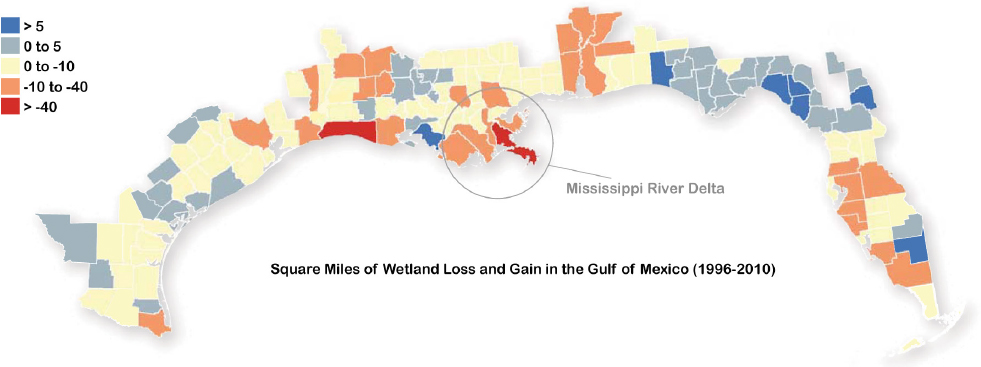
The predominant emergent wetland type along the northern GoM is the salt marsh, which is dominated by erect and rooted herbaceous hydrophytes (Cowardin et al., 1979). Wetlands make up ~20 percent of the total land cover in the GoM coastal area, even though approximately 1,000 square miles of wetland were lost between 1996 and 2010, primarily due to open water conversion and, to a lesser extent, from development and urbanization (Karnauskas et al., 2017): see Figure 2.12.
Wetland areal extent and change vary geographically, with the most wetlands and wetland loss acreage occurring in coastal Louisiana. Wetland loss is primarily attributed to subsidence, erosion (due to multiple factors), saltwater intrusion, the lack of sediment replenishment needed to sustain marshes, and impacts from storms (Karnauskas et al., 2017). Human activity has altered hydrology in Barataria Bay by decreasing riverine flows and increasing runoff and channelization of wetlands, resulting in significant emergent wetland loss (Day et al., 2021). Industrial activities can also contribute to wetland loss and subsidence. For example, oil and gas development contributed almost 26 percent of net wetland loss in Louisiana from 1955 to 1978 (Baumann and Turner, 1990), and there are an estimated 8,000–10,000 miles of canals that support oil and gas extraction in the GoM and contribute to wetland loss (Turner, 1997; Turner and Cahoon, 1988). Dredging of canals converts some wetlands to open water and others to spoil banks, and canals can change sediment sources and distribution as well as salinity and water levels (Turner and Cahoon, 1987).
The U.S. Fish and Wildlife Service’s (USFWS’s) National Wetlands Inventory21 provides access to reports that summarize more than 50 years of monitoring data for the conterminous United States. The most
___________________
21 See https://www.fws.gov/wetlands/status-and-trends/Status-and-Trends-2004-2009.html.
recent assessment (Dahl, 2011) provides information about the Gulf of Mexico, but does not include data on specific bays or estuaries. NOAA’s Digital Coast,22 through the Coastal Change Analysis Program’s Regional Land Cover and Change reports, provides inventories of land cover use for the GoM and other regions. This is a resource for sustaining change analyses and indicator development; an independent assessment of its capabilities by McCombs et al. (2016) provides confidence in its accuracy. In addition, the USGS Wetlands and Aquatic Research Center maintains an ongoing program assessing impacts of coastal and watershed changes (Couvillion et al., 2017).
A GoM-wide coastal wetland dataset (Couvillion, 2021; Couvillion et al., 2021) was recently published, and it could be used to create a baseline and change analysis of coastal wetlands utilizing standardized methods. Most National Estuary Program–designated sites in the GoM maintain regular monitoring programs that include emergent wetlands assessments. For example, Galveston Bay National Estuary Program prepares an annual report card23 that includes the status of emergent wetlands. The Tampa Bay Estuary Program regularly updates a Habitat Master Plan that includes status and trends analysis.24 The Mobile Bay National Estuary Program addresses status and trends updates in annual work plans.25 At the state level, the Louisiana Coastal Protection and Restoration Authority maintains a Coastal Information Management System that can be used to assess land change, including emergent wetlands, over time.26 Gulf-wide assessments of emergent wetlands include the Handley et al. (2012) status and trends report, which updated the Duke and Kruczynski (1992) report on emergent and submerged vegetated habitats. The Coastal Wetlands Initiative: Gulf of Mexico Review27 also provides a comprehensive discussion, including recommendations for undertaking emergent wetlands assessments. Handley et al. (2012) assessed emergent wetlands trends in the northern GoM from 1950 to 2010, focusing on eight systems: Corpus Christi/Nueces/Aransas Bays, Galveston Bay, Barateria/Terrebonne Bay, the Mississippi Delta, Mississippi Sound, Mobile Bay, Florida Panhandle, and Tampa Bay.
Wetlands make up ~20 percent of the total land cover in the GoM coastal area, although significant amounts of wetlands have been lost due to open water conversion and, to a lesser extent, due to development and urbanization. Emergent wetland restoration is a key component of the DWH restoration strategy. Several agencies collect, map, and interpret emergent wetland information, but interpretation and reporting generally lag data collection by several years.
Seagrass
The GoM accounts for approximately 50 percent of all seagrass in the continental United States (Congdon et al., 2018; Handley et al., 2007). Seagrass meadows can be found from Texas to Florida to depths of 30–40m in shallow bays and lagoons offshore on the western shelf of Florida (Zieman and Zieman, 1989). Handley and Lockwood (2020) identified two primary data sources for seagrass occurrence and distribution: the Bureau of Ocean Energy Management (BOEM) and NOAA Marine Cadastre national database and the Florida Seagrass Integrated Mapping and Monitoring Program. Additionally, Handley et al. (2018) provided details of a monitoring approach for Gulf of Mexico seagrasses to sustain ongoing efforts. Meiman and Segura (2019) described in detail a seagrass monitoring program for GoM national parks. On a state level, the Texas Coastal Report Card uses seagrass as an indicator for both coastwide assessment and subregional analyses (McKinney et al., 2019), and the Florida Fish and Wildlife Conservation Commission provides periodic seagrass mapping and monitoring information throughout Florida’s coastal waters (Yarbro and Carlson, 2016).
___________________
22 See https://coast.noaa.gov/digitalcoast/.
23 See https://www.galvbaygrade.org/wp-content/uploads/2015/07/Galveston_Bay_Full_Report_updweb.pdf.
24 See https://drive.google.com/file/d/1Hp0l_qtbxp1JxKJoGatdyuANSzQrpL0I/view.
25 See http://www.mobilebaynep.com/images/uploads/library/MBNEP_EPAworkplan2020_2021_Final.pdf.
26 See https://cims.coastal.louisiana.gov/Viewer/Map.aspx?guid=f8ec2690-bbb1-4879-ac30-aa44f5878b7f.
27 See https://www.epa.gov/sites/default/files/2015-04/documents/gulf-of-mexico-review.pdf.
Three seagrass status and trends assessments (Duke and Kruczynski, 1992; Handley et al., 2007, 2020) provide a foundation on which future status and trend analyses can be based. Handley and Lockwood, 2020) noted that gains in seagrass areal extent can be linked to improvements in water quality, while losses are often associated with degradation of water quality, although losses can also be attributed to the effects of hurricanes (Tomasko et al., 2020). Handley and Lockwood (2020) compared gains and losses between the most recent areal extents available in 2007 (as collated by Handley et al. [2007] from information collected between 1987 and 2002) and maps developed from information collected between 2004 and 2017, collated from a variety of monitoring programs. The authors found that, for the areas where seagrass maps are available, the Gulf experienced an overall gain in seagrass extent of almost 24 percent (an increase of 127,910 ha) between these two time periods. Texas, Alabama, and Florida exhibited seagrass gains between the 1990s and the latest statewide assessment; Louisiana and Mississippi both showed seagrass losses between the earlier periods and 2017 reporting periods (Table 2.1). These data on seagrass areal extent in each state can provide useful standards by which the cumulative impacts of seagrass restoration projects can be assessed, with consideration of other pressures and stressors, but only if those restoration sites were within the originally mapped polygons and if the same areas were mapped again.
Gulf-wide estimates of seagrass extent are not available. For the limited areas for which seagrass maps are available, an overall gain in seagrass extent of almost 24 percent between two time periods (1987–2002 and 2004–2017) was observed. Texas, Alabama, and Florida exhibited gains between the 1990s and the latest assessment; Louisiana and Mississippi showed losses. Gains are associated, in part, with improved water quality. The ability to map changes in seagrass extent over time is an important component to measure restoration progress.
Mangrove Forests
The recent expansion of mangroves across the northern GoM and the displacement of salt marshes by the black mangrove (Armitage et al., 2015) has implications for future salt marsh restoration projects (as discussed under “Tropicalization”). Black mangrove is expanding northward into Spartina-dominated salt marshes, one of the coastal habitats often targeted for restoration (Comeaux et al., 2012; Spies et al., 2016; Osland et al., 2021). Thus, the effects of the ongoing mangrove colonization of GoM salt marshes will likely be an important consideration in planning for the restoration of salt marshes (Feller et al., 2017).
Although there is currently no known assessment of mangrove areal extent in the GoM, national programs, such as the USFWS National Wetlands Status and Trends program (Dahl, 2011), map different categories of wetlands, including an estuarine intertidal forested/shrub category that is dominated by mangrove shrub in the northern Gulf and mangrove trees in south Florida. The most recent National Wetlands Status and Trends report estimated an areal extent loss of 0.2 percent for this category between 1998 and 2004. Day et al. (2018) provide guidance to developing resilience indicators for mangrove ecosystems that could be of interest to restoration planners. Lewis (2005) summarized the status of mangrove restoration up to that time, providing guidance for future restoration. Although mangrove restoration efforts have been hindered by poor restoration strategies and the decline of mangroves across the tropics (Feller et al., 2017), large-scale mangrove restoration has been successful in south Florida (Lewis, 2005; Rey et al., 2012; Begam et al., 2017).
Although long-term mapping results of mangrove areal extent at the estuary scale are available for some locations, trends in Gulf-wide mangrove areal extent are not known. The last assessment to include GoM mangrove estimates was based on information collected between 1998 and 2004. The effects of ongoing colonization of salt marshes in the northern GoM by mangroves will be an important consideration in salt marsh restoration projects.
TABLE 2.1. Acreage Change by State Since the 2007 Seagrass Status and Trends Report (Handley et al., 2007)
| State | Status & Trends 2007 (1987/88 through 2002) |
Seagrass Update 2020 (2004 through 2017) |
Gain/Loss + /- |
||
|---|---|---|---|---|---|
| Date | Hectares/Acres | Date | Hectares/(Acres) | ||
| Texas | 1987/88; 1992/1994; 1998 |
88,393 (218,418) |
2004/07/12 | 92,475 (228,506) |
+4,083 (+10,088) |
| Louisiana | 1995 | 4,512 (11,149) |
2011 | 1,058 (2,614) |
-3,454 (-8,535) |
| Mississippi | 2002 | 1,194 (2,950) |
2007 | 816 (2,017) |
- 378 (-933) |
| Alabama | 2002 | 2,690 (6,646) |
2015 | 4,440 (10,570) |
+1,588 (+3,924) |
| Florida | 1992-2002 | 443,412 (1,095,675) |
2007-2017 | 569,484 (1,407,196) |
+126,072 (+311,512) |
SOURCE: Handley and Lockwood, 2020.
Oyster Reefs
Oyster reefs are widely distributed throughout GoM estuaries (Shepard et al., 2018) and near river mouths, as shown in Figure 2.13, and they are healthy and productive enough to account for more wild harvest than any other region in the world (Beck et al., 2011). Oyster reefs provide an array of valuable ecosystem services beyond their value as seafood, including habitat structure used heavily by fish and invertebrates (La Peyre et al., 2019). Reefs differ in faunal composition from adjacent salt marshes and seagrass meadows (Hollweg et al., 2020). There have been recent concerns about oyster populations in the GoM. For instance, in 2020, Florida suspended its Apalachicola Bay wild oyster harvest for up to 5 years28 due to droughts and lack of freshwater from rivers,29 and the openings of the Bonnet Carré Spillway in 2019 damaged the oyster population in western Mississippi Sound due to excessive freshwater flows (Gledhill et al., 2020). Even in the relatively unaffected Suwannee River estuary in Florida, inshore intertidal oyster bars are becoming degraded and oyster counts have declined (Moore et al., 2020).
Hurricanes affect oyster stocks and reefs through direct wind and wave action, salinity changes and increased sedimentation associated with storm-related rainfall, and dissolved oxygen depletion (summarized by Mallin and Corbett, 2006). Studies have reported relatively rapid oyster reef recovery times (months), particularly in areas that are frequently disturbed by hurricanes (Livingston et al., 1999). However, oyster fisheries may take longer to recover (months to years) because of both direct impacts and public health concerns from high levels of bacteria in stormwater runoff from flooded upstream areas.30
Because they are such a valuable fishery, Gulf states have long-standing oyster monitoring programs that provide valuable information that can be used to assess the cumulative impacts of oyster reef restoration. Murawski et al. (2021) found that the overall abundance of natural oyster populations has been in long-term decline in areas throughout the GoM, and particularly since the mid-1990s (Tunnell, 2017; GSMFC, 2012), as reflected both in relative abundance surveys and fishery landings.
Baggett et al. (2015) exhaustively addressed oyster monitoring approaches and reported little to no monitoring of oyster reefs. In 2017, the DWH NRDA Trustees developed a strategic framework for oyster restoration that summarizes existing status and trends information for GoM oyster reefs (DWH NRDA Trustees, 2017b). Shepard et al. (2018) developed a conceptual model for assessing cumulative impacts of reef restoration efforts and provided a detailed assessment of a broad array of metrics useful as indicators of oyster and ecosystem health. At the state level, the Tampa Bay Estuary Program has an oyster habitat suitability index mapping tool to identify suitable locations for restoration.31
___________________
28 See https://myfwc.com/news/all-news/oyster-commission-1220/.
29 See https://www.npr.org/2020/07/22/894074674/floridas-oyster-beds-devastated-by-years-of-drought-other-pressures.
30 See https://www.nature.org/content/dam/tnc/nature/en/documents/OysterRestorationintheGulf.pdf.
31 See https://www.tampabay.wateratlas.usf.edu/oyster-habitat-suitability/.
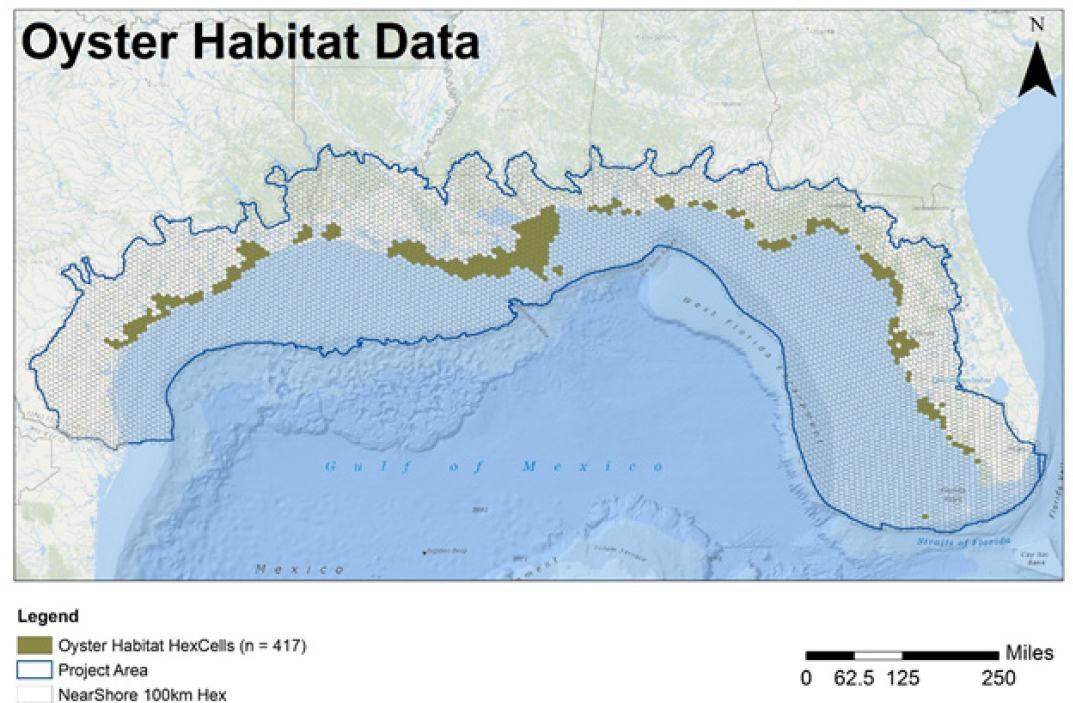
The overall natural oyster population has been declining in monitored areas since the mid-1990s. Although Gulf states monitor oyster landings for purposes of managing their commercial fisheries, and the current locations of many oyster reefs have been mapped, Gulf-wide trends in the extent and condition of oyster reefs as habitat are currently unknown. Potential impacts from climatic drivers and anthropogenic stressors, as well as restoration design and implementation, can affect oyster reef restoration.
Barrier Islands
There continues to be considerable interest in barrier island restoration in the GoM (see Oliver and Ramirez-Avila, 2019), both to provide ecological habitat and to protect human resources on barrier islands and in the bays behind them. Studies have been conducted on barrier islands in the five Gulf states: Florida (e.g., Davis, 2016; Hine et al., 2001); Alabama (the Alabama Barrier Island Restoration Assessment,32 which features a life-cycle response assessment model [Gonzalez et al., 2020]); Mississippi (within the Mississippi Coastal Improvements program [USACE, 2016]); Louisiana (the extensive Barrier Island Comprehensive Monitoring Program and database [e.g., Enwright et al., 2020]); and Texas (e.g., Rinaldo et al., 2021; Vinent et al., 2021).
Barrier islands themselves are dynamic features, but under the stresses of RSLR and increasing storm intensity, restoration planning entails even greater awareness of the underlying geology, geomorphology, and transport mechanisms. Justić et al. (2021) reviewed research of transport processes from GoM rivers and estuaries to the coast, shelf, and ocean—information that can be used not just in management of coastal
___________________
32 See https://www.nfwf.org/sites/default/files/gulf/Documents/al-dauphin-assessment-14.pdf.
resources like barrier islands, but also for movement of hydrocarbons or organisms. Processes creating the Gulf barrier islands differ significantly. Rosati and Stone (2009) identified three general regions, based on sediment source, the availability of littoral and inner-shelf sediment, and the underlying substrate in the northern Gulf. They concluded that design for the barrier islands needs to include forcing processes, such as compressibility of substrates; vegetative cover; and aeolian, longshore, and onshore transport.
The barrier islands in the GoM are dynamic features that are important to both natural and human-made environments. Potential impacts on them include changes due to RSLR and storm frequency and intensity, which may affect restoration planning.
Fisheries
State and federal agencies routinely use standardized methodologies to collect data for many fish species across the GoM. When the standardized methodology is not available, one can employ well-defined formulations to convert data to a comparable format (NRC, 2000). Organizations like the Gulf States Marine Fisheries Commission’s GSMFC) Fisheries Information Network33 coordinate the standardization and collection of commercial and recreational fisheries data. NOAA’s fishery monitoring programs in the GoM, especially the Southeast Area Monitoring and Assessment Program (SEAMAP)—a state/federal/university program for the collection, management, and dissemination of fishery-independent data and information in the southeastern United States, including the Gulf of Mexico—along with state fishery-independent monitoring programs--regularly provide accessible databases on fish species. NOAA also maintains databases for both commercial and recreational species for the five Gulf states.34 The primary acquisition of recreationally sourced federal data is through the Marine Recreational Information Program, which has been in existence since 1979 (Keithly and Roberts, 2017).
Grüss et al. (2018) reviewed GoM fisheries monitoring programs and noted that they include many year-round independent fisheries monitoring programs (i.e., data are generated by direct sampling, not from those involved in the fishing activity), more than in other marine regions. Texas has a long-established program that collects independent and dependent data for both commercial and recreational fisheries and has been doing so continuously for more than 45 years (Martinez-Andrade, 2018). The Florida Fish and Wildlife Conservation Commission’s Fisheries-Independent Monitoring group35 is another such program with readily searchable data. All GoM states participate in the SEAMAP,36 whose information is readily available to potential users, including restoration practitioners looking to assess the efficacy of restoration efforts (La Peyre et al., 2019; NASEM, 2017; O’Farrell et al., 2017).
Because fisheries data often go back decades and are likely to continue to be collected, they can be valuable for assessing long-term environmental trends. The robust nature of fisheries data allows comparison and analysis between noncontiguous databases and widely separated study sites. Fisheries data are also integrative with other data like habitat and water quality, so they can be used for filling in data gaps when assessing change. Due to the value of economic impact and regulatory requirements, collection of fisheries data (whether federal or state) will continue independently of any restoration activities that it might inform.
NOAA regularly assesses the status of fish stocks in the GoM37 and elsewhere. In the 2019 assessment, NOAA reported on 15 GoM species and 8 highly migratory species found in the GoM. The data on which such evaluations have been based may also be useful in assessing long-term environmental trends for restoration efforts. Fishery closures in 2010 in response to the DWH spill had a significant, but in most cases short-term, impact on catches. Overall commercial fishery landings declined by 25.3 percent from 2009 to 2010 but rebounded to pre-spill levels within 2 years (Murawski et al., 2016). Murawski et al. (2021)
___________________
33 See https://www.gsmfc.org/fin.php.
34 See https://www.fisheries.noaa.gov/science-and-data.
35 See https://myfwc.com/research/saltwater/reef-fish/monitoring/program.
36 See https://www.gsmfc.org/seamap.php.
37 See https://www.fisheries.noaa.gov/national/sustainable-fisheries/status-stocks-2019.
analyzed long-term trends for 13 key species with temporal ranges from 15 to 30 years, including 3 fish species (menhaden [Brevoortia patronus], spotted seatrout [Cynoscion nebulosus], and red drum [Sciaenops ocellatus]) and white and brown shrimp. Long-term trends of these key species varied in both time and space. This report emphasized the need for continued monitoring of vulnerable species in order to effectively evaluate the impacts of DWH on ecosystems and highlighted the need for continued modeling and evaluation to better understand the efficacy of habitat restoration projects in the GoM (Murawski et al., 2021).
Gulf-wide and state-level commercial and recreational fisheries data collection efforts are robust, as are fisheries-independent data collection efforts at both the Gulf-wide and state levels. The data are collected for commercial and recreational management and are useful for measuring progress toward fisheries restoration goals, and they are also useful in understanding and responding to pressures, such as oil spills.
Birds
Waterbirds use coastal habitats for forage, nesting, or both. Because of their ubiquitous presence along GoM coastal margins, waterbirds may serve as indicators of ecosystem health (Ogden et al., 2014). Similar to fish, bird life histories, including migratory patterns, integrate diverse habitats and have considerable economic (e.g., birdwatching, hunting) and ecosystem value, which has prompted extensive monitoring efforts (DeMaso et al., 2019). Burger (2017) summarized data availability, status, and trends for 15 indicator species and found that monitoring may not be robust, because of differences in data collection methods and number of surveys. In the GoM, there is a concerted effort (the Gulf of Mexico Avian Monitoring Network38) to coordinate the various monitoring efforts to support both management and restoration efforts. Breeding bird surveys (Sauer et al., 2011) are also a good source of data for restoration planners. The North American Breeding Bird Survey is an important resource,39 as are shorebird annual surveys, such as those supported by Audubon.40 In addition, citizen science efforts like eBird,41 Partners in Flight,42 and the Audubon Christmas Bird Count43 may be useful, depending on location and the question being asked (Niven and Butcher, 2011).
Burger (2017) assessed 15 species to examine the health of GoM avifauna before DWH. He found habitat loss, both anthropogenic and natural, was the primary threat facing GoM birds. The results of this analysis show mixed results, with populations of a number of indicator species improving (osprey, brown pelican) or remaining stable (common loon, mottled duck), and others declining or in question (reddish egret, clapper rail). DeMaso et al. (2019) summarized waterfowl trends for many species across the northern GoM, showing similar mixed results. The DWH Trustees published the Strategic Framework for Bird Restoration Activities in 2017. The document outlines restoration goals and outcomes and summarizes progress to date on restoration, as well as monitoring activities underway in the Gulf.44
Long-term trends in waterbirds located in the GoM show mixed results, with some species improving, some remaining stable, and others declining. Habitat loss was the primary stressor. Waterbirds depend on coastal habitats for nesting and foraging and can provide indicators of ecosystem condition and restoration progress. In the GoM, the Gulf of Mexico Avian Monitoring Network coordinates the various monitoring efforts to support both management and restoration efforts.
___________________
38 See https://gomamn.org.
39 See https://www.usgs.gov/centers/pwrc/science/north-american-breeding-bird-survey?qt-science_center_objects=0#qt-science_center_objects.
40 See https://www.audubon.org/content/audubon-coastal-bird-survey.
41 See https://ebird.org/home.
42 See https://partnersinflight.org/what-we-do/science/databases.
43 See https://www.audubon.org/conservation/science/christmas-bird-count.
44 See https://www.gulfspillrestoration.noaa.gov/sites/default/files/wp-content/uploads/Birds_Strategic_Framework_06.23.17.pdf.
Marine Mammals
Marine mammals in the GoM area include the West Indian manatee (Trichechus manatus; limited to Florida) and the common bottlenose dolphin (Tursiops truncates; common across the region) (Ortega-Ortiz et al., 2004). Vollmer and Rosel (2013) provide a review of bottlenose dolphin research in the GoM that could be valuable in assessing this species as an integrative indicator of long-term environmental trends. Bottlenose dolphins are common in waters adjacent to highly populated and industrialized GoM coastal waters and consume large quantities of fish, which may bioaccumulate various toxins (Würsig, 2017). Bottlenose dolphins were found to be some of the most vulnerable to the DWH oil spill due to their strong affinity to specific geographic areas and their surface engagement while breathing (Murawski et al., 2021; Wells et al., 2017). In 2017, the DWH NRDA Trustees published the Strategic Framework for Marine Mammal Restoration Activities, which outlined restoration goals and outcomes and summarized progress to date on restoration, as well as monitoring activities underway (DWH NRDA Trustees, 2017c).
NOAA prepares regular stock assessment reports for all protected marine mammals resident in U.S. waters, including the common bottlenose dolphin.45 The 2018 NOAA assessment looked at 31 bay, sound, and estuary stocks across the GoM but found insufficient data to determine population trends. Status of marine mammal stocks can provide an indicator of recovery from oil spill impacts.
Sea Turtles
There are five species of sea turtles that have been found in the GoM (Hart et al., 2020). Understanding their population abundance is important when developing conservation actions, but it is difficult because of the scale of the turtles’ distribution, migratory nature, and cryptic early life stages (Ceriani et al., 2019). Most U.S. nesting beaches have programs in place to count sea turtle nests (NRC, 2010) and with appropriate coordination and cooperation can provide population estimates that are useful to restoration planners. All five species are found on Florida beaches; since 1979, the Florida Statewide Nesting Beach Survey46 has annually surveyed 215 beaches over 825 miles. In Texas, the Padre Island National Seashore Sea Turtle Science and Recovery Program47 has been in operation since the late 1970s and coordinates nest counts statewide. Long-term trends based on beach nesting data indicate that Kemp’s ridley has made a remarkable recovery from the brink of extinction in the early 1980s and that loggerhead nesting on Florida’s Gulf coast varied annually between 1979 and 2011 (Valverde and Holzwart, 2017). In Alabama, Share the Beach is a volunteer sea turtle nesting and hatching monitoring program founded in 2005, currently supported with funding from the Alabama Trustee Implementation Group Restoration Area.48
Satellite tracking has provided information about forage areas (Gredzens and Shaver, 2020; Shaver et al., 2017) that can be of use to restoration planners. Piacenza et al. (2019) reviewed monitoring strategies in an attempt to improve their value for conservation planning. They found that depending on objectives, 10–20 years of data were adequate for estimating population trends. Because all GoM sea turtles are protected under the Endangered Species Act,49 jurisdiction for their recovery and conservation is shared by NOAA and USFWS, which assures ongoing monitoring to support long-term population assessments. In 2017, the DWH NRDA Trustees published the Strategic Framework for Sea Turtle Restoration Activities. This document outlined restoration goals, as well as progress to date on restoration and monitoring (DWH NRDA Trustees, 2017d).
___________________
45 See https://www.fisheries.noaa.gov/national/marine-mammal-protection/marine-mammal-stock-assessment-reports-species-stock#cetaceans---dolphins.
46 See https://myfwc.com/research/wildlife/sea-turtles/nesting/monitoring/.
47 See https://www.nps.gov/pais/learn/seaturtles.htm.
48 See https://www.gulfspillrestoration.noaa.gov/sites/default/files/2018-06_AL_RP%20II%20Sea%20Turtles%20Fact%20Sheet%204_11_18.pdf.
Long-term trends based on sea turtle beach nesting data indicate that Kemp’s ridley populations have increased since the early 1980s and that loggerhead nesting on Florida’s Gulf Coast varied annually between 1979 and 2011. Because GoM sea turtles are protected, monitoring to support long-term population assessments is assured. Status of sea turtle nesting and hatching can provide an indication of recovery from long-term effects of oil spills, SLR impacts to nesting beaches, and potential effects of changes to foraging areas.
Invasive Species
A Strategy for a Healthy Gulf of Mexico (NOAA, 2015b) recognized invasive species as a significant stress- or, contributing to Gulf-wide habitat loss and ecosystem decline. Florida is particularly susceptible to invasive species because of its location and climate (Doren et al., 2009; Wallace et al., 2016). All Gulf states have active invasive species identification and control programs, as well as searchable databases, and are coordinated with national programs (such as the USFWS Invasive Species Programs50 and the USGS Invasive Species Program51). For example, USGS maintains a nonindigenous aquatic species database52 and provides information on invasive fish.53 GCOOS maintains an interactive map of the invasive lionfish and Asian tiger shrimp,54 and the World Register of Introduced Marine Species55 provides access to a number of databases that may be useful in tracking invasive species.
The Nonindigenous Aquatic Nuisance Prevention and Control Act of 1990 limits the introduction, spread, and impact of aquatic invasive species in U.S. waters. The Gulf of Mexico Program Invasive Species Focus Team’s initial report summarized existing information. Subsequently, the Commission for Environmental Cooperation prepared a report on invasive species status, including an assessment of aquatic invasive species in the Rio Bravo/Laguna Madre Corridor (Mendoza et al., 2011). They noted 373 exotic species, mostly originating from the Atlantic coastal region, and reported that a lack of ecological and biological information hampered efforts to reduce the impacts of these invasive species on GoM biodiversity.
State agencies in the GoM maintain active invasive species programs that are closely coordinated with federal counterparts. However, states do not maintain databases of long-term trends in invasive species distribution or expansions, which would be of value for restoration practitioners. These data, if more readily available, would be useful to restoration planners or practitioners because these plants and animals can affect the success of restoration efforts.
Land Cover Changes
Naturally occurring land cover integrates a given site’s climate, geology and soils, and vegetation over decades or longer. Over shorter time scales, land cover can be affected by naturally occurring disturbances, such as storms, floods, and fires, and human activities, such as population change; industrial, agricultural, or urban development; deforestation or reforestation; water diversion; and infrastructure such as roads.56 Land cover affects or influences environmental conditions in many ways, including water quality, hydrology, and habitat and associated species composition. Changes in land cover can alter hydrologic regimes and runoff patterns, thus potentially acting as a stressor on environmental restoration projects and impacting the cumulative effects of multiple restoration projects.
___________________
50 See https://www.fws.gov/invasives/programs.html.
51 See https://www.usgs.gov/ecosystems/invasive-species-program.
52 See https://nas.er.usgs.gov/.
53 See https://www.usgs.gov/ecosystems/invasive-species-program/science/invasive-fish.
54 See https://gcoos.org/invasive-species/.
The Multi-Resolution Land Characteristics Consortium57 generates land cover information at a national scale for a wide variety of environmental, land management, and modeling applications (Yang et al., 2013). Its products include the National Land Cover Database and the Coastal Change Analysis Program (Jin et al., 2013). EPA’s Report on the Environment58 uses the National Land Cover Database to track trends in and effects of land cover. Karnauskas et al. (2017) summarized land cover change between 1996 and 2010 and found that urban land cover in coastal watershed counties around the GoM increased by 15 percent during this period. While urban expansion is significant across the region, the increase in development occurred at a much higher pace in certain geographic areas, such as Houston, Texas, and Tampa, Florida (Karnauskas et al., 2017) (Figure 2.14).
Urban land cover in coastal areas around the GoM increased by 15 percent between 1996 and 2010, with some geographic areas, including Houston and Tampa, increasing at much higher rates. Data and other materials on land use change are available from the National Land Cover Database and the Coastal Change Analysis Program. Land use changes can have profound effects on coastal habitats and can interact with restoration efforts, including reduced area for restoration and increased stormwater runoff.
Oil Spills
The oil and gas industry is a strong presence in the Gulf of Mexico. There are ~1,862 platforms in the Gulf (as of April 2019)59 and 45,310 miles of pipeline (as of 2016) (Kaiser and Narra, 2019). Production and refining is concentrated in the western Gulf of Mexico: see Figure 2.15. The history of large GoM oil spills is well known, including four very large spills—Ixtoc (1979; 10.2 million barrels of crude oil; Dokken, 2011), Mega Borg (1990; 100,000 barrels; Payne et al., 2005), Deepwater Horizon (> 3 million barrels,60 2010) and Taylor/MC20 (2004–present61). It can often be difficult to quantify exactly how much oil has been spilled; such was the case for DWH. While estimates varied from 3.26 million barrels (Fitch et al., 2013) to 5.14 million barrels (Lehr et al., 2010), the amount decided on for litigation purposes was 3.19 million barrels.62
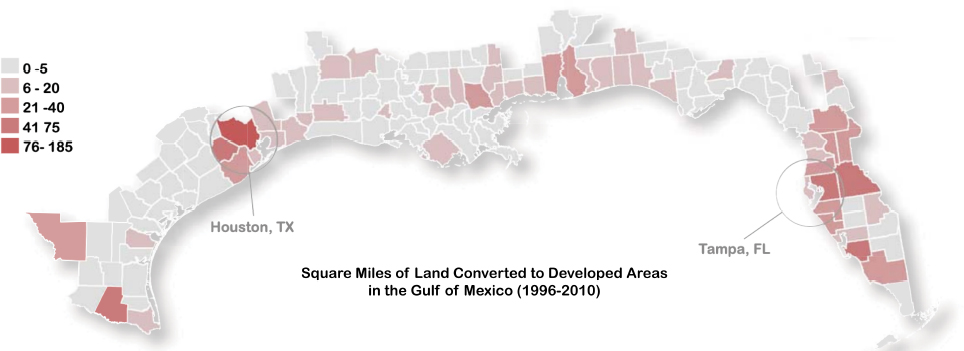
SOURCE: Karnauskas, 2017.
___________________
57 See https://www.mrlc.gov.
58 See https://www.epa.gov/report-environment/land-cover.
59 See https://www.bsee.gov/faqs/how-many-platforms-are-in-the-gulf-of-mexico.
60 See https://www.science.org/content/article/after-geoscientists-joust-judge-rules-bp-gulf-spill-totaled-319-million-barrels-oil
61 See https://darrp.noaa.gov/oil-spills/taylor-energy.
62Consent Decree for Deepwater Horizon—BP Gulf of Mexico Oil Spill: See https://www.epa.gov/sites/production/files/2016-02/documents/deepwaterhorizon-cd.pdf.
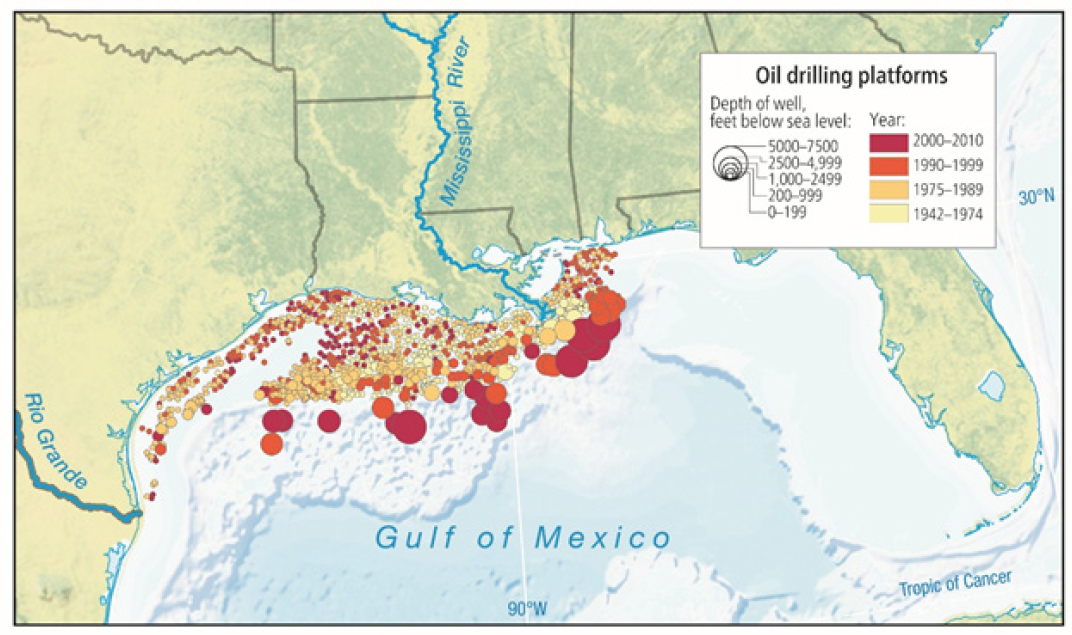
The Taylor oil spill, which occurred in 2004, is still ongoing, and litigation resulted in a settlement in March 2022.63 A NOAA technical memorandum released in 2019 estimated a daily oil flux between 9 and 47 barrels of oil per day using an acoustic survey method, or between 19 and 108 barrels per day using a bubblometer survey method (Mason et al., 2019), resulting in a very rough estimate of between 55,000 to 660,000 barrels released.64 From an environmental management perspective, this may be viewed as a data gap in describing the location, extent, and dynamics of an acute stressor on the biota.
In addition to large-scale oil spills, there are also numerous other incidents involving hazardous materials, the cumulative impacts of which remain unknown. In 2020 and the first 6 months of 2021, there were over 200 oil and chemical spills in the GoM.65 Oil spills in the Gulf of Mexico can occur from pipelines, wells, and transportation. In 2021, the U.S. Government Accountability Office released a report noting that updated regulations are needed to improve pipeline oversight and decommissioning: ~97 percent (18,000 miles) of decommissioned GoM pipelines have been left in place on the seafloor since the 1960s, and there is no funding for removal of these pipelines, even if there are risks of a future spill (GAO, 2021). The risks of pipelines decommissioned in place include not only the oil and gas that remain, but the hazards for commercial fishing or navigation, movement of the pipelines, and interference of other uses of the outer continental shelf.
The imprint of anthropogenic oil is evident on key components of the GoM ecosystem. A 2020 study examining ~2,500 finfish from 359 Gulf-wide locations by the Gulf of Mexico Research Initiative (GOMRI) found evidence of oil exposure in every individual examined, with especially high concentrations in some highly prized recreational or commercial species, including yellowfin tuna, golden tilefish, and red drum
___________________
63 See https://www.doi.gov/restoration/settlement-reached-taylor-energy-oil-spill-largest-oil-spill-you-never-heard
64 Assuming 6,129 days of total oil release (September 16, 2004, to June 28, 2021). This estimate does not account for any capping or capture of oil.
65 Calculated from NOAA’s Office of Response and Restoration raw incident data: https://incidentnews.noaa.gov/raw/index.
(Pulster et al., 2020). Organismal and community responses to oil impacts vary from species to species, with lethal or sublethal effects, including growth inhibition, changes in group behavior, decreased swimming speeds, cardiac defects, reduced immune response, and high reproductive failure rates (Murawski et al., 2021). Shallow ecosystems appear to have more resilience to oil effects than deep sea and mesopelagic systems (Halanych et al., 2021). At the landscape scale, large oil spills such as DWH can affect multiple species or ecosystems. For example, marshes provide important ecological services that can be impacted by oil spills and may be further damaged by recovery efforts, exacerbating impacts and slowing recovery of restored marshes.66
The GoM is also home to natural hydrocarbon seeps, which have existed long enough to be reflected in GoM phytoplankton and bacterial communities (D’souza et al., 2016). There is some evidence that, due to microbial roles in remediation, microbial communities that have evolved with natural seeps may help the GoM recover from man-made spills (ASM, 2020). It is possible that these natural hydrocarbon seeps have primed other organisms to be able to mitigate effects from oil, but that advantage may produce other potential fitness costs to the organism (Murawski et al., 2021).
Oil and other hazardous spills in the GoM are ongoing stressors: understanding of their effects is complicated by naturally occurring hydrocarbon seeps in the region. Because of the amount of oil activity in the Gulf, there are likely to be continuing impacts on organisms, communities, and habitats. NOAA’s Office of Response and Restoration tracks and records oil spills and other incidents.
SUMMARY OF TRENDS AND THEIR IMPLICATIONS FOR RESTORATION DECISION MAKING
Table 2.2 summarizes each of the background trends discussed in this chapter, the implications that each trend has for restoration decision making and information needs. It also provides comments on data availability and selected GoM resources noted for each of these background trends. These trends differ across the GoM, underscoring the importance of considering trends, desired outcomes, and the likelihood of restoration success in the context of the landscape in which restoration projects are implemented. This concept is more fully discussed in Chapter 3.
___________________
66 See https://response.restoration.noaa.gov/sites/default/files/Oil_Spills_in_Marshes.pdf.
TABLE 2.2. Summary of Background Trends
| Background Trend | Summary | Implications for Restoration Decision Making | Information Needs | Comments on Data Availability | Selected Gulf-wide Resources |
|---|---|---|---|---|---|
| CLIMATE CHANGE AS A DRIVER OF LONG-TERM ENVIRONMENTAL CHANGE | |||||
| Relative Sea Level Rise | Long-term trends show an increase in RSLR in the GoM. RSLR rates in Louisiana and northern Texas are among the highest in the nation | Marsh restoration projects may not accrete vertically fast enough to keep pace with RSLR without sediment replenishment | Paucity of tide gauges and dedicated subsidence stations on the Gulf Coast inhibit the ability to accurately estimate rates of RSLR in some areas | The NOAA Tides and Currents website provides access to water levels and tides | https://tidesandcurrents.noaa.gov/ |
| NCCOS1 provides a broad array of predictive tools | https://coastalscience.noaa.gov/project/predicting-impacts-sea-level-rise-gulf-mexico/ | ||||
| Tropical Storms and Hurricanes | Long-term data indicate that intense hurricanes are increasing in frequency | Restoration plans need to include measures to address more intense tropical storm impacts | Existing data and information sources are adequate to track long-term trends in storm patterns in the GoM | NOAA Historical Hurricane Tracks cover 150 years of GoM storms | https://oceanservice.noaa.gov/news/historical-hurricanes/ |
| National Hurricane Data Archive is comprehensive | https://www.nhc.noaa.gov/data/ | ||||
| Sea Surface Temperature | SST has gradually increased in the GoM since the early 1980s | Rising SST can increase coastal hypoxia, which can impact restoration efforts involving shellfish and other organisms | Existing data and information sources appear adequate to track long-term trends in Gulf-wide SST | The EPA SST website and program provides historic data (1880 onward) and are expected to be ongoing | https://www.epa.gov/climate-indicators/climate-change-indicators-sea-surface-temperature#ref6 |
| NOAA SST satellite data for GoM from 2010 to the present, expected to be ongoing | https://www.aoml.noaa.gov/phod/dhos/sst.php | ||||
| Ocean and Coastal Acidification | Subsurface waters in the northwestern GoM are acidifying at a rate greater than the global surface ocean rate. Multidecadal acidification has also been reported for a majority of the Texas and Florida estuaries | Acidifying seawater can affect formation of calcium carbonate shells and skeletons in corals, mollusks, and many phytoplankton species, potentially impacting restoration projects | Especially in the southern GoM, many coastal and estuarine areas and subsurface waters currently have little or no acidification measurement | NOAA’s Ocean Chemistry and Ecosystems Division makes all relevant data available on an ongoing basis; some data go back to 1957 | https://www.aoml.noaa.gov/ocd/ocdweb/occ.html |
__________________
1 See National Centers for Coastal Ocean Science: https://coastalscience.noaa.gov/.
| Tropicalization | Tropical species including mangroves and fish species have been observed year-round in the northern GoM in recent years | Expansion of tropical plant species such as mangroves can encroach upon salt marsh and other restoration efforts | Data from fisheries and wetland species monitoring programs that can be used to track tropicalization within the GoM are limited | NOAA's Atlantic Oceanographic and Meteorological Laboratory regularly produces a series of map and data products relevant to this topic | https://www.aoml.noaa.gov/phod/dhos/index.php |
| WATER, NUTRIENT, AND SUSPENDED SEDIMENT INFLOW TRENDS | |||||
| Freshwater Inflows | Daily streamflow discharge data (excluding the Mississippi River) generally document a downward trend in freshwater inflow to the GoM since the 1960s. Conversely, Mississippi River discharge has increased during this period | Changes in freshwater inflow impact water quality, salinity, sediment inflow, and species composition, all which can affect coastal restoration efforts | Stream gages and data collection and interpretation are limited in many areas of the GoM | Includes 40 years of data | https://pubs.er.usgs.gov/publication/wri954054 |
| Current water data plus historical data, varies by site | https://waterdata.usgs.gov/nwis/rt | ||||
| Nutrient Inputs | Gulf-wide nutrient inputs trends are not available; trends of nutrient loading from specific rivers vary | Nutrient load reduction has been found to be the most effective restoration technique for water quality and SAV in several Florida estuaries | Long-term nutrient loading estimates are limited to several estuaries and the Mississippi River system |
https://nrtwq.usgs.gov/nwqn/#/ https://sparrow.wim.usgs.gov/marb/ https://toxics.usgs.gov/hypoxia/mississippi/nutrient_flux_yield_est.html https://nrtwq.usgs.gov/nwqn/#/GULF https://www.ncei.noaa.gov/maps/gulf-data-atlas/atlas.htm https://data.amerigeoss.org/tr/dataset/gulf-of-mexico-hypoxia-dataset https://gcoos.org/hypoxia-nutrients/ |
|
| Background Trend | Summary | Implications for Restoration Decision Making | Information Needs | Comments on Data Availability | Selected Gulf-wide Resources |
|---|---|---|---|---|---|
| Sediment Inputs | Long-term trends in sediment inflow are limited to the estuarine rivers where long-term sediment data have been collected | Declines in the Mississippi River sediment loads have contributed to marsh loss and may affect restoration plans by limiting the amount of sediment transported from the river | Less than half of the monitoring programs surveyed collect suspended solids data | Data and analysis 1950–2009 |
Heimann et al., 2011 Allison et al., 2012 Allison et al., 2017 Blum and Roberts, 2009 |
| Includes data and analysis from 1973 to 2005 | Harned et al., 2009 | ||||
| Provides a source of documents analyzing GoM sediment loads from various sites | https://www.usgs.gov/science-explorer-results?es=sediment+load+gulf+of+mexico | ||||
| AMBIENT WATER QUALITY OF ESTUARINE AND COASTAL RECEIVING WATERS | |||||
| Salinity | Many GoM estuaries have freshened over the last 20 years, correlated with their distance from the Mississippi River system | Changes in salinity can affect plant and animal distribution and thus impact restoration efforts |
Rodgers and Swarzenski, 2019 Orlando et al., 1993 https://www.ncei.noaa.gov/maps/gulf-data-atlas/atlas.htm?plate=Salinity-Zones https://gcoos.org/temperature-salinity-profiles/ https://salinity.oceansciences.org/science-results.htm |
||
| Eutrophication, Hypoxia, and HABs | Decreases in the area percentage rated “good” for an eutrophication index were observed between two periods, from 1999–2001 to 2005–2006 and from 2005–2006 to 2010. Annual assessment of the extent of hypoxia in the nearshore northern GoM show variability associated with spring rainfall in the Mississippi River watershed | Excessive nutrient loads, hypoxia, and HABs can impact the success of wetlands restoration, oyster projects, and SAV restoration | GoM-wide trends in eutrophication indicators are not readily available; NCCA plans to continue consistent sample collection every 5 years | Historical data from 2013, not current IOC-ICES-PICES Harmful Algal Event database contains bloom data from around the United States, including the GoM |
https://www.ncei.noaa.gov/maps/gulf-data-atlas/atlas.htm http://haedat.iode.org/ |
| Data go back to 2000 | https://tidesandcurrents.noaa.gov/hab/gomx.html | ||||
| Two sites provide access to data from all five Gulf states |
https://www.epa.gov/waterdata/water-quality-data-wqx https://www.waterqualitydata.us/ |
||||
| OTHER SIGNIFICANT GOM ENVIRONMENTAL TRENDS | |||||
| Emergent Wetlands | Approximately 1,000 square miles of emergent wetland were lost between 1996 and 2010, primarily due to open water conversion, and, to a lesser extent, from development and urbanization | Emergent wetlands restoration is a key component of GoM recovery. Addressing issues associated with losses would benefit restoration efforts | A number of agencies collect, map, and interpret information on emergent wetlands at the Gulf-wide scale; interpretation and reporting generally lag data collection by several years | The National Wetlands Inventory includes 50 years of status and trends | https://www.fws.gov/wetlands/status-and-trends/Status-and-Trends-2004-2009.html |
| The Digital Coast includes diverse data and analytical and mapping tools | https://coast.noaa.gov/digitalcoast/ | ||||
| Most current and comprehensive GoM assessment | Handley et al., 2007 | ||||
| Seagrass/SAV | For areas where seagrass maps are available, the Gulf experienced an overall gain in seagrass extent of almost 24% between two time periods (1987–2002 and 2004–2017); gains are associated with improved water quality | Water clarity adequate to support seagrass growth and reproduction is key to seagrass restoration success | Data sources are varied, and support for future Gulf-wide assessments is not assured | Most current and comprehensive GoM assessment | Handley et al., 2020 |
| Analysis of data from 1987 to 2017 | Handley and Lockwood, 2020 | ||||
| Mangroves | Gulf-wide trends since 2004 in mangrove areal extent are not known | The effects of the ongoing colonization of salt marshes in the northern GoM will be an important consideration in salt marsh restoration projects | The National Wetlands Status and Trends program estimates a 0.2% loss in areal extent between 1998 and 2004 | Status and trends 1998–2004, mangroves included in the estuarine shrub classification | Dahl et al., 2011 |
| Oyster Beds | Gulf-wide trends in the extent and condition of oyster reefs are currently unknown | Potential impacts from climatic drivers and anthropogenic stressors, as well as restoration design and implementation, can affect oyster reef restoration | Oyster landing by state and year are available | ||
| Background Trend | Summary | Implications for Restoration Decision Making | Information Needs | Comments on Data Availability | Selected Gulf-wide Resources |
|---|---|---|---|---|---|
| Fisheries | Trends for fisheries species vary in time and space, with some species increasing and others decreasing over the long term | Changes in fisheries stocks and species diversity have been shown to provide indicators of restoration effectiveness | Gulf-wide and state-level commercial and recreational fisheries data collection efforts are robust, as well as fisheries-independent data collection efforts at both the Gulf-wide and state levels | States also monitor fisheries and provide useful data | https://gulfcouncil.org/ |
| Texas has a 45-year record of continuous monitoring and other GoM states up to 20 years | https://www.fisheries.noaa.gov/topic/recreational-fishing-data | ||||
| Waterbirds | Long-term trends in waterbirds located in the GoM show mixed results, with some species improving, some remaining stable, and others declining | Waterbirds depend on coastal habitats for nesting and foraging and can provide an indicator of ecosystem condition | The Gulf of Mexico Avian Monitoring Network2 coordinates the various bird monitoring efforts | Multiple databases, some with records over the last 50 years |
https://www.usgs.gov/centers/pwrc/science/north-american-breeding-bird-survey?qt- https://www.audubon.org/content/audubon-coastal-bird-survey https://ebird.org/home https://partnersinflight.org/what-we-do/science/databases/ Fredrick and Green, 2019a |
| Marine Mammals | The 2018 NOAA assessment found insufficient data to determine population trends | Common bottlenose dolphin status and trends could be integrative indicators of long-term environmental health | Monitoring is ongoing and expected to continue to meet requirements of the Marine Mammal Protection Act | Regularly developed stock assessments include status and trends (if detectable) of all GoM species; began with 1994 amendment of Marine Mammal Protection Act | https://www.fisheries.noaa.gov/national/marine-mammal-protection/marinemammal-stock-assessment-reports-species-stock#cetaceans---dolphins |
__________________
2 See https://gomamn.org/.
| Sea Turtles | Long-term trends based on beach nesting data indicate that Kemp’s ridley populations have increased since the early 1980s and that loggerhead nesting on Florida’s Gulf Coast varied annually between 1979 and 2011 | Because GoM sea turtles are protected, monitoring to support long-term population assessments is assured |
https://www.usgs.gov/centers/wetlandand-aquatic-research-center-warc/science/distribution-and-density-sea-turtles-gulf?qt-science_center_objects=0#qt-science_center_objects https://www.ncei.noaa.gov/maps/gulf-data-atlas/atlas.htm?plate=Reptiles%20-%20Leatherback%20Sea%20Turtle https://www.boem.gov/sites/default/files/environmental-stewardship/Environmental-Studies/Gulf-of-Mexico-Region/Lamont-Hart.pdf |
||
| Invasive Species | There are no states or agencies that maintain databases of long-term trends in invasive species introductions in the GoM region | Trends, if available, would be useful to restoration planners or practitioners because these plants and animals can affect the success of restoration efforts |
https://gcoos.org/invasive-species/ http://issg.org/database/reference/index.asp https://nas.er.usgs.gov https://www.usgs.gov/ecosystems/invasive-species-program/science/invasive-fish?qtscience_center_objects=0#qt-science_center_objects |
||
| Land Cover | Urban land cover in coastal areas around the GoM increased by 15% between 1996 and 2010, with some geographic areas, including Houston and Tampa, increasing at much higher rates | Changes in land cover can alter hydrologic regimes and runoff patterns, thus potentially affecting environmental restoration projects and impacting the cumulative effects of multiple restoration projects | The Multi-Resolution Land Characteristics Consortium3 generates land cover information at a national scale for a wide variety of environmental, land management, and modeling applications | USGS National Land Cover Database includes data from 2001 onward | https://www.mrlc.gov/ |
| Oil Spills | Oil and hazardous spills in the Gulf of Mexico are ongoing stressors, the effects of which are complicated by the naturally occurring hydrocarbon seeps in this region | Because of the amount of oil activity in the Gulf, there are likely to be continuing impacts on organisms, communities, and habitats | NOAA’s Office of Response and Restoration has tracked and recorded oil spills and other incidents since 1985 |
https://incidentnews.noaa.gov/ https://response.restoration.noaa.gov/resources/maps-and-spatial-data https://response.restoration.noaa.gov/oil-and-chemical-spills |
__________________
3 See https://www.mrlc.gov.
NOTES: Data sources for long-term monitoring of Mississippi River status and trends are not included. Refer to text for additional references in each section.
This page intentionally left blank.


