
14
Global Value Chain Measurement Methodology: Challenges and Prospects
Sally Thompson (former deputy director, Bureau of Economic Analysis [BEA], retired) moderated a session on methodological issues in measuring global value chains (GVCs). The session included three speakers: Timothy Sturgeon (senior researcher, Massachusetts Institute of Technology Industrial Performance Center) on GVC measurement issues; Oscar Lemmers (senior researcher, Statistics Netherlands) on challenges in modernizing official business statistics; and Jon Samuels (senior research economist, BEA) on measuring research and development (R&D) and competitiveness for U.S. value-added exports. Francisco Moris (senior analyst, National Center for Science and Engineering Statistics [NCSES], National Science Foundation [NSF]) served as discussant.
Before introducing the speakers, Thompson noted her sadness at the passing of Ray Mataloni, head of the research program in international economics at BEA. He was an expert in multinational enterprise (MNE) data and their use in assessing the economic impacts of globalization and would have very much enjoyed the workshop.
MEASURING GLOBAL VALUE CHAINS
Timothy Sturgeon noted that he was not presenting a paper per se, but rather remarking on key issues he believes are important for the field and referencing relevant papers prepared for the workshop. He has worked on the idea of GVCs for about 25 years and on the measurement of GVCs since about 2006.
Effects of Global Value Chains on the Global Environment
Sturgeon said that our model of trade has historically been based on competitive advantage and foreign direct investment (FDI). Less-developed countries allowed FDI but often had local content requirements. Starting in the
late 1980s and accelerating in the 1990s, especially with China’s accession to the World Trade Organization in 2001, a changed global environment took shape with some special features. These features included vertical specialization in trade and FDI and, starting in the mid-2000s, a push into international trade in services in GVCs; outsourcing and offshoring continued, particularly to India. Most recent changes have included the growth of knowledge and innovation networks and the global fragmentation of R&D (see Gumpert et al., Chapter 2).
The changing global trade environment has, in Sturgeon’s view, complicated matters for policy makers. There are fewer clean industrial policy tools for either developing or advanced countries, whether on the lead firm side or the supplier side. Consequently, policymakers have a big challenge to understand industry value chains in detail. Moreover, industries behave differently in the GVC context, so the demands on the data side are high.
The world has moved from fixed comparative advantage to dynamic comparative advantage, Sturgeon said. Data resources are strong for analyzing trade in goods but weak for trade in services, enterprise characteristics, and intangible assets, although there are some innovative ways to tackle measurement.
Global Supply Chains
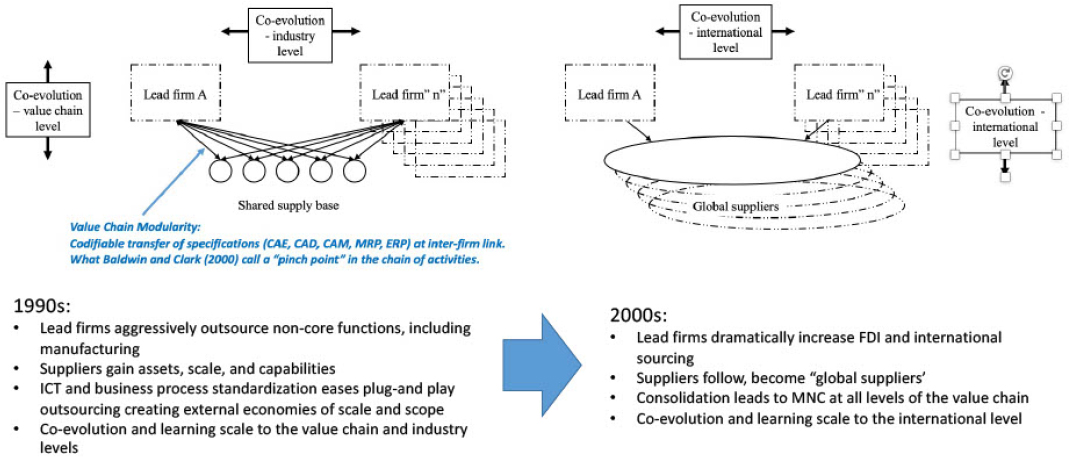
Sturgeon defined supply chains as distinct from GVCs. Any “lead” firm controls a supply base—for example, Ford with its supply base competes against Toyota with its supply base in the United States or internationally. In contrast, the value chain is the whole chain, up to the end users and even farther to recycling—what is known as the circular economy. See Figure 14-1 for a schematic.
While the global economy is a network or a series of nested networks, Sturgeon emphasized the importance of analyzing lead firms, which he defined as not necessarily the largest firms or the best firms but firms that initiate the activities of chains. In other words, lead firms have their own supply chains, as do specific products.
Sturgeon explained that, because lead firms have supply chains, they decide who is in and who is out, giving them buyer power, which is an important role. They also add value of their own in R&D and innovation, and they commonly capture the lion’s share of the rent. Oddly, though, the supply-management literature is focused on the strategy of the lead firm for supply chains and other phenomena but not the added value of the lead firm. On the supplier side, the literature looks at what suppliers are doing and what value they are adding, but not their strategy. Suppliers are trying to make a profit in this environment, and while the literature is very weak on supply chain management, more developed literature might help suppliers know what to do.
Sturgeon noted a key finding in the literature—in the 2000s, lead firms’ outsourcing led to shared supply bases and the emergence of global suppliers. Prior to this period, big firms occupied the front of the value chain and in capital-intensive pieces, such as materials (e.g., steel), but smaller firms made up other
NOTES: FDI = foreign direct investment; ICT = information communication technology; MNC = multinational corporation.
SOURCE: Presentation by Timothy Sturgeon.
links in the chain. That is no longer the case. Working with regional supply bases proved too complex for lead firms, as they went offshore in search of markets and low-cost export platforms. Consequently, there are now huge multinational firms at each stage of the value chain.
Global Value Chains
Sturgeon said there are different perspectives on what constitutes a GVC. The value-added perspective looks at long production chains that cross more than one border. The researchers with whom Sturgeon works ask what happens in a given transaction: Is explicit coordination needed? Is there customization? Are there relationship linkages or modular linkages? Or are the transactions arm’s length?
To address these questions, Sturgeon continued, the field tends to focus on specific intermediate trade flows in complex assembly industries with long supply chains in which explicit coordination is required of the parties. These industries include apparel, electronics, motor vehicles, and commercial aircraft, each having a GVC with a very different shape. Primary commodities—that is, products sold at auction or with an international reference price—are not involved in GVCs.
Sturgeon identified as an important phenomenon the geographic separation of innovation from production, which has led to different outcomes over time in high-income economies (e.g., the United States) compared with middle-income, industrializing, GVC-linked economies (e.g., China). The former exhibit a high share of value capture and control over the industry architecture and trajectory, with de facto standard-setting and buying power; they also exhibit high-market-cap industries with relatively small employment and continued or accelerated secular decline in manufacturing employment. In contrast, such economies as China’s exhibit a low share of value added in GVCs, exclusion from innovation functions and standard setting, employment creation in manufacturing, and a two-tier manufacturing structure for export versus domestic consumption. Such economies can use their foreign-exchange earnings from exports to invest in domestic innovation capacity, as China is trying to do. However, Sturgeon said the jury is out on whether that can actually work. The Chinese semiconductor industry has not gained a substantial portion of market share, despite investing billions of dollars and acquiring equipment and expertise from abroad.
Sturgeon pointed out that, while research tends to focus on bilateral and firm-level dynamics, such as reallocating resources from manufacturing to innovation, this focus can miss industry-level dynamics in which there are positive external-scale economies that build up at the industry level. This focus can also undervalue the innovation and standard-setting benefits from geographic specialization and from supportive domestic institutions and government. There is a reason that Silicon Valley continues to lead in wave after wave of innovation, because those kinds of institutions and standard-setting power are located in the Valley.
Sturgeon noted another phenomenon of interest—geographically embedded capabilities evolve over time, and the geographical specialization evident in GVCs appears to be path dependent. One of Sturgeon’s current projects is looking at the mobile phone handset industry, in which the component supply chain is becoming concentrated in fewer companies, so that it is very geographically specialized. In each geographic specialization, there is a concentration within the vertical segment, creating vulnerabilities in these supply chains as they are dispersed but concentrated in each node such that they are indispensable. For something like a mobile phone handset, substitution is difficult if not impossible; that kind of vulnerability in the supply chain is easy to underestimate and can be exploited or even weaponized. The COVID-19 pandemic revealed the fragility of many supply chains, which were so finely tuned, dispersed, highly efficient, and low cost that there were no buffers or alternative sources. The policy focus on GVCs and supply chains is now intense.
The measurement challenges are obvious. Information on FDI trade by industry, stage in the value chain (primary, intermediate, and final), firm ownership, and knowledge-intensive services is essential but not available. Even lead firms do not know everything that is in their supply chain. So far, solutions to the data problems have been piecemeal. Eurostat’s new GVC surveys (previously called international sourcing surveys), which examine distinct business functions, are the only recent addition to its program to modernize relevant data systems (e.g., Smeets and Warzynski, Chapter 10). Everything else has involved complementary groupings, microdata linking, or mining administrative data in a way to avoid adding cost or burden for respondents (see, e.g., Wang et al., Chapter 3; and Fort et al., Chapter 13). The leveraging of private and semiprivate data can also be useful, but these data are not necessarily a public resource, and research using them is not reproducible.
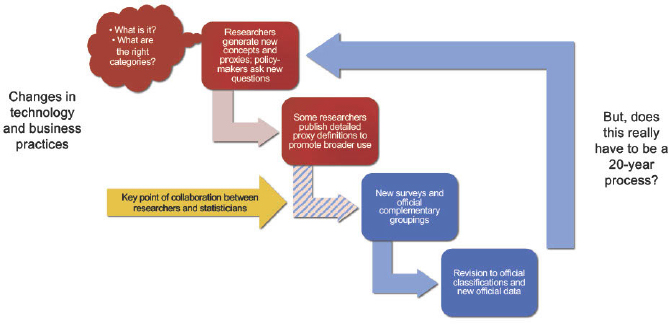
Sturgeon concluded by outlining a process by which the policy, statistical, and research communities can help drive the creation of more relevant and useful statistics (see Figure 14-2). He praised collaborations of researchers with the data-producing community, but asked whether data development and research has to be done on a 20-year cycle.
QUALITY CHALLENGES IN MODERNIZING OFFICIAL BUSINESS STATISTICS
Oscar Lemmers said his organization, Statistics Netherlands, provides scientists with the data they need. He admitted that the cycle of determining needs and providing relevant data can be slow.
Lemmers said he would discuss globalization, reasons why R&D and GVCs are difficult to measure, and potential solutions for the measurement problems—always through the lens of data quality. In quality terms, the questions are whether one is measuring well what one wants to measure or something else, and whether one is measuring well something that is actually useful to the outside world. Of course, the answers to these questions all depend on the specific topics
SOURCE: Presentation by Timothy Sturgeon.
at hand. In general, measurement is easier for one’s own country. Researchers know their own country and the firms there. Firms may even be legally obliged to answer researchers’ questions.
Lemmers stated that R&D as a share of gross domestic product (GDP) is measurable. Much more difficult is measuring how much R&D an industry (high or low tech) is using and how much R&D is coming from one’s own country. He said one always needs to keep in mind that firm-level business statistics only allow us to measure the first step in the chain.
Lemmers revisited the history of R&D measurement. In the past, measurement was comparatively easy—production and R&D were in the same unit, and a statistical agency could send them a survey. Now measurement is more difficult because large firms can and do conduct production and R&D in different units. One way to deal with this problem is to talk with large and important firms to find out their structure and where to obtain information about their R&D. Then one can link microdata on R&D and production in a postprocessing operation.
Of course, many small firms do R&D as well, Lemmers noted, and the statistical agency must be concerned about coverage of the population. A solution could be the use of registers, when firms file for R&D tax credits, for example, or perhaps web scraping.
Lemmers observed that GVCs exacerbate measurement problems because production processes are often split up among units not only in the home country, but also among countries. Lemmers began with the simple case in which a domestic firm buys R&D from a different company in another country. This situation is measurable—there are paid bills for R&D inputs from a different firm. It becomes more difficult if R&D is offshored within the same company. It might appear that there is no R&D, when in fact it is happening abroad. Moreover, R&D from a parent or sister company can be obtained in different ways—not just in a
measurable transfer on the account books, but also through licensing or royalties or something else. Lemmers also noted the role of tax incentives—where do companies want to book their profits? A statistical agency that wants accurate data on any of these aspects of R&D has to reengineer business data to fit the agency’s statistical concepts in order to find out how much has been paid. On the other hand, it may prove infeasible to obtain appropriate data to fit the concept, which means the concept may be beautiful but not useful.
Payment for R&D that involves staff hours can be even harder to measure, according to Lemmers. He gave the example of writing a paper with someone abroad (he recently finished a paper with his Polish colleagues), when one may have no idea how many hours the other people put in. The difficulty is that the data get softer and softer when dealing with services. Lemmers believed there are ways to collect data for most questions, but not everything is feasible.
One approach would be to profile an entire firm worldwide using big data and other sources to understand the structure of the firm. Then the agency could tailor its survey—for example, the survey could ask about the type of R&D arrangements in addition to the value. The agency could also narrow down the population of firms and work with a smaller sample to open the black box and determine where the relevant information is located.
Lemmers believed that while this approach might still involve postprocessing of the data, it could work, although it might not be suitable for regularly issued official statistics because of its time-consuming nature. Researchers, however, could obtain useful information by working at the micro level. They could use an input-output model or look at detailed multiregion supply-use tables. With either approach, researchers would be examining more steps in the global chain, in contrast to business statistics, which traditionally cover only one step.
MEASURING R&D AND COMPETITIVENESS OF U.S. VALUE-ADDED EXPORTS: PROSPECTS AND CHALLENGES
Jon Samuels (BEA) said he would address measuring R&D and competitiveness of U.S. value-added exports. He wanted to emphasize the prospects for measurement, although he understood there are significant challenges. His basic thesis—or major prospect—is that linking value-added trade and KLEMS data1 has the potential to yield important insights into the origins of GVCs and international competitiveness. Samuels asserted that familiar value-chain methods would allow parsing U.S. value added in GVCs, and KLEMS methods would allow identifying the R&D content that is embedded in U.S. value-added exports. Samuels also thought this approach would help identify the origins of economic competitiveness along GVCs. He noted that his work is in a preliminary stage.
___________________
1 KLEMS (K-capital, L-labor, E-energy, M-materials, and S-purchased services) refers to intermediate inputs to the production of goods and services.
Stylized Example: Estimating R&D in $1.00 of Farm Exports
Samuels presented a stylized example of his approach for measuring the R&D content of U.S. exports, using an export of farm product. At first glance, it appears that there is no R&D content in this export, but looking closer at the embedded R&D in the intermediate products needed to produce farm product, such as fertilizers, gives a more accurate measure of the amount of R&D that is embedded in the export. This example helps illustrate how to calculate the full value of R&D in exports by including the embedded R&D in the inputs that go into the exported good.
- Every $1.00 of farm product exported from the United States requires production of $1.25 of product by U.S. farmers and the production of $0.95 of other domestic goods and services that feed into this farm production; the value added by the farm industry in this $1.25 of corn produced, and ultimately in the $1.00 of corn exported, is $0.43 (based on BEA’s domestic requirements table).2
- However, the KLEMS shares indicate that there is $0.00 R&D in the $0.43 value added (from the BEA-BLS Integrated Industry-level Production Account, which gives the capital service share of R&D), giving the impression that there is no R&D content in the export of farm product.
- The solution is to go back to the $0.95 of other goods and services that goes into exporting $1.00 of corn and to decompose this into the value added contributed at each stage of production.
- One of the major inputs is chemical production—$0.07 of chemical-sector input is required, of this $0.03 is value added from the chemical sector (from the domestic requirements table), and $0.014 of this $0.03 is a payment to R&D capital services (from the BEA-BLS Integrated Industry-level Production Account).
- Accounting similarly for all the other intermediate inputs from industries that feed into the agricultural sector gives an estimate of $0.024 embedded R&D from U.S. producers in the $1.00 of exported corn.
Datasets that Enable Estimation of Value-Added R&D
Samuels then turned to the datasets used in the decomposition in his stylized example. The first dataset is the domestic requirements tables, which BEA has published since 2017. They split out imports from total requirements and give the amount of domestic intermediate inputs required, both directly and indirectly, for industries to supply goods and services to final demand.
___________________
2 Samuels clarified that $1 of corn for export requires more than $1 of corn to be produced because corn is also used as an intermediate input in corn production.
While most R&D is not an intermediate input, Samuels said, it is important to know its role in production and how much is embedded in value added and gross exports. This is where the KLEMS statistics come in. This dataset is jointly produced by BEA and the Bureau of Labor Statistics. It includes estimates of R&D’s role in production at the industry level. To measure the R&D component of capital services, one starts with information on how establishments invest in R&D capital stock. The R&D capital stock in turn yields capital service flow into production. The value of these capital services is basically quantity (the productive stock) times price: the perpetual inventory method applied to past R&D investments times the user cost converts to the price of acquiring R&D assets into a flow of capital services.
Samuels explained that linking the estimates of R&D embedded in value added from the BEA-BLS Industry-level Production Account to measures of value-added content embedded in gross exports using U.S. datasets that cover 1997–2019 gives the R&D share and the totals of R&D embedded in U.S. value-added exports and in GDP. It turns out that R&D content embedded in value-added exports is significantly higher than R&D content embedded in GDP. The GDP share of R&D hovered around 3 percent, with perhaps a small upward trend. The R&D share in value-added exports started the period at around 6 percent and ended the period around 8.5 percent. These estimates suggest that, in 2019, embedded R&D was about $149 billion out of a total of about $1.7 trillion in U.S. value-added exports, which is a higher share than the software and information technology (IT) capital services that are embedded in U.S. value-added exports.
Another finding from this approach, Samuels said, is that embedded R&D in value-added exports originate from a few industries. These industries include the chemical sector, the computer and electronic products industry (not surprisingly), and miscellaneous professional and scientific and technical services, which includes the more narrowly defined R&D sector itself. That is, it is these industries that conduct the majority of the R&D that gets embedded in gross exports throughout the entire economy.
Samuels believed the data he discussed are reasonably reliable but could be improved. One area for improvement involves the investment data that feed into BEA’s estimates of capital. These data come from the NSF BERD (Business Enterprise R&D) survey, including estimates of spending on R&D, which BEA in turns adjusts to translate spending into investment. These estimates are by funder of R&D and by company, but BEA needs estimates by establishment and more industry detail. The price and depreciation of R&D investment (which feed into the estimates of the R&D capital stock and capital service measures) is an active area of research. Estimating a rate of return for R&D, which is used in the capital services calculation, is particularly difficult because R&D is inherently risky, and building this risk into the measurement of capital services is a challenge.
The second major dataset required for Samuels’ approach is input-output data and, in particular, the domestic requirements table, which essentially takes total requirements and splits out imports. However, BEA lacks good data on
which imports are used by which industry, so it employs an input proportionality assumption to spread imports across industries based on purchases.
Another major assumption underlying Samuels’ approach is homogeneity of production within industries. Strong evidence suggests that industries that export have different production processes than those that focus on domestic markets. Consequently, one must assume that all establishments within the summary-level industries have the same production technology when one is applying the value-added and KLEMS splits at each chain of production, even though this appears to be at odds with the data.
Additional industry detail would help in identifying R&D’s role in exports and would improve estimates of value-added trade overall. Specifically, it would be possible to define the interindustry purchases necessary to parse out what is coming from where and all the upstream effects that are important when taking the final step to estimate value-added content of exports. Samuels said that BEA has ongoing work in many of these areas. His assessment is that the prospects are significantly greater than the challenges.
Role of Government R&D
Thompson asked Samuels how government R&D is measured in estimating value-added exports. As a long-time agriculture economist, she knows that there is a lot more R&D in corn than that coming from the chemical industry. What about the contributions of the National Weather Service and other government programs? Samuels said that he chose farm as a potentially provocative example. The output of the government does not show up as purchases by an industry. There are good reasons why the official estimates handle government R&D that way, but Samuels agreed that it would benefit estimation of value-added R&D to adjust the official estimates so that government R&D is accounted for as an input. Samuels said there is a survey that attempts to measure R&D by the government sector, and those estimates exist in BEA’s accounts, but they do not at present feed through to the input-output tables.
U.S. AND INTERNATIONAL WORK ON GLOBAL VALUE CHAINS: PAST AND FUTURE
Francisco Moris (NSF) served as the discussant for the session. His goal was to link the presentations to U.S. and international work in the area, identify measurement challenges and opportunities, and present principles for integrating the challenges for measurement of GVCs and intangibles into a “methodologic research agenda.”
International Work on Measuring Globalization and Intangibles
Moris noted that globalization and intangibles have been a constant preoccupation for official statistics for a long time for surveys and national
account purposes. This conference built on reports and conferences over the past 15 years on the intersection of globalization and intangibles and the challenges for official statistics (see Ahmad et al., 2020; Houseman and Mandel, 2015; Houseman and Ryder, 2010; NBER, 2006, 2018; Reinsdorff and Slaughter 2009; Upjohn, 2013; Upjohn and NAPA, 2009).
Moris said that GVCs and intangibles, particularly knowledge flows, have impacted the way everyone thinks about economic statistics. He cited national and international manuals that cover relevant topics:
- 2009 System of National Accounts 2008 (SNA) treated R&D as investment and provided for national/international accounts (European Commission et al., 2009); BEA and NCSES developed an R&D Satellite Account in 2006 with estimates back to 1959 (Okubo et al., 2006, Section 1); 2013 BEA National Income and Product Accounts (NIPA) Comprehensive Revision incorporated R&D in U.S. GDP and related statistics (Kornfeld, 2013); other countries have done much the same.
- 2009 Balance of Payments and International Investment Position Manual (BPM6) provided guidance on treatment of R&D (see especially Table 10.4., Treatment of Intellectual Property, which includes R&D, software, and other intangibles) (IMF, 2009).
- 2010 Handbook on Deriving Capital Measures of Intellectual Property Products provided authoritative guidance (see especially Chapter 2, R&D; Chapter 4, Software/Databases) (OECD, 2010).
- 2010 Manual on Statistics of International Trade in Services (MSITS), provided guidance on foreign affiliates statistics and R&D services (see Annex: Extended Balance of Payments Services [EBOPS] Classification) (United Nations et al., 2012).
- 2012 Guide on Impact of Globalization on National Accounts (see Chapter 7) (UNECE, 2011) and 2015 Guide to Measuring Global Production (see Chapter 4) (UNECE, 2015) provided guidance on intellectual property products (IPPs).
- 2015 Organisation for Economic Co-operation and Development (OECD) Frascati Manual provided authoritative guidance on R&D statistics (see especially the new R&D globalization chapter) (OECD, 2015).
Moris noted that all this work reflected the evolution in economic theory that previous workshop sessions discussed, such as thinking about economic growth in terms of endogenous growth, looking at increasing returns to trade and the role of trading in intermediate inputs, and thinking about MNEs, particularly how companies have moved from production fragmentation to R&D fragmentation. Statisticians and researchers from many countries worked together and eventually convinced official statisticians to be comfortable treating R&D as
within the scope of GDP. This was a very important change internationally and for every country.
Session Papers in the GVC Data Space
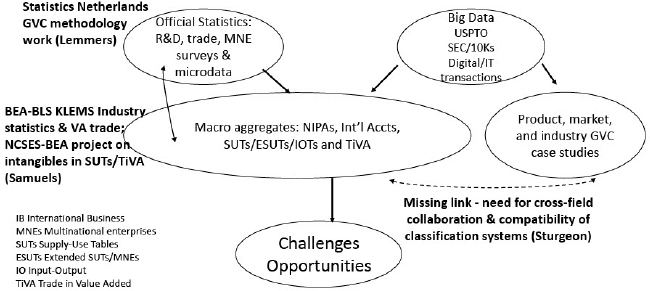
Moris illustrated the GVC data space with a graphic (see Figure 14-3). The figure links official statistics (upper left) and big data (upper right) to macroaggregates, such as national accounts. It also links big data with product, market, and industry GVC case studies (lower right). Macroaggregates, in turn, generate challenges in terms of data gaps and opportunities in terms of new ways to measure GVCs and intangibles. Moris identified a missing link between case studies and macroaggregates (shown as a dotted line in the graphic). Moris located the presentations in the session in Figure 14-3 as follows: Lemmers from Statistics Netherlands fits with official statistics; Samuels from BEA fits with official statistics and macroaggregates; and Sturgeon noted the need for cross-field collaboration and compatibility of classification systems, which would facilitate cross-fertilization of macroaggregates and case studies.
Expanding on the session presentations, Moris observed that Lemmers provided a flavor of some of the methodological challenges in measuring global chains and national and international flows. Samuels described efforts by BEA and other agencies on linking, improving, and integrating data on intangibles for macroaggregates. NCSES just began a project with BEA on intangibles, including data needs and methodologies for supply use and for trade in value added (TiVA).
NOTE: BEA = Bureau of Economic Analysis; BLS = Bureau of Labor Statistics; GVC = global value chain; IT = information technology; KLEMS = K-capital, L-labor, E-energy, M-materials, and S-purchased services; NCSES = National Center for Science and Engineering Statistics; NIPA = national income and product accounts; R&D = research and development; SEC = U.S. Securities and Exchange Commission; USPTO = U.S. Patent and Trade Office; VA = value added.
SOURCE: Presentation by Francisco Moris.
Sturgeon has done relevant work on a variety of topics, but Moris wanted to emphasize his point about the need for better linking of data and the value of case studies.
Data Challenges and Opportunities
Moris noted that, even though the R&D definition is based on the Frascati and other manuals, there are still many practical issues for any survey or macroaggregate dealing with globalization and intangibles. He went on to list four such issues:
- Organizational complexity—As complex and important as MNEs themselves are, many global production arrangements involve contractors and R&D design companies, big and small, adding to the complexity to be measured. It is difficult enough to capture production activity among complex organizations across borders, let alone to capture activity involving intangibles (see UNECE, 2015).
- IPP supply and use—Another challenge is to distinguish production of knowledge—the supply of R&D, perhaps—from its use and ownership. For intangibles, this is difficult by definition because intangibles are often jointly produced and used within and across organizations. This phenomenon obscures who benefits from R&D or knowledge in general and where (see IMF, 2009; UNECE, 2015).
- Classification issues—One issue is the focus of transactions that a given survey asks about. Is it current-year R&D? IPP charges from past R&D? R&D commingled with other intangibles? This gets complicated for classification of products or services for balance-of-payment purposes or classification systems for R&D and industry, such as companies that do manufacturing only under contract or companies that provide design services. Another classification issue is the distinction between property income and payment for services (see Chapter 7, “International Transactions in Intellectual Property Products,” UNECE, 2011).
- Valuation—One question is how close is a reported value to an arm’s-length transaction, and therefore how can it best be priced (see OECD, 2017).
Opportunities for Collaboration
Moris identified opportunities for intracountry collaboration by national statistical agencies with administrative agencies and big data sources, including survey development, concordance of business/MNE registers, large-scale data-linking and integrated business statistics programs, and aggregates for IPPs in
national and international accounts. Opportunities for international collaboration (bilateral, regional, within international organizations) include implementing IPP material in the manuals for statistics on globalization cited previously, developing a three-way concordance among MSITS/EBOPS 2010, CPC (central product classification), and the new Eurostat Business Functions platform, and establishing working groups on a research agenda for the SNA.
Principles for Data Integration
Moris finished by offering a couple of principles for integrating research on methods for measuring GVCs and intangibles. Most important, future work should build on international research agendas and collaborations that are already in place and then move from there.
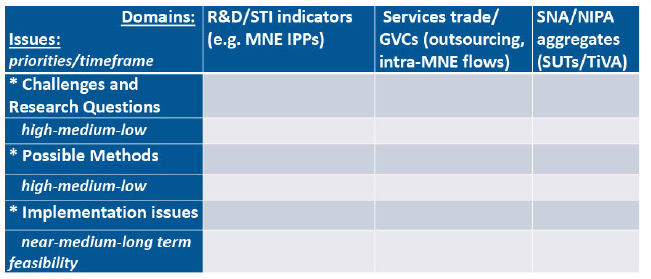
He proposed an integrative framework to summarize challenges, possible methods, and implementation issues. The framework has three domains: R&D/science, technology, and innovation (STI) indicators; services trade/GVCs; and SNA/NIPA aggregates. It also has three issue areas: challenges and research questions, possible methods, and implementation issues. Entries in this matrix would identify projects in terms of high, medium, and low priority (see Figure 14-4).
ADDITIONAL COMMENTS
Thompson thanked everyone for keeping so many complex ideas in front of the workshop participants. She began an open discussion period with a comment. When she started work at BEA in the international area, she wanted
NOTES: GVC = global value chain; IPP = intellectual property product; MNE = multinational enterprise; NIPA = national income and product accounts; R&D = research and development; SNA = System of National Accounts; STI = science, technology, and innovation; SUT = supply-use table; TiVA = trade in value added.
SOURCE: Presentation by Francisco Moris.
BEA researchers to understand the complexity of measuring GVCs. She invited an executive from a large computer services corporation to speak about the company’s intellectual property and how they managed the billing for that within their company and how the work was organized.
She learned that the company did it all through their people’s salaries in different parts of the world. With staff in Brazil, Germany, and India, they were creating new high-tech software for customers, whom they billed from headquarters. It is hard to think about how to apportion these costs among the various countries’ economies. She said the large case unit approach taken by some national statistical agencies makes a lot of sense, particularly for very big companies.
Sturgeon said he was struck by Lemmers’ remarks about how to fill in some of the data gaps around R&D by profiling multinational firms or firms using GVCs to source R&D. Instead of talking to an important IT services firm in one’s country, the task is now to make a global odyssey to talk with big companies to find out how they manage production and R&D. Globalization has made everyone’s life more challenging in terms of research.
Samuels wanted to call out the collaborative project Moris mentioned between BEA and NCSES to use the official data to refine the estimates of value-added chains and the role of the United States, using more industry detail and looking at the role of intangibles. Samuels is looking forward to seeing public results from that project in the near term.
Moris said that, given the many colleagues from overseas in the conference, he wanted to emphasize that the United States has done a great deal of work with colleagues at OECD and other organizations. For an issue so complex as globalization and intangibles, international collaboration is fundamental for countries to learn from each other how to better understand the effects of intangibles on productivity and output.
Lemmers added his support for talking to firms to learn how they work, and adapting surveys accordingly and testing concepts. Such testing is essential for determining practical measures. If testing shows that a concept is not working, then statistical agencies need to change course.
This page intentionally left blank.


