
Appendix B
Key Trends in Demographic Diversity in Clinical Trials
Jakub P. Hlávka1
BACKGROUND
Insufficient demographic diversity in clinical trials has long been recognized as an issue that may hinder innovation and access to therapies. In the past three decades, however, diversity in clinical trials became a policy priority, advanced by federal agencies such as the Food and Drug Administration (FDA) Office of Women’s Health and the Society for Women’s Health Research (SWHR), and later by the FDA Office of Minority Health (OMH), established in 2010 (FDA, 2011). In 1992, the General Accounting Office (GAO)—the historical predecessor to the Government Accountability Office—released the report Women’s Health: FDA Needs to Ensure More Study of Gender Differences in Prescription Drug Testing, ushering a new era of focus on the issue of diversity in clinical trials.
Soon after, the National Institutes of Health Revitalization Act of 1993 followed, which directed the National Institutes of Health (NIH) to establish guidelines for inclusion of women and minorities in clinical research (P.L. 103-43). Since then, multiple guidelines and regulatory documents have addressed the issue, including a 1993 guidance on the study and evaluation of gender difference in clinical trial evaluation of drugs, which lifted restriction on participation by most women with childbearing potential (FDA, 1993, 2020b). In 2008, the ClinicalTrials.gov results database was launched to implement Section 801 of the FDA Amendments Act of 2007, or FDAAA 801 (P.L. 110–85), which requires the submission of “basic results” for applicable clinical trials (ACT) no later than 12
___________________
1 Available at jakub.hlavka@usc.edu.
months after their primary completion date.2,3 The submission of adverse event information has been required since September 2009. Basic results are defined as (a) participant flow, (b) baseline characteristics, (c) outcome measures and statistical analyses, and (d) adverse events.4
More recently, the FDA Reauthorization Act of 2017 (FDARA) made a reference encouraging the “enrollment of more diverse patient populations,” and the Final Rule for Clinical Trials Registration and Results Information Submission (42 CFR Part 11) went into effect in January 2017.5 The rule requires the submission of “baseline or demographic characteristic measured in the clinical trial, including age, sex/gender, race, ethnicity (if collected under the protocol)” for trials that are required to be registered under Section 11.22 (Phase 1 trials are excluded),6 for reporting purposes via ClinicalTrials.gov.7 A 2020 FDA Guidance for Industry (FDA, 2020) made the following (nonbinding) calls to action focusing on8
- broadening eligibility criteria and avoiding unnecessary exclusions for clinical trials;
- developing eligibility criteria and improving trial recruitment so that the participants enrolled in trials will better reflect the population most likely to use the drug, if the drug is approved, while maintaining safety and effectiveness standards; and
- applying the recommendations for broadening eligibility criteria to clinical trials of drugs intended to treat rare diseases or conditions.
In November 2020, the FDA issued its guidance on “Enhancing the Diversity of Clinical Trial Populations,” which considers both demographic characteristics of study populations (e.g., sex, race, ethnicity, age, location of residency) and non-demographic characteristics of populations (e.g., patients with organ dysfunction, comorbid conditions, disabilities, those at the extremes of the weight range, and populations with diseases or conditions with low prevalence) (FDA,
___________________
2 See https://clinicaltrials.gov/ct2/about-site/results.
3 Applicable clinical trials “generally include interventional studies (with one or more arms) of FDA-regulated drug, biological, or device products that meet one of the following conditions: a) The trial has one or more sites in the United States; b) The trial is conducted under an FDA investigational new drug application or investigational device exemption; c) The trial involves a drug, biological, or device product that is manufactured in the United States or its territories and is exported for research.”
4 See https://clinicaltrials.gov/ct2/about-site/results.
5 See https://clinicaltrials.gov/ct2/manage-recs/fdaaa.
6 See https://ecfr.federalregister.gov/current/title-42/chapter-I/subchapter-A/part-11/subpart-B/section-11.22.
7 See https://ecfr.federalregister.gov/current/title-42/chapter-I/subchapter-A/part-11.
8 It also referenced other policy documents, including the 1993 International Conference on Harmonization (ICH) guideline, which advised against arbitrary upper-age cutoffs in clinical trials that may result in underrepresentation of older adults. In that document, ICH representatives recognized important pharmacokinetic differences between younger and older patients related to renal and hepatic function, as well as drug-drug interactions.
2020b). This guidance also describes “enrichment strategies”—targeted inclusion of certain populations with the goal to more readily demonstrate a drug effect—and recommends that even with enrichment, trials should keep their enrollment criteria as broad and representative as possible.
The guidance also listed approaches that can improve diversity of enrolled participants, including
- making trial participation less burdensome for participants;
- adopting enrollment and retention practices that enhance inclusiveness, such as public outreach, education, community engagement, include varied geographic locations, offer multilingual resources, use real-world data, leverage social media, etc.; and
- offering expanded access—to diagnose, monitor, or treat a patient’s condition as part of a clinical trial (this may help identify patients for subsequent studies).
This Appendix offers a brief overview of trends in diverse enrollment and data reporting across clinical trials, and references lessons-learned and insights from other research related to demographic diversity in trial enrollment.
PAST EVIDENCE
Historically, data on population demographics across clinical trials have not been consistently reported, particularly prior to the 2017 guidance, which requires reporting by sex/gender, race, and/or ethnicity in applicable clinical trials. Evidence so far has emerged in multiple individual research reports on different aspects of diversity in clinical trials.
Reporting of Demographic Data
Demographic data of enrolled participants in clinical trials in the United States is most transparently collected by ClinicalTrials.gov, a registry maintained by the National Library of Medicine at the NIH. Additional reporting on NIH-funded research (intra- and extramural) has recently also been reported by NIH institutes and centers. In both cases, limitations to how often and comprehensively data are made available have made longitudinal institute-level data difficult to examine. As we show below, not all trials report their demographic characteristics—further work to improve the level and quality of reporting is still needed.
Past Research on Gender Diversity
Despite the regulatory efforts to increase gender diversity in trial enrollment, some have suggested limited progress has been made (Clark et al., 2019). This
is particularly significant given that sex differences are observed in response to some drugs, including the prevalence of adverse events (Anderson, 2005; FDA, 2011). Evidence from the 1990s and early-2000s suggested relative underrepresentation of women and ethnic minorities in clinical trials (Mak et al., 2007).
A 2012 study has documented an increase in the reporting of trial characteristics in ClinicalTrials.gov in interventional trials from 2007 to 2010 (Califf et al., 2012). Geographic differences and therapeutic areas were linked to diverse trends in gender- and age-specific enrollment.
More recent work has confirmed the challenge of enrolling women in some therapeutic areas: in stroke clinical trials, for instance, women have been underrepresented even after incidence and prevalence of the disease is taken into account (Carcel, 2021), with highest underrepresentation reported in secondary prevention trials (10 percent in one study) (Strong et al., 2020).
However, it appears that the trend has been improving in some areas. For example, somewhat optimistic results were described in a subset of pivotal trials (Phase 2 and 3 trials in support of drug/biologic approval) studied by Eshera et al. (2015): in studies of drugs approved between 2010 and 2012, just 45 percent of trial participants in small molecule trials were women, but they represented 65 percent of participants in biologic trials (based on Drugs@FDA data). The authors concluded that 82 percent of trials had a study population representative of the sex distribution in the intended patient population, but that minority groups still had lower participation rates than would be representative (with 77 percent of participants white, population average 72 percent) (Eshera et al., 2015).
Non-Gender Diversity Measures
Numerous studies have focused on the reporting of diversity in non-gender domains, such as the age of participants (relative to prevalent disease populations) and the reporting by ethnic or racial groups. Highlighted here are several specific studies that provide illustrative evidence of underrepresentation of specific groups in clinical trials in the past two decades.
In 2003, a study of 495 cancer trials between 1997 and 2000 indicated that elderly participants comprised 32 percent of participants in Phase 2 or 3 clinical trials, compared with 61 percent of patients with incident cancers in the United States who are elderly (Lewis et al., 2003). This was more pronounced in trials for early-stage cancers, with protocol exclusion criteria on the basis of organ-system abnormalities and functional status limitations being associated with lower elderly participation (the authors estimate that relaxing those eligibility restrictions would increase their share to 60 percent) (Lewis et al., 2003).
A 2004 analysis of cancer clinical trials made similar conclusions: it found a higher enrollment fraction (relative to incident cases) in younger cohorts—3.0 percent for patients 30–64, 1.3 percent for 65–74, and 0.5 percent for patients 75 and older (Murthy et al., 2004). Hispanic and Black patients were 28 percent and
29 percent less likely to enroll than white patients after adjustment for incidence, age, and other factors. The difference was largest in lung cancer, where Black patients were 39 percent and Hispanic patients 53 percent less likely to enroll than white patients.
Another study of oncology trials conducted between 1994 and 2015 calculated the difference in the age of trial participants and the disease population they studied (Ludmir et al., 2019). For most diseases, trial populations were younger than the population median age, with an average difference of 6.49 years (highest in lung cancer—8.98 years), and higher among industry-funded trials.
A recent study of 230 vaccine trials from 2011 to 2020 indicated that white participants tend to be overrepresented, while Black and other minorities tend to be underrepresented. The enrollment of Asian individuals was similar to U.S. Census estimates (Flores et al., 2021). Only about 12.1 percent of participants in vaccine trials were over 65 years of age. A report on the diversity of mRNA vaccine trials for COVID-19 by the Kaiser Family Foundation has found a relatively higher share of white participants in both trials compared with the U.S. population, resulting in relative underrepresentation of Black and Asian participants. However, the participation of Hispanics exceeded the share of Hispanics in the U.S. population (Artiga et al., 2021). These results, however, originate from trial sites within and outside of the United States (notably Europe and Latin America), which may explain some of the relative overrepresentation of white participants.
Even more recently completed trials have struggled with diverse enrollment—a Phase 2 trial of crenezumab in Alzheimer’s disease with 360 participants across 83 sites in 6 countries reported 97.5 percent of participants being white, and only 2.8 percent of all participants being Hispanic, for example (however, women consisted of 55.3 percent of all participants).
Barriers to Diversity
Participation of older adults in cancer clinical trials has not changed over time (Sedrak et al., 2021). Numerous studies have been published on barriers to clinical trial participation by underrepresented groups. Participation of older adults in cancer trials has often been identified as hindered by eligibility criteria, concern for toxicity, concern for patient age, patient knowledge and transportation limitations, and others such as time/burden issues and willingness to participate (Sedrak et al., 2021). Specific barriers that participants face may include (1) mistrust, (2) lack of comfort with the clinical trial process, (3) lack of information about clinical trials, (4) time and resource constraints associated with participation, and (5) lack of awareness about the existence and importance of clinical trials (Clark et al., 2019).
In the mental health area, a review has identified additional challenges, including transportation difficulties, distrust and suspicion of researchers, and stigma attached to mental illness (Woodall et al., 2010). The review included
an Alzheimer’s disease case study that showed increased participation by Black patients by more than 100 percent when educational strategies and compensation for travel costs were introduced in a trial. Another study of key barriers in Alzheimer’s disease research has indicated that enrollment challenges result in slower and more expensive trials, suggesting the need for nationally coordinated efforts to increase diverse participation in clinical trials in this and other disease areas (Malzbender et al., 2020).
RECENT EVIDENCE
Demographics of Trials Resulting in FDA Approval
Participation of Females
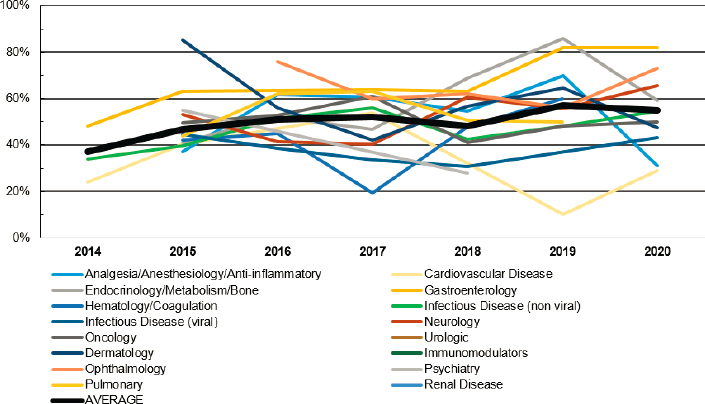
We find that the positive trend of increasing representation of females in trials that have resulted in FDA approval has been relatively consistent. Among drugs that have been approved in recent years, the average share of females in the trial population has been consistently reported since 2014 by the FDA, with the average share of 51 percent between 2014 and 2021, ranging from 37 percent in 2014 (six trials) to 57.1 percent in 2019. We analyze 290 approvals for which demographic data are reported in the FDA Snapshots between 2014 and 2021 (as of May 1, 2021). While the mean (unweighted) representation of females achieving an average of 51 percent between 2014 and 2021, ranging from 37 percent in 2014 (six trials) to 54.8 percent in 2020 (data for 2021 are partial only). Prior to 2021, females represented greater than 50 percent of trial participants over at least 5 years in the areas of ophthalmology, gastroenterology, and endocrinology/metabolism/bone. In turn, men have represented greater than 50 percent of trial participants over at least 5 years in the areas of cardiovascular disease and infectious disease (viral). Representation of females across all trials and by therapeutic area is indicated in Figure B-1.
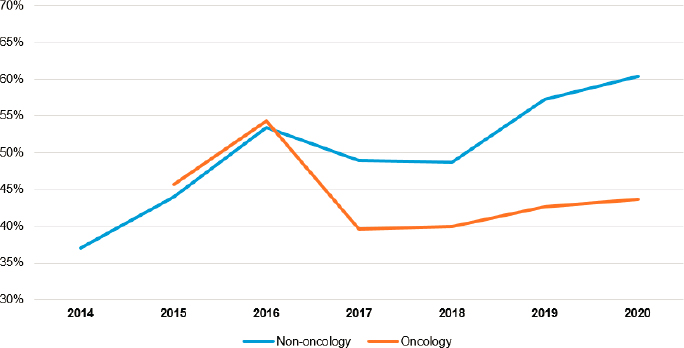
We also find women to be relatively more represented in non-oncology trials between 2014 and 2021 (non-gender-specific trials only), as shown in Figure B-2.
Participation of White Patients
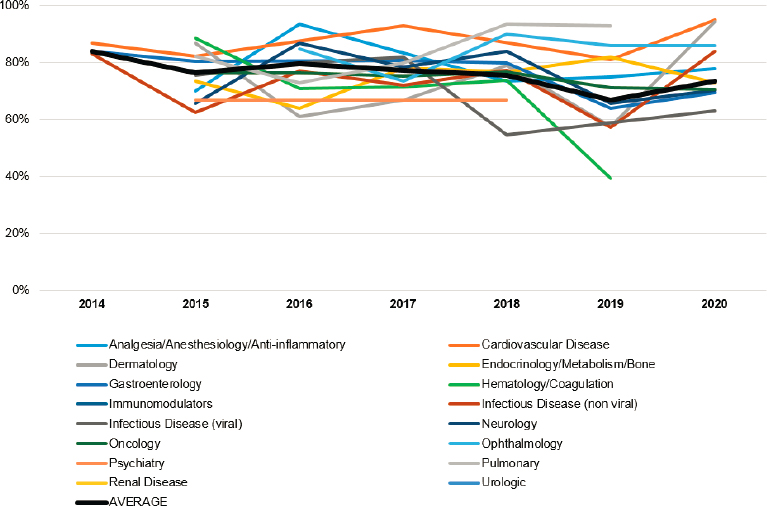
Among approved drugs, participation of white patients has ranged from 84 percent in 2014 to 73.7 percent in 2020, indicating a relatively consistent decrease in the share of white participants in trials resulting in FDA approval during this period (2021 data are yet incomplete). Figure B-3 shows trends by approvals and therapeutic areas in. Prior to 2021, white patients represented greater than 70 percent of trial participants over at least 5 years in the areas of analgesia/anesthesiology/anti-inflammatory, cardiovascular disease, endocrinology/metabolism/bone, infectious disease (nonviral), oncology, ophthalmology, and pulmonary.
SOURCE: Analysis of FDA Drug Trials Snapshots as of May 2021.
Participation of the Elderly
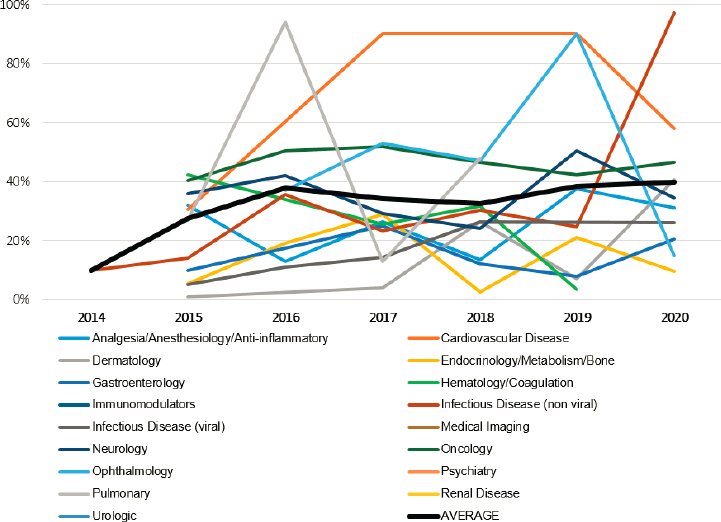
Among approved drugs, participation of patients over 65 has ranged from 10 percent in 2014 to 39.9 percent in 2020, indicating a consistent increase in the share of elderly participants in trials resulting in FDA approval during this period (2021 data are yet incomplete). Figure B-4 shows trends by approvals and therapeutic areas. Prior to 2021, elderly patients represented at least 25 percent of trial participants over at least 5 years in the areas of cardiovascular disease, neurology, and oncology. In none of the years for which reporting is available, elderly patients represented greater than 25 percent of trial participants in the areas of gastroenterology, renal disease, psychiatry, and dermatology.
Demographics of Trials Funded by NIH Institutes/Centers
A review of participation in clinical research funded by different NIH institutes and centers revealed that participation by females has been steadily increasing over 2013–2018 for which data are available (no data were reported in 2015, but reporting requirements changed in FY 2016, resulting in an increase in
participants reported across NIH institutes and centers).9 Across all NIH institutes and centers, mean representation of females in trials was 44.3 percent in 2013, 47.2 percent in 2014, 54.1 percent in 2016, 47.9 percent in 2017, and 52.4 percent in 2018 (on average 22.1 million participants were included in NIH-funded trials during each of these annual reporting periods).
As shown in Figure B-5, among the top 10 largest institutes/centers by trial enrollment (which represent 89.7 percent of enrollment across all institutes/centers), females represented at least 50 percent of participants in trials supported by the National Institute of Environmental Health Sciences, the National Institute of Diabetes and Digestive and Kidney Diseases, and the National Institute of Child Health and Human Development across all years of reporting, and at least 50 percent of participants in at least 3 years of reporting in trials supported by the National Institute on Aging, the Clinical Center, the National Institute of Allergy and Infectious Diseases, and the National Heart, Lung, and Blood
___________________
9 Changes included the requirement for career development awards (Ks) and fellowships (Fs) to report inclusion data, and the NIH stopped granting exceptions for use of existing datasets or resources, early-phase feasibility studies, and others.
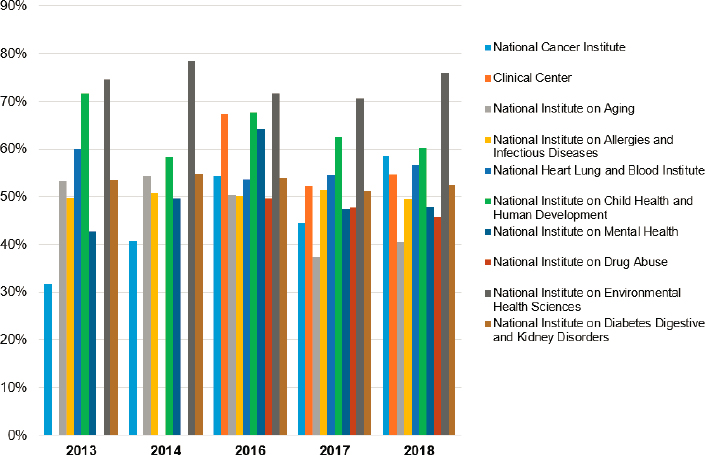
Institute. Across all 5 years of reporting, females never exceeded 50 percent of participants in trials supported by the National Institute on Minority Health and Health Disparities and the National Institute on Alcohol Abuse and Alcoholism.
The reporting on participation by ethnic minorities in NIH reports is less consistent. However, ethnicity data are more available than race demographics data, as shown in Table B-1.
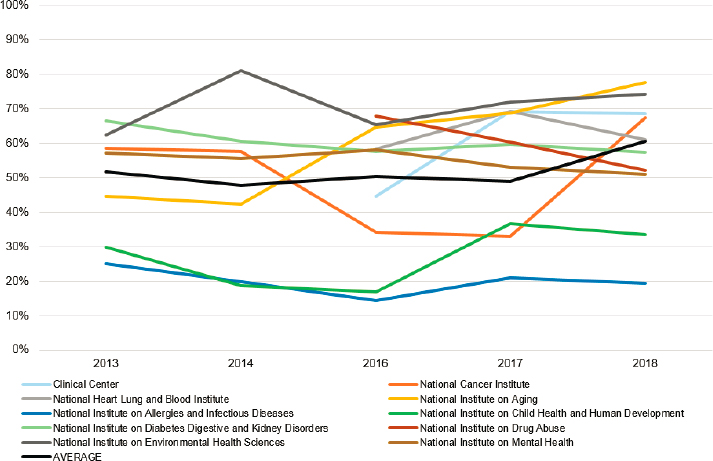
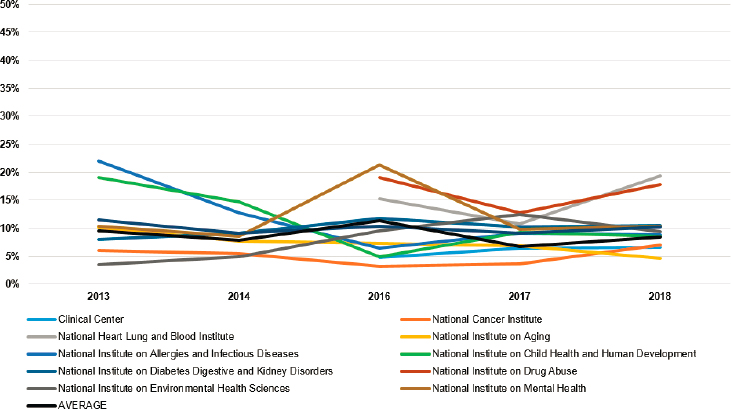
In Figure B-6, the share of white participants in clinical trials sponsored by top NIH institutes is reported. These results show a relatively stable trend, with the weighted average of white participants among the top 10 institutes ranging from 51.8 percent in 2013 to 60.6 percent in 2018 (this trend mirrors that of all NIH-sponsored trials, as shown in Figure B-1). The lowest representation of white participants was in trials sponsored by the National Institute of Allergy and Infectious Diseases and the National Institute of Child Health and Human Development (both consistently less than 50 percent). The U.S. Census estimate of white Americans (alone, not Hispanic or Latino) as a share of the U.S. population was 60.1 percent in 2019 (white alone without ethnicity specification was estimated at 76.3 percent of the U.S. population).10
In Figure B-7, the share of African American/Black participants in clinical trials sponsored by top NIH institutes is reported. These results show a relatively stable trend, with the weighted average of African American/Black participants
___________________
10 See https://www.census.gov/quickfacts/fact/table/US/PST045219.
TABLE B-1 Demographics of Participants in Trials Supported by NIH Centers and Institutes
| 2013 (%) | 2014 (%) | 2016 (%) | 2017 (%) | 2018 (%) | |
|---|---|---|---|---|---|
| Female | 44.3 | 47.2 | 54.1 | 47.9 | 52.4 |
| American Indian | 2.1 | 1.3 | 0.8 | 0.7 | 1.0 |
| Asian | 15.1 | 17.2 | 8.4 | 26.4 | 7.8 |
| Black/African American | 12.2 | 14.3 | 10.0 | 10.8 | 13.5 |
| Native Hawaiian/Pacific Islander | 0.3 | 0.3 | 0.6 | 0.1 | 0.2 |
| White | 52.9 | 49.5 | 49.6 | 49.9 | 60.0 |
| More than 1 race | 1.1 | 1.1 | 2.0 | 1.9 | 2.3 |
| Unknown race | 1.1 | 1.1 | 2.0 | 1.9 | 2.3 |
| Hispanic | 9.8 | 8.1 | 10.8 | 6.7 | 8.5 |
| Non-Hispanic | 86.1 | 89.6 | 62.6 | 81.8 | 76.2 |
| Unknown ethnicity | 4.1 | 2.3 | 22.4 | 9.8 | 12.0 |
| Sum of all races | 84.7 | 84.8 | 73.5 | 91.8 | 87.2 |
| Sum of all ethnicities | 100.0 | 100.0 | 95.8 | 98.3 | 96.7 |
among the top 10 institutes ranging from 11.9 percent in 2013 to 12.3 percent in 2018. The highest representation of African American/Black participants was in trials supported by the National Institute of Allergy and Infectious Diseases (greater than 25 percent in all years). The lowest representation of African American/Black participants was in trials sponsored by the National Cancer Institute (reaching 10.5 percent at most). The U.S. Census estimate of Black or African Americans (alone) as a share of the U.S. population was 13.4 percent in 2019.11
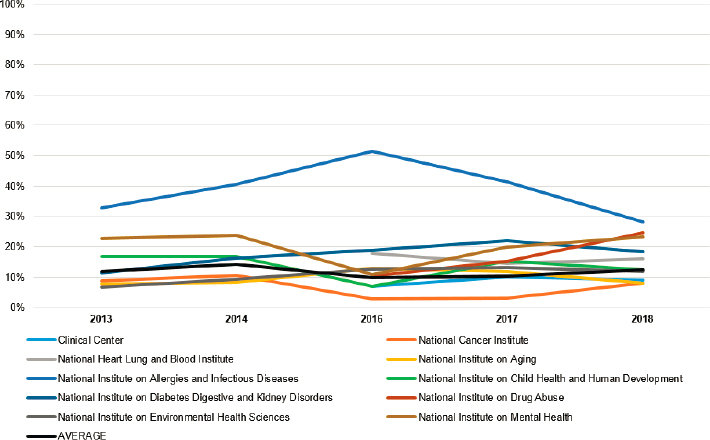
In Figure B-8, the share of Asian participants in clinical trials sponsored by top NIH institutes is reported. These results show a less stable trend, with the weighted average of Asian participants among the top 10 institutes ranging from 8.2 percent in 2016 to 27.7 percent in 2018 (driven by large Asian enrollment in National Cancer Institute trials during that year). The highest representation of Asian participants was in trials supported by the National Institute of Allergy and Infectious Diseases (greater than 20 percent on average). The lowest representation of Asian participants was in trials sponsored by the National Institute of Diabetes and Digestive and Kidney Diseases (averaging under 5 percent). The U.S. Census estimate of Asian Americans (alone) as a share of the U.S. population was 5.9 percent in 2019.12
In Figure B-9, the share of Hispanic participants in clinical trials sponsored by top NIH institutes is reported. These results show a relatively stable trend,
___________________
11 See https://www.census.gov/quickfacts/fact/table/US/PST045219.
12 See https://www.census.gov/quickfacts/fact/table/US/PST045219.
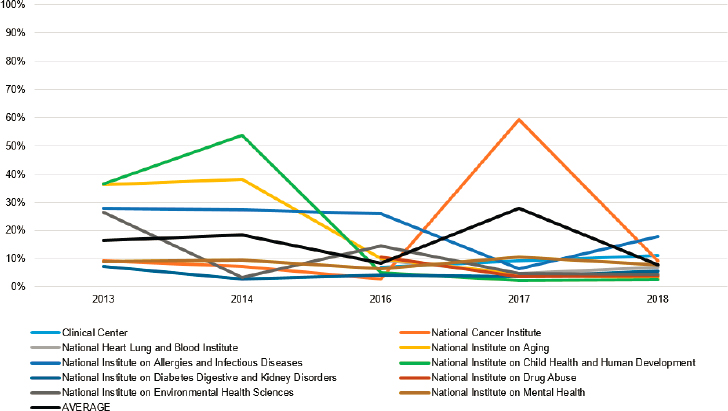
with the weighted average of Hispanic participants among the top 10 institutes ranging from 6.7 percent in 2017 to 11.3 percent in 2016. The highest representation of Hispanic participants was in trials supported by the National Institute on Drug Abuse (greater than 16 percent on average). The lowest representation of Hispanic participants was in trials sponsored by the National Cancer Institute and
the Clinical Center (both under 6 percent). The U.S. Census estimate of Hispanic Americans as a share of the U.S. population was 18.5 percent in 2019.13
In the Supplementary Material section, we report key characteristics of Phase 3 trials only. Of note, female participation in Phase 3 trials has been higher relative to all trials in all reporting periods except for 2016 (the highest difference in relative representation of females was observed in 2013, where Phase 3 trials reported 64.2 percent females, while all trials reported just 44.3 percent females).
Reporting Gaps
As indicated above, data for racial and ethnic and subgroups in clinical trials have not been consistently reported in NIH-supported trials, with just 73.5–91.8 percent of participants reported with their race over the period for which reporting is available. Ethnicity information (Hispanic/non-Hispanic) has been more consistently tracked, with 95.8–100 percent of participants assigned ethnicity. Reporting of ethnicity was 100 percent complete for Phase 3 trials, where reporting was completed, and race information was available in at least 92.9 percent of trial participants in Phase 3 trials supported by NIH centers and institutes, suggesting the gaps in minority reporting originate predominantly in earlier-stage trials.
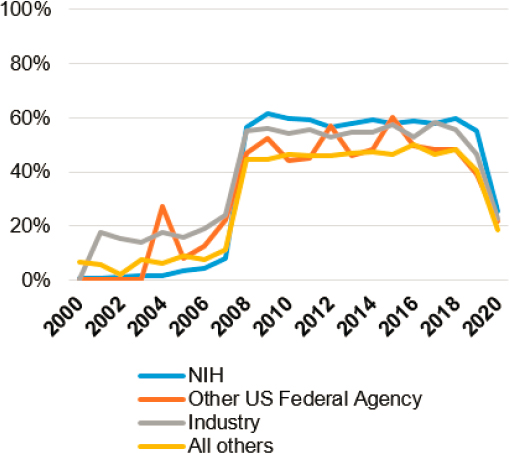
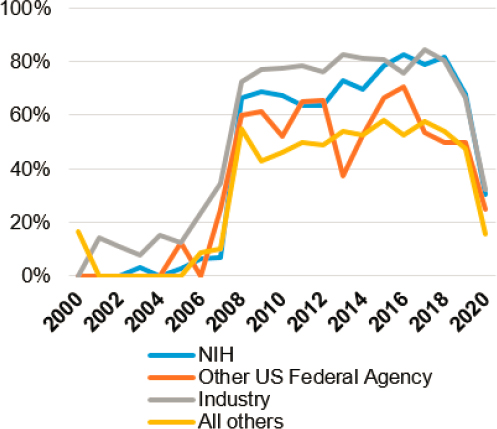
We have also assessed the quality of stratified results reporting in clinical trials registered at ClinicalTrials.gov with at least one site in the United States, with annual reporting by year of primary completion shown in Figures B-10a and B-10b (stratified by funder as reported by ClinicalTrials.gov, and the difference indicated between all phases and just Phase 3 [commonly registrational] trials). In both cases, trialists responded positively to new results reporting requirements, with NIH-funded trials reporting their results in greater than 50 percent of cases between 2008 and 2019, and industry funders reporting results in greater than 50 percent of cases between 2008 and 2018. Among Phase 3 trials, reporting of results was completed in at least 60 percent of industry-funded and NIH-funded trials between 2008 and 2019, with trials funded by other federal agencies and other entities achieving lower reporting compliance. Industry-funded trials account for more than two-thirds of Phase 3 trials (with much of the balance supported by the NIH, explaining the noisy data for other federal agency funding) and greater than 50 percent of all clinical trials (with NIH funding supporting 10–20 percent of all trials since 2008).
In July 2021, the FDA issued a Notice of Noncompliance to biotechnology company Accuitis, Inc., pursuant to 42 U.S.C. 282(j)(5)(C)(ii), requesting that results of its Phase 2 clinical trial of a treatment for acne rosacea be submitted to the ClinicalTrials.gov data bank (after first contacting the company about the issue in October 2020).14 The company posted the results in August 2021.
___________________
13 See https://www.census.gov/quickfacts/fact/table/US/PST045219.
Two other clinical trials (NCT03052816 and NCT01727336) have received an FDAAA 801 Notice status on ClinicalTrials.gov as of September 15, 2021, and their results have been submitted following FDA’s notifications. This followed an April 2021 announcement by the FDA that it has sent more than 40 pre-notices of noncompliance to “encourage voluntary compliance with the ClinicalTrials.gov requirements”15 and an August 2020 final guidance on civil money penalties related to noncompliance, which emphasized its regulatory attention will prioritize trials of products that “may pose a higher risk to human subjects or . . . products intended to address significant public health need,” focusing on “responsible parties or submitters who have had a pattern of previous noncompliance with the requirements” and “applicable clinical trials for which noncompliance . . . exists in conjunction with noncompliance with other statutory and/or regulatory requirements” (HHS, 2020). It is possible that such regulatory enforcement will result in a higher rate of results reporting to ClinicalTrials.gov.
DISCUSSION
This analysis provided a brief summary of published research on diversity challenges of different types in clinical trial enrollment, and presented data on trial enrollment as reported by NIH institutes and centers for trials they sponsored, and by the FDA for trials that resulted in an approval.
The reporting of demographic representation in clinical trials has historically not been consistent and comprehensive. In this analysis, we find, for example, that race data have not been completely reported by NIH institutes and centers (however, ethnicity has been more reported with greater consistency). Moreover, the share of trials that report any results on ClinicalTrials.gov has increased sharply following the adoption of FDAAA in 2007. However, reporting compliance plateaued soon thereafter, with only 45–60 percent of all trials reporting results in most years. A higher share, up to 85 percent of industry-sponsored trials in Phase 3, have reported results in the database.
There may be several reasons for the lack of data on trial enrollment and outcomes, such as that the studies may not be required to submit results, are ongoing, have been completed but the deadline to post results has not passed, or the posting of results is pending certification or a request to extend the results submission deadline.16 However, it may be important to better understand the reasons for the variance between reporting rates by trial sponsors, and to observe the effects of increased enforcement activity by the FDA in recent months.
___________________
15 See https://www.fda.gov/news-events/press-announcements/fda-takes-action-failure-submitrequired-clinical-trial-results-information-clinicaltrialsgov.
Trials Resulting in FDA Approval
The findings suggest several positive trends. First, in trials that resulted in FDA approval since 2014, the participation of females has consistently trended toward general parity (although notable differences between therapeutic areas still persist). Participation of females in non-oncology trials resulting in FDA approval has trended toward 60 percent of all participants, while their participation in oncology trials has plateaued just over 40 percent. Second, the participation of racial minorities in trials resulting in FDA approval has generally increased since 2014, with the number of white participants declining gradually to less than 75 percent in 2020. Finally, the participation of the elderly (over 65) has been on an increase, reaching nearly 40 percent in 2020. However, there are large differences by therapeutic area, with some of them (such as cardiovascular disease) showing above-average representation of the elderly, and others (such as endocrinology/metabolism/bone diseases, or gastroenterology) consistently below average.
NIH-Sponsored Trial Diversity
The findings show large differences in enrollment diversity over time and by NIH institute/center. For instance, while white participants have seen a slight increase across all trials (particularly in 2018, when they exceeded 60 percent for the first time, on average), their representation has been as low as 14.4 percent and as high as 81 percent in some cases. Representation of females has generally been consistent, ranging from 44.3 percent to 54.1 percent between 2013 and 2018, but has differed significantly by NIH institute/center. For example, at least 70 percent of participants in National Institute of Environmental Health Sciences–supported trials were females in all years for which data are reported, but the share of females was less than 40.5 percent in trials supported by the National Institute on Aging in 2017 and 2018 (this may be of particular concern in indications such as Alzheimer’s disease and other dementias where female prevalence exceeds that of males).
Data on race and ethnic group representation in NIH-supported trials have not been consistently reported, with up to 22.4 percent of participants having unknown ethnicity in 2016. The participation of Hispanics has been most consistent, averaging less than 10 percent during most years for which data are available (except for 2016, when it reached 11.3 percent). This has also been a group that has been relatively the most underrepresented in clinical trials given the share of Hispanics in the total U.S. population. Black/African American participation has historically been between 10 percent and 25 percent (the National Cancer Institute has had the lowest success in this category in 2016 and 2017, when it dropped under 5 percent). Notably, the National Institute of Allergy and Infectious Diseases has reported shares of greater than 30 percent (except for 28.1 percent in 2018). Representation of Asian participants has been somewhat less consistent, with some years showing spikes by some NIH institutes/centers
(mostly driven by a 2017 increase in Asian recruitment by trials supported by the National Cancer Institute). However, it appears that the trend has been otherwise a decreased one, reaching 7.8 percent in 2018, from 16.3 percent in 2013.
CONCLUSIONS
Some promising trends indicate more diverse trial enrollment in trials resulting in FDA approval as well as different diversity profiles of trials sponsored by NIH institutes/centers. The representativeness of trials resulting in an FDA approval has been gradually improving in several dimensions since 2014. The diversity profile of trial participants in NIH-sponsored trials has not followed a similar trend, however. As shown in this analysis, significant differences between different NIH institutes and centers have emerged (aside from fluctuations over time). These differences may be explained by numerous factors, such as variable disease prevalence in select populations. A study of the particular drivers of enrollment differences is warranted, adjusting for unique demographic profiles of multicountry trials (as population demographics in most regions of the world are very different from the U.S. demographic profile).
This study has highlighted that reporting gaps exist for clinical trials supported by public funding as well as for trials that have been approved. For example, there is no broadly available tool to analyze diversity of all trials resulting in FDA approval via a publicly available database (requiring manual collection and analysis of FDA Snapshot data, which makes any ongoing analysis more challenging). Such an approach is more prone to errors and is less flexible with different reporting and analytic objectives. Moreover, the demographics of NIH-sponsored trials are reported in an aggregate form by NIH institutes and centers, preventing an analysis at a more granular level. Some institutes and centers, moreover, only report extramural research or do not make explicit distinctions between intramural and extramural research, and provide limited contextual information that would help explain large differences in total or subgroup enrollment data in some years. More detailed reporting of trial participation at the trial level in a publicly accessible database would allow for a more informative analysis of key trends in NIH-funded clinical trials, further contributing to transparency and accountability. The NIH has recently expanded its reporting to stratify by disease area, but the lack of historical data has prevented a longitudinal analysis of trends to date.
The FDA’s actions over 2021 suggest that compliance with reporting requirements will become a greater priority, which in turn may provide better data on demographic profiles of individual trials. It is yet to be seen whether reporting rates increase by commercial and/or other trialists as a result of increased enforcement activity, particularly for late-stage trials. Not only is the reporting of results and demographic characteristics helpful in our understanding of treatment effects
and the generalizability of presented findings, but it also makes scientific progress more efficient by enabling researchers to review negative findings, compare results for subgroups across trials, and conduct analyses of unpublished trial results. Ultimately, greater transparency of reporting on enrollment and outcomes will benefit both clinical investigators and patients by increasing the information value of trials that do not result in FDA approval, as well as trials that reach regulatory review. A better understanding of trial enrollment and results reported for specific demographic populations is likely to accelerate scientific progress and ultimately lead to more effective treatment options for all patients.
Acknowledgments
The author is extremely grateful for research assistance provided by Austen Applegate and Alex Helman, both staff of the Committee on Women in Science, Engineering, and Medicine of the National Academies of Sciences, Engineering, and Medicine, and to the members of the committee and others who have provided support and constructive feedback.
REFERENCES
Anderson, G. D. 2005. Sex and racial differences in pharmacological response: Where is the evidence? Pharmacogenetics, pharmacokinetics, and pharmacodynamics. Journal on Women’s Health 14(1):19–29. doi:10.1089/jwh.2005.14.19.
Artiga, S., J. Kates, J. Michaud, and L. Hill. 2021. Racial diversity within COVID-19 vaccine clinical trials: Key questions and answers. KFFHealthPolicy. https://www.kff.org/racial-equity-and-health-policy/issue-brief/racial-diversity-within-covid-19-vaccine-clinical-trials-key-questions-and-answers/.
Califf, R. M., D. A. Zarin, J. M. Kramer, R. E. Sherman, l. H. Aberle, and A. Tasneem. 2012. Characteristics of clinical trials registered in ClinicalTrials.gov, 2007–2010. JAMA 307(17):1838–1847. doi:10.1001/jama.2012.3424.
Carcel, C., and M. Reeves. 2021. Under-enrollment of women in stroke clinical trials. Stroke 52(2):452–457. https://doi.org/10.1161/STROKEAHA.120.033227.
Clark, L. T., L. Watkins, I. L. Piña, M. Elmer, O. Akinboboye, M. Gorham, B. Jamerson, C. McCullough, C. Pierre, A. B. Polis, G. Puckrein, and J. M. Regnante. 2019. Increasing diversity in clinical trials: Overcoming critical barriers. Current Problems in Cardiology 44(5):148–172. https://doi.org/10.1016/j.cpcardiol.2018.11.002.
Eshera, N., H. Itana, L. Zhang, G. Soon, and E. O. Fadiran. 2015. Demographics of clinical trials participants in pivotal clinical trials for new molecular entity drugs and biologics approved by FDA from 2010 to 2012. American Journal of Therapeutics 22(6):435–455. doi:10.1097/mjt.0000000000000177.
FDA (U.S. Food and Drug Administration). 1993. Study and Evaluation of Gender Differences in the Clinical Evaluation of Drugs: Guidance for Industry. https://www.fda.gov/regulatory-information/search-fda-guidance-documents/study-and-evaluation-gender-differences-clinical-evaluation-drugs.
FDA. 2011. Dialogues on Diversifying Clinical Trials. September 22–23, 2011, Washington, D.C.
FDA. 2020. Enhancing the Diversity of Clinical Trial Populations—Eligibility Criteria, Enrollment Practices, and Trial Designs Guidance for Industry. https://www.fda.gov/media/127712/download.
Flores, L. E., W. R. Frontera, M. P. Andrasik, C. del Rio, A. Mondríguez-González, S. A. Price, E. M. Krantz, S. A. Pergam, and J. K. Silver. 2021. Assessment of the inclusion of racial/ethnic minority, female, and older individuals in vaccine clinical trials. JAMA Network Open 4(2):e2037640–e2037640. doi:10.1001/jamanetworkopen.2020.37640.
HHS (U.S. Department of Health and Human Services). 2020. Civil Money Penalties Relating to the ClinicalTrials.gov Data Bank. Food and Drug Administration Guidance Document, 85 FR 50028: 50028–50030.
Lewis, J. H., M. L. Kilgore, D. P. Goldman, E. L. Trimble, R. Kaplan, M. J. Montello, M. G. Housman, and J. J. Escarce. 2003. Participation of patients 65 years of age or older in cancer clinical trials. Journal of Clinical Oncology 21(7):1383–1389. doi:10.1200/jco.2003.08.010.
Ludmir, E. B., W. Mainwaring, T. A. Lin, A. B. Miller, A. Jethanandani, A. F. Espinoza, J. J. Mandel, S. H. Lin, B. D. Smith, G. L. Smith, N. A. VanderWalde, B. D. Minsky, A. C. Koong, T. E. Stinchcombe, R. Jagsi, D. R. Gomez, C. R. Thomas Jr., and C. D. Fuller. 2019. Factors associated with age disparities among cancer clinical trial participants. JAMA Oncology 5(12):1769–1773.
Mak, W. W. S., R. W. Law, J. Alvidrez, and E. J. Pérez-Stable. 2007. Gender and ethnic diversity in NIMH-funded clinical trials: Review of a decade of published research. Administration and Policy in Mental Health and Mental Health Services Research 34(6):497–503. doi:10.1007/s10488-007-0133-z.
Malzbender, K., L. Lavin-Mena, L. Hughesm N. Bose, D. Goldman, and D. Patel. 2020. Key Barriers to Clinical Trials for Alzheimer’s Disease. Los Angeles: University of Southern California Leonard D. Schaeffer Center for Health Policy & Economics. https://healthpolicy.usc.edu/wp-content/uploads/2020/08/Key-Barriers-to-Clinical-Trials-for-Alzheimer%E2%80%99s-Disease_FINAL.pdf.
Murthy, V. H., H. M. Krumholz, and C. P. Gross. 2004. Participation in cancer clinical trials: Race-, sex-, and age-based disparities. JAMA 291(22):2720–2726. doi:10.1001/jama.291.22.2720.
Sedrak, M. S., R. A. Freedman, H. J. Cohen, H. B. Muss, A. Jatoi, H. D. Klepin, T. M. Wildes, J. G. Le-Rademacher, G. G. Kimmick, W. P. Tew, K. George, S. Padam, J. Liu, A. R. Wong, A. Lynch, B. Djulbegovic, S. G. Mohile, W. Dale; Cancer and Aging Research Group (CARG). 2021. Older adult participation in cancer clinical trials: A systematic review of barriers and interventions. CA: A Cancer Journal for Clinicians 71(1):78–92. https://doi.org/10.3322/caac.21638.
Strong, B., V. Howard, and M. Reeves. 2020. Sex differences in enrollment among contemporary acute stroke trials: Differences by trial type. Paper presented at the ESO-WSO 2020 Virtual Conference, November 7–9, 2020. International Journal of Stroke. https://journals.sagepub.com/doi/full/10.1177/1747493020963387.
Woodall, A., C. Morgan, C. Sloan, and L. Howard. 2010. Barriers to participation in mental health research: Are there specific gender, ethnicity and age related barriers? BMC Psychiatry 10(1):103. doi:10.1186/1471-244X-10-103.
SUPPLEMENTARY MATERIAL
The Supplementary Table, below, shows the demographic representation by category in Phase 3 trials supported by NIH centers and institutes. Note that several demographic characteristics are not stable over time, driven by several large trials run by some research centers and institutes, or incomplete reporting by all centers and institutes over time. Data for Phase 3 trials have a smaller share of participants with missing race or ethnicity information than all trials supported by NIH centers and institutes.
SUPPLEMENTARY TABLE Demographics of Participants in Phase 3 Trials Supported by NIH Centers and Institutes
| 2013 (%) | 2014 (%) | 2016 (%) | 2017 (%) | 2018 (%) | |
|---|---|---|---|---|---|
| Female | 64.2 | 65.9 | 53.1 | 59.7 | 61.5 |
| American Indian | 5.2 | 6.5 | 0.3 | 0.4 | 0.7 |
| Asian | 33.6* | 42.0* | 5.2 | 4.4 | 5.4 |
| Black/African American | 20.5 | 20.9 | 67.5 | 14.8 | 17.0 |
| Native Hawaiian/Pacific Islander | 0.1 | 0.1 | 0.0 | 0.1 | 0.2 |
| White | 35.5 | 25.6 | 22.6 | 72.0 | 64.3 |
| More than 1 race | 0.5 | 0.4 | 0.3 | 0.6 | 3.7 |
| Unknown race | 0.5 | 0.4 | 0.3 | 0.6 | 3.7 |
| Hispanic | 12.4 | 12.0 | 11.9 | 58.5** | 40.0** |
| Non-Hispanic | 86.9 | 86.2 | 86.9 | 30.4 | 56.7 |
| Unknown ethnicity | 0.7 | 1.8 | 1.2 | 11.1 | 3.3 |
| Sum of all races | 95.9 | 95.9 | 96.3 | 92.9% | 94.9 |
| Sum of all ethnicities | 100.0 | 100.0 | 100.0 | 100.0 | 100.0% |
* Data on Asian enrollment in 2013 and 2014 were affected by large Asian representation in trials run by the National Institute of Child Health and Human Development (for which enrollment data are not available for 2016–2018).
** The large increase in Hispanic representation was driven by significant increases in reported Hispanic participants by the National Heart, Lung, and Blood Institute (from about 41,200 in 2016 to more than 317,000 in 2017 and nearly 118,500 in 2018).
This page intentionally left blank.


