
4
Improving Estimates of Renewal Costs
INTRODUCTION
Previous chapters introduced the concept of asset management planning and the foundation of statutes and regulations that govern the activity of the federal agencies’ facility management activity. This chapter discusses the analytical tools and underlying data needed to estimate renewal requirements.
Accurately estimating renewal costs is the first step of justifying adequate funding, and the federal government depends on such estimates to guide its spending of billions of dollars annually for its facilities. For an individual structure, renewal costs are an essential input required for project development and economic analyses. For a facility portfolio, they are the basis for budget requests, strategic planning, investment decision making, and meeting federal reporting requirements.
Using what Wildavsky (1979) calls “analytical craftsmanship,” estimates of renewal costs can be a powerful tool for advocacy.1 Prepared poorly, such estimates can misalign with actual needs and lead to wasting chronically limited resources.
___________________
1 “Craftsmen are judged by how they use their tools. Their handiwork is done individually but judged collectively. Are the data accurate, appropriate and manipulated according to prevailing standards? Is the evidence believable, coming from diverse sources, and tested for credibility? Are the arguments persuasive and balanced rather than one-sided? Does the analyst have a reputation for doing careful, accurate and, if called for, imaginative work? Do other analysts with different viewpoints, and other audiences who must be persuaded, find this analyst believable? Craftsmanship is persuasive performance” (Wildavsky 1979, p. 401).
EARLIER STUDIES
This report is the latest in a series produced by the National Academies2 that has addressed estimating facility costs. In Committing to the Cost of Ownership: Maintenance and Repair of Public Buildings (NRC 1990), the authoring committee stated that routine annual maintenance and repair of a “substantial” building portfolio should range from 2 to 4 percent of aggregate replacement value. This range was sited again in Stewardship of Federal Facilities: A Proactive Strategy for Managing the Nation’s Public Assets (NRC 1998) and the Stewardship committee also commented on the high cost of condition assessments and how their results become outdated quickly.
In Intelligent Sustainment and Renewal of Department of Energy Facilities and Infrastructure (NRC 2004a), the authoring committee recommended the Sustainment and Restoration & Modernization (S/RM) taxonomy shown in Table 4-1 and used the term renewal as interchangeable with restoration and modernization. Federal agencies were encouraged to consider using Department of Defense (DoD) models for estimating the two types of costs—the Facility Sustainment Model (FSM) and the Facility Restoration and Modernization (FRM) model.3
Key Performance Indicators for Federal Facilities Portfolios: Federal Facilities Council Technical Report Number 147 (NRC 2005a) noted that most performance metrics were financial; most commonly used to characterize facility condition was the facility cost index, the ratio of the cost of necessary repairs over the cost of replacement.
TABLE 4-1 Scope of Sustainment and Restoration and Modernization
| Department of Defense Model | Cost Category |
|---|---|
| Facility sustainment | Preventive Maintenance, Minor Repair |
| Unscheduled Maintenance | |
| Major Repair, Replacement | |
| Facility Restoration and Modernization | Replacement due to Obsolescence |
| Change in Use Modifications | |
| Policy-Mandated Retrofits | |
| Acts of War & Nature | |
| Repairs from Neglect | |
| Long-lived Components |
SOURCE: Sourced from data in Whitestone Research, 2003, Development of a Restoration & Modernization Requirements Process: Final Report, Washington, DC.
___________________
2 Prior to July 1, 2015, reports of the National Academies of Sciences, Engineering, and Medicine were authored by the National Research Council.
3 See Janke and Lufkin (2005). The FSM is the only model still in regular use by DoD.
Also mentioned in the Key Performance report were the sustainment rate, the ratio of actual sustainment funding, and the predicted requirement based on the DoD sustainment model. The only nonfinancial condition measure noted was the building condition index (BCI), a weighted sum of costs of correcting inspection-based deficiencies, which were not used by any federal agency at the time of publishing.4
Predicting Outcomes of Investments in Maintenance and Repair of Federal Facilities (NRC 2012b) focused on ways to quantify investment outcomes, with an emphasis on risk. Recommendations regarding cost modeling included standardizing methods for data gathering, for decision support, and for outcome measures of investments in maintenance and repair. The 2012 committee advised federal agencies to use a knowledge-based approach for conditioning assessment and discussed the same approach for budgeting and risk analysis.
Having summarized comments on facility cost modeling in earlier National Academies’ publications, the remainder of this chapter provides a typology of cost models and then reviews two specific models that might be used for estimating renewal requirements. The last section describes the pressing need for revised service-life5 and depreciation rates, particularly for nonresidential structures.
THE EVOLUTION OF FACILITY COST MODELS
Methods for estimating repair and replacement costs have evolved with increasing computing capabilities and the growing demand for sophisticated planning tools. There are many different estimation models, varying in terms of scope, precision, and costs.6Table 4-2 compares the strengths, weaknesses, and applications of five common approaches.
- Formula method—A formula model is typically a single rate based on historical experience. Walter Kraft estimated annual maintenance and repair budgets for The University of Texas in the 1950s and 1960s by multiplying physical plant replacement value by a factor of 1.7 percent, with an additional 0.15 percent for air-conditioning (Gardner 1989). The formula method is good for a comprehensive, defensible summary of costs and requires little data. It is not applicable for specific buildings, particularly of different use types.
- Delphi method—The Delphi method is typically based on a simple rate or function defined by a committee of subject-matter experts. The most
___________________
4 The BCI is a product of Builder, an assessment tool created by the U.S. Army Corps of Engineers (USACE) and discussed later in the chapter.
5 The service life of an asset is the total period during which it remains in use, or ready to be used, in a productive process. During its service life an asset may have more than one owner (OECD 2001).
6 In a study for the Air Force, Ottoman and colleagues (1999) identified 18 budget models “at our disposal in any fight with prospective budget cutters.”
TABLE 4-2 Comparison of Five Cost-Estimating Methods
| Method | Strength | Weakness | Application |
|---|---|---|---|
| Formula |
|
|
|
| Delphi |
|
|
|
| Benchmark Survey |
|
|
|
| Life Cycle |
|
|
|
| Simulation |
|
|
|
- common facility example is 2-4 percent of plant replacement value as an annual maintenance and repair guideline (NRC 1990). The authority of subject-matter experts is the greatest strength of the method, particularly when historical data are not available, but the scope of estimates is limited to the knowledge of the experts.
- Benchmark survey—A benchmark survey provides a rate or collection of rates defined by a survey of end users. Cost estimates based on survey results have the authority of experience, but sample size and the self-selecting nature of responses limit accuracy. Facility organizations conduct
- annual cost-experience surveys for their respective constituencies—for example, the International Facility Management Association (public and private facilities), the Building Owners Management Association (office buildings), and APPA (educational facilities).
- Life-cycle model—The life-cycle model bases estimates on a schedule of major system replacements and their costs. Unlike earlier approaches, the life-cycle model incorporates the composition of the individual building and recognizes the oscillating nature of major costs as a building ages. In some applications, the assumption of a complete system (heating, ventilating, and air-conditioning; plumbing; exterior closure, etc.) replacement overstates actual costs of partial replacement and repair. There were many variants of the life-cycle model in the 1980s, with the Stanford model (Hutson and Biedenweg 1982) being the most well known. The Maintenance Resource Prediction Model (MRPM) was an innovative life-cycle model developed by the U.S. Army Corps of Engineers (USACE) that provided component-level cost estimates, although there is no evidence of widespread use (Neely et al. 1991). The Facility Sustainment Model (FSM) employed a commercial life-cycle model to estimate sustainment-cost factors (cost per square foot) for more than 400 categories of DoD facilities.7 DoD publishes factors annually, and sustainment costs are a common reference point for actual expenditures. The scope of the FSM is shown in Table 4-1. The strengths of the FSM include its detail and objectivity. Unlike benchmark surveys, DoD based estimates from the FSM on published life cycles of individual components and represented “what should be spent” rather than summaries of actual expenditures.
- Simulation models—More of an exploratory environment than a single-purpose tool, a simulation model can provide detailed estimates of repair and replacement costs (individual building, components, labor, trade, etc.), staffing, and risk under a variety of utilization assumptions and funding levels. Desai (2012) offers a number of facility-related case studies. Simulation capabilities are available in at least one government-owned application and some commercial products.8 Data storage and computational complexity require a dedicated application and trained users. Data acquisition and management costs are relatively high.
In a presentation to the committee, representatives from Lawrence Livermore National Laboratory (LLNL) described its use of simulations for successful
___________________
7 The FSM was estimated with the MARS Forecast System, a commercial life-cycle cost product (Whitestone Research) that adopted concepts and initial data from the MRPM System, as did the maintenance and repair database annually published by R.S. Means.
8 USACE’s Builder tool has simulation capabilities, as does CostLab, a commercial simulation system developed by Whitestone Research.
advocacy,9 summarized in Chapter 3. LLNL has an extensive history of cost modeling for the maintenance of nuclear weapons facilities that began with life-cycle modeling in the year 2000. Their modeling has progressed to an advanced simulation capability that calculates cost, risk, and LLNL staffing outcomes for alternative laboratory programs and funding assumptions. During this time, investment in infrastructure has grown from roughly $50 million to $200 million per year.
TWO APPROACHES TO ESTIMATING RENEWAL COSTS
Facility renewal is defined in Chapter 1 as extending an asset’s functionality beyond its expected service life through significant renovation, replacement, or repurposing. This view is consistent with the DoD definition of recapitalization, as it “extends the service life of facilities or restores lost service life. It includes restoration and modernization of existing facilities, as well as replacement of existing facilities with new” (DoD 2016, § 080105). Given these similarities, the discussion in this section assumes the terms renewal, recapitalization, and restoration and modernization are equivalent, except where noted.
In concept, renewal restores or replaces an aging facility to achieve a contemporary level of mission-appropriate service and efficiency, and resets expected service life. In practice, renewal activities are sporadic and incomplete, seldom fully restoring the condition or value of a facility except in case of complete renovation or replacement. As noted in Chapter 1, few if any agencies have the consistent funding necessary to systematically renew their facility portfolio over time.
Estimating current renewal costs and predicting future costs is complex. Renewal consists of largely unrelated restoration and modernization requirements (shown in Table 4-1), and unlike for sustainment, there are no Delphic rules of thumb or predictable life cycles of maintenance and repair tasks. Simple subsystem replacement algorithms cannot incorporate the policy changes, technology retrofits, or random weather events that make up much of renewal requirements.
There is no widely accepted model for estimating the costs of renewal, but two approaches are reasonable candidates: the Builder system from USACE and the economic depreciation model used first by the Bureau of Economic Analysis (BEA), an agency of the Department of Commerce.
USING BUILDER TO ESTIMATE RENEWAL COSTS
Perhaps the most significant development in federal facility management in the last decade has been the rapid adoption of the Builder Sustainment Management System (Builder), an assessment and decision-support system for federal
___________________
9C. Shang, Y. Abed, and J. Farrell, 2019, “Science-Based Infrastructure Stewardship,” presentation to the committee, November 11, 2019.
facilities.10 Builder was developed in the 1990s, but adoption was fitful until its endorsement in 2012 by a National Research Council study (NRC 2012b) and the issuance of a directive in 2013 by the Office of the Secretary of Defense mandating its use across DoD (Frisinger 2013). According to USACE, by the end of 2020, Builder should have been used to inspect or import condition data for all DoD-owned or DoD-leased facilities—more than half of all federal facility assets. If fully implemented, Builder would create one of the largest real property databases of its type in the world.
The Builder system is, foremost, a building condition assessment tool. It provides a measure of the current physical condition of individual building components based on a fixed checklist of problems (distresses) and severity. A measure of overall building condition is based on the weighted combination of component condition.
The future condition of each component is predicted by a degradation curve that represents the relationship of the condition index and component age (see Figure 4-1). Key decision points or “sweet spots” provide a schedule of repairs and replacements that, combined with task costs, provide an estimate of future costs. The projections are presented as “satisfying requirements for long-term budgeting and sustainment, restoration & modernization planning” (Uzarski et al. 2018).
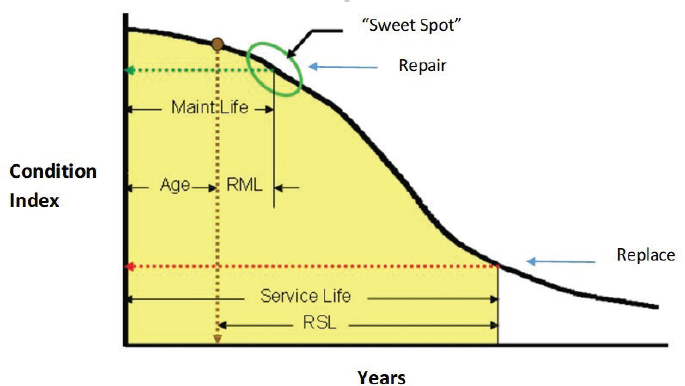
NOTE: RML = remaining maintenance life; RSL = remaining service life.
SOURCE: Adapted from figure courtesy of Dr. Uzarski, University of Illinois at Urbana-Champaign.
___________________
10 For more information, see Sustainment Management System, https://www.sms.erdc.dren.mil.
Despite this capability, use of Builder as a cost prediction tool has been limited. One study found that among 11 federal agencies using Builder, none were using its forecasting and budget-related capabilities (Herrera et al. 2017). The study included early adopters—the U.S. Marine Corps (in 2008) and the U.S. Navy (in 2011) who presumably had time to implement the advanced capabilities if desired.
A second study (Lufkin 2020) of Builder focused on its cost-estimating capabilities. The study findings are highly critical of the system, raising questions about its ability to produce defensible results and meet the DoD mandate. Specific concerns included the following:
- The inspection process has not been validated according to common scientific standards. Overgeneralized inspection criteria (e.g., “broken,” damaged,” “deteriorated”) invite inspector confusion and conflicting interpretation.
- Forecasts of future component condition and renewal costs are based on a “self-correcting” degradation curve that updates with every inspection. This less costly but unvalidated process replaced the definition of the curves by expert panels, a well-accepted approach used with earlier USACE systems.
- The optimum schedule of repairs and replacements is a product of “sweet spots” and “penalty costs” defined by the Builder user. This burdens the user with approximating unknowable decision factors and undermines the objectivity of predictions.
- Most critically, the scope of Builder inspections does not match the scope of renewal activities. Builder developers have stated explicitly that restoration and modernization data are not collected.11
The Independent Value of Component Inventory Data
To provide an estimate of building and component condition, Builder requires detailed component inventory data. Defined by inspection, or more likely by migration from an existing database, these data comprise the basic component information—description, location, size, quantity, and install date. These data are a valuable resource independent of Builder’s analytical capabilities.
A typical building can have 50 to 75 components that could require repairs or replacement, while larger or more complex facilities might have hundreds of such components. Multiply this by hundreds of thousands of federal buildings,
___________________
11 Committee interview with L. Marrano and M.N. Grussing, December 5, 2019.
and the aggregate component inventory is the largest database of its type—a unique resource for research, budgeting, and policy development.12
Finding 4-1: At this time, Builder is ill suited for estimating renewal costs. Its inspections do not collect restoration and modernization data, and its cost-forecast process has not been properly verified and validated.
Finding 4-2: The extensive component inventory created for use with Builder is, by itself, a valuable resource. After addressing privacy and security concerns, the inventory data could be made available to facility managers and qualified researchers. The data could also be used by other models capable of estimating renewal and other facility costs.
ESTIMATING RENEWAL COSTS WITH AN ECONOMIC DEPRECIATION MODEL
The structure value and productivity of a building diminishes with age (unlike land value, which tends not to depreciate and can vary with local economic conditions). The decline can be described as economic depreciation—the accumulation of wear and tear and obsolescence—that diminishes the services an asset provides and reduces its market value, even with regular maintenance and repair.
The causes of economic depreciation are roughly the same issues that lead to the need for facility renewal. The equivalence of the two concepts is found in tax policy, the regulation of public utilities, national accounting, and capital theory.13 Given this equivalence, it is reasonable to assume that a method for estimating economic depreciation can also be used to estimate renewal costs.14
Recapitalization Rate
In the past, DoD relied on a simple form of depreciation for evaluating recapitalization funding. The recapitalization rate is the number of years required
___________________
12 Builder will have been used to inspect 1.3 million square feet, or roughly one-third of the federal total, by 2020. Assuming the same proportion applies to buildings and an average of 75 components, there would be 8.9 million actual component records stored in Builder. In addition, the database could be reused as an input to other methods capable of forecasting sustainment and renewal costs.
13 According to the U.S. Supreme Court, “Depreciation is the loss, not restored by current maintenance, which is due to all the factors causing the ultimate retirement of the property. These factors embrace wear and tear, decay, inadequacy and obsolescence” (Lindheimer v. Illinois Bell Telephone Company, 292 U.S. 151, 167 [1934]).
14 It is important to note that economic depreciation does not include renewal costs such as change in use or policy-mandated retrofits that may improve the facility’s mission-related activities, without changing its value or productivity or extending its service life. In this respect, depreciation-based estimates of renewal requirements are understated.
to replace all assets (or the average age at replacement) at a given funding rate. The recapitalization rate is calculated as R = PRV/restoration and modernization funding, where PRV is the plant replacement value, and R is the average service life at a given time.
Rearranging the calculation provides the economic depreciation rate and required funding. For example, in 2003, the weighted average service life of facilities in the DoD inventory was 67 years, and the PRV was $611 billion. Accordingly, the annual depreciation ($611 billion/67) would be an average $9.1 billion or 1.5 percent of PRV.
A problem with the recapitalization rate is that it assumes a constant value of depreciation (1.5 percent) over the facility service life. While a straight-line depreciation pattern for structures is common for tax purposes, it has no necessary connection with the way buildings actually age or how their productive capabilities (e.g., rent or conformance with established functional standards) decline.15
The Economic Depreciation Model
Despite its name, the economic depreciation model is really an investment guide. It informs the asset owner’s ever-present choice to accept the current depreciated value or invest some amount that extends the asset’s productive life and improves economic return. Depreciation measures the loss of productive capability over time that an asset delivers compared to when it was new. An estimate of this productive capability and its decline can be defined using the depreciation pattern. This approach can also be used to estimate the capital investment required to restore an asset’s productive capability to a like-new condition.
In 1976, economists Hulten and Wycoff estimated depreciation rates for various structure types based on price data from a Department of the Treasury survey (Hulten and Wycoff 1980). They found a geometric pattern of depreciation, wherein the asset depreciates by a fixed percentage of its value over a given period, resulting in a final remaining productive capacity above zero, which represented well the decline of structure efficiency over time and estimated a set of depreciation rates that are still widely cited in practice.16
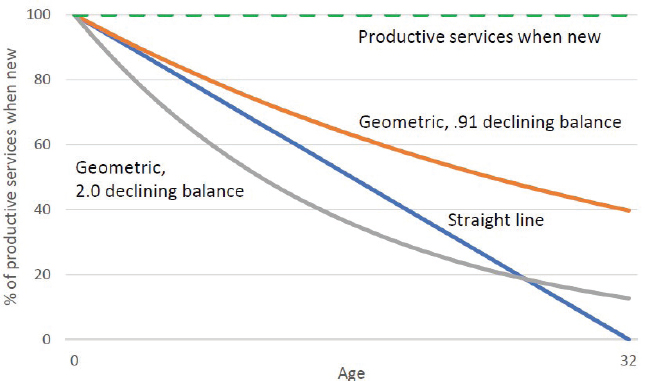
Estimates of renewal requirements using the straight-line depreciation pattern are much higher than those assuming geometric depreciation17 with a 0.91
___________________
15 See Gravelle (1999), for the history of taxation and the measure of economic depreciation.
16 Professional building appraisers call the area under the depreciation curve the “percent good” (California State Board of Equalization 2012).
17 Geometric depreciation is one of many types of economic depreciation. Other types of economic depreciation commonly used or referred to include straight-line depreciation, one-hoss shay depreciation, and hyperbolic depreciation, the latter with certain parameters.
declining balance, as shown in Figure 4-2, but lower than those with a 2.0 declining balance. The BEA uses a 32-year service life and a 0.91 declining balance rate for government nonresidential industrial structures.18
Balance rates are empirically derived rates used to calculate geometric depreciation rates by dividing the balance rate for each asset by the asset’s assumed service life. For example, assume a double declining balance rate of 2. The service life of the asset is 10 years. The depreciation rate of the asset would be 2.0/10 = 20 percent. Another way to think of balance rates is as a multiplier of the comparable rate of depreciation that would be obtained for the first period of an asset’s life using the straight-line method. If an asset has a 10-year life, the straight line depreciation per annum would be 10 percent. A balance rate of 2.0 is multiplied to this straight line rate: 2.0 × 10 percent = 20 percent depreciation rate. Under a 0.91 declining balance assumption, the average building of this type still retains 40 percent of its productive capability at age 32, the point at which all value is exhausted according to the straight-line pattern. Under a 2.0 declining balance assumption, the average government nonresidential industrial building of this type retains 13 percent of its productive capacity at the same age. The difference is reflected in the estimated renewal cost, meaning the annual renewal costs for government nonresidential industrial structures would be lowest with a geometric 0.91 declining balance rate and highest with a geometric 2.0 declining balance rate before age 26.
In the example provided the net result is 27 percent of the asset’s productive capability, which equates to a range of capital investment required to renew the
___________________
18 See “BEA Depreciation Estimates,” https://apps.bea.gov/national/pdf/BEA_depreciation_rates.pdf. Accessed November 2019.
asset to a desired level of capability. This leads to the observation that renewal cost is greater for structures with higher depreciation rates.19
The same magnitude of difference in estimates is found at the portfolio level. One study used geometric rates derived from Hulten and Wycoff to estimate an average annual restoration and modernization budget for all DoD real property in 2003. This estimate was $6 billion, or 1.1 percent of PRV—roughly 60 percent of the projection from the recapitalization rate—for the same year (Whitestone Research 2003).
The use of an economic depreciation model to estimate renewal costs is not new. In 2004, an NRC committee recommended use of the DoD recapitalization model to estimate renewal requirements for the Department of Energy (NRC 2004a). In 2005, the DoD model converted to the geometric depreciation rates favored by the BEA and expressed annual restoration and modernization costs as cost factors by the same facility categories as the Facility Sustainment Model (Lufkin et al. 2005).
An economic depreciation model is currently used by LLNL to estimate facility renewal (i.e., recapitalization) costs for National Nuclear Security Administration (NNSA) assets.20
Finding 4-3: Predicting federal investment requirements for facility renewal is difficult because they are noncyclical and consist of largely unrelated restoration and modernization costs. However, the geometric depreciation model addresses the same costs as those for restoration and modernization, making it a reasonable approach to estimating renewal requirements.
Finding 4-4: The DoD recapitalization metric was an estimation approach that was readily understood and easily applied by planners and facility management. The geometric depreciation model has greater technical credibility and can be just as convenient to use if renewal requirements are expressed as simple cost factors by facility category, similar to the DoD sustainment cost model.
___________________
19 If there has been a 60 percent decline in the productive services that a structure can provide as determined by the depreciation rate, the cost of renewing the structure’s productive services to the level provided when it was new may or may not be 60 percent of the cost of the structure when new even in the absence of inflation. Renewal costs depend upon restoration (repair and construction) costs, which do not depend on the depreciation rate, as these differ depending on the problem to be fixed.
20C. Shang, Y. Abed, and J. Farrell, 2019, “Science-Based Infrastructure Stewardship,” presentation to the committee, November 11, 2019.
THE NEED FOR BETTER SERVICE-LIFE AND DEPRECIATION DATA
While an important input to an assortment of accounting and planning activities in the private sector, service-life estimates are also a principal requirement for cost modeling and budgeting for federal facilities. Yet there is no commonly accepted set of service lives for buildings or their components among federal agencies.
Building Service Lives
The difficulty starts with the definition. As Silva and colleagues (2016) and others have noted, there are at least three service lives for every building or component—the physical life during which the asset performs as specified, the functional life during which the asset best serves the institution purpose, and the economic life or “the period of time over which an investment is considered to be the least cost alternative for meeting a particular objective” (ASTM 1995). Each definition has a separate professional constituency—engineers, architects, energy specialists, economists—with sometimes conflicting priorities. Owners and operators replace equipment and entire buildings more often for changing use, aesthetics, or efficiency than for lack of physical durability.
There is no lack of potential sources for building service-life estimates. The U.S. Internal Revenue Service has provided service lives since 1918, although later versions changed with the evolution of tax policies. Regulated utilities report asset service lives at rate hearings and compile service-life data into an industry-wide summary, although it is confidential.21 There are at least two international financial surveys (Japan and Canada) that report average asset service lives for tax purposes.22 And at least three commercial publishers provide service-life estimates based on expert opinions and secondary sources. One of the most commonly used set of service lives comes from the BEA (Fraumeni 1997).23 DoD considered all of these sources in a “best practices” survey in 2002 and did not find one comprehensive source for all facility categories (Whitestone Research 2002).
Regardless of their source, service-life assumptions can have a profound impact on cost estimates. For example, a revised set of service-life assumptions based on the 2002 survey led to a portfolio-wide average value of 34.7 years—almost half of the 67 years assumed in the previous DoD recapitalization
___________________
21 This summary was compiled by the American Gas Association and the Edison Electric Institute at least through 2002.
22 The National Wealth Survey conducted by the Japanese Ministry of Finance and the Capital and Repair Expenditures Survey by Statistics Canada.
23 Current BEA service lives are available at https://apps.bea.gov/scb/account_articles/national/0797fr/table3.htm.
model. This would almost double the estimated restoration and modernization requirement.
There are a handful of methods used for defining the service life of building components. Perhaps the most common are point estimates provided by expert judgment, with manufacturers, service providers, and end users as sources. Replacement experience data are a growing resource with the ubiquity of maintenance management systems and extrapolation from condition-inspection tools for specific systems, such as Roofer and Paver, which have proven successful. Finally, simulations such as LLNL’s risk calculation model can estimate the cost impacts of a range of component-level service-life assumptions.24
Depreciation Rates
Capital depreciation rates are primary inputs in estimating restoration and modernization rates using the economic depreciation model and, more broadly, for estimating the net value of national capital assets. The BEA maintains an aging set of rates for residential and nonresidential structures, which could be improved.
As Fraumeni (1997) explains, BEA depreciation rates consider the decline in productive capacity due to physical deterioration, normal obsolescence, or accidental damage. The depreciation rates for structures depend largely on estimates made by Hulten and Wykoff (1979, 1981a,b), mentioned in an earlier section.
The BEA grades the depreciation rates on their relation to the original Hulten and Wykoff findings. Type A rates are those for facility categories for which Hulten and Wykoff estimated age-price profiles. Type B rates are derived from research by others and Hulten and Wykoff judgment. Type C rates are not based on data, but are approximated using the average declining balance rate for all type A and B assets.
BEA has two broad categories of structures. Under the residential category, eight of the nine asset types have A-quality depreciation rates.25 But for nonresidential structures (private and government), all but 1 of the 10 asset types have C-quality rates.26
___________________
24C. Shang, Y. Abed, and J. Farrell, 2019, “Science-Based Infrastructure Stewardship,” presentation to the committee, November 11, 2019.
25 The two exceptions are for the subcategory’s brokers’ commissions and other ownership transfer costs and residential equipment.
26 The exception is for highways. The BEA asset life for highways depends on later research by R. Beemiller, 1999, “Experimental Estimates of State and Local Government Highway Capital Stocks,” Presentation at the annual meeting of the Southern Regional Science Association, Richmond, VA, April; B.M. Fraumeni, 1999, Productive Highway Capital Stock Measures, Washington, DC: Federal Highway Administration, Department of Transportation, https://www.fhwa.dot.gov/reports/phcsm/phcsm.pdf.
The depreciation rates published in 1997, based on the Hulten and Wykoff findings, better reflect the actual rates of depreciation of structures than did the straight-line depreciation rates that were previously assumed. But these were considered a work in progress, open to regular revision with new research. Except for minor adjustments, the depreciation rates for government residential and nonresidential structures, and their service-life assumptions, have not been revised since their initial publication.
Finding 4-5: Capital depreciation rates are primary inputs for estimating restoration and modernization rates using the geometric depreciation model, and more broadly for estimating the net value of national capital assets. The BEA maintains an aging set of depreciation rates, patterns, and service lives for the residential and nonresidential structures categories. If revised, these data would improve renewal cost estimates, particularly for nonresidential structures.
CONCLUSION
This chapter discussed the recent history of facility cost models as tools for funding advocacy. For specifically estimating renewal costs, a well-known condition assessment tool, Builder, was found to be a poor fit. Alternatively, the committee found that a geometric depreciation model better matched the scope of renewal requirements. The committee also suggests that renewal estimates would benefit from updating two data series, depreciation rates and service lives, for specific facility types.
The next chapter will introduce the risk management framework needed to ensure that these requirements are weighted against all the other urgent and compelling needs of the federal agency to meet its mission, and will discuss its value and benefits.


