
Analytical Study of a Method for Literature Search in Abstracting Journals
P.S.LYKOUDIS, P.E.LILEY, and Y.S.TOULOUKIAN
ABSTRACT. The mathematical analysis of a method for literature search, using abstracting journals, is presented based on the following model. One starts searching the abstracting journal beginning with the most recent issue and going back through a number of years, a. Next, the bibliographies of the papers located in these a years are searched for new references. The references found in this second step of the search will, in general, cover a period of years, (b−a). Then one reverts back to searching through the abstracting journal again for another interval of a years starting with the year b. This cyclic procedure of alternate searches through the abstracting journal, followed by searching the bibliographies of uncovered papers is repeated until the total number of desired years of search is covered.
The cost of search by the above method is compared with the cost of the conventional method of search by simply going through all volumes of the abstracting journal. The ratio of these two costs is investigated. Equations are given for the evaluation of the search parameters a and b based on a study of the completeness of coverage of the period (b−a) years through the search of bibliographies. This part of the analysis is informative in itself since it determines the average number of years covered by the references contained in the bibliographies of papers located in a period of a years of searching through the abstracting journal.
An illustrative example is presented to demonstrate the use of the results obtained from the analysis.
1. Introduction
The world’s technical literature constitutes a wealth of information representing the record of experiences and technical achievements of thousands of scientists and engineers. During the last decade, the volume of this literature has been increasing at such a rapid rate that it has become nearly impractical to bring it under absolute control. On the other hand, in this period of highly
P.S.LYKOUDIS, P.E.LILEY, and Y.S.TOULOUKIAN Thermophysical Properties Research Center, School of Mechanical Engineering, Purdue University, Lafayette, Indiana.
accelerated scientific and technological developments, the need for keeping abreast of the world’s technical literature in a given field has become an absolute necessity in order to conserve such valuable resources as time, technical manpower, and money.
Recognizing the seriousness of this situation in the field of thermal properties of materials, the Thermophysical Properties Research Center (TPRC) was established in January 1957. The aims, functions, and operations of this Center are discussed in some detail in the Center’s prospectus, TPRC Pub. A-2. As part of its over-all research activities the Thermophysical Properties Research Center searches the world literature for the thermophysical properties of gases, liquids, and solids, and compiles this information for use in its own research work as well as for dissemination at large.
Information pertinent to the interests of TPRC comes to the attention of the Center through many channels. These channels embrace the abstracting journals in pure and applied sciences, listings of special governmental and industrial technical reports, academic work reported in dissertations and theses, major compendia, and other more fugitive sources. Among the various sources of information enumerated above, abstracting journals constitute the most extensive and readily accessible source of literature references. Since many of the major abstracting journals have been issued over a period of several years; they provide a rather unique source for a systematic search of the literature.
A brief familiarization with any one of the major abstracting journals will enable one to realize that a brute force, page by page, scanning of the issues of abstracting journals is prohibitive in time and effort. Furthermore, since the search of such journals must often be performed by rather highly trained scientific and technical personnel, the cost of such a search effort is very great. In view of these factors, and considering the broad scope of operations undertaken by TPRC, an effort was made to develop an efficient procedure for searching the technical literature in abstracting journals. Certain phases of the study reported herein have been in use at TPRC for nearly a year with extremely rewarding results. It is to be realized that the total aspect of the study presented herein embodies certain simplifying assumptions and that certain of the considerations may need modifications as a result of further experience. It should be emphasized that experimental data are needed to substantiate the details of the proposed method fully.
The authors wish to express their sincere appreciation to Messrs. T.Wing and R.Rodine, of the TPRC staff, for their careful study of the manuscript and their many valuable suggestions. Mr. Wing also kindly prepared all the figures in this paper.
2. General considerations
Consider the method depicted by Fig. 1 for searching a set of volumes of an
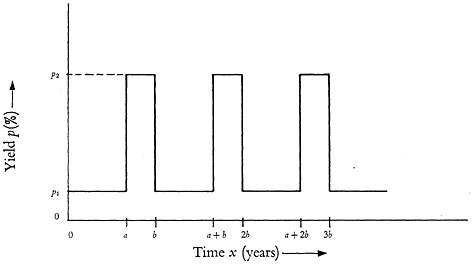
FIGURE 1. Search cycle treated in analysis.
abstracting journal. This is a schematic diagram of the percentage yield, p, plotted as a function of age, x, of issues surveyed, the search starting at the most recent year available, x=0. Obviously, such a representation can be obtained only for subjects which have received review in the abstracting journal for a period of years. Consequently, the search method described below will not be applicable to the literature of recent developments such as magnetohydrodynamics. A detailed analysis of the cycle in Fig. 1 is given in Sec 5.
During the first a years (starting with the most recent year) the abstracts are searched giving a yield, say p1. This number is defined as the per cent ratio of useful abstracts found (those pertinent to the subject matter under investigation) to the total number of abstracts searched. The following (b−a) years will be covered by searching the references listed in the papers located during the abstract journal search of the first a years. Let the yield for this period be p2. The search will be completed by repeating this cycle an appropriate number of times as indicated in Fig. 1.
Consider an abstracting journal which goes back a number of years, Y. Should the search be completed in an integral number of cycles, then
Y=n1a+n1(b−a)= n1b (1)
On the other hand, should the search be terminated with the abstracting journal, thus resulting in a non-integral number of cycles, one obtains
Y=(n2+1)a+n2(b−a)=a+n2b (2)
where n1 and n2 are appropriate integers.
The cost of search, C1, by the method leading to Equation (1) is given by
C1=K [n1a+n1 (b−a) (p1/p2)] (3)
while the cost, C2, by the method leading to Equation (2) is similarly given by
C2=K [(n2+1)a+n2(b−a) (p1/p2)] (4)
where K in both equations is a proportionality factor.
Equations (3) and (4) are based on the assumption that the number of references located through the search of the papers collected during the a years is equal to the number of references that would have been located if one had chosen to cover the period (b−a) years by searching through the abstracting journal.
The conventional procedure of searching in an abstracting journal is by going through the abstracts for all the years, Y. Let the cost of such a search procedure, which will be proportional to Y, be designated as Ca. With these definitions of costs one can form the following ratios:
(5)
(6)1
In the following sections the determination of the parameters, a, b, p1 and p2 is discussed.
3 Evaluation of the yield p1
To establish the value of p1 it is assumed that the information contained in all the issues of one complete year of the abstracting journal is adequate.2 Let the total number of abstracts contained in a given volume of an abstracting journal be equal or proportional to Et. Let the total number of useful abstracts located
by going through all the entries of this volume be Eu. The individual issues of an abstracting journal are divided into a number of sections. Let the total number of these sections be denoted by s and the total number of abstracts contained in the ith section and the corresponding number of useful abstracts be (Et)i and (Eu)i, respectively. With these notations, the following ratios are defined:
(7)
(8)
The quantities (Qt)i and (Qu)i are calculated and then ordered in such a manner that
(9)
Now it is possible to form the following s partial sums:
(10)
and
It is obvious that, owing to the inequality (9), Equation (10) yields the relations:
and
(12)
Equations similar to Equation (12) are not possible for the sum given by Equation (11).
Now the pairs of corresponding points (Tu)k and (Tt)k, which are s in number, can be represented in graphical form as shown by curve A of Fig. 23. From this figure it is seen that a number of s distinct points are obtained. For cases where a large number of sections are surveyed these points will lie on a continuous curve in the interval from k=1 to k=s. Curve A gives useful information on the distribution of abstracts of interest contained in the various sections of the abstracting journal.
In Fig. 2 three distinct types of distribution curves are shown. All three curves (A, B, and C) refer to the same subject matter obtained from three different abstracting journals.
The distribution curve, A, is very steep at the origin showing that a high useful yield is obtained by searching only a small fraction of the complete issue
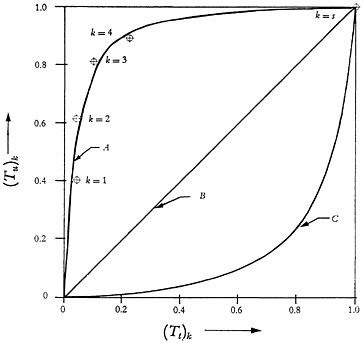
FIGURE 2. Typical yield distributions for different types of abstracting journals.
of the abstracting journal. Also, for high values of (Tt)k the gain in the yield (Tu)k is very small. This trend indicates that most of the useful information is found concentrated in a few sections containing altogether a rather small proportion of the total number of abstracts in the volume.
Curve B is a straight line showing that the useful information is evenly distributed among all sections. In this instance, the yield is directly proportional to the search effort.
Curve C shows the case of an abstracting journal where much search is needed for a small yield. In this type of abstracting journal one has to search most of the volume to redeem a satisfactory percentage of the total useful information.
It is obvious from the above analysis that an abstracting journal of type A is to be preferred to those of types B or C. Calculation of the slopes near the origin of the curves in Fig. 2 is useful since they are a measure of the cost for searching a particular abstracting journal. However, deviations from this criterion may be necessitated by the nature of the subject matter under study. For example, should a subject of interest be covered mainly in a section with
an otherwise extremely low yield, one has to include this section in the search although other sections with higher yields may have been excluded. Conversely, one may exclude a section with a relatively high number of useful abstracts but with the ratio (Qu)i/(Qt)i≪1.
From the above remarks one is led to conclude that an analysis of the ratio (Qu)i/(Qt)i gives useful guidance in the final selection of the specific sections to be searched.
Having decided on the optimum value of k, see Fig. 2, which defines the particular point of operation, the yield p1 can be calculated from its definition
(13)
To the extent that some abstracting journals may change their content within sections as well as their number of sections, from time to time, this analysis should be repeated at intervals over the period of publication of the abstracting journal.
4. Evaluation of the yield p2
The establishment of a relation for the yield p2 is not as simple as that for p1. At least three different factors have to be taken into consideration:
-
Only a certain percentage of the references listed in the papers found through searching the abstracting journal for the first a years will be pertinent to the subject of interest. Let this percentage be denoted by JI. In general one should expect JI≫p1.
-
Some of the references listed in the bibliography of one particular paper will also be listed in others. The simplest way to take this duplication into account is to assume that it represents, on the average, a certain percentage JII of the references of each paper located. Nevertheless, since finding of duplicate papers is an operation to be performed in any method of search, one need not include this item in the estimation of the cost of search by the present method. Hence, JII is assumed to be equal to one.
-
A high percentage of the references listed in the bibliographies of papers located during the a years of search of the abstracting journal will be dated within the same period and consequently will already have been located. On the other hand, a certain percentage of these references will be dated more than b years back which means that probably they will be located again during the second and perhaps third cycle of the abstracting journal search. Estimation of this factor, which will be designated JIII, is obviously of importance.
Before an analysis of JIII is attempted some information is required on the
distribution (by year) of all papers found in articles located through the abstracting journal search of a years.
For purposes of illustration consider that the papers published in 1953, on a specific subject, list a total of 464 references (excluding duplicate references). Their distribution with respect to date of publication is shown in Fig. 3. Such
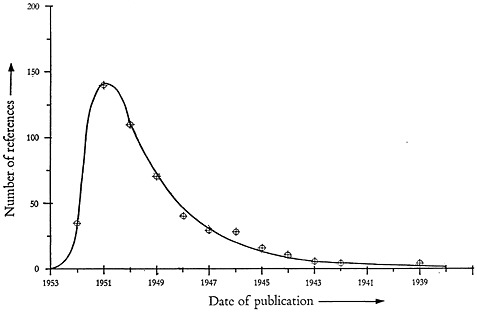
FIGURE 3. Distribution by date of useful references obtained from papers published in a given year, say 1953.
a graph can be normalized by dividing the ordinates by the total number of papers. If the total number of papers is large, and it were possible to order all papers by their date of publication, then the discrete points of Fig. 3 would give a continuous curve which can be anticipated to resemble that shown by solid line.
A preliminary study of the trend of a number of actual curves similar to the one of Fig. 3 has shown that the maximum occurs at about two years preceding the date of publication of papers whose references are listed.
In order to simplify the forthcoming analysis of JIII the curve of Fig. 3 is normalized and approximated by straight lines as shown in Fig. 4.
Let the interval d be divided into z equal parts. Then, if P is the ratio of the maximum ordinate in Fig. 3 divided by the total number of papers one can show that
(14)
The parameters c and d have to be determined by searching through a number of papers pertinent to the subject studied. It will be seen later that the parameter, P, does not enter the calculations.
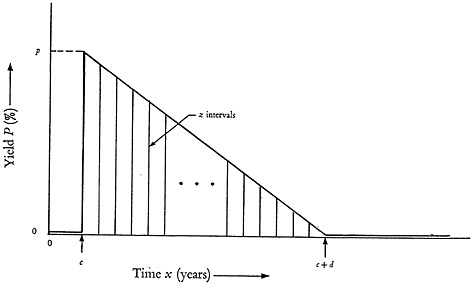
FIGURE 4. Simplified distribution model assumed in analysis.
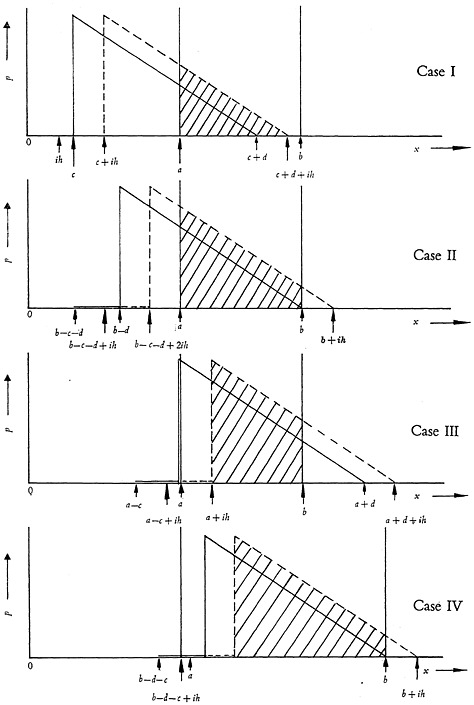
The full lines of Fig. 5 show how the assumed distribution of Fig. 4 fits into the search cycle pattern of Fig. 1. As one can see, four different geometric positions are possible. The case for which (c+d)<a is not shown since it is obvious that such a pattern is irrelevant to the analysis. The shaded areas of the triangles show the portion of references that are completely new. The point x=0, representing the commencement of abstracting journal search, gives the number of papers published in the same year as that of the abstracting journal. The point x=a gives the number of papers published in the same year as that of the termination of the abstracting journal search.
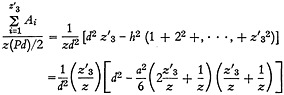
Now let the interval a be divided into z equal subintervals h, so that
a=zh (15)
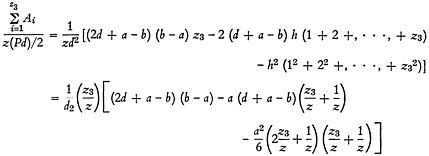
Also let the shaded area of the triangle contained within the time interval (b−a) be denoted by Ai. The ratio of the useful number of references to the total number of references obtained from the bibliographies is denoted by JIII. At this point in the analysis the assumption is made that the average number of papers published within the period of (a+d) years is constant. With this
understanding, which is true provided that (a+d) is not large, the following expression for JIII can be written:

(16)
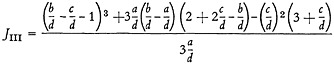
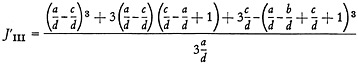
The detailed evaluation of JIII from Equation (16) is performed in Appendix A. This evaluation is assisted by a study of Fig. 5 where one observes that for increasing values of x the shapes of the shaded areas will be similar to cases I, II, and III if d≧(b−a), or similar to cases I, IV, and III if d≦(b−a). The first group, d≧(b−a), is distinguished from the second, d≦(b−a), by using primes on the pertinent parameters of the second group.
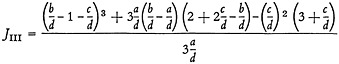
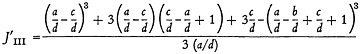
The calculations of Appendix A give JIII as a function of the ratios of the search parameters a, b, c, and d, for the two groups mentioned above. The results obtained for d≧(b−a) are:
(17)
and for d≦(b−a) are:
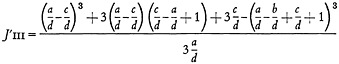
(18)
In conclusion, within the limitations of the conditions and assumptions imposed one can write by definition:
P2=JIJIII for d≧(b−a) (19)4
and
p′2=JIJ′III for d≦(b−a)
5. Adequacy of proposed search method and selection of parameters a and b
As it was mentioned before, once the shape of the distribution curve of Fig. 3 is established, leading to the simplified Fig. 4, the parameters c and d are defined.
It is apparent from Equations (5) or (6) that small values of a result in small cost ratios, R, leading to a more economical search. On the other hand, for reasons that will become evident later, small values of a result in incomplete information during the interval (b−a). In general one can show that as the ratio a/b becomes progressively smaller, the ratio of the two costs, R, also progressively decreases.
On the other hand, the extent to which b may increase is inherently limited, since, should b exceed (a+c+d), the interval [b−(a+c+d)] will not be covered by the references. Figure 5 shows that as b tends to equal a the time interval (b−a) receives better coverage by the references located in the bibliographies. Hence, a value of the ratio a/b has to be found which gives both a small cost ratio R and adequate coverage of the years (b−a).
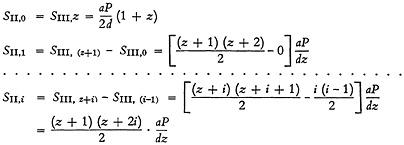
In order to proceed with the determination of the appropriate value of a/b, the general distribution of the total collected information for the period (b−a) years has to be found. This determination is facilitated by reference to Fig. 6
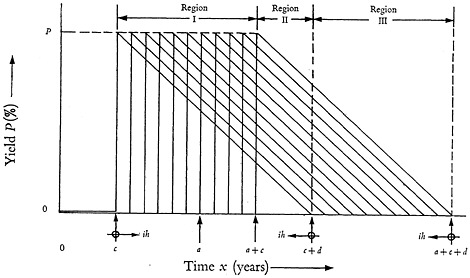
FIGURE 6. Geometric procedure of estimating distribution of useful references obtained from bibliographies of papers uncovered during a years of search in abstracting journal.
|
5 |
To prove this statement differentiate Equation (5) with respect to a/b. This gives In this equation, as (a/b) increases, p2 decreases, since as b approaches a, greater portions of the extremities of the triangles of Fig. 5 are not used. Hence p1/p2 increases thus making d(p1/p2)/d-(a/b) positive. Since p1/p2 and a/b are less than one, the derivative dR1/d(a/b) is always positive. (Note. In this footnote d stands for the differential sign and not as the search parameter.) |
which essentially is an extension of the cases presented in Fig. 5. The regions I, II, and III of Fig. 6 are chosen arbitrarily to simplify the analytical summation processes involved by shifting the origins of the distribution curves. In this sense the limits of regions I, II, and III have no physical significance in the time, x, and their choice is only dictated by geometric considerations so that the mathematical analysis yields simple continuous functions within each region. The detailed steps in the summation of the ordinates of the triangles leading to the determination of the percentage of available information in a given year appear in Appendix B. The results of the calculations for the three regions are found to be:
(20)
(21)
(22)
For x=a+c, Equation (20) or (21) gives
(23)
Equations (20) and (22) represent parabolas whereas Equation (21) represents a straight line. The quantity Smax is a number always smaller than one, approaching unity as a limit only if a=d. Figure 7 is a graphical representation of Equations (20) to (22) for the case a=5, c=2 and d=7, chosen arbitrarily but shown by experience to be representative values.
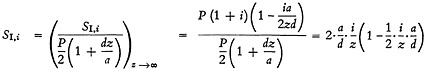
The parameters a and b can now be selected on the basis of the following argument. The maximum value of S will always be found at x=a+c, and will have a certain value, say M≦1, whereas b will be chosen in such a manner that Sx=b will not be smaller than a second value, say N, where again N≧M≧1. For given values of c, d, and M the exact shape of the curve S=S(x) in Fig. 7 is defined since from Equation (23)
hence,
(24)6
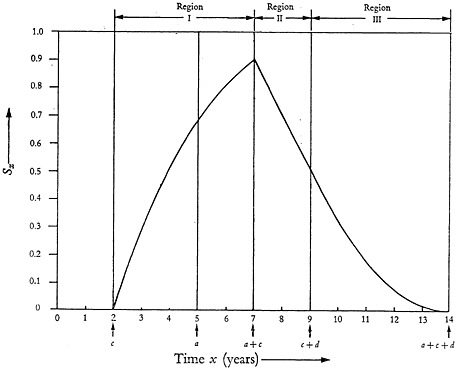
FIGURE 7. Result of summations of ordinates of Fig. 6 at each increment of time, h, for regions I, II, and III.
In order to calculate b, the value of N is selected so that N=Sx=b<Sx=a. As one can see from the equation in footnote 6, the value of Sx=a is close to the maximum value Sx=(a+c) since c in general is a small number (on the order of 2 years) compared with a.
The value of x for S=N can fall either in region II or region III of Fig. 7. On the assumption that N lies in region II, (c+a≦x=b≦c+d), one obtains from Equation (21)
But, since x=b by definition
(25)
Substituting the value of a from Equation (24) in (25) gives
(26)
When b lies in region II, b<(c+d), the relation between M and N as obtained from Equation (26) is
(27)
Now, for the case when b falls in region III Equation (22) gives
Once again, since x=b by definition
(28)
The new relationship between M and N for this case, as obtained from Equation (28) is
(29)
Having determined the values of a and b these can be substituted into the expression for JIII and the ratio R thus calculated.
6. Summary of results and operational procedure
The results of the foregoing analysis are summarized below in a manner which illustrates the procedural steps followed in order to ascertain the appropriate search pattern to be used in an extensive survey of the literature in a given technical field.
1. Having clearly understood the nature and the scope of the subject under consideration, select the appropriate abstracting journal which gives a representative coverage of the world literature on this subject.
2. Starting with the most recent year of the abstracting journal selected, search through all the sections of the journal for the complete year.
3. Based on the useful abstracts uncovered in each section of the abstracting journal and the total number of abstracts in each section, calculate (Tu)k and (Tt)k from Equations (10) and (11) and construct the yield distribution curve as given in Fig. 2.7
(10)
(11)
4. From the information in step 3 determine the yield p1 from Equation (13).
(13)
5. Obtain the papers represented by the useful abstracts uncovered in step 2 and search the bibliographies of all these papers for new references. From this information calculate JI and construct Fig. 3.
6. Approximate the actual distribution curve of Fig. 3 by a triangle, thus obtaining the simplified model of Fig. 4. From Fig. 4 the search parameters c, d, and c/d are obtained.
7. Select the desired values of M and N.
8. With the selected values of M and N calculate the ratio ![]()
![]() . If this quantity is greater than 2, then b falls in region II of Fig. 7. If this quantity is less than 2 then b falls in region III of Fig. 7.
. If this quantity is greater than 2, then b falls in region II of Fig. 7. If this quantity is less than 2 then b falls in region III of Fig. 7.
For region II: ![]() (27)
(27)
For region III: ![]() (29)
(29)
9. Based on the information obtained from step 8 use Equation (26) or (28) to calculate the ratio b/d.
For region II: ![]() (26)
(26)
For region III: ![]() (28)
(28)
10. By using Equation (24) calculate a/d.
(24)
11. Calculate JIII or J′III from Equations (17) or (18), depending on the sign of the inequality applicable to these equations. For d≧b−a:
(17)
For d≦b−a:
(18)
Also note that the inequality d≦b−a can be transformed into the more convenient form [1−(b/d)+(a/d)]>0.
12. With JI and JIII, or J′III, as the case may be, calculate p2 or p′2 from Equation (19).
P2=JI·JIII for d≧b−a
p′2=JI·J′III for d≧b−a (19)
13. Finally, using Equations (5) or (6), calculate R1 or R2 depending upon the type of search cycle used.
For integral number of cycles:
(5)
For non-integral number of cycles:
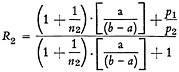
(6)
7. Illustrative example
The following factual example serves to illustrate the advantages to be derived through the use of the search procedure developed in the present analysis.
SUBJECT OF INTEREST
It is proposed to conduct an extensive literature search of the thermophysical properties of metals. The thermal conductivity, specific heat, thermal emissivity and the thermal diffusivity of both ferrous and non-ferrous metals and their alloys are of interest.
INITIAL CONSIDERATIONS
The type of information of interest is covered, rather extensively, in at least three well-known abstracting journals, namely Chemical Abstracts, ASM Review of Metals Literature, and Metallurgical Abstracts. Suppose Metallurgical Ab-
stracts is selected as the source journal to be used in the search of the literature. The question to be answered is: “What is the optimum method for searching the complete series of the Metallurgical Abstracts starting with the year 1957 and going all the way back to 1934, its first year of publication.”
PROCEDURE OF ANALYSIS
Following the step by step procedure outlined in Sec. 6 the following quantities are determined:
1. An item by item search of Volume 22 (September 1954 through August 1955) of Metallurgical Abstracts, consisting of 28 sections gives the approximate curve A of Fig. 2.
2. The search of this volume yields the quantities Eu=262 abstracts and Et=7850 abstracts.
3. From the search it is established that (Tu)k=0.87 and (Tt)k=0.29.
4. By using Equation (13):8
5. From the references listed in a limited number of papers relevant to the subject under investigation it is estimated that JI=0.80.
6. From the same investigation as in step 5, it is estimated that c/d=0.2.
7. It is planned to conduct the literature search for values of M=0.90 and N=0.40.
8. Calculate the quantity
9. Since, from step 8, 1.9<2, Equation (28) is used to calculate b/d.
10. From Equation (24):
11. Prior to the calculation JIII or J′III investigate the sign of the quantity hence,
d>(b−a)
One concludes from this that Equation (17) is to be used to calculate JIII.
12. p2=JIJIII=0.80×0.59=0.47
13. For a search procedure using an integral number of cycles
or
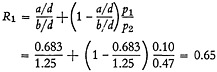
This final result indicates that, for the case investigated, the cost of the cyclic method of search is only 65% of the cost of the conventional way of searching by using the abstracting journal only. In other words, a 35% reduction in search cost is realized.
In concluding this illustrative example it may be worth noting that for the case under consideration the abstracting journal search and bibliographic search periods are taken nearly equal (a/b=0.546). Based on the observation in the text that a should not be greater than 5 years, and considering that Y=23 years in this example, Equation (1) gives bn1=23. Since a, b, and n1 are preferably whole numbers, one can select for the search cycle the combination:
a=3, b=6, n1=4
or
a=2, b=4, n1=6
If the first set of values are used, the Metallurgical Abstracts will be searched in four cycles with a=3 years and (b−a)=3 years.
APPENDIX A Determination of JIII in terms of search parameters a, b, c and d
The following analysis refers to Fig. 5 of Sec. 4 leading to the determination of Equations (17) and (18). In this figure let z1, z2, z3 and z1′, z2′, z3′ represent the number of time intervals h for which the areas Ai correspond to cases I, II, III and I, IV, III, respectively. With this notation one can write:
(A-1)
and
(A-2)
(A-3)
For the case of d≧(b−a), Equation (A-2), and by referring to Fig. 5, one can write by inspection pertinent relations for each of the three cases.
For case I:
Hence,
(A-4)
For case II:
Hence,
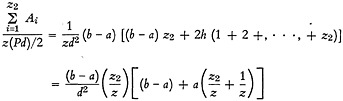
(A-5)
For case III:
Hence,
(A-6)
Now the ratio JIII is given by the sum of Equations (A-4), (A-5), and (A-6). In these expressions the time interval, h, can be arbitrarily chosen to be very small, making z a large number. Consequently the terms 1/z appearing in these equations can be neglected. With this simplification and by substituting for the ratios z1/z, z2/z, z3/z from Equation (A-2) and by using Equation (14), one obtains for d≧b−a
(A-7)
Dividing Equation (A-7), top and bottom, by (d)3 one obtains
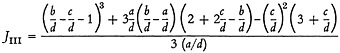
(A-8)
Equation (A-8) is the result given as Equation (17) in the text.
The expression for JIII, when d≦(b−a), Equation (A-3), can be determined in a manner similar to that above. However, in this instance one can utilize some of the results already obtained.
The relation corresponding to Equation (A-4) can be obtained by replacing z1 by z′1 in this equation, resulting in
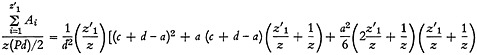
(A-9)
The relation corresponding to Equation (A-5) follows from an examination of Fig. 5, case IV, from which it can be established that

(A-10)
The equation corresponding to Equation (A-6) is obtained by again examining Fig. 5, case IV, from which one can write
Hence,
(A-11)
Again, by summing up equations (A-9), (A-10), and (A-11), neglecting 1/z, and substituting for the quantities z′1/z, z′2/z, z′3/z from Equation (A-3) one obtains for d≦b-a
(A-12)
(A-13)
Equation (A-13) is the result given as Equation (18) in the text.
APPENDIX B Evaluation of Sx as a function of search parameters a, b, c, d and time, x
In order to proceed with the calculation of Sx one must refer to Fig. 6 and consider the regions I, II, and III depicted therein. To facilitate the summation procedure within each of these regions, it is found desirable to locate the origin for x at the points c, (c+d), and (a+c+d), respectively. The direction of increasing x for each region is indicated by arrows in Fig. 6.
Following the practice as outlined in the text (see Equation 15), let the time interval a be divided into z equal parts of magnitude h. The summation of all ordinates of the triangles at each specific time corresponding to a specific value off within the regions I, II, and III is represented by SI,i, SII,i, and SIII,i, respectively.
Summations for region I are:
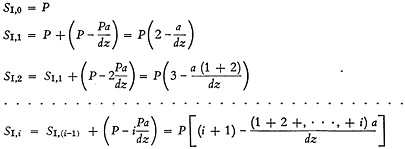
(B-1)
(B-2)
Summations for region III are:

(B-3)
(B-4)
Summations for region II are:
(B-5)
(B-6)
The range of variation of the indices h in the three regions is as follows:
|
Region I: |
0<i/z<1 |
|
Region II: |
0<i/z<(d/a)−1 |
|
Region III: |
0<i/z<1 |
By inspection of Fig. 6, one observes that the magnitude of SII,z [(d/a)−1], corresponding to the point x=(a+c), is the maximum of all Sx values in the three regions.
The quantities Si are by their definition proportional to the number of references redeemed in each specific year by searching the bibliographies of the papers located from the search of the abstracting journal. The maximum number of references that could have been compiled by this process is proportional to the summation of
all ordinates of the assumed distribution triangle. As it was found previously in Equation (14),
(B-7)
Now, dividing Equations (B-1), (B-3), and (B-5) by Equation (B-7) gives
(B-8)
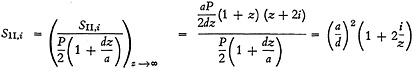
(B-9)
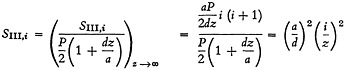
(B-10)
At this point in the development it becomes once again convenient to adopt a common origin, x=0, using the distance, x, from the origin for all three regions instead of different values of i/z. By performing the appropriate transformation one obtains
|
For Region I: |
|
|
For Region II: |
|
|
For Region III: |
|
Using these substitutions in Equations (B-8), (B-9) and (B-10) gives the new set of equations:
(B-11)
(B-12)
(B-13)
Equations (B-11), (B-12), and (B-13) are the results given as Equations (20), (21), and (22) in the text.
NOMENCLATURE
|
Symbol |
Definition |
|
a |
Number of years of literature search through abstracting journal. |
|
Ai |
Area of triangles in Fig. 6, bounded by search lengths of a and b years. |
|
b |
Number of years covered by a complete search cycle. |
|
c, d |
Search parameters, points (years) in search period. |
|
C |
Cost of searching through n number of repetitive cycles as shown in Fig. 1. |
|
Ca |
Cost of searching by going through abstracting journal only. |
|
E |
Number of abstracts in abstracting journal or bibliography at end of a paper. |
|
h |
Increment of time within period of (b−a) years. |
|
i |
A positive integer. |
|
JI |
Yield of useful references obtained from the bibliography of a paper originally located from abstracting journal. |
|
JII |
Average per cent of references obtained from the bibliography of a paper which are found duplicated in the bibliographies of other papers. |
|
JIII |
Ratio of useful references to the total number of references located in the bibliographies of all papers found during search of abstracting journal for a period of a years. |
|
K |
Proportionality factor. |
|
M, N |
Particular values of the summations Sx. |
|
n |
Number of search cycles. |
|
P1 |
Per cent of useful abstract yield in searching through abstracting journal. |
|
P2 |
Per cent of useful abstract yield in searching through bibliographies of technical papers. |
|
P |
Ratio of maximum ordinate of Fig. 3 divided by total number of papers. |
|
Q |
Ratio of abstracts defined by Equations (7) and (8). |
|
R |
Ratio of actual cost by cyclic search to cost of search by going through abstracting journal only, R=C/Ca. |
|
s |
Total number of sections in a given abstracting journal. |
|
S |
Summation of all ordinates of Fig. 6 at a given time, x. |
|
T |
Partial sum defined by Equations (10) and (11). |
|
x |
Time, in years. |
|
Y |
Length of total search period, in years. |
|
z |
Defined as a/h. |
|
Subscripts |
|
|
( )1 |
Refers to method of search using an integral number of cycles. |
|
( )2 |
Refers to method of search where search both commences and terminates using the abstracting journal (last cycle incomplete). |
|
( )i,k |
Refers to the ith or kth item of a series of consecutive numbers. |
|
( )t |
Refers to total number of abstracts. |
|
( )u |
Refers to useful number of abstracts. |
|
Superscripts |
|
|
( )′ |
Indicates the value of a parameter for the case d≧(b−a) as specified in Appendix A. |


