
Subject-Word Letter Frequencies with Applications to Superimposed Coding
HERBERT OHLMAN
ABSTRACT. The frequencies of occurrence of English letters in the first five positions of subject words and proper names are determined. With these frequencies a superimposed code is designed. No code book is required. Coding space is utilized almost as economically as with a random code. An empirical check is made. A quantitive measure of word popularity is proposed using letter-frequency data.
Coding, or the transforming of information from one guise to another, is one of man’s commonest activities. Every picture may be said to be a coding of some real scene and every written word a coding of some utterance—the brain itself is said to work with coded impulses.
Since the beginning of mass communications, starting with the invention of printing, and increasing with the widespread use of electronics, efficient use of existing space and time has become more and more important. Today, information theory provides a sound basis for determining the limits of transmission speed and accuracy. However, Shannon’s theory (1) does not tell us how to make a particular code more efficient. The design of codes is still an art; this paper deals with the improving of one particular type, superimposed coding. In information searching, mechanical aids are being used wherever possible. For a machine to process information, the information must be coded, usually into some variant of that most basic code of all, the binary. However, the most efficient code for pure selection appears to be a superimposed random code. Each coding position is used in a random manner, and a group of coding positions contain superimposed entries.
Calvin Mooers (2, 4) calls such coding “Zatocoding” and has applied it in his patented marginal-punched card system called Zator. However, Zatocoding requires an intermediate step in both coding and searching—a code
HERBERT OHLMAN System Development Corp., Santa Monica, Calif.
book containing a number of indexing terms with random-number equivalents.
Carl Wise (3, 4) has produced a nonrandom superimposed code which he calls “word coding” for use with marginal-punched cards of the Keysort variety. This type of code does not require an intermediate code book.
The author has attempted to combine the best features of both systems in coding English words by essentially pre-randomizing the alphabet. This is possible because there is a certain invariance of the letter frequencies within each letter position of a word.
As this system was developed in response to a specific need, it may be well to talk about it in concrete terms, and later apply its principles to other information systems. A marginal-punched card produced on IBM equipment (5) was used as the unit record. The thirty-eight positions along the top edge could code 38 words or phrases by using a direct code, but by superimposition every position could be made to do multiple duty. However, neither of the two systems previously described seemed to meet the requirement of a directly interpretable, yet efficient code.
Subject-word and proper-name lists were studied to find what letter frequencies occurred in the first five letter positions. Some work along these lines had been done, notably by Geisler for the ASM-SLA (6) with proper names, and by Krieger (7) with subject words (however, Krieger only considered initial letters in designing his code).
Striking similarities for initial-letter frequencies among various subject-word lists were found, as shown in Table 1. The average of five such lists show that 40% of the words begin with C, S, P, or A (in that order). Furthermore, 85% begin either with these four or B, M, T, R, E, F, D, G, H, or I—or only 54% of the alphabet.
Even greater consistency was found with proper-name lists, as shown in Table 2, but with a different ranking of the letters. The average of three such lists gave S, B, M, H, and C for the beginning letters of 40% of the names, and these five and D, G, K, L, R, P, W, A, and F (again 54% of the alphabet) accounted for 83%.
The Library of Congress list was chosen as typical of the subject-word lists, and the 1955 Syracuse Telephone Directory as typical of names. A systematic sample was obtained from each list by recording the top-left, middle, and top-right terms from every two-page spread.1 The frequencies of letters in each of the first five positions were then obtained for each list, as shown in Tables 3 and 4.
TABLE 1 Subject-word initial letter frequenciesa
TABLE 2 Proper-name initial letter frequenciesa
TABLE 3 Subject-word letter frequencies (332 words)a
TABLE 4 Proper name letter frequencies (309 names)a
TABLE 5 Amount of information (H) in subject-word lettera
TABLE 6 Subject-word cumulative letter frequencies (in rank order)a
|
|
|
a On an equiprobable basis, each letter would occur 3.846% of the time. |
TABLE 7 Weighted letter frequencies, %a
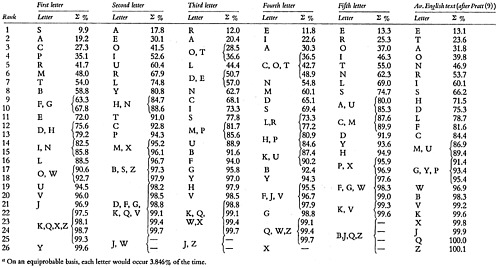
For the initial letters of subject terms, the rank order was S, A, C, P, R, M, T, · · ·; for second letters, A, E, O, I, U, R, L · · ·; for third, R, A, O or T, L, D or E, · · ·; for fourth, E, I, A, T or O or C, N, · · · ; and for fifth, E, R, O, I, T, N, L · · ·, as shown in Table 5. Cumulated frequencies are given in Table 6.
Table 5 also gives the information measure −pn log2pn for each letter in each position (8). For this purpose, percentage frequencies were assumed to represent actual probabilities, pn. The sum for each letter position,
represents H, the average uncertainty per letter-position or, as it is sometimes called, the average information represented by the letter position, in bits. The redundancy R is also shown on the bottom for each letter position.
These calculations show that the least redundant (or the most informative) letter position is the fourth, next to that the first, and then the third. Similar results can be shown for proper names.
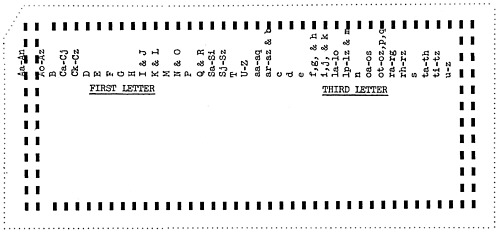
For the marginal-punched card application, first and third letter positions were selected for coding. Subject-word frequencies were weighted with proper names in a 7-to-1 proportion,2 as shown in Table 7. The 52 letters of
TABLE 8 Comparison of actual and predicted letter frequencies
|
First lettera |
|||
|
Letter |
Actual no. of cards dropped |
Actual % |
Predicted % |
|
Aa-An (median between anx and any) |
29 |
2.6 |
4.25 |
|
Ao-Az |
19 |
1.7 |
4.25 |
|
B |
54 |
4.9 |
5.3 |
|
Ca-Ci (median between cka and cke) |
65 |
5.9 |
4.0 |
|
Ck-Cz |
103 |
9.35 |
4.0 |
|
D |
46 |
4.2 |
3.8 |
|
E |
37 |
3.35 |
3.9 |
|
F |
36c |
3.3 |
4.4 |
|
G |
|
|
4.6 |
|
H |
|
|
3.9 |
|
I & J |
|
|
4.0 |
|
K & L |
|
|
4.0 |
|
M |
|
|
6.7 |
|
N & O |
|
|
5.3 |
|
P |
|
|
7.4 |
|
Q & R |
|
|
7.0 |
|
Sa-Si (median between siv and six) |
|
|
5.0 |
|
Sj-Sz |
|
|
5.0 |
|
T |
|
|
5.6 |
|
U-Z |
|
|
7.1 |
|
Third letterb |
|||
|
Letter |
Actual no. of cards dropped |
Actual % |
Predicted % |
|
aa-aq (median between ard and are) |
40 |
3.8 |
5.45 |
|
ar–az & b |
80 |
7.6 |
5.45 |
|
c |
60 |
5.65 |
5.1 |
|
d |
55 |
5.2 |
5.8 |
|
e |
100 |
9.45 |
6.4 |
|
f, g & h |
80 |
7.6 |
5.4 |
|
i, j & k |
45 |
4.25 |
5.6 |
|
la−lo (median between lov and low) |
45 |
4.25 |
5.85 |
|
lp−lz & m |
80 |
7.6 |
5.85 |
|
n |
80 |
7.6 |
6.5 |
|
oa–os (median between otf and oth) |
45 |
4.25 |
5.9 |
|
ot–oz, p, q |
35 |
3.3 |
5.9 |
|
ra-rg (median between rge and rgo) |
40 |
3.8 |
6.05 |
|
rh–rz |
65 |
6.1 |
6.05 |
|
s |
65 |
6.1 |
5.0 |
|
ta–th (median between tid and tie) |
40 |
3.8 |
3.85 |
|
ti–tz |
35 |
3.3 |
3.85 |
|
u-z |
70 |
6.6 |
6.3 |
|
Total |
1060 |
|
|
|
Avg. |
59 |
|
|
|
a Ideally each first letter position would comprise 5%. b Ideally each third letter position would comprise 5.5%. c Not carried to completion. Note: About 400 cards were used in study. Actual number was estimated by measuring cards dropped at 150 cards/inch. Predicted percentage based on Table 7. Dropping fraction, Fd=(G/H)Y=(2.7/18)1=15%. For 400 cards, Fd=60. H is the number of coding positions; G is the number of punches/card=1100/400; Y is the number of sorting positions=1. (See Wise (3) for derivation.) |
|||
first and third positions were then assigned to the 38 available positions as equally as possible, but under the restriction that alphabetical order along the side of the card be preserved. The result is shown in Fig. 1, and Table 8 shows the predicted frequency distribution for this code. Note that it was necessary sometimes to combine several letters in one position, and sometimes to split
one letter between two positions. These splits were chosen according to the median frequencies of English trigrams (9).
Splitting letters modifies the first-letter position somewhat by the second, and third somewhat by the fourth. Such letter-pair frequencies take account of intersymbol influence, and therefore make possible a better code than single-letter frequencies. H.P.Luhn has designed a superimposed code using randomizing squares (10) which takes advantage of letter-pair frequencies.
An empirical check of the letter code shown in Fig. 1 was made on a 400-card file maintained by the author. The results are shown in Table 83. The average dropping fraction for the third position alone compares well with the dropping fraction as calculated by formula, but the range (from 9 to 25%) is broader than hoped for. However, Table 8 shows that the agreement between actual and predicted frequencies in the third-letter position was very good, considering the alphabetic-order limitation imposed in assigning the positions.
By using data-processing equipment, much more elaborate studies on much larger samples would be possible. The author is working with such equipment and hopes to have some results available in the near future.
Equifrequency-letter codes have many other applications, including the preassignment of space in files and indexes, in cryptography, and in philology. For example, the data in Table 5 can provide a quantitative measure of subject word popularity. Taking a few words from the Library of Congress list of subject headings, we add the percentage frequencies of each letter (up to 5) together and divide by the number of letters. (Multiply each pn by 100 to get the percentage frequency.)
AIRCRAFT has a value of 9.3+11.1+12.0+6.2+12.0, 10.12
DIVIDER has a value of 3.6+11.1+0.6+10.8+2.0, 5.66
ICHTHYOLOGY has a value of 3.3+1.8+0.9+6.2+1.3, 2.70
These three words give some idea of the range possible in a subject-heading list. In general dictionary words, the highest found was SARI, with a value of 12.63, and the lowest, ONYX, with a value of 1.8. It is interesting to compare these values with the highest possible letter combination (not necessarily an English word), which is SAREE (value 12.96), and the lowest (value 0.06), The highest is very nearly realized in actuality, while the lowest never comes close. Also note that the word SARI is certainly uncommon English; this phenomenon may occur because the intersymbol connections are broken by taking single-letter frequencies.
ACKNOWLEDGMENT
The work described in this paper was performed while the author was in the employ of Carrier Corporation, Syracuse, New York.
REFERENCES
1. C.E.SHANNON, A Mathematical Theory of Communication, Bell System Technical Journal, July 1948, and following.
2. C.N.MOOERS, Zatocoding and Development in Information Retrieval, ASLIB Proc., February 1956, p. 3 (Many other papers by this author may be obtained from his Zator Co., 79 Milk Street, Boston, Massachusetts.)
3. C.S.WISE, A Punched-Card File Based on Word Coding, pp. 93–114, in Perry and Casey’s Punched Cards, Reinhold Publishing Corporation, New York, 1951.
4. MOOERS and WISE had discussions in American Documentation, April 1950, October 1950, and October 1952.
5. H.OHLMAN, The Low-Cost Production of Marginal-Punched Cards on Accounting Machines, pp. 123–26 American Documentation, April 1957.
6. JOINT COMMITTEE OF ASM AND SLA, ASM-SLA Metallurgical Literature Classification, American Society for Metals, 1950. (Figure 5, which was based on an analysis of 4870 names by A.H.Geisler in ASM Review of Metallurgical Literature.)
7. K.A.KRIEGER, A Punched-Card System for Chemical Literature, J. of Chemical Education
, March 1949, p. 163.8. E.T.KLEMMER, Tables for Computing Informational Measures, p. 75 in Quastler’s Information Theory in Psychology, Free Press, Glencoe, Ill., 1955.
9. F.PRATT, Secret and Urgent, The Story of Codes and Ciphers, Blue Ribbon Books, Garden City, N.Y., 1942, pp. 264–78.
10. H.P.LUHN, Superimposed Coding With the Aid of Randomizing Squares for Use in Mechanical Information Searching Systems, IBM Product Development Lab., Poughkeepsie, New York, 1956.


