
7
Fossil and Gaseous Fuels for Road Transportation
LIQUID FOSSIL FUELS
Liquid fossil fuels account for the majority of all transportation fuels today. The United States produces about 20 percent of global liquid fossil fuels, and in 2020, petroleum products accounted for about 90 percent of the total U.S. transportation sector energy use. (Biofuels contributed about 5 percent; natural gas accounted for about 3 percent; and electricity provided less than 1 percent) (EIA, 2020). Worldwide, fossil fuels supply about 84 percent of world energy (Ritchie and Roser, 2020), and petroleum and liquid fossil fuels are globally traded fungible commodities, hence no one country’s fossil fuels market is truly independent of global market supply and demand considerations.
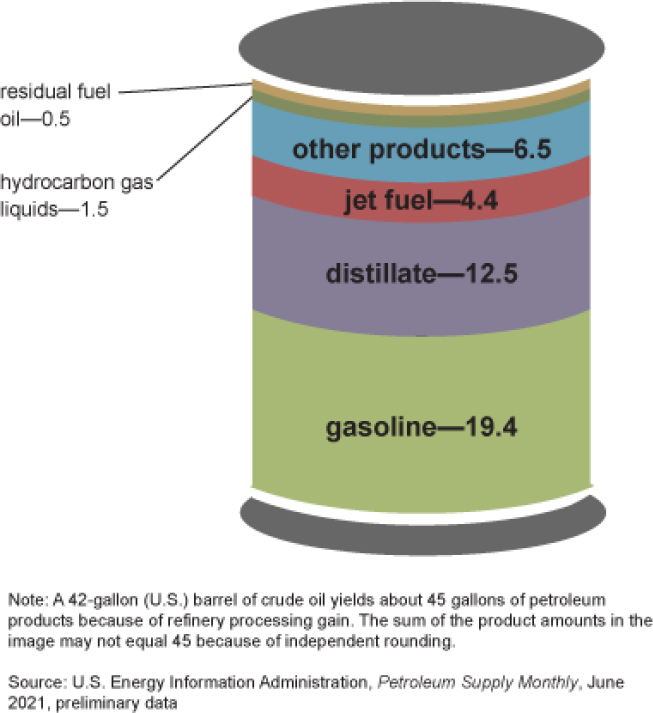
The U.S. product mix from refining crude oil is more gasoline-heavy than most other large economies, where middle distillates predominate. The most recent data on international petroleum products produced from crude oil, from the Energy Information Administration (EIA, 2022), are shown in Figure 7-1.
In addition to conventional gasoline, reformulated gasoline was mandated in the 1990 Clean Air Act amendments. The first phase of reformulated gasoline began in 1995 and the second phase in 2000. Reformulated gasoline now comprises about 25 percent of all gasoline sold in the United States, and it is required in cities with high smog levels as defined by the U.S. Environmental Protection Agency (EPA), and is it is optional elsewhere. Reformulated gasoline is currently used in 16 states and the District of Columbia. In addition to the federal reformulated gasoline standards, California has its own reformulated gasoline formulation (currently, CaRFG3), and while these regulations do not require the use of ethanol there is a separate oxygen content requirement.1 Ethanol as a gasoline substitute or as an additive has a long history but consumption of ethanol, mainly corn ethanol, increased in the United States for a variety of factors, including but not limited to blending mandates under the U.S. Renewable Fuel Standard (RFS) established in 2005 (RFS1) and in 2007 (RFS2), volumetric ethanol excise tax credits, and oxygenate demand following the phase out of methyl tertiary-butyl ether in 2006.
Several distillate fuels are used for transportation in the United States. Number 1 diesel fuel is a relatively light oil (550°F at the 90 percent recovery) defined in the American Society for Testing and Materials (ASTM) D9752 that is used in variable speed diesel engines such as those in city buses. Number 2 diesel fuel has a 90 percent distillation temperature of 640°F (also specified in ASTM D975). It is used in more uniform speed diesel engines, such as locomotives, trucks, and automobiles. Distillate fuels (1 through 6) are also used as heating oil and in numerous industrial applications. Since the United States has always used proportionally more gasoline than distillate fuels, U.S. refineries have always been configured for more gasoline production. Still, the United States has been exporting significant quantities of distillate fuels (more than 27 percent of production, or more than 1.2 MMb/d).
The United States consumes approximately 30 percent of worldwide jet fuel production (about 1.8 MMb/d pre-pandemic). Kerosene jet fuel (Jet A, A-1, JP-5, and JP-8) has a carbon number of C8 to C16, whereas the lighter naphtha-based jet fuel (Jet B and JP-4) are seldom used, other than for special applications. Other specialty jet fuels (such as JP1 and JP2) are either obsolete or used for very specific applications.
Synthetic Fuels
Synthetic fuels (“synfuels”) are also being proposed by some as potential low-carbon fuel substitutes or additives. Synfuels are liquid fuels that can be produced from coal, natural gas, or biomass through direct liquefaction, or more commonly through gasification of the source hydrocarbons to synthesis gas (mainly carbon monoxide and hydrogen), followed by cleanup and shift reaction and then synthesized into liquid or gaseous products, such as synthetic gasoline, distillates, lubricants, jet fuel, synthetic natural gas, and so on. There are two major routes to liquid fuels from synthesis gas, through the production of methanol followed by conversion of methanol over a zeolite catalyst to liquid products, or through Fischer-Tropsch synthesis. Synfuels can also be produced using water and a carbon input (e.g., flue gases or captured carbon dioxide [CO2]) by using renewable electricity to supply energy for electrolysis; subsequently, synthetic fuels can be generated through Fischer–Tropsch synthesis or methanation (Schaaf et al., 2014). Current production of renewable synthetic fuels is negligible as of 2021.
The economics of synfuels are challenged by the intensive chemical reactions needed, which result in low thermal efficiencies and in the production of CO2. Beyond issues of petroleum scarcity, some synfuel projects were justified as ways to monetize stranded natural gas, as demonstration projects, or as a way to produce high-value byproducts (such as high-quality waxes or synthetic lubricant blending stocks). In general, the products of synthetic fuel plants can be of very high quality, free of trace pollutants, and tailored to precise specifications. There are proposals to couple such projects with carbon capture utilization and storage (CCUS), to produce high quality fuel with less of an impact on greenhouse gas (GHG) emissions.
___________________
1 For details, see https://www.epa.gov/gasoline-standards/reformulated-gasoline.
2 ASTM D975 is the Standard Specification for Diesel Fuel Oils, see https://www.astm.org/d0975-21.html.
Calculation of Greenhouse Gas Emissions for Liquid Fossil Fuels
Though the majority of emissions from liquid fossil fuels come from their final combustion, emissions attributable to upstream extraction and processing may still be significant; emissions from petroleum systems in the United States alone totaled 47.2 Mtonne CO2e in 2019 (EPA, n.d.). Furthermore, there is substantial variability in the upstream emissions attributable to extraction and processing prior to final use, influenced by crude oil quality, region, and refinery configuration.
Liquid fossil fuels have been extensively analyzed in the literature, as well as incorporated into various life-cycle models. The Oil Production Greenhouse Gas Emissions Estimator (OPGEE) model estimates the life-cycle GHG emissions from the production, processing, and transport of petroleum.3 The model’s system boundary is from crude oil exploration through to the refinery gate. The model is open-source and allows users to input their own data on various parameters of crude oil production, including energy consumption, fugitive emissions, flaring, and qualities of the crude oil itself.
Downstream of oil extraction, refinery emissions are another important contributor to the life-cycle GHG emissions attributable to liquid fossil fuels. Refinery emissions include hydrogen production emissions used for hydroprocessing, emissions from energy inputs, and onsite emissions (both point source and fugitive emissions) at refineries. The Petroleum Refinery Life Cycle Inventory Model (PRELIM)4 is a lifecycle tool that can be used in conjunction with data on crude oil inputs to estimate refinery emissions across an array of crude oil and refinery configuration combinations. Further, as refinery outputs have different market values, energy densities and end uses, PRELIM may be used to attribute a share of overall emissions to specific outputs using different allocation assumptions. Generally, heavier and more sour crudes require additional energy and hydrogen to process, resulting in higher refinery emissions; also, additional refinery stages like cracking can increase emissions further. Generally, the end products with the highest share of emissions at the refinery tend to be low-sulfur diesel and gasoline.
There are significant uncertainties and significant variations in the current calculations of life-cycle GHG emissions from petroleum fuels (Masnadi et al., 2018). Data on flaring of methane (CH4) is available from satellite nighttime radiometry. Direct venting or leakage of CH4 has a considerably higher contribution to GHG emissions than combusting that CH4 through flaring due to the high global warming potential (GWP) of CH4; several studies estimate the contribution of these emissions (Lauvaux et al., 2022). Many oil fields with above-average petroleum production carbon intensities (CIs) have significant flaring.5 CH4 fugitive emissions and venting from oil and gas facilities are poorly detected, measured, and monitored, and are one of the significant sources of uncertainty in GHG life-cycle calculations for petroleum fuels. Improved reporting and transparency on oil sector emissions is needed to reduce uncertainty in life-cycle GHG emissions calculation for petroleum fuels.
The refining of petroleum produces multiple products: gasoline, diesel, naptha and other products. Emissions are assigned to the co-products using either allocation or displacement. Co-product displacement is typically used in U.S. analyses of petroleum fuels. It should be noted that allocation at the aggregate refinery level compared with allocation at the refining process level can result in different energy and emissions results, as may the allocation method (e.g., mass, energy-content, market value) at the refining process level (Wang et al., 2004).
Enhanced oil recovery, practiced at older wells, also increases the energy requirements and GHG emissions of petroleum, particularly when steam flooding is used. Heavy oils have higher energy requirements and GHG emissions for both extraction and processing. Renewable electricity can be used for extraction and processing, as is currently practiced in North Sea offshore fields. Utilization of CH4 as natural
___________________
3 See https://eao.stanford.edu/opgee-oil-production-greenhouse-gas-emissions-estimator.
4 See PRELIM: The Petroleum Refinery Life Cycle Inventory Model, See https://www.ucalgary.ca/energy-technology-assessment/open-source-models/prelim (accessed March 7, 2022).
5 See Carnegie Endowment, (n.d.). Oil Climate Index, https://oci.carnegieendowment.org/#analysis (accessed March 7, 2022).
gas avoids the need for flaring and can provide additional energy for onsite use or distribution if natural gas supply chain infrastructure is available.
Due to variation in CI across different sources of crude oil, changes in aggregate demand for crude oil may result in non-linear changes in the average CI of crude oil at the margins of production. Econometric analysis suggests that changes in demand may not be uniformly distributed across the mix of crude oils on the global market; for example, higher CI crudes such as heavy oil sands may be the first oils displaced by small demand reductions (Masnadi et al., 2021). In contrast, more profitable, lighter crudes with a higher market share are more likely to maintain production; however, these effects would dissipate with larger demand shocks.
The OPGEE model has been used to estimate the upstream crude oil intensity for the California low-carbon fuel standard (CA-LCFS), which incorporates annual updates of the CI of its crude oil mix to estimate deficit generation within the policy. The California Air Resources Board (CARB) uses OPGEE to estimate the weighted average CI of crude oil consumed in California,6 based on the volumes of crude recorded as either produced or imported into the state, and the sources of those crude oils. The CI of each crude is estimated based on site-specific parameters, and as noted previously, the inclusion of specific CI values in this report does not imply the committee’s endorsement of those values. The average CI for the production and transportation of crudes consumed in California in 2020 was estimated to be 13.39 gCO2e/MJ, following a steadily rising trend over the lifetime of the LCFS. To this, 92 gCO2e/MJ is added, representing the carbon emissions from refining, distribution, and combustion of the fuel, for a total of 105.39 gCO2e/MJ for 2020. These values are recalculated every year and California’s most recent reported value for crude oil is 100.8 g CO2e/MJ, as of 2021.7
The International Civil Aviation Organization’s Carbon Offsetting and Reduction Scheme for International Aviation (CORSIA) estimates a weighted average value (Prussi et al., 2021) for the average global jet fuel, based on global petroleum production and consumption, of 89 gCO2e/MJ. This value includes crude oil recovery, transportation and refining, jet fuel transportation, and jet fuel combustion, calculated with methodology consistent with the CA-LCFS calculations discussed above. However, while the CA-LCFS baseline values are evaluated annually and updated as petroleum fuels life-cycle emissions change, the CORSIA baseline reflects an estimated future global life-cycle emissions average and remains fixed over the course of the period of the scheme.
The U.S. RFS2 developed a 2005 baseline estimate of 93.08 g CO2e/MJ for gasoline and 91.9 gCO2e/MJ for diesel, with this baseline value remaining fixed throughout the regulatory period.
In sum, GHG emissions calculations for petroleum fuels include emissions from production, transportation, refining, and combustion. Emissions vary depending on the crude oil, transportation, and refining. Some low-carbon and renewable fuel policies, such as CORSIA and U.S. RFS2, have adopted a fixed value for baseline fossil fuel emissions; others, like CA-LCFS, use annual data to calculate new values annually.
Recommendation 7-1: Policymakers may consider recognizing the variation in GHG emissions across different petroleum fuel pathways, and include mechanisms to reduce these emissions in fuel policies.
Conclusion 7-1: Additional data, reporting, and transparency is needed for petroleum sector operations, including improved information on venting and flaring of methane.
___________________
6 See: https://ww2.arb.ca.gov/sites/default/files/classic/fuels/lcfs/crude-oil/2020_crude_average_ci_value_final.pdf.
7 See: CARB (n.d.) https://ww2.arb.ca.gov/resources/documents/lcfs-pathway-certified-carbon-intensities (accessed March 7, 2022).
GASEOUS FOSSIL FUELS AND HYDROGEN
The discussion of “gaseous” fuels in this section covers fuels derived from compounds that are gases at ambient conditions, rather than the state at which they are stored or used in internal combustion engines or fuel cells. The main gaseous fuels considered in this section are natural gas derived (mostly compressed natural gas and liquefied natural gas [LNG]), propane and hydrogen, and hydrogen derivatives such as ammonia.
It is estimated that there are nearly 30 million natural gas vehicles using LNG, compressed natural gas, and biomethane in the world, mostly in Asia (Iran, Pakistan, China and other countries), followed by lesser incidence in Europe (Italy, and gaining in other countries) and Latin America (Argentina, Brazil, and Colombia). LNG is used in large volumes as a way of transporting natural gas over long distances, where long distance pipelines are infeasible or disadvantaged, from major natural gas-producing areas such as the Middle East, Australia, several African countries, and increasingly the United States to markets mostly in Asia Pacific (China, Japan, Korea, Taiwan) and in Europe. In this case, LNG is mostly regasified and used for electric power production, with smaller amounts used for transportation.
The “hydrogen economy” is a proposed set of comprehensive alternative ways to produce, use, and store energy through hydrogen and its derivatives. While hydrogen is the most common of the known elements in the universe, it does not exist in usable quantities in nature and it needs to be produced from hydrocarbons (mostly through steam reforming of natural gas), or through electrolysis of water.
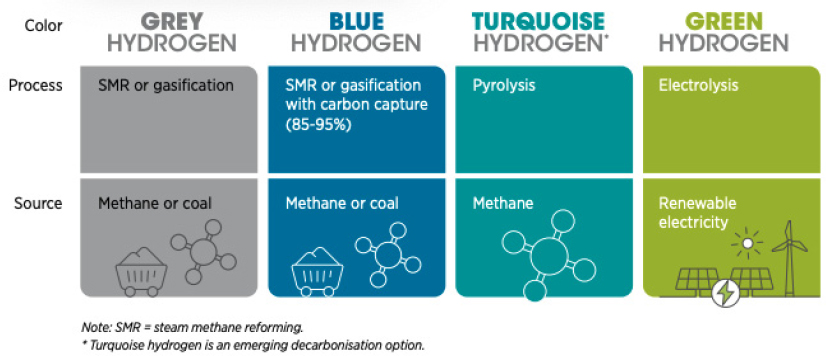
Hydrogen is used extensively in industry, for example for the manufacture of ammonia and methanol, and in petroleum refining. More than 95 percent of hydrogen is made today via steam reforming, mostly of natural gas, and is called “grey” hydrogen. Six percent of global natural gas production and 2 percent of global coal production is used for hydrogen production, resulting in about 830 million tonnes of CO2 emissions annually. Hydrogen is also a fuel component of rocket fuel, and has other uses such as a fuel in fuel cells. Proposed “blue” hydrogen is also to be produced mostly from natural gas through steam reforming, with the associated CO2 emissions captured, stored, or used productively. “Green” hydrogen is usually considered to be hydrogen produced through electrolysis with power derived from renewable sources. Less than 1 percent of global hydrogen production is produced from low-carbon sources today. “Turquoise” hydrogen production refers to a novel conversion process wherein CH4 is treated with thermal decomposition (i.e., CH4 pyrolysis) to generate hydrogen and solid carbon; this conversion process has not been commercialized (Sanchez-Bastardo et al., 2021). Figure 7-2 summarizes the color-based terms used to describe hydrogen produced with different technologies from different feedstocks.
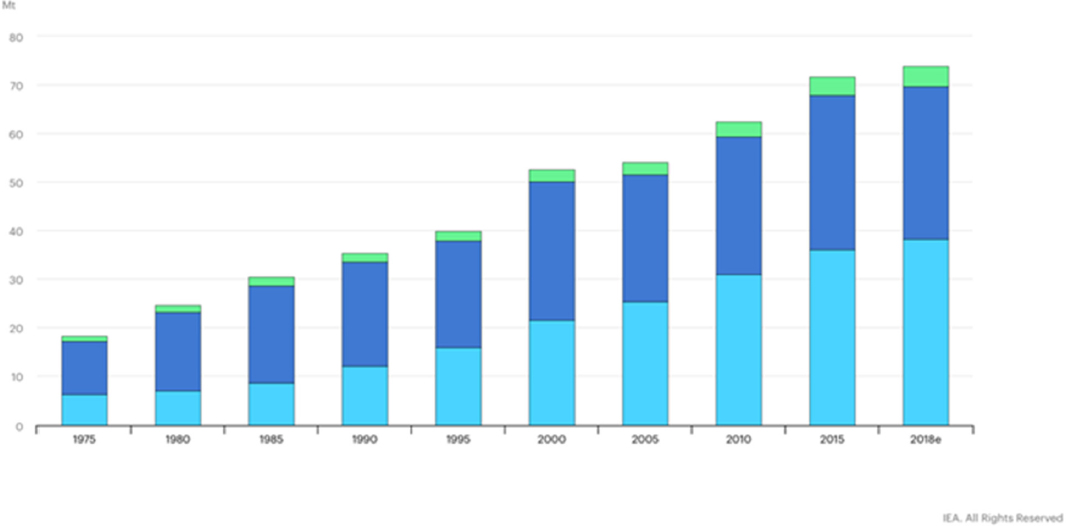
There are many proposals to use hydrogen for transportation and also in the context of a more ambitious “hydrogen economy”, that is, using hydrogen to store renewable energy (such as offshore wind energy); and using hydrogen for the production of “green” steel, ammonia, and concrete, among other products. This discussion will assess the current state, focusing mostly on the United States, but referencing countries with significant hydrogen proposals, namely the European Union (EU), Japan, and China, and provide a context of some history of past hydrogen economy efforts. Figure 7-3 shows the increased global production of hydrogen since 1975.
Because today hydrogen is most commonly produced via steam reforming of natural gas, the methodological issues in life-cycle assessments (LCAs) of these two fuels are closely related. Natural gas can be used as a transportation fuel in its own right and is a common input to other fuel supply chains. LCA methodological issues for evaluating natural gas systems can therefore have wide-ranging implications for the understanding of low-carbon fuels.
Natural Gas
Global natural gas production has been increasing at a higher rate than oil production, and while there has been a pandemic-caused decline in 2020, it is picking up again and similarly to global oil production, it is projected to keep increasing through this decade. In many major markets, including the United States, natural gas has displaced coal as a major electrical energy production source. Figure 7-4 shows domestic natural production since 19718 The IEA estimates that the oil and gas sector emitted 82 million tonnes of CH4 (around 2.5 gigatons of CO2 equivalent) in 2019.
___________________
8 See https://iea.blob.core.windows.net/assets/52f66a88-0b63-4ad2-94a5-29d36e864b82/KeyWorldEnergyStatistics2021.pdf (accessed on 04/21/2022).
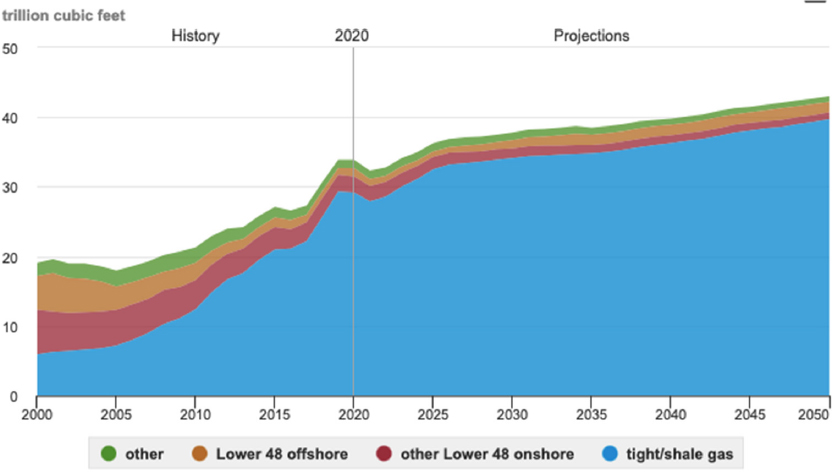
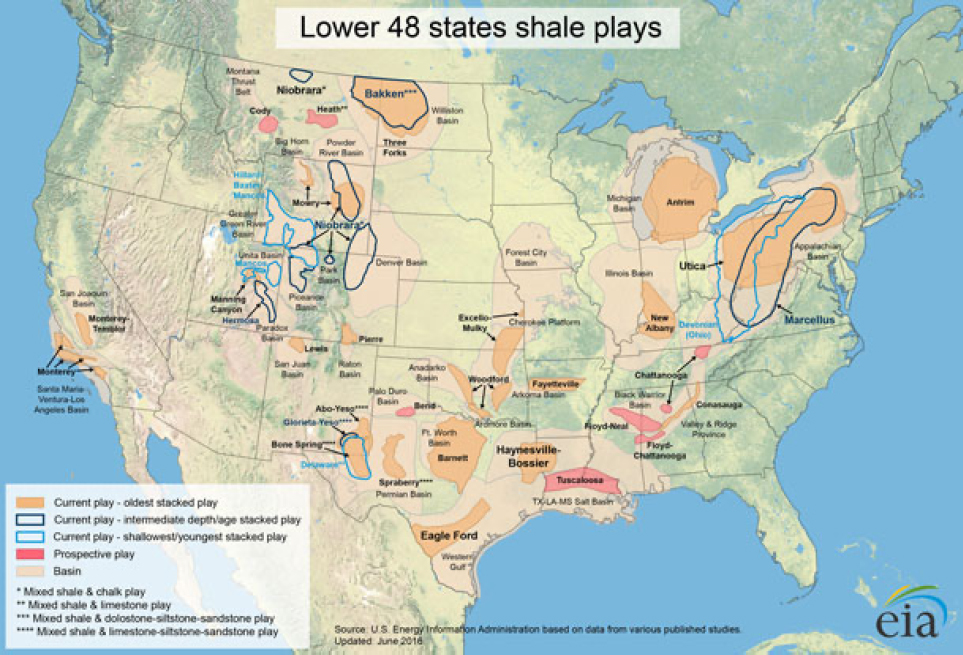
Natural gas is produced mostly from shale and tight gas resources from shale plays across the country (Figure 7-5). The share of natural gas extracted from shale plays has increased significantly over the last decade, from approximately 165 billion cubic meters (BCM) in 2010 to 805 BCM in 2020, comprising approximately 78 percent of domestic marketed natural gas production.
There are multiple steps involved in natural gas recovery and delivery to the point-of-use (see Figure 7-6). In natural gas LCAs, it is important to consider direct CH4 emissions from each step of this supply chain, which may derive from venting, flaring, or leaking (Burnham et al., 2012).
One of the first steps in producing natural gas is to drill a well. During well completion, water, hydrocarbon liquids, and natural gas all flow up from the well (Allen et al., 2013). These components of the flowback are separated. Tanks that contain the water and hydrocarbons are vented to the atmosphere. The gas may be flared or retained for sales. The configuration of the equipment that manages the flowback, which Allen et al. (2013) grouped into five different categories, can affect the amount of fugitive CH4 emissions from the operation along with the duration of the flowback period. CH4 emissions from completion at 27 different sites exhibited a striking range from 0.01 megagrams (Mg) to 17 Mg. It is this type of site-to-site variation, which holds for completion along with other stages in the natural gas supply chain, that leads to differing results among natural gas LCA, which may not necessarily show uncertainty.
Operating wells also have several different CH4 emission sources. Over time in a natural gas well, the pressure from the reservoir declines, and liquids can accumulate that reduce the amount of gas flowing to the surface. A liquid unloading procedure removes these liquids. Well blowdown is one type of liquids unloading procedure. In it, the well is closed, pressure builds up, and then the well is vented to the atmosphere, releasing the problematic liquids along with CH4. The choice of unloading procedure and the well’s characteristics determine the level of CH4 emissions that will occur during liquids unloading. As a well ages, it is likely that it will require repair, or workovers, which can involve venting the well and, accordingly, CH4 emissions.
Fugitive CH4 can escape from oil or condensate tanks, pneumatic controllers and pumps, and fittings, flanges, and valves. The rates of these emissions are highly dependent upon the adoption of technology to reduce these emissions such as replacement of high-bleed valves with low-bleed valves and using LiDAR-based programs to detect and replace leaky system components.
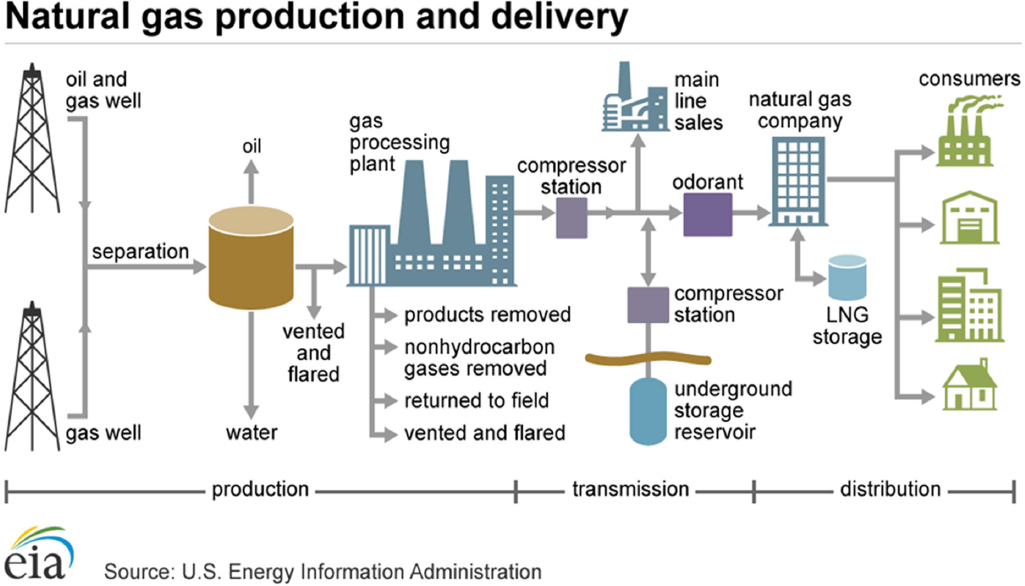
Flaring of natural gas emits CO2 and CH4. There are commitments and targets to reduce flaring, but these are not always met. Rates of flaring can depend on several factors including the number of nearby wells. When other wells are nearby, the economics of building pipelines to transport gas for use instead of flaring on site improve; flaring rates may be lower (Willyard, 2019).
The last step in natural gas production is the processing step. During this step, the acid gas removal process vents CO2, which is another notable emissions source in the overall natural gas supply chain. After processing, natural gas enters the transmission and distribution system to the point of end use. CH4 leakage throughout this system contributes to life-cycle GHG emissions of natural gas.
There is variability in CH4 emissions throughout the natural gas supply chain depending on the location of natural gas production and the extent to which emissions reductions measures are in place (Alvarez et al., 2018). One method to estimate these emissions that could inform parameter selection in LCAs is developing emissions factors from measurements on representative samples of equipment and then multiplying these factors by activity levels (e.g., numbers of equipment and associated throughput). This method is called “bottom-up” and is summarized in Figure 7-7 in the context of Rutherford et al. (2021).
Another approach, called “top down,” is to measure CH4 concentrations in the atmosphere near natural gas infrastructure, which may be done, for example, with low-flying aircraft. Recently, a top-down estimate was developed for the Permian Basin using satellite observations paired with atmospheric inverse modeling that reported that 3.7 percent of the CH4 produced in the Permian Basin is emitted (Zhang et al., 2020). A second study reported CH4 emissions to be 9.4 percent of gross natural gas production in the portion of the Permian Basin in New Mexico (Chen et al., 2022). On the other hand, Alvarez et al. report a national average value of 2.3 percent as a national average CH4 leakage rate from natural gas processing based on bottom-up methods of emissions estimation (Alvarez et al., 2018). They report relative agreement with other top-down studies. Alvarez et al. hypothesized that differences between bottom-up and top-down emissions estimates can often be explained by the latter’s inclusion of abnormal, high-emitting events.
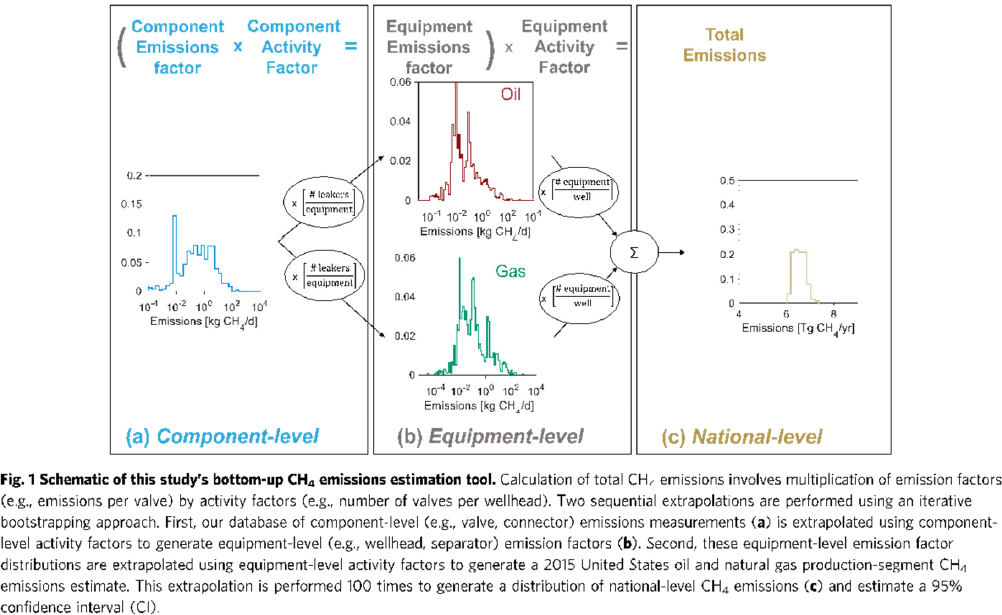
Top-down estimates can capture irregular CH4 leakage such as unintentional emissions during storage and equipment leakage (Rutherford et al., 2021) that may be excluded from bottom-up estimates. Rutherford et al. (2021) developed a new model for CH4 emissions in the natural gas production supply chain based on existing inventory data (3700 measurements from six studies). It employed a bottom-up approach (Figure 7-7) and a new statistical technique (bootstrap resampling) to these data that aimed to capture these unintentional emissions from so-called super emitters. Emissions estimates based on the model exhibited strong agreement with site-level measurements, indicating that bottom-up approaches can be robust and provide reliable emissions estimates. Rutherford et al. (2021) compared their results with those of the EPA Greenhouse Gas Emissions Inventory (GHGI), which is a commonly-used data source for understanding natural gas emissions. The emissions estimates in the EPA GHGI, however, are based on data from the 1990s. As with previous studies (Alvarez et al., 2018), Rutherford et al. generated estimates of CH4 emissions in the natural gas supply chain that greatly exceeded (~80 percent) the EPA GHGI’s estimate. Breaking down the reason behind this discrepancy, Rutherford et al. determined that one driving factor was emissions from tanks. Calculated from engineering models in the EPA GHGI but based on measurements in Rutherford et al.’s work, these emissions were significantly underestimated in the EPA GHGI. Rutherford et al. noted the lack of tank emissions data as being a significant data gap that requires addressing. Overall, Rutherford et al. noted that updated component (e.g., valves, tanks) counts in the natural gas system in the United States requires updating from the 1990s inventory that is commonly used, including in the EPA GHGI and Rutherford et al.’s work. There is also a pressing, ongoing need to increase CH4 emissions collection at the component level. Building inventory data will cut data gaps and improve sample size and representativeness to enable enhanced statistical techniques for inventory building.
The Greenhouse gases, Regulated Emissions and Energy use in Technologies (GREET) model (Argonne National Laboratory, n.d.) is widely used in transportation fuel LCAs and updates the natural gas parameters it contains annually. The GREET model’s use of different parameters for upstream natural gas leakage is discussed to illustrate their impact on the overall emissions for natural gas, not as an endorsement of the model’s validity or to provide a central estimate for natural gas emissions. The 2021 GREET release uses a combination of data from Rutherford et al. (2021) and Alvarez et al. (2018) as its default values for natural gas pathways, rather than values from the EPA GHGI, because of the growing recognition that the latter data source underestimates CH4 emissions in the natural gas supply chain. Changing the CH4 leakage assumptions in the GREET model can illustrate the overall impact in natural gas LCA results when using parameters from EPA GHGI or from the literature (Rutherford et al., 2021; Alvarez et al., 2018). The differences cause a ~40 percent difference between the two emissions estimates.
Together, these estimates suggest CH4 emissions rate is one of the most critical parameters in an LCA of natural gas and products or fuels made from it. Judicious, transparent selection with a well-documented rationale based on the most recent inventory data is essential. As shale gas grows to comprise a larger share of domestic natural gas production, additional data collection may be necessary to characterize its contribution to natural gas life-cycle emissions more broadly.
Another complicating aspect of natural gas LCA is co-product handling. Natural gas is often co-produced with oil and natural gas liquids in ratios that are highly regionally dependent. For example, in the Eagle Ford Shale, wells can range from nearly entirely dry (i.e., producing almost entirely natural gas) to producing a mix of the three co-products (Chen et al., 2019).
The above-described emissions must be allocated among these products. One option for allocation is energy allocation because all products are used as energy carriers; this may create some inconsistency for instances where a co-product is a chemical input (see Allocation section, Chapter 6). Market value allocation would also be possible but is complicated by substantial fluctuations in the market values of the various co-products. Another option is to allocate each supply chain element’s emissions to each product depending on whether that element is necessary to produce that co-product. In this approach, for example, emissions from tanks storing condensate oil would only be assigned to the oil. Furthermore, emissions could be evaluated at scales ranging from individual gas processing plants to regions within a basin, and at the basin-level. Chen et al. (2019) investigated the effects of co-product handling and choice of scale in these systems in the Eagle Ford Shale and reported that differences in GHG emissions per MJ of energy
product could be up to 25 percent different depending on choice of co-product allocation technique. Accordingly, there is a need for consistent and transparent methodologies and metrics in co-product allocation approaches in natural gas LCA. For example, if emissions are assigned only to the natural gas product as opposed to across all co-products within a basin, natural gas emissions will be reported as significantly higher (again, depending on the amount of co-products) than if emissions are allocated among all co-products (Allen et al., 2021).
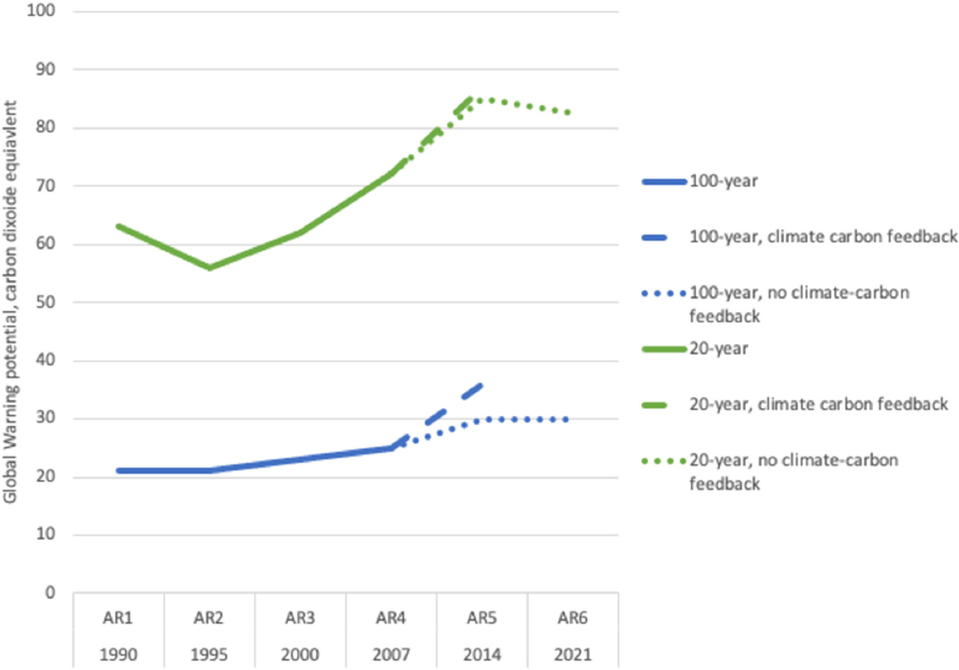
As Grubert and Brandt (2019) illustrate, choice of GWP in LCAs of natural gas can have a profound effect on results. The choice of GWP for CH4 can have a large impact on the final CO2e emissions impact of natural gas, even when applied to relatively small quantities of CH4 leakage. First, the estimate of CH4 GWP has evolved over the years in Intergovernmental Panel on Climate Change (PICC) reports based on enhanced scientific understanding (Figure 7-8). Further, it is possible to use a GWP in calculations that account for climate–carbon feedback. Finally, the choice of using a 20-year or 100-year GWP has a significant impact on results. Choice of GWP must be clearly documented in an LCA of natural gas and, ideally, results will be reported for both 20- and 100-year GWPs to show results’ sensitivity to this choice.
Limited supply chain GHG emissions from natural gas systems are relatively straightforward to identify. Extended supply chain and market-mediated effects that influence GHG emissions are more challenging. Increased production of ethane as a co-product of natural gas has led to this natural gas liquid’s main use as a feedstock for ethylene. This has some effect on petroleum refinery configuration and emissions. Oil produced from natural gas fields could serve as a tie-over as the nation transitions to increased electrification and could prolong dependence on liquid fuels made from fossil carbon. The natural gas market is tied closely to heating and power generation; the increased use of natural gas as a transportation fuel could drive up prices leading heating and power generation to turn to other energy sources, which could include biomass or coal in addition to renewables.
Several factors complicate natural gas LCA, including spatial variability in the amounts and types of co-products produced and CH4 emissions from venting, flaring, and leaking. These facets of natural gas systems will evolve over time as wells age, new wells are drilled, and industry adopts emissions-reducing practices.
Conclusion 7-2: More emissions inventory data from natural gas systems are needed, particularly regarding emissions from storage tanks.
Conclusion 7-3: The share of natural gas extracted from shale as a share of overall domestic consumption in the United States has increased rapidly and additional research and data collection will be necessary to better understand its production process and climate implications.
Top-down emissions estimates for the natural gas industry collected using satellites and field measurements often capture irregular or unintended emissions of CH4 along the supply chain that may be excluded from bottom-up assessments. As more component-level emissions measurements are collected, there may be increasing ability to reconcile top-down and bottom-up emissions estimates.
Additional research and data collection are necessary for the LCA community to inform the judicious and consistent selection of natural gas LCA parameters and methods.
Conclusion 7-4: Assumptions on co-product handling methods have broad implications on natural gas LCAs. Additional research and data collection on industry practices can assist in the understanding of choice of co-product handling for natural gas production.
Conclusion 7-5: The selection of methane emissions leakage rate within an LCA has profound impacts on the overall estimated climate impact of natural gas production. Additional research and data collection is necessary to identify representative leakage rates for the natural gas industry and is essential to enable comparison of natural gas LCA across studies.
Recommendation 7-2: Further research should be done on the key parameters used to assess the climate impacts of natural gas production, such as methane leakage rates. These parameters will evolve as technology advances, data availability increases, and statistical methods may be used to translate the additional data into improved emissions estimates.
Recommendation 7-3: Further research on the climate impacts of natural gas production should draw upon real world activity data in part supplied by the natural gas industry and in part from independent studies using satellite and remote sensing technology to improve methane emissions rate estimates; these should be revisited frequently— at least every five years.
As described previously, hydrogen can be made from steam-methane reforming or authothermal reforming of CH4 with (blue) or without (grey) CCUS. Currently, global CCUS capacity is limited to a few relatively small demonstration projects. In the case of blue and grey hydrogen, the LCA issues pertaining to natural gas as outlined in the previous section can significantly influence hydrogen LCA results.
For the proposed blue hydrogen schemes, the approach to handling CCUS is critical. It should be noted that CO2 emissions are in both the steam-methane reforming and authothermal reforming product stream and flue stream. CO2 is more difficult to capture in the latter case because it is less pure. Therefore, the rate of CO2 capture should be specified explicitly for each stream that contains CO2 so that a holistic rate of CO2 capture is reported. This should hold true regardless of the location of CO2 capture (e.g., prior to or at the flue gas outlet). Further, the ability of technology to capture CO2 is improving with rates predicted to reach 90 percent in the future. Currently, rates at existing blue hydrogen facilities, which number only four, range from 29 percent to 43 percent (Gorski et al., 2021). The level of CO2 capture from emissions streams accordingly will affect life-cycle GHG emissions of blue hydrogen. The use of present-day
measured CO2 capture rates rather than assumed future values has a significant impact on the net GHG savings associated with blue hydrogen (Howarth and Jacobson, 2021). Other emission sources in steam-methane reforming and authothermal reforming include combustion of fuel to provide energy to the facilities, including, potentially, for operation of CCUS processes. The source of energy used for steam-methane reforming or authothermal reforming influences the life-cycle GHG emissions of blue hydrogen.
Other relevant LCA issues include the permanence of sequestered CO2 in carbon capture and storage systems. Given that carbon capture and storage systems are relatively young, it is unclear how much leakage may occur in the future. Furthermore, treatment of sequestered carbon in carbon capture and storage systems has come under great scrutiny in the LCA community (Corsten et al., 2013). For example, it has been suggested that no emissions avoidance credit should be taken by the product system that uses CCUS for the CO2 that is stored underground (Singh, 2021).
If the captured CO2 in a blue hydrogen facility is converted into a second product (e.g., algae-derived fuel, polyol, or other chemical), LCA issues pertaining to carbon capture and utilization must come into play as described in a previous report (NASEM, 2018) and by von der Assen et al. (2013). In this instance, a co-product allocation method has to be selected to manage the division of energy and emissions burdens between the co-produced hydrogen and product derived from carbon capture and utilization.
Green hydrogen is to be primarily made using electrolysis powered by renewable electricity. The emissions attributable to this pathway take into account any energy consumption and associated emissions for delivering and purifying the water. One key uncertainty in the LCA of green hydrogen is whether the renewable electricity that is assumed to be used in its production is “additional.” That is, it is desired that demand from electrolyzers for renewable electricity does not divert that electricity from other uses. If that occurred, the overall demand for electricity would rise. Accordingly, increased generation, potentially from fossil fuels like coal and natural gas, would be necessary. This renewable electricity additionality is a requirement in the European Union Hydrogen Strategy, which specifically states that additionality of the renewable energy used to make green hydrogen should be verified (Pototschnig, 2021). In the absence of additionality requirements or measures to ensure that renewable electricity is used to produce green hydrogen, the upstream GHG emissions attributable to fossil fuels in the grid would be attributed to the hydrogen and can therefore greatly increase its assessed emissions.9
There are several methods to demonstrate the additionality of renewable electricity used to produce green hydrogen. One way to ensure that renewable electricity is used to produce green hydrogen is to physically connect electrolyzers to solar or wind power as their sole power source. A second is to use a power purchase agreement or similar certification to link the production of green hydrogen and the generation of renewable electricity. However, the electrolyzers could consume electricity at a time when no electricity produced from renewable resources are provided to it. This type of certification could have varying levels of effectiveness; for example, the eligibility may require that the renewable electricity is not incentivized by any incentives beyond the power purchase agreement held by the green hydrogen producer. A final option is to produce green hydrogen during hours when only renewable electricity is produced as the marginal electricity source. In any case, proving additionality of renewable electricity that is used in green hydrogen production is complex (Bracker, 2017), and no best practice has been established. In LCA, a consequential framework would be best able to handle shifts in electricity generation in response to increased demand from electrolyzers. Attributional LCAs may adopt an average grid CI or assume renewable electricity is used in the production of green hydrogen as a means of comparing the CI of green hydrogen—assuming it is indeed produced using renewable electricity— against other fuels.
The main factors that influence blue hydrogen GHG emissions are the energy source for steam-methane reforming or authothermal reforming and the carbon capture efficiency, along with parameters used to model upstream natural gas production. The main factors that influence green hydrogen emissions are the additionality of the electricity used for green hydrogen production.
___________________
9 EIA, 2020. Green Hydrogen: A Guide for Policymaking. See https://www.irena.org/-/media/Files/IRENA/Agency/Publication/2020/Nov/IRENA_Green_hydrogen_policy_2020.pdf.
Conclusion 7-6: The life-cycle emissions attributable to green hydrogen are sensitive to assumptions on the upstream source of electricity used for electrolysis, as the difference in emissions between hydrogen produced from renewable electricity and even grid-average electricity is substantial.
Recommendation 7-4: To ensure renewable electricity is supplied via the grid to produce green hydrogen in the context of an LCFS, certification is necessary to ensure that the source of the electricity and its additionality.
Recommendation 7-5: In the context of an LCFS, LCAs of hydrogen should be well documented with choices of key parameters supported with facility-measured data or well-supported citations from the literature. These key parameters include the choice of energy source for steam-methane reforming or authothermal reforming, the carbon capture level from the waste gaseous stream, source of upstream electricity, and the rate of methane or CO2 leakage. Where relevant, the approach to quantifying emissions of upstream natural gas production should align with those used elsewhere in an LCFS for other fuels produced from natural gas.
REFERENCES
Allen, D. T., Q. Chen, and J. B. Dunn. 2021. Consistent metrics needed for quantifying methane emissions from upstream oil and gas operations. Environmental Science & Technology Letters 8(4):345-349. https://pubs.acs.org/doi/10.1021/acs.estlett.0c00907.
Allen, D. T., V. M. Torres, J. Thomas, D. W. Sullivan, M. Harrison, A. Hendler, S. C. Herndon, C. E. Kolb, M. P. Fraser, A. D. Hill, and B. K. Lamb. 2013. Measurements of methane emissions at natural gas production sites in the United States. Proceedings of the National Academy of Sciences 110(44):17768-17773.
Alvarez, R. A., D. Zavala-Araiza, D. R. Lyon, D. T. Allen, Z. R. Barkley, A. R. Brandt, K. J. Davis, S. C. Herndon, D. J. Jacob, A. Karion, and E. A. Kort. 2018. Assessment of methane emissions from the US oil and gas supply chain. Science 361(6398):186-188. https://www.science.org/doi/10.1126/science.aar7204.
Bracker, J. 2017. An outline of sustainability criteria for synthetic fuels used in transport. Oko Institute. Frieburg, Germany.
Burnham, A., J. Han, C. E. Clark, M. Wang, J. B. Dunn, and I. Palou-Rivera. 2012. Life-cycle greenhouse gas emissions of shale gas, natural gas, coal, and petroleum. Environmental Science & Technology 46(2):619-627.
CARB (California Air Resources Board). 2021. Calculation of 2020 Crude Average Carbon Intensity Value. https://ww2.arb.ca.gov/sites/default/files/classic/fuels/lcfs/crude-oil/2020_crude_average_ci_value_final.pdf (accessed March 07, 2022).
CARB. n.d. LCFS Pathway Certified Carbon Intensities. https://ww2.arb.ca.gov/resources/documents/lcfs-pathway-certified-carbon-intensities (accessed March 07, 2022).
Chen, Q., J. B. Dunn, and D. T. Allen. 2019. Aggregation and allocation of greenhouse gas emissions in oil and gas production: Implications for life-cycle greenhouse gas burdens. ACS Sustainable Chemistry & Engineering 7(20):17065-17073. 10.1021/acssuschemeng.9b03136.
Chen, Y., E. D. Sherwin, E. S. Berman, B. B. Jones, M. P. Gordon, E. B. Wetherley, E. A. Kort, and A. R. Brandt. 2022. Quantifying Regional Methane Emissions in the New Mexico Permian Basin with a Comprehensive Aerial Survey. Environmental Science & Technology. https://pubs.acs.org/doi/10.1021/acs.est.1c06458.
Corsten, M., A. Ramirez, L. Shen, J. Koornneef, and A. Faaij. 2013. Environmental impact assessment of CCS chains – lessons learned and limitations from LCA literature. International Journal of Greenhouse Gas Control 13:59–71.
EIA (Energy Information Administration). 2022. Oil and petroleum products explained. https://www.eia.gov/energyexplained/oil-and-petroleum-products/.
EIA (Energy Information Administration). n.d. Natural gas explained. Where our natural gas comes from. https://www.eia.gov/energyexplained/natural-gas/where-our-natural-gas-comes-from.php.
EIA. 2020. Use of energy explained: Energy use for transportation https://www.eia.gov/energyexplained/use-of-energy/transportation.php (accessed March 07, 2022).
Elgowainy, A., J. Han, H. Cai, M. Wang, G. S. Forman, and V. B. DiVita. 2014. “Energy efficiency and greenhouse gas emission intensity of petroleum products at US refineries.” Environmental Science & Technology 48(13):7612-7624.
Gorski, J. 2021. Carbon intensity of blue hydrogen production: Accounting for technology and upstream emissions. https://www.pembina.org/pub/carbon-intensity-blue-hydrogen-production
Gorski, J., T. Jutt and K. T. Wu. 2021. Carbon Intensity of Blue Hydrogen Production: Accounting for Technology and Upstream Emissions. Technical paper, Pembina Institute. https://www.pembina.org/reports/carbon-intensity-of-blue-hydrogen-revised.pdf.
Grubert, E. A., and A. R. Brandt. 2019. Three considerations for modeling natural gas system methane emissions in life cycle assessment. Journal of Cleaner Production 222:760-767.
Howarth, R.W., and M. Z. Jacobson. 2021. How green is blue hydrogen? Energy Science & Engineering 9(10): 1676-1687.
IEA (International Energy Agency). 2019. The Future of Hydrogen. https://www.iea.org/reports/the-future-of-hydrogen.
IRENA (International Renewable Energy Agency). 2020. Green Hydrogen: A guide to policy making. International Renewable Energy Agency, Abu Dhabi.
Lauvaux, T., C. Giron, M. Mazzolini, A. d’Aspremont, R. Duren, D. Cusworth, D. Shindell, and P. Ciais. 2022. Global assessment of oil and gas methane ultra-emitters. Science 375(6580):557-561.
Masnadi, M. S., G. Benini, H. M. El-Houjeiri, A. Milivinti, J. E. Anderson, T. J. Wallington, R. De Kleine, V. Dotti, P. Jochem, and A. R. Brandt. 2021. Carbon implications of marginal oils from market-derived demand shocks. Nature 599:80–84. https://doi.org/10.1038/s41586-021-03932-2.
Masnadi, M. S., H. M. El-Houjeiri, D. Schunack, Y. Li, J. Englander, A. Badahdah, J. Monfort, J. E. Anderson, T. J. Wallington, J. A. Bergerson, D. M. Gordon, J. G. Koomey, S. V. Przesmitzki, I. M. Azevedo, X. T. Bi, J. E. Duffy, G. A. Heath, G. A. Keoleian, C. Mcglade, D. N. Meehan, S. Yeh, F. You, M. Wang, and A. R. Brandt. 2018. Global carbon intensity of crude oil production. Science 361:851-853.
NASEM (National Academies of Sciences, Engineering, and Medicine). 2018. Developing a Research Agenda for Utilization of Gaseous Carbon Waste Streams. Washington, DC: The National Academies Press.
Pototschnig, A. 2021. Policy Brief Renewable hydrogen and the additionality requirement: why making it more complex than is needed? Florence School of Regulation Issue 2021/35. September 2021.
Prussi, M., U. Lee, M. Wang, R. Malina, H. Valin, F. Taheripour, C. Velarde, M. D. Staples, L. Lonza, and J. I. Hileman. 2021. CORSIA: The first internationally adopted approach to calculate life-cycle GHG emissions for aviation fuels.
Ritchie, H., and M. Roser. 2020. Energy. Published online at OurWorldInData.org. https://ourworldindata.org/energy. https://ourworldindata.org/fossil-fuels#:~:text=In%202019%2C%20around%2084%25%20of,from%20coal%2C%20oil%20and%20gas.
Rutherford, J.S., E. D. Sherwin, A. P. Ravikumar, G. A. Heath, J. Englander, D. Cooley, D. Lyon, M. Omara, Q. Langfitt, and A. R. Brandt. 2021. Closing the methane gap in US oil and natural gas production emissions inventories. Nat Commun 12:4715. https://doi.org/10.1038/s41467-021-25017-4.
Sánchez-Bastardo, N., R. Schlögl, and H. Ruland. 2021. Methane pyrolysis for zero-emission hydrogen production: A potential bridge technology from fossil fuels to a renewable and sustainable hydrogen economy. Industrial & Engineering Chemistry Research 60(32):11855–81. https://doi.org/10.1021/acs.iecr.1c01679.
Sasol. 2021. Sasol Limited–Climate Change Report for the Year Ended 30 June 2021. https://www.sasol.com/sites/default/files/financial_reports/Sasol%20Climate%20Change%20Report_2021_22Sep21.pdf.
Schaaf, T., J. Grünig, M. R. Schuster, T. Rothenfluh, and A. Orth. 2014. Methanation of CO2 - storage of renewable energy in a gas distribution system. Energy, Sustainability and Society, 4, 2. https://doi.org/10.1186/s13705-014-0029-1.
Singh, U., and L.M. Colosi. 2021. The case for estimating carbon return on investment (CROI) for CCUS platforms. Applied Energy 285:116394. https://doi.org/10.1016/j.apenergy.2020.116394.
von der Assen, N., J. Jung, and A. Bardow. 2013. Life-cycle assessment of carbon dioxide capture and utilization: Avoiding the pitfalls. Energy & Environmental Science 6:2721-2734. https://pubs.rsc.org/en/content/articlelanding/2013/ee/c3ee41151f.
Wang, M., H. Lee, and J. Molburg. 2004. “Allocation of Energy Use in Petroleum Refineries to Petroleum Products – Implications for Life-Cycle Energy Use and Emission Inventory of Petroleum Transportation Fuels,” International Journal of Life-Cycle Assessment 9(1):34–44.
Willyard, K. A. 2020. A license to pollute? Opportunities, incentives, and influences on oil and gas venting and flaring in Texas. Energy Research & Social Science 62:101381.
Zhang, Y., R. Gautam, S. Pandey, M. Omara, J. D. Maasakkers, P. Sadavarte, D. Lyon, H. Nesser, M. P. Sulprizio, D. J. Varon, and R. Zhang. 2020. Quantifying methane emissions from the largest oil-producing basin in the United States from space. Science Advances 6(17):5120.


