
5
Verification
THE IMPORTANCE OF VERIFICATION
Life-cycle analysis (LCA), whether attributional or consequential, will consider emissions across various activities that occur in a variety of different sectors and geographic locations. Some of the activities may already be actively monitored and regulated, as is the case with many power plants across the United States. Many greenhouse gas (GHG)-emitting activities are not regularly monitored, meaning that LCAs must rely on data from theoretical calculations, experimental measurements, or a small number of field measurements to approximate the magnitude of their emissions. Confirming LCA results through direct measurement of all activities for an entire fuel pathway is outside the realm of feasibility, let alone possibility. However, knowledge gathered to date using LCA can guide the targeted allocation of resources toward verification of emissions sources, key data, and other effects that have the greatest impact on a given fuel’s net climate implications. A verification strategy can also play a valuable role in monitoring changes over time and prompting action to help limit any negative unintended consequences of a low-carbon fuel standard (LCFS).
Verification could be developed and used in an LCFS for two purposes. The first purpose is to verify that at least some of the conditions defined in a policy are met and that critical systems (e.g., food production, ecosystem services, and provision of affordable energy) that may be affected by the policy—in particular through market-mediated mechanisms—are not exhibiting undesirable effects that exceed certain thresholds. If the threshold is exceeded, corrective action may be warranted as defined in the policy to limit adverse policy effects. The U.S. Renewable Fuel Standard (RFS) contains a very rudimentary example of this type of verification. It requires that the U.S. Environmental Protection Agency (EPA) verify that domestic agricultural expansion has not exceeded 402 million acres, which was identified as the baseline amount of agricultural land in 2007, when the policy was implemented. It should be noted that EPA’s definition of agricultural land includes cropland, pastureland, and Conservation Reserve Program land (40 CFR Part 80 2010, 14669-15320), and changing among these different land uses can have large effects on net GHG emissions. Furthermore, this threshold is a net value and does not preclude land moving in and out of agricultural production, which can contribute to GHG emissions. This committee is not commenting on the efficacy of this particular use of verification, but rather acknowledging its existence. It should also be noted that agricultural expansion is affected by many factors beyond fuel policy. The RFS also provided permissions to alter and adjust the mandated level of biofuels consumption, if needed. Aside from land use, LCFS policy effects on other types of critical systems might be verified through collecting data on electricity generation by type, energy costs (electricity, natural gas), or food prices. Related to this committee’s charge, these verification steps could be used to evaluate whether models that investigate market-mediated effects associated with the use of transportation fuels and the GHG implications of these effects are reflecting trends (e.g., in land use, energy prices) observed in the real world. If models produce results that verification strategies do not support, the models or the parameters they contain may need to be adjusted. Importantly, it is not always possible to establish a causal relationship between policy or fuel use and measured outcomes, such as land use change (LUC), without modeling assumptions, so verification can provide useful information but may not definitively establish consequences of fuel use or policy intervention.
A second objective of using verification in an LCFS could be to confirm that individual supply chain actors are meeting certain standard requirements or adopting practices that reduce GHG emissions beyond baseline values for fuel pathways. For example, in the RFS, energy consumption at ethanol plants is assigned a default value. Verification that an individual ethanol plant is consuming less or more energy than this default value, and therefore possibly lowering or raising corn ethanol life-cycle GHG emissions below the default value, can serve to incentivize companies to reduce emissions or flag whether action is
needed to reduce plant emissions if a less GHG-intensive fuel earns more credits (as in an LCFS). This approach can also provide agencies implementing an LCFS with data about the state of an industry. Furthermore, it can reduce uncertainty in parameters used in baseline LCAs the agencies would develop — though it is important to be cautious of reporting bias (e.g., entities with lower GHG intensity than the default have incentives to report, while entities with equal or higher GHG intensity do not). Such outcomes support mandatory reporting where possible. The last motivation is especially important for parameters that greatly influence LCA results (e.g., methane leakage rates from natural gas infrastructure). Information obtained for this purpose could be used to improve both attributional and consequential LCA models.
The distinction and interaction between verification and certification merits further explanation. “To verify” is generally defined as to substantiate or prove the truth of a claim. The California Air Resources Board (CARB) states: “The LCFS verification program, under CARB oversight, provides confidence and reliability in reported data for stakeholders, market participants, and the public.” In this chapter, we refer to verification as a process through which auditors collect data that substantiate a claim on the part of an actor in the fuels supply chain that the requirements of a certification standard are met. Certification involves attesting (thorough verification) that a product, service, organization, or person has met an official standard established in an LCFS.
This chapter provides examples of verification’s use in contemporary low-carbon fuel policies. The chapter includes recommendations for how verification might be used in the future to reduce potential undesirable effects of LCFS and improve low-carbon fuel LCAs that inform policy.
CURRENT USE OF VERIFICATION
The next three subsections will address how existing LCFS incorporate verification at the national level to account for market-mediated effects and at the individual fuel supply chain level.
National-Level, Market-Mediated Effects
The predominant market-mediated effect that has been subject to verification is LUC. While LUC in the context of biofuel production has been known and studied for some time, increased attention given to LUC in the context of biofuels production stems from the 2007 Energy Independence and Security Act (EISA), which limited the types of feedstocks that can be used to make renewable fuel that is eligible for renewable identification numbers (RINs) under the RFS (see Chapter 2). Specifically excluded for biofuels production under the EISA definition was virgin agricultural land or land cultivated after December 19, 2007 in the United States. These land types were defined to include pastureland and land from the Conservation Reserve Program while native grasslands and forests would be excluded.1 In the final rule documenting changes to the RFS in 2010 (40 CFR Part 80 pages 14669–15320), EPA established a national-level baseline for agricultural land in the United States at 402 million acres based on three data sources: the Farm Service Agency Crop History, the U.S. Department of Agriculture (USDA) Census of Agriculture, and the USDA Cropland Data Layer. It established an aggregate compliance approach in which, if the amount of agricultural land in the United States that is eligible for growing what the RFS defines as renewable biomass stays below 402 million acres, aggregate compliance has been achieved and RIN-eligible renewable fuels are being produced with what the policy defines as renewable biomass. However, if the amount of agricultural land exceeds 402 million acres, then renewable fuel producers would need to undertake verification processes to demonstrate that renewable fuel is made from renewable biomass. Notably, this is a threshold amount and does not preclude the possibility of land entering and leaving agriculture, which can contribute to GHG emissions. While this threshold has not yet been exceeded, in 2010 a lower threshold (397 million acres) was exceeded, which triggered a requirement that EPA should revisit the ability of the aggregate compliance approach. There is no public record of EPA’s response. Beyond EPA’s quantification of LUC,
___________________
1 See https://www.epa.gov/laws-regulations/summary-energy-independence-and-security-act.
a series of studies seeking to quantify LUC produced widely differing results (Copenhaver et al., 2021; Dunn et al., 2015; Lark et al., 2015, 2022; World Wildlife Fund, 2021; Wright and Wimberly, 2013).
In 2018, EPA reported the environmental and resource conservation impacts of biofuels to-date and into the future (EPA, 2018). Part of this assessment includes evaluating LUC. In this context, EPA uses the term “land use change (LUC)” to include different types of land uses and how land cover changes to meet these uses. In its 2018 triennial report to Congress, EPA described its use of five data sources to characterize LUC, displayed in Table 5-1. These sources include USDA’s Major Uses of Land in the United States (Bigelow and Borchers, 2017), USDA’s 2012 Census of Agriculture (USDA, 2014), USDA’s 2012 National Resources Inventory (USDA, 2015), the U.S. Geological Survey’s (USGS) U.S. Conterminous Wall-to-Wall Anthropogenic Land Use Trends 1974-2012 (Falcone, 2015), and two studies from academic institutions (Lark et al., 2015; Wright et al. 2017).
TABLE 5-1 Studies Used in EPA’s 2018 Triennial Report to Congress
| Study | Comparable term(s) | Definition | Years Reported | Changes in Million Acres (%) |
|---|---|---|---|---|
| USDA Major Uses of Land in the United States (2017) | Cropland used for crops | Three of the cropland acreage components – cropland harvested, crop failure, and cultivated summer fallow – are collectively termed cropland used for crops, or the land used as an input in crop production. | 2007 – 2012 | +5 (1.5%) |
| USDA Census of Agriculture (2014) | Harvested cropland + failed/abandoned + summer fallow | Harvested cropland – includes land from which crops were harvested and hay was cut, land used to grow short-rotation woody crops, Christmas trees, and land in orchards, groves, vineyards, berries, nurseries, and greenhouses. No separate definition for failed/abandoned, or summer fallow cropland. | 2005 – 2012 | +7.8 (2.4%)a |
| USDA National Resources Inventory (2015) | Cultivated cropland | Cultivated cropland comprises land in row crops or close-grown crops and also other cultivated cropland, for example, hayland or pastureland that is in a rotation with row or close-grown crops. | 2007 – 2012 | +4.3 (1.4%) |
| USGS U.S. Conterminous Wall-to-Wall Anthropogenic Land Use Trends | Production, Crops | Areas used for the production of crops, such as corn, soybeans, wheat, vegetables, or cotton, as well as perennial woody crops such as orchards and vineyards. Includes cultivated crops, row crops, small grains, and fallow fields. | 2002 – 2012 | +3.9 (1.2%) |
| Lark et al. 2015 | Net cropland | Net cropland increases (gross expansion – gross abandonment) of lands in the lower 48 states that have no evidence of cultivation since 1992. | 2008 – 2012 | +3 (1%)b |
| Wright et al. 2017 | Net cropland | Net cropland increases (gross expansion – gross abandonment) of lands in the lower 48 states that have no evidence of cultivation since 1992. | 2008 – 2012 | +4.2 (N/A)c |
a Harvested cropland, failed/abandoned cropland, and summer fallow changed by +5.4, +4.0, and -1.5 million acres, respectively between 2007 and 2012 according to the Census of Agriculture.
b Estimates from Lark or Wright are likely to be lower because they focus on a subset of lands that had no evidence of cultivation for 20 years or more, rather than all land. The committee include these in the table for convenience and completeness.
c The committee could not calculate the percentage increase from Wright et al. (2017) because the 2008 baseline acreage within 100 miles of a biorefinery was not reported.
EPA noted several challenges in using the data sources in Table 5-1 to assess aggregate compliance. First, many of these data sources are not collected annually. Additionally, over time, the methods used to compile these data in the different studies enumerated in Table 5-1 change. This is true of the multiple data sources used in the USDA Major Uses of Land in the United States. These methodological changes themselves—not actual changes in land use—can drive LUC analysis results. The USDA National Resources Inventory and USGS U.S. Conterminous Wall-to-Wall Anthropogenic Land Use Trends, however, retroactively adjust results to account for changes in methodology over time. Approaches to modifying the USDA Cropland Data Layer to reduce error, particularly in areas such as grassland–cropland land types that may alternate between cultivation and idle or fallow states annually, can help reduce error estimates but it is unclear to what extent. Comparing estimates of agricultural land among data sources shows better agreement at the national level (e.g., for the Census of Agriculture and the USDA National Resources Inventory) but with less agreement at the state level (Copenhaver et al., 2021). In fact, agricultural expansion may occur in small parcels that would be hard to detect with data sources such as the USDA Cropland Data Layer, which has a 30 m resolution (Dunn et al., 2017). Many non-agricultural land types, such as wetlands, hold high ecosystem value even at small sizes (López-Tapia et al., 2021; Van Meter and Basu, 2015). Moreover, the USDA Cropland Data Layer relies on the National Land Cover Database for non-agricultural land type data, but the National Land Cover Database currently suffers from low accuracy when applied to LUC analyses. One way remote sensing datasets report accuracy is with user and producer accuracies. User accuracy reflects the reliability of a remote sensing dataset’s classification from the perspective of the dataset user. It corresponds to error of commission and accounts for the occasional inclusion of land types that are not actually in a given category (e.g., inclusion of alfalfa pixels in the grassland category). Producer accuracy corresponds with the error of omission and accounts for a given category of land cover omitting pixels that it should contain (e.g., exclusion of land planted in soybeans from cropland). The National Land Cover Database reports producer and user accuracy for various land categories. For example, using the National Land Cover Database to estimate grassland loss between 2011 and 2016 had a producer accuracy of 80 percent and a user accuracy of 34 percent (Wickham et al., 2018). In the case of agricultural gain, these accuracies are 23 percent and 33 percent, respectively (Wickham et al., 2018). These very low accuracies for the very types of change the EPA is required to assess under the requirements of the RFS limit the ability of the National Land Cover Database (and accordingly, the USDA Cropland Data Layer) to serve as a primary resource for use in land cover monitoring (Wickham et al., 2018). The major challenge that arises in the use of remote sensing data to evaluate LUC is that distinguishing between land that is eligible (e.g., pasturelands) versus ineligible (e.g., natural grasslands) for producing renewable fuel feedstocks is an error-prone process. Different types of grasslands pose a particular challenge given the relatively low accuracy and differences in reported area in various data sources. For example, the USDA Cropland Data Layer has a 30 percent commission error for grasslands in the southern plains (Wang et al., 2022). Furthermore, the USDA Cropland Data Layer (2017)2 estimate of grasslands (including natural and other grasslands) is 250 million acres greater than that in the 2015 National Resources Inventory.
To summarize, the remote sensing–derived data sources available at the time of RFS implementation, and still today, have some technical limitations on their use for particular applications as a source of information on LUC, particularly at the high resolution necessary to understand effects on small but important ecosystems. However, they have been deemed sufficiently useful by EPA (2018) for the agency to have concluded in its Second Triennial Report that there has been a change in cropland area since the passage of EISA. Signals such as this can be useful in determining the direction of change, if not the absolute amount, of LUC.
The committee notes again that estimates of changes in agricultural land area in the United States depend on the data source. These have differences in definitions and methodology, data collection frequency, spatial resolution, and other factors. Accordingly, current data allow for some insight into LUC, but challenges stemming from data frequency and methodological differences exist.
___________________
2 https://www.nass.usda.gov/Research_and_Science/Cropland/Release/
Conclusion 5-1: In verification to evaluate land use change at a national level, specifying the approach used to evaluate the extent, location, and type of agricultural expansion and the degree of uncertainty aids in transparency and clarity.
Conclusion 5-2: Insight into the degree of agricultural expansion domestically into ecologically important, but potentially small, land parcels requires more frequent data with higher spatial resolution and ideally high producer and user accuracy.
Recommendation 5-1: Estimates of historical land use change—which may be used to inform economic models that evaluate market-mediated land use change—based on survey or remote sensing data should rely on more than one data source and should include estimates of uncertainty. Higher resolution, higher accuracy, and more frequently collected data sources should be made accessible to the public.
It should be noted that even if it were possible to evaluate expansion of agricultural area without error, it is not possible to verify in most cases, using the strict definition used here, that agricultural expansion was driven by a policy that encourages the use of biofuels (which is the case for other market-mediated effects as well). When changes in agricultural patterns (either through expanded agricultural area or changes in crop rotation patterns) occur near biofuels facilities, it may be possible to attribute these changes partially to the demand from the biorefinery, especially when these insights are accompanied with survey data. However, there are many other factors that drive LUC including urbanization and industrialization.
It is important to verify and determine the source(s) of discrepancy in data on changes in area of U.S. cropland. Beyond LUC, other national-level market-mediated effects may be evaluated under LCFS policies. Expanded use of electric vehicles could result in incremental load additions that may put increased pressure on the use of marginal generating resources. One study has shown that marginal resources often result in higher carbon intensities (Ryan et al., 2016). Conversely, smart charging technologies can provide load shaping and reduce ramp rates on the power infrastructure (van Triel and Lipman, 2020). Others have shown potential stress to power grids from electric vehicles (EVs), or result in reassignment of resources to EV charging from other loads and adjustments in electricity prices3 (Brown, 2020; Garcia and Freire, 2016; Graff Zivin et al., 2014; Vivanco et al., 2014). Electricity price adjustments from load shaping programs, renewable portfolio standards, and other measures aimed at addressing market-mediated effects associated with EVs must be carefully monitored to ensure transparency for rate payers.
Conclusion 5-3: In verification to evaluate electricity load shifts from national electric vehicle policies, specifying the approach used to evaluate the extent, location, and type of load expansion to be verified and the degree of uncertainty will aid transparency and clarity.
Conclusion 5-4: While smart charging has potential to provide information about the carbon intensity of retail electric vehicle load, the assignment of specific generators to specific loads relies on assumptions from either an attributional frame (e.g.: under what conditions renewable generation should be assigned to electric vehicle load or to another load) or from a consequential perspective (e.g.: what emissions would look like in a counterfactual scenario without electric vehicle load).
International Land Use Change
There has long been concern that demand for biofuels in the United States stemming from renewable fuel policies would lead to international agricultural expansion into forests, grasslands, and wetlands
___________________
3 Ryan et al. (2016) found an up to 68 percent difference between marginal and average emissions factors for an individual charging station. For the U.S. average they found that marginal emissions factors are 21 percent higher than average emissions factors. These findings were generally corroborated by others but the inverse can also occur.
(e.g., Searchinger et al., 2008 and other citations in Chapter 9). In recent years, many satellite-based tools have been used to monitor LUC globally and particularly in regions sensitive to biofuel-induced LUC. In the case of global LUC, optical observations from sensors on satellites including the Advanced Very High Resolution Radiometer, the Moderate Resolution Imaging Spectroradiometer, Sentinel data, and the Landsat Enhanced Thematic Mapper Plus among others have been used to create global land use land cover maps that allow for detection of change (Song et al., 2018). As Karra and Kontgis (2021) describe, these types of maps enable non-geospatial experts to track changes in land use and land cover that might require policy or other interventions to slow it. Further, to enable use of satellite data to monitor land use and land cover change at a global scale (and even a national one) automated methods of converting the pixels in spatial observation data to land categories needs to be automated to produce a map with high accuracy and resolution on a policy-relevant time scale.
While monitoring land use and land cover for the entire globe is now a possibility with this technology (e.g., Potapov et al., 2022), it may be desirable within the context of an LCFS to focus attention on regions that have historically been prone to deforestation or regions with high carbon stock lands, at least in part as a result of demand for biofuel feedstocks, or that economic modeling point to as potential hotspots of carbon stores or LUC. Driven by recognition that preserving the Amazon rainforest is critical to slow global warming and for maintaining the many other ecosystem services it provides, there are long-standing efforts to build a near real-time ability to monitor deforestation in the Amazon using satellite imagery (Finer et al., 2018). Similarly, the GHG implications of palm oil plantation expansion into peatland in Indonesia have been a long-term concern around the use of palm as a biofuel feedstock (Fargione et al., 2008). Efforts to use satellite data to track the history of palm oil plantations in this region are also a reality (Danylo et al., 2020; Irvin et al., 2020).
Clearly, it is possible to monitor international land use using satellite data. There are several questions that remain regarding how to use this information in an LCFS because of challenges in establishing causality of international LUC, as with any market-mediated effect, or to tie it to any one policy. This concern is important in understanding whether an LCFS is having its intended effect and not inducing unintended effects. It may be possible within an LCFS to set a threshold for international LUC of concern (e.g., occurring in a biofuel feedstock producing region) because the GHG emissions that would occur if that threshold were exceeded would jeopardize the climate benefits of an LCFS. The use of satellite data to guide design and implementation of a U.S. LCFS—together with or in place of international GHG emissions from LUC assigned to a biofuel based on economic modeling—is relatively unexplored and deserves attention from the research and policy communities, especially as it might be used to complement modeling efforts that aim to predict the location of future LUCs.
Conclusion 5-5: Since satellite data allow for monitoring of international land use change, it would be possible to use satellite data to monitor international land use change, support calculations of land use change impacts, and support results from economic models used to estimate international land use change GHG emissions.
Recommendation 5-2: The research and policy communities should develop frameworks and methodologies for use of satellite data to characterize national and international land use change that may be in part attributable to an LCFS. Examples of framing questions include:
- Should an LCFS include measures to mitigate undesirable international land use change, or is it sufficient to monitor international land use change that may be due to the LCFS and these GHG emissions to the associated fuel?
- What are the guardrails (e.g., amount and type of land converted to agriculture in a certain region) that a monitoring approach would put in place and, if approached or exceeded, what action would be undertaken as a result?
- How can satellite data and economic modeling be most effectively used synergistically to limit GHG emissions from international land use change?
- What public data sources will be used to track land use change?
- How should uncertainty in land use change estimates be reported?
Fuel Supply-Chain Emissions Verification
As described previously, an objective of using verification in an LCFS could be to provide agencies implementing an LCFS with data about the state of an industry that informs parameters used in transportation fuel LCAs. Furthermore, it can reduce uncertainty in parameters used in baseline LCAs the agencies would develop, particularly for the parameters that greatly influence LCA results (e.g., soil carbon changes, methane leakage rates from natural gas infrastructure). Information obtained for this purpose could be used to improve LCA models.
For individual fuel supply chains, certification protocols lay out the criteria datasets that are required to achieve certification under various certification programs that may be part of policies. Auditors collect the required data under the protocol and verify the conditions within the fuel pathway that determine the fuels’ carbon intensity (CI). Certification schemes are akin to certification protocols, although the term “scheme” is used more often in a European context. The committee therefore uses the term “protocol.”
A non-comprehensive example list of currently operating certification protocols in the sustainability field include International Sustainability and Carbon Certification (ISCC), Bonsucro, Red Cert, and Roundtable on Sustainable Biofuels. These systems certify compliance with defined specifications for feedstock production but also conversion into other products including biofuels. Separately, other protocols focus on parts of the supply chain such as the ANSI/LEO-4000 Comprehensive Sustainable Agriculture Standard. A non-comprehensive example list of certification bodies includes SCS Global Services, SGS, Peterson Control Union, and Technischer Überwachungsverein.
Among the policies, the European Union’s (EU) Renewable Energy Directive (RED), the Carbon Offsetting and Reduction Scheme for International Aviation (CORSIA), and the California Low Carbon Fuel Standard (CA-LCFS) currently have the most robust approaches to verification, although none of these policies are without their shortcomings. RED and CORSIA utilize a system of recognized certification protocols and auditors who are trained by the protocol developers to verify the intended application of the protocols. The EU and CORSIA regularly review and accredit (“re-recognize”) certification protocols. All EU-recognized certification protocols are listed publicly at the European Commission’s website (European Commission, n.d.). Likewise, all CORSIA-recognized certification protocols are listed on their website.4 Certification protocols, in turn, then list all of the certification bodies that have been trained to follow and implement an individual protocol. In the case of the ISCC protocol, for example, their collaborating certification bodies are listed at their website (ISCC, n.d.-a).
CARB, which administers the CA-LCFS, developed its own set of certification protocols, using established sustainability auditing firms to verify compliance with them (CARB, 2020). CARB publishes the list of verification bodies and verifiers accredited to perform LCFS verification services (CARB, 2022). CARB states that its verification is based on the International Organization for Standardization (ISO) 14064 standard (ISO, 2020a,b). Beginning in 2019, verifiers started applying for CARB accreditation and taking required training and exams.
On-farm practices are a commonly-verified aspects of low-carbon transportation fuel policies (e.g., RED and CORSIA). For example, the EU’s RED provides for recognized EU certification protocols that have established specific guidelines on how to assess soil carbon levels for inclusion in biofuels life- cycle modeling, although this committee notes caveats on the functionality of this approach as described elsewhere in this report. Within the protocols’ framework, improvements in soil carbon on individual farms can generate incremental credits to meet, for example, the qualifying 50 percent GHG reduction in CI threshold set under the EU RED for corn ethanol blending into the transportation fuel supply (ISCC, 2021). In the RED, soil carbon credits are specifically required to be assessed on a field-by-field basis.
___________________
4 See https://www.icao.int/environmental-protection/CORSIA/Documents/ICAO%20document%2004%20-%20Approved%20SCSs.pdf.
In a letter to CARB by 20 stakeholder groups, the Midwestern Clean Fuels Policy Initiative requested that CARB allow farmers to generate individual farm-level GHG life-cycle emissions values rather than the current fixed average agriculture phase value. This would allow farmers to generate incremental credits for enhanced agricultural practices (Great Plains Institute, 2020). CARB, to date, has not acted on this request. Inclusion of soil carbon credits under the proposed Midwest Low Carbon Fuel Standard remains a topic of discussion mostly around the topic of permanency and additionality.
On-farm audits can also verify whether an individual property has increased the amount of agricultural land or changed the type of crop being grown. For example, it is relatively straightforward for a farmer or auditor to report changes in land use on private farmland. These changes could include idling a field or expanding agriculture into forested land on farm property. In the EU RED, under various certification protocols accredited by this policy, on-farm LUC is assessed via self-declaration forms as well as on-farm audits. In this policy, the number of required on-farm audits by protocols is a function of a region’s risk for land use conversion. Audit frequency is higher in areas that are near rainforests or sensitive grasslands. The number of farm audits in low-risk regions for agricultural expansion is the square root of all growers delivering to a first gathering point (e.g., a grain elevator or biofuels plant) whereas 100 percent of plantations supplying palm oil producers in Southeast Asia must be audited. In policy frameworks where agricultural feedstock producers can generate reductions in GHG emissions from the feedstock production stage and thereby extra revenue, conservation management practices are encouraged (Piñeiro et al., 2020).
In contrast to the extent of the previously-described verification approaches related to biofuels, only the LCFS addressed verification approaches relative to EV life-cycle GHG emissions. Under the LCFS credit, generators may submit applications to verify a lower CI rating for unique pathways that would result in greater potential GHG reductions (California Low Carbon Fuel Standard Regulation, CCR 17 §). Within that framework, a relatively new provision under the CA-LCFS allows for incremental credits for electric vehicles.5 Utilities, automakers, and others can use meters or vehicle data to claim additional credits from residential EV charging that uses lower carbon electricity. CARB states that, ”Any equipment that is capable of measuring electricity used for residential EV charging, and for tracking and recording the amount of electricity dispensed to that vehicle over a specific time period, may be registered in the LCFS Reporting Tool (LRT) as a piece of Fueling Supply Equipment (FSE).”6 Incremental credits are calculated based on the difference between the low-carbon electricity used to fuel vehicles and the California average grid electricity (CARB, 2020b, n.d.). Utilities are required to reinvest a share of the credits on customers, EV drivers, and to support transport electrification broadly. Further, utilities must dedicate a minimum portion of credit revenues to EV rebates and equity projects. In essence, verified retail metering and the credits generated are used for reinvestment in transportation electrification. This effort can generate clear benefits to offset the costs of verification (see Kelly and Pavlenko, 2020).
In summary, protocols exist that could inform LCA for an LCFS for individual fuel producers including estimated on-farm soil carbon level changes and risk-based LUC verification. This does not preclude new protocols being created independently of existing ones. In addition, as practiced under the CA-LCFS for residential EV charging, incremental credits can generate extra revenue to offset verification costs and encourage additional renewable infrastructure.
Conclusion 5-6: Certification and verification approaches have been implemented in contemporary LCFSs to inform values for many parameters that influence emissions.
CHALLENGES IN IMPLEMENTING VERIFICATION APPROACHES
Challenges have arisen in the implementation of the verification strategies described previously, including managing competing certification protocols, potentially high costs, trade effects, inadvertent pre-
___________________
5 See https://ww2.arb.ca.gov/sites/default/files/classic/fuels/lcfs/guidance/lcfsguidance_19-01.pdf.
6 See https://ww2.arb.ca.gov/sites/default/files/classic/fuels/lcfs/guidance/lcfsguidance_19-03.pdf.
ferred treatment for certain technologies, baseline selection, and timing of verification and associated corrective action.
Competing Certification and Verification Systems and Their Level of Quality
As described in the section on verification in LCFS, there are multiple certification protocols for biomass and biofuels alone. One challenge in implementing verification protocols within an LCFS is deciding whether to adopt one or more existing protocols or to devise a new one.
In the U.S. RFS, EPA has pathways that are generally applicable to renewable fuels that any producer using a certain feedstock-conversion-fuel pathway can use.7 Alternatively, fuel producers can apply for individual pathway assessments to demonstrate that they are able to achieve life-cycle GHG emissions, as estimated by EPA, for a pathway that differ from the generic pathways. EPA has established the Quality Assurance Plan, which is a voluntary program that is meant to verify if conditions for a preferred pathway are met. When they are, the fuel is eligible to receive RINs under the RFS (see Chapter 3). Quality assurance plans are customized to individual producers aiming to demonstrate their fuel meets the qualification for RINs in certain categories such as advanced (50 percent GHG reduction threshold) or cellulosic (60 percent GHG reduction threshold) as opposed to renewable fuel (20 percent GHG reduction threshold). Through the quality assurance plan process, verification data are collected. EPA has minimum requirements for quality assurance plans but it does not specificy their exact content or form.
While devising a new protocol may allow for incorporation of criteria that are important to the regulatory body implementing a policy, new protocols may create barriers for new and existing fuels and companies to participate in a policy. One approach (Moosmann et al., 2020) to managing the existence of multiple protocols is for different policies to accept certifications undertaken under a separate policy. This can reduce costs and administrative burden on producers and enables coverage across long supply chains, but it comes with the drawbacks of possible inconsistencies in accounting and accepted levels of deviation.
In Brazil’s RenovaBio program, life-cycle GHG emissions are calculated for fuel produced from each participating plant. The RenovaBio policy does not allow third-party protocols. Instead, they developed their own protocol but utilize existing auditing groups (e.g., SCS, SGS, Peterson Control Union) (USDA, 2021a). Each grower must provide their farm-level data to the government. In Colombia’s case, the sustainability protocol was developed by the government but third-party auditors are enlisted to ensure sustainability and compliance with ISO standards (USDA Foreign Agricultural Service, 2018). In contrast, the Japanese allow the use of the already established ISCC Plus protocol (a European Protocol derivative) for ethyl tert-butyl ether sustainability certification (ISCC, n.d.-b; USDA Foreign Agricultural Service, 2020). With the ISCC Plus certification requirement, biofuel deliveries into Japan are subject to farm-level audits.
CARB was interested in pursuing verification strategies but desired to develop its own certification standard. This effort is on hold in part because of the labor involved in establishing a certification protocol that is unique to CARB.
It should be noted that certification protocols may be carried out by private companies within rules set by public, policy-setting entities (e.g., co-regulation). In a regulatory context, the term co-regulation (German Federal Ministry for Economy Cooperation and Development, 2013) indicates that regulators have defined sustainability criteria for certain economic sectors or activities and recognize verification processes carried out by private sector auditors that ensure compliance with those criteria. In co-regulation, these private actors carry out this control and reduce the regulatory burden of regulators while increasing engagement within the private and nongovernmental sectors in achieving the policy’s objectives. Alternatively, policymakers may prefer these functions to be carried out by the public sector.
Co-regulation via third party verification protocols needs to be adequately organized. Verification systems should be independent, third party systems with multi-stakeholder governance (including large nongovernmental organization shares). They should also incorporate internal integrity auditing systems. In
___________________
7 See https://www.epa.gov/renewable-fuel-standard-program/approved-pathways-renewable-fuel.
these procedures, the certification protocol periodically audits their own recognized auditors to ensure that the protocols are followed correctly. For example, the American National Standards Institute supports verification protocols in assessing the “competence of verification bodies in accordance with international standards for accreditation” (ANSI, 2015). Furthermore, there is a need for ongoing auditing of certification protocols through mechanisms like ISO 17065 or ISO 17021 and the principles of the ISEAL Alliance Code of Good Practice for Assuring Conformance with Social and Environmental Standards (ISEAL, n.d.; ISO 2020a,b).
Finally, co-regulation protocols need to be rated in benchmarking efforts that provide comprehensive, verified, and transparent information on voluntary sustainability standards.27
Administration of Certification
Some data used to satisfy one certification protocol could be applied to being certified for another.
Trade
Verification can be used to allow fuels produced in one country to qualify for inclusion in LCFS in other countries. In the case of the U.S. ethanol plants described previously, verification enabled trade of biofuels between countries. Conversely, verification systems can also act as non-tariff trade barriers particularly when a multitude of systems competes for legitimacy. Narenda points out: “thus, rather than filling institutional voids, the multiplicity of competing standards creates additional non-tariff barriers for emerging economy firms.” (Montiel et al., 2018).
Brazil’s RenovaBio program is an example of a policy that has raised concerns for preferential treatment of domestic fuels. This concern has arisen even though the country is dependent upon international supply chains. Fuel standard programs that rely on international supply chains may have to be mindful whether a policy acts as an implicit trade barrier. However, RenovaBio is a relatively young policy, and future adjustments may potentially level the playing field.
Conclusion 5-7: Certification through protocols and methods that are consistent or compatible across regions and countries may mitigate global trade barriers.
Inadvertent Favoring of Individual Fuels
Observation of CA-LCFS, which allows for individual, company-specific fuel pathways to become eligible based on their CI, has highlighted how an LCFS policy might inadvertently or intentionally favor one fuel pathway over another. Such a concern has been raised about the LCFS because it awards CI credits for activities that could reduce transportation GHG emissions but are not directly tied to the process of selling low-carbon fuels themselves. The CA-LCFS, however, currently only applies this approach to EV-related pathways. It awards rebates for installing charging stations funded by selling credits generated by supplying electricity to EVs. Within the LCFS, there is no comparable incentive for infrastructure related to biofuels like e85 pump installation (Bushnell et al., 2021) or other fuels. If using verification to award credits for non-fuel-sales related activities is inconsistent across different fuel types, the policy may not be technology-neutral.8
A second and more serious issue of asymmetry arises because residential retail metering for EVs is instituted as an incentive rather than a requirement. In the absence of full retail metering as a requirement, CARB relies on EV usage surveys, which have been shown to be inaccurate (Davis, 2019). Accordingly, it is possible that vehicle miles traveled in EVs is lower than the policy is counting as it calculates its GHG--
___________________
8 Energy Institute WP 318R: “EnPolicymakers have begun to treat the LCFS as a means for directing resources to preferred technology solutions, such as ZEVS in California, setting the policy on a path different from the science-based, technology-neutral fuel standard it was originally positioned to be.”
reducing benefits. Differences in driving patterns among EV owners and gasoline vehicle owners is an area of active research.
Recommendation 5-3: If applied, verification requirements should be used consistently and comparably across pathways to encourage technology development and deployment.
Benchmark Selection
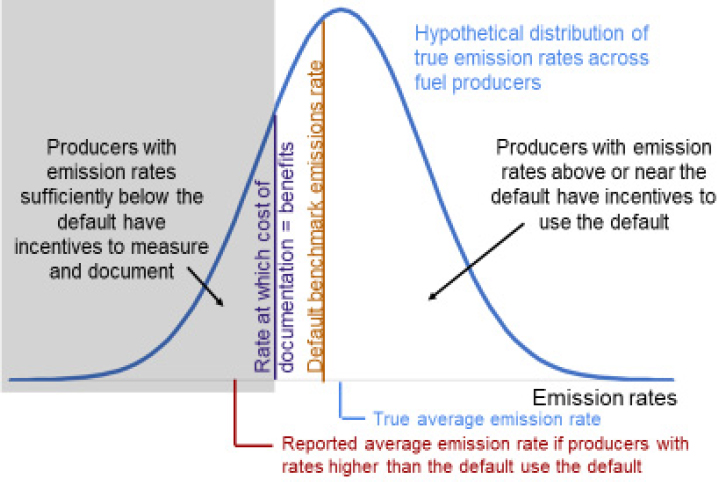
Policies can define default baseline values for parameters that are to be certified. For example, a policy may set a default amount of diesel consumed in the harvesting of corn. The certification process will then establish whether a farm consumes less or more than this default amount. This ability to verify lower or higher emissions can result in economic gain or loss for a supply chain actor, which will motivate them to pursue certification or to produce a fuel that complies with the policy. Accordingly, default values must be chosen judiciously such that they reflect common practice rather than adoption of new technologies or practices that lower or raise emissions. If a default value reflects what can be achieved with emerging technologies and practices that lower emissions, a supply chain actor may lose the economic incentive to undertake certification, let alone underestimating actual emissions. One example of this situation is the previously-described incremental credits awarded under the CA-LCFS for retail EV charging. Emissions from residential charging are assessed relative to those from the average grid electricity (rather than the marginal mix). The average grid electricity CI can sometimes (but not always) be significantly lower than the marginal mix for EV charging (Mueller and Unnasch, 2021; Tamayao et al., 2015). As a result, utilities and automakers may be less encouraged to generate the extra, incremental credits. Therefore, calculating incremental credits based on the difference between renewable electricity that is presumably used to charge vehicles at motorists’ homes and the CA average marginal mix (rather than the average mix) could result in a much stronger incentive for incremental credits. This approach could further incentivize verified retail metering.
As illustrated in Figure 5-1, producers with emission rates above or near the default have incentives to use the default benchmark emission rates, whereas producers with emission rates sufficiently below the default have incentives to collect data and document emission rates.
Recommendation 5-4: Baselines, if used, should consider (1) the state of technology, (2) inputs from multiple stakeholders, (3) implications for cost of implementation, and (4) incentives that the baselines create for innovation to reduce emissions and for data collection to demonstrate emissions reductions.
Timing of Verification and Associated Corrective Action
The frequency of verification of national-level effects and potential corrective action requires careful consideration. One viewpoint is that if verification and corresponding corrective action is too frequent, unclear policy signals will be sent to the actors who produce fuels, and efforts to achieve policy objectives could be destabilized. Another viewpoint is that frequent and ongoing verification and corresponding corrective action provides a clear policy signal for compliance, promoting and stabilizing policy objectives. On the other hand, if verification occurs too infrequently, undesirable effects may be ongoing and irreversible. The influence of frequency of verification and corrective action on verification program outcomes requires research.
FUTURE TECHNOLOGY FOR VERIFICATION
Verification of national-level, market-mediated effects of LCFS policies and parameters used in LCA values requires reliable and consistent data gathering from in-person audits, through apps, database systems, sensors, and a combination thereof. Sensor data can come from satellites, airplanes, and unmanned aerial vehicles, for example, to measure land use and land management practices as well as emissions from oil and natural gas extraction. As these data become increasingly available with high-resolution and frequency, automated methods and artificial intelligence algorithms are increasingly needed to process and publish them efficiently, in a simple form to be used. Satellite data should be converted to simple tables to be compared with other available data sources for verification. Internet of Things sensors are ubiquitous and can be used to measure, assess, and verify a host of processing variables (e.g., at biorefineries). Finally, “smart metering” can be used to verify natural gas use and control electric smart charging, vehicle-to-grid, and vehicle-to-everything charging. Sensor technologies are continuously improving and the cost for all three groups has declined significantly (Microsoft, 2019; Spaceref, 2021).
While technologies that support verification of sustainability requirements set by policies keep continuously improving, policymakers need to be mindful of their limitations as well, including their accuracy and resolution.
To date, technologies in the sensing area have been substantially improving as described in the following state-of-the-art examples.
Technologies to Support Verification of Land Use Changes
Increasingly, high-resolution, high-frequency imagery that could be used to monitor national- or global-scale LUCs is becoming available. Critically, automated techniques that use artificial intelligence-based techniques are needed to process this imagery rapidly. Research is underway with this purpose (Lopez-Tapia et al., 2021). These techniques rely on ground-truth data in multiple years. These data, which are fairly limited, are needed to build training and testing datasets for artificial intelligence techniques.
At the farm level, some remote sensing tools have been specifically developed to support LUC audits. The Global Risk Assessment Services tool uses satellite and remote sensing data on a global level to assess, monitor, and manage the risk of biofuel producers to cause deforestation and LUC (GRAS, n.d.). A mapping app complements the Global Risk Assessment Services to enable users to collect farmer land use and equipment activity data, fields polygons, and pictures. Remote sensing tools have also been developed to specifically track reclaimed lands that qualify as a special land use category (unused, underused) for biofuels production under several policies (RED, CORSIA) (Mueller et al., 2021).
On-farm emissions associated with management practices may also be important to verify. Farm equipment manufacturers and technology providers have developed a host of data gathering tools to optimize farm operations that can be used to inform sustainability practices. All of them include apps, desktop applications, and data from equipment sensors. Examples include (no endorsement by this committee is implied):
- Original equipment manufacturers make decisions to include sensors on their farm equipment that can track the type of data that are needed in biofuel LCA. These manufacturers are helping generate high-quality data by their selection of accurate sensors. One example of this advancement is John Deere’s Operations Center, which is an online farm management system that integrates field equipment data.
- Several organizations have close interactions with growers and can therefore directly verify LCA-relevant conservation management data.
- The Bayer Carbon View Program provides nutrient and conservation management insights and monetary incentives via the Climate Field View platform. The strength of the platform for LCA verification is the direct large-scale interaction with growers.
- The Farmer Business Network’s Gradable Carbon platform aims to integrate practices with voluntary carbon management programs. Notably, this system has a parallel tie-in with soil carbon sampling.
- Precision Conservation Management is supported by Midwest grower organizations who work directly with farmers to input management data into the Precision Conservation Management Farmer Portal. The portal generates a “sustainability-focused Resource Analysis and Assessment Plan (RAAP).”9 This program works directly with growers to show the value of conservation management practices. The strength of the program is the direct, personal interaction with growers.
- Other organizations collect equipment and logistics data that is relevant for LCA.
- Bushel’s FarmLog app collects data on standard activities like planting, fertilizing, spraying, irrigating, and harvesting operations. Of particular interest for LCA parameter verification is that the company is working with delivery points to collect weight-scale data from, for example, grain elevators.10
These technologies support easier collection of individual LCA-relevant data points. Additionally, database systems and blockchain technologies originally developed for supply chain applications can ensure that those individual data points gathered can be more easily inserted, linked, and verified (e.g., across feedstock growing, processing, transportation, and blending). USDA has repeatedly researched and showcased the use of blockchain technology (USDA, n.d.-a,b). GEVO, a U.S.-based ethanol and aviation fuel producer formed a joint venture to track land use and production practices using blockchain (Verity Tracking, 2022). Alternatively, or in complement, database systems like Trace-Your-Claim have been integrated successfully into certification protocols (GRAS, n.d.).
Farm apps have also been examined in peer-reviewed publications, and some gaps have been identified. Eichler Inwood and Dale (2019) state: “Nearly all of the apps we found can be characterized as “single solution” approaches that provide limited data to improve one specific aspect of efficiency—and often sustainability—but they are not effectively designed to integrate sustainability concerns from multiple dimensions or themes of indicators for sustainable agricultural landscapes.” Ideally, the data collected to support an LCFS would be available to the public for analysis.
___________________
Technologies to Support Data Verification of EV Pathways
The International Renewable Energy Agency (IRENA) states that “smart charging means adapting the charging cycle of EVs to both the conditions of the power system and the needs of vehicle users” (IRENA, 2019, p. 3). The different charging technology types and potential for detailed charging data collection have been widely documented in the peer-reviewed literature (see Barone et al., 2020; Haotian Liu et al., 2020). Many smart chargers enable participation in utility demand response programs. Moreover, smart chargers are also helpful to track the EV vehicle class and types as well as verified electricity use for more accurate tracking of energy efficiency ratio groups by LCFS regulators. Both user-managed charging and supplier-managed charging technologies can be used for smart grid management.
Some selected technologies have been reviewed to showcase their integration with LCA:
- Chargepoint offers residential and fleet smart chargers for EVs. The chargers come with an app that allows tracking time-of-use charging and “real-time access to estimated environmental impact data” (Chargepoint, 2022).
- Enel X JuiceBox features load-sharing, which enables the owner to use one dedicated circuit for multiple units. This is useful for two-EV parties sharing a dwelling without the capacity for separate dedicated circuits.
- Nuvve offers a Heavy-Duty Charging Station designed specifically for vehicle-to-grid applications with smart charging capability for heavy-duty fleet vehicles such as electric school buses. The charging stations are controlled through Nuvve’s fleet management app that allows bidirectional vehicle-to-grid and vehicle-to-building services when connected to a vehicle-to-grid compatible vehicle.
- Siemens Vericharge offers modular charging stations at the residential and commercial level that can be integrated with building management systems. This technology enables tracking of commercial charging where electric feeders serve multiple charging stations.
Accuracies of verification technologies for EVs are increasing over time as a host of promising new technologies has emerged over the last decade.
Recommendation 5-5: Combinations of newly developed sensor (including satellite) and supply chain technologies (e.g., database systems, blockchain) could be considered to improve land use change assessments. Policies need to be consistent with verification technology and set realistic expectations for verified LCA values. Data should be made publicly available for external verification. The GHG footprint of verification technologies should be included in the LCA as well.
Emerging Satellite Technologies to Support Verification of Crude Oil, Natural Gas Pathways, and Existing Emissions Models
New satellite sensors can directly measure GHG emissions from oil and natural gas fields. Some selected technologies in this area include the following:
- The Carbon Mapper Consortium is the first-ever public–private–nonprofit satellite collaborative that is measuring methane and CO2 from oil and gas and other assets (waste, coal mines, dairies, etc.). The consortium includes Carbon Mapper and RMI (nongovernmental organizations), NASA Jet Propulsion Lab and CARB (government), Planet (private), and philanthropies (including High Tide Foundation and Bloomberg). Carbon Mapper is now conducting extensive flyovers with methane sensors in the United States and Canada (and planning international flights for 2022), in advance of its first two satellites launching in 2023. A total of 25 satellites are ultimately planned in the buildout (Carbon Mapper, n.d.).
- European Space Agency Sentinel-5P Satellite. This satellite sensor collects methane and aerosol data that can be used to verify models or emissions from large sources (The European Space Agency, n.d.).
In sum, new satellite technologies are emerging that enable direct GHG measurements of some emissions sources. In addition, verification of some CI LCA emissions components can be one tool to enable implementation of an LCFS to move beyond use of fixed default values. Verification programs have incentivized fuel providers to adopt emissions-reducing technology; there is a large body of verification efforts to draw best practices from and to apply in an LCFS.
Conclusion 5-8: There are a number of issues relating to the choice of certification protocols that use verification, including the cost to fuel providers, the benefits of reciprocity among protocols, and whether protocols act as trade barriers. These should be weighed against the net costs or benefits that verification provides to society including the carbon footprint of the certification process itself.
Conclusion 5-9: Certification protocols that use verification strategies can complement initial fuel pathway modeling with LCA and associated models (e.g., economic models used to estimate land use changes) to lessen the impacts of uncertainty in LCA results and to inform policymakers of the effects of an LCFS as they unfold. This insight can aid in policy adjustments if undesirable effects arise over the course of the policy.
Recommendation 5-6: An LCFS should consider inclusion of a certification protocol with verification. The protocol and its implementation should be overseen by an agency or group of agencies with the complementary expertise sets needed for success. These expertise sets include insights into multiple energy systems and new technologies, economics, environmental effects of fuels and their production routes, agriculture, fossil fuel production, and electricity generation.
Recommendation 5-7: Certification protocols should be revisited periodically to adapt to the emergence of new verification technology, national and global trends in the energy, transportation, and agriculture sectors, and to update baselines as needed based on evolving common practice.
Recommendation 5-8: Economic modeling and verification processes are complementary to each other and should both be used. Verification processes to assess international- and national-level land use change should use state-of-the art remote sensing technologies, when appropriate, which are evolving toward increased frequency and spatial resolution.
REFERENCES
ANSI (American National Standards Institute). 2015. ANSI Launches Pilot Program: Accreditation to International Sustainability and Carbon Certification (ISCC) Certification System for Sustainability and Greenhouse Gas Emissions. https://www.ansi.org/news/standards-news/all-news/2015/02/ansi-launches-pilot-program-accreditation-to-international-sustainability-and-carbon-certification-i-05.
Barone, G., G. Brusco, D. Menniti, A. Pinnarelli, G. Polizzi, N. Sorrentino, P. Vizza, and A. Burgio, A. 2020. How smart metering and smart charging may help a local energy community in collective self-consumption in presence of electric vehicles. Energies 13:4163. https://doi.org/10.3390/en13164163.
Bigelow, D., and A. Borchers. 2017. Major Uses of Land in the United States, 2012. Economic Information Bulletin Number 178, U.S. Department of Agriculture. https://www.ers.usda.gov/webdocs/pub
Brown, A. 2020. Electric Cars Will Challenge State Power Grids. https://www.pewtrusts.org/en/research-and-analysis/blogs/stateline/2020/01/09/electric-cars-will-challenge-state-power-grids.
Bushnell, J., E. Muehlegger, E. Rapson, and J. Witcover. 2021. The End of Neutrality? LCFS, Technology Neutrality, and Stimulating the Electric Vehicle Market. Energy Institute WP 318R. https://haas.berkeley.edu/wp-content/uploads/WP318.pdf.
Carbon Mapper. n.d. Carbon Mapper: Accelerating local climate action, globally. https://carbonmapper.org/.
Chargepoint. 2022. Meet ChargePoint Home Flex. https://www.chargepoint.com/drivers/home.
Copenhaver, K., Y. Hamada, S. Mueller, and J. B. Dunn. 2021. Examining the Characteristics of the Cropland Data Layer in the Context of Estimating Land Cover Change. ISPRS International Journal of Geo-Information 10(5):281.
Danylo, O., J. Pirker, G. Lemoine, G. Ceccherini, L. See, I. McCallum, Hadi, F. Kraxner, F. Achard, and S. Fritz. 2021. “A map of the extent and year of detection of oil palm plantations in Indonesia, Malaysia and Thailand.” Scientific Data 8(96).
Davis, L. W. 2019. How much are electric vehicles driven? Applied Economics Letters 26(18):1497-1502. https://doi.org/10.1080/13504851.2019.1582847.
Dunn, J. B., Z. Qin, S. Mueller, H. Y. Kwon, M. M. Wander, and M. Wang. 2017. Carbon Calculator for Land Use Change from Biofuels Production (CCLUB) Users’ Manual and Technical Documentation (No. ANL-/ESD/12-5 Rev. 4). Argonne National Laboratory. file:///C:/Users/Genie/Down loads/CCLUB_Manual_2017_GREET1.pdf.
Dunn, J. B., S. Mueller, and L. Eaton. 2015. Comments on Cropland Expansion Outpaces Agricultural and Biofuel Policies in the United States. April 29. https://greet.es.anl.gov/files/comments-cropland-expansion.
Eichler Inwood, S. E., and V. H. Dale. 2019. State of apps targeting management for sustainability of agricultural landscapes. A review. Agronomy for Sustainable Development 39:8. https://doi.org/10.1007/s13593-018-0549-8.
EPA (US Environmental Protection Agency). 2018. Biofuels and the Environment: Second Triennial Report to Congress (Final Report, 2018). U.S. Environmental Protection Agency, Washington, DC, EPA/600/R-18/195, 2018.
European Commission - Joint Research Centre - Institute for Environment and Sustainability. 2010. International Reference Life Cycle Data System (ILCD) Handbook - General guide for Life Cycle Assessment - Detailed guidance. First edition March 2010. EUR 24708.
EN. Luxembourg. Publications Office of the European Union. https://eplca.jrc.ec.europa.eu/uploads/ILCD-Handbook-General-guide-for-LCA-DETAILED-GUIDANCE-12March2010-ISBN-fin-v1.0-EN.pdf.
European Commission. n.d. https://ec.europa.eu/energy/en/topics/renewable-energy/biofuels/voluntary-schemes.
Falcone, G. 2015. Proposal of a consistent framework to integrate geothermal potential classification with energy extraction. Geothermal Energy Science 3(1):7-11.
Fargione, J., J. Hill, D. Tilman, S. Polasky, and P. Hawthorne. 2008. Land clearing and the biofuel carbon debt. Science 319(5867):1235-1238.
Finer, M., S. Novoa, M. J. Weisse, R. Petersen, J. Mascaro, T. Souto, F. Stearns, and R. G. Martinez. 2018. “Combating deforestation: From satellite to intervention.” Science 360(6395):1303-1305. https://doi.org/10.1126/science.aat1203.
Garcia, R., and F. Freire. 2016. Marginal life-cycle greenhouse gas emissions of electricity generation in Portugal and implications for electric vehicles. Resources 5:41. https://doi.org/10.3390/resources5040041.
German Federal Ministry for Economy Cooperation and Development. 2013. Recognition of private certification schemes for public regulation Lessons learned from the Renewable Energy Directive.
Graff Zivin, J., M. J. Kotchen, and E. T. Mansur. 2014. Spatial and temporal heterogeneity of marginal emissions: Implications for electric cars and other electricity-shifting policies. Journal of Economic Behavior & Organization 107(Part A):248-268.
GRAS (Global Risk Assessment Services). n.d. Sustainable, Transparent & Deforestation-Free Supply Chains. https://www.gras-system.org/.
Great Plains Institute. 2020. A Clean Fuels Policy for the Midwest. https://www.betterenergy.org/wp-content/uploads/2020/01/Clean-Fuels-Policy-for-the-Midwest.pdf.
IRENA (International Renewable Energy Agency). 2019. Electric-Vehicle Smart Charging Innovation Landscape Brief. https://irena.org/-/media/Files/IRENA/Agency/Publication/2019/Sep/IRENA_EV_smart_charging_2019.pdf?la=en&hash=E77FAB7422226D29931E8469698C709EFC13EDB2.
Irvin, J., H. Sheng, N. Ramachandran, S. Johnson-Yu, S. Zhou, K. Story, R. Rustowicz, C. Elsworth, K. Austin, and A. Y. Ng. 2020. Forestnet: Classifying drivers of deforestation in Indonesia using deep learning on satellite imagery. arXiv preprint arXiv:2011.05479.
ISEAL. n.d. ISEAL Codes of Good Practice. https://www.isealalliance.org/defining-credible-practice/iseal-codes-good-practice.
ISCC (International Sustainability and Carbon Certification). System Update. 2021. Gains from esca are accounted only for the fields with no tillage (in case farmer have some fields with conventional tillage and others with no tillage), and only for the years the bioenergy crop is planted on those fields. https://www.iscc-system.org/update/10-march-2021.
ISCC. n.d.-a. “Recognised CBs.” https://www.iscc-system.org/process/certification-bodies-cbs/recognized-cbs/.
ISCC. n.d.-b. “Japanese Government recognises ISCC.” https://www.iscc-system.org/japanese-government-recognises-iscc/.
ISO (International Organization for Standardization). 2020a. ISO/IEC 17021-1:2015. Conformity assessment—Requirements for bodies providing audit and certification of management systems—Part 1: Requirements. https://www.iso.org/standard/61651.html.
ISO. 2020b. ISO/IEC 17065:2012. Conformity assessment—Requirements for bodies certifying products, processes and services. https://www.iso.org/standard/46568.html.
Karra, K., and C. Kontgis. 2021. Global land use/land cover with Sentinel-2 and deep learning? In IGARSS 2021–2021 IEEE International Geoscience and Remote Sensing Symposium. https://ieeexplore.ieee.org/document/9553499.
Kelly, C., and N. Pavlenko. 2020. Assessing the Potential for Low-Carbon Fuel Standards as a Mode of Electric Vehicle Support. ICCT Working Paper 2020-29. https://theicct.org/wp-content/uploads/2021/06/LCFS-and-EVs-dec2020.pdf.
Lark, T. J., J. M. Salmon, and H. K. Gibbs. 2015. Cropland expansion outpaces agricultural and biofuel policies in the United States. Environmental Research Letters 10(4):044003.
Liu, H., X. Zhu, Z. Xiao, Y. Wu, Y. Li, D. Li, K. Denga, and S. Liu. 2020. The application of smart meter in the management of electric vehicle charging facilities. Procedia Computer Science 175:774-777.
López-Tapia, S., P. Ruiz, M. Smith, J. Matthews, B. Zercher, L. Sydorenko, N. Varia, Y. Jin, M. Wang, J. B. Dunn, and A. K. Katsaggelos. 2021. Machine learning with high-resolution aerial imagery and data fusion to improve and automate the detection of wetlands. International Journal of Applied Earth Observation and Geoinformation 105:102581. https://doi.org/10.1016/j.jag.2021.102581.
Microsoft. 2019. Manufacturing Trends Report. https://info.microsoft.com/rs/157-GQE-382/images/EN-US-CNTNT-Report-2019-Manufacturing-Trends.pdf.
Montiel, I., P. Christmann, and R. Zink. 2018 (revised: 2021). The Effect of Sustainability Standard Uncertainty on Certification Decisions of Firms in Emerging Economies. Baruch College Zicklin School of Business Research Paper No. 2018-02-03. Journal of Business Ethics 154(3):667-681.
Moosmann, D., S. Majer, S. Ugarte, L. Ladu, S. Wurster, and D. Thrän. 2020. “Strengths and gaps of the EU frameworks for the sustainability assessment of bio-based products and bioenergy.” Energy, Sustainabilty and Soceity 10(22).
Mueller, S., and S. Unnasch. 2021. High Octane Low Carbon Fuels: The Bridge to Improve Both Gasoline and Electric Vehicles. University of Illinois at Chicago. https://erc.uic.edu/wp-content/uploads/sites/633/2021/03/UIC-Marginal-EV-HOF-Analysis-DRAFT-3_22_2021_UPDATE.pdf.
Mueller, S., R. Pearson, and J. Pristolas. 2021. U.S. Reclaimed Coal Lands: An Analysis of Low Risk for Indirect Land Use Change under the Carbon Offsetting and Reduction Scheme for International Aviation (CORSIA). https://erc.uic.edu/wp-content/uploads/sites/633/2021/08/ISCC_Corsia_US_Coal-Lands_UIC_GeoMARC_Final.pdf.
Piñeiro, V., J. Arias, J. Dürr, P. Elverdin, A. M. Ibáñez, A. Kinengyere, C. M. Opazo, N. Owoo, J. R. Page, S. D. Prager, and M. Torero. 2020. A scoping review on incentives for adoption of sustainable agricultural practices and their outcomes. Nature Sustainability 3:809–820. https://doi.org/10.1038/s41893-020-00617-y.
Potapov, P., Li, X., Hernandez-Serna, A., Tyukavina, A., Hansen, M.C., Kommareddy, A., Pickens, A., Turubanova, S., Tang, H., Silva, C.E. and Armston, J., 2021. Mapping global forest canopy height through integration of GEDI and Landsat data. Remote Sensing of Environment, 253, p.112165.
Potapov, P., S. Turubanova, M. C. Hansen, A. Tyukavina, V. Zalles, A. Khan, X.-P. Song, A. Pickens, Q. Shen, and J. Cortez. 2022. Global maps of cropland extent and change show accelerated cropland expansion in the twenty-first century. Nature Food 3:19–28. https://doi.org/10.1038/s43016-021-00429-z.
Precision Conservation Management. 2022. Economically Viable Sustainable Farming: PCM - An Innovative Farm Service Program. https://www.precisionconservation.org/.
Ryan, N. A., J. X. Johnson, and G. A. Keoleian. 2016. Comparative assessment of models and methods to calculate grid electricity emissions. Environmental Science & Technology 50:8937−8953. https://doi.org/10.1021/acs.est.5b05216.
Searchinger, T., R. Heimlich, R. A. Houghton, F. Dong, A. Elobeid, J. Fabiosa, S. Tokgoz, D. Hayes, and T. H. Yu. 2008. Use of US croplands for biofuels increases greenhouse gases through emissions from land-use change. Science 319(5867):238-1240.
Song, X. P., M. C. Hansen, S. V. Stehman, P. V. Potapov, A. Tyukavina, E. Vermote, and J. R. Townshend. 2018. Global land change from 1982 to 2016. Nature 560(7720):639-643.
Spaceref. 2021. Global Small Satellites Market Is Projected to Reach at a Market Value of US$360.5 Billion by 2030: Visiongain Research Inc. http://www.spaceref.com/news/viewpr.html?pid=58466.
Tamayao, M.-A.M., J. J. Michalek, C. Hendrickson, and I. M. L. Azevedo. 2015. Regional variability and uncertainty of electric vehicle life cycle CO2 emissions across the United States. Environmental Science & Technology 49(14):8844-8855. https://doi.org/10.1021/acs.est.5b00815.
The European Space Agency. n.d. Sentinel-2. https://sentinel.esa.int/web/sentinel/missions/sentinel-2.
USDA. n.d.-a. Blockchain and emerging approaches supporting food safety management systems. https://www.nal.usda.gov/research-tools/food-safety-research-projects/blockchain-and-emerging-approaches-supporting-food.
USDA. n.d.-b. Improving Food Safety and Security via Blockchain Technology to Track Tanker Washes and Commodity History for Liquid Food Grade and Dairy Industries. https://www.nal.usda.gov/research-tools/food-safety-research-projects/improving-food-safety-and-security-blockchain
USDA Foreign Agricultural Service. 2018. Colombia Annual Biofuels 2018. https://apps.fas.usda.gov/newgainapi/api/report/downloadreportbyfilename?filename=Biofuels%20Annual_Bogota_Colombia_7-6-2018.pdf.
USDA Foreign Agricultural Service. 2020. Biofuels Annual. https://apps.fas.usda.gov/newgainapi/api/Report/DownloadReportByFileName?fileName=Biofuels%20Annual_Tokyo_Japan_10-28-2020.
USDA. 2021a. US Department of Agriculture, Foreign Agricultural Service Voluntary Report. February 25, 2021 Report Number: BR2021-0008 Report Name: Implementation of RenovaBio - Brazil’s National Biofuels Policy. Prepared By: Sergio Barros. https://usdabrazil.org.br/wp-content/up
USDA (US Department of Agriculture). 2014. 2012 Census of Agriculture. https://www.nass.usda.gov/AgCensus/.
USDA. 2015. 2012 National Resources Inventory. https://www.nrcs.usda.gov/Internet/FSE_DOCUMENTS/nrcseprd396218.pdf.
Van Meter, K. J., and N. B. Basu. 2015. Catchment Legacies and Time Lags: A Parsimonious Watershed Model to Predict the Effects of Legacy Storage on Nitrogen Export. Ecological Applications 25(2):451–65. https://doi.org/10.1371/journal.pone.0125971.
van Triel, F., and T. E. Lipman. 2020. Modeling the future California electricity grid and renewable energy integration with electric vehicles. Energies 13:5277. https://doi.org/10.3390/en13205277.
Vivanco, D. F., J. Freire-González, R. Kemp, and E. van der Voet. 2014. The remarkable environmental rebound effect of electric cars: A microeconomic approach. Environmental Science & Technology 48:12063−12072. dx.doi.org/10.1021/es5038063.
Wang, M., M. Wander, S. Mueller, N. Martin, and J. B. Dunn. 2022. Evaluation of survey and remote sensing data products used to estimate land use change in the United States: Evolving issues and emerging opportunities. Environmental Science & Policy 129:68-78.
Wickham, J., S. V. Stehman, and C. G. Homer. 2018. Spatial patterns of the United States National Land Cover Dataset (NLCD) land-cover change thematic accuracy (2001–2011). International Journal of Remote Sensing 39(6):1729-1743.
World Wildlife Fund. 2021. Plowprint Report. https://www.worldwildlife.org/projects/plowprint-report.
Wright, C., and M. Wimberly. 2013. Recent land use change in the Western Corn Belt threatens grasslands and wetlands. Proceedings of the National Academy of Sciences. https://doi.org/10.1073/pnas.1215404110 Corpus ID: 12215032.
Wright, C. K., B. Larson, T. J. Lark, and H. K. Gibbs. 2017. Recent grassland losses are concentrated around U.S. ethanol refineries. Environmental Research Letters 12(4):044001.


