
2
Background and Context
This chapter summarizes the presentations and discussion in the first two sessions of the workshop that provided an overview of four major NIA-sponsored studies by their principal investigators and presentations from three researchers on identifying and reducing nonresponse bias. Vetta Sanders Thompson from Washington University in St. Louis chaired the first session, and Jennifer Madans, formerly of the National Center for Health Statistics, chaired the second session.
OPPORTUNITIES AND CHALLENGES WITH RESPONSE AND CONSENT IN LONGITUDINAL SURVEYS ON AGING
Midlife in the United States (MIDUS)
Carol Ryff, the director of the Institute on Aging and Hilldale Professor of Psychology at the University of Wisconsin-Madison and principal investigator for MIDUS,1 described what she and her colleagues have done in the MIDUS study to maximize participation. They have used incentives and sent newsletters and birthday cards to give back and build rapport with their respondents. MIDUS includes a nationally representative sample of over 11,000 Americans, all of whom were aged 25 to 74 at their baseline assessments. The study began in 1995 with over 7,000 adults, including a national sample of twins, all of whom completed a survey; a subsample also completed daily assessments.
___________________
1 For more information, see http://www.midus.wisc.edu/index.php.
NIA began funding the project at the second wave, which collected the survey and daily assessments, but also added new projects on cognition, biomarkers, and neuroscience in 2004. Only the survey was attempted with all participants; the other assessments were only conducted on subsamples given the time and cost of these projects. Ryff noted that in 2012, they recruited a new national sample known as the Refresher that brought over 4,000 new participants to the study, paralleling the age and gender profiles of the core baseline sample. The same multiproject assessments were obtained on the Refresher as were done in the 2004 collection from the main sample.
Ryff provided response rates for the Core baseline sample and for two subsequent follow-ups, arrayed by phone interviews, questionnaires, and the cognitive project (Table 2-1). The numbers in bold at the second followup highlight gains in participation due to a re-fielding effort that resulted in completion of 193 questionnaires and 263 Brief Tests of Adult Cognition by Telephone (BTACTs). Ryff said she believes the incentives were important in achieving the outcomes. They included an upfront unconditional incentive of $10 plus $75 for completion of the self-administered questionnaire, and $10 up front plus $50 for completion of the BTACT.
As can be seen in the third section of Table 2-1, the response rates for the Refresher sample, recruited in 2012, were lower than the baseline of the Core sample, consistent with declining participation rates observed in
TABLE 2-1 MIDUS Response Rates
| Baseline | 1st Follow-up | 2nd Follow-up | |
|---|---|---|---|
| Core (National) | |||
| Phone interview | 70% | 75% | 75% |
| Self-Administered Questionnaire (SAQ) | 89% | 81% | 83(89)%** |
| Cognitive | NA | 85% | 82(90)%** |
| Core (Milwaukee) | |||
| Personal interview | 71% | 78% | |
| SAQ | 70% | 84% | |
| Cognitive | 52% | 85% | |
| Refresher (National) | |||
| Phone interview | 59% | ||
| SAQ | 74% | ||
| Cognitive | 71% | ||
| Refresher (Milwaukee) | |||
| Personal interview | 48% | ||
| SAQ | 58% | ||
| Cognitive | 42% | ||
NOTE: Longitudinal response rates adjusted for mortality.
** Response rates in parentheses adjusted for Refielding Effort.
SOURCE: Adapted from Carol Ryff workshop presentation, September 27, 2021.
other national surveys. MIDUS documentation shows, however, that the Refresher sample aligns well with the 2012 Current Population Survey (CPS), except for being somewhat more educated. The second and fourth sections of the table show the response rates for MIDUS recruitment of an oversample of 1,200 African Americans from Milwaukee, Wisconsin, half of whom were recruited at the second wave of the Core sample and the other half as part of the Refresher recruitment. Examples of scientific findings on racial differences in objectively measured sleep and their links to neighborhood disadvantage and cardiometabolic health were noted.
Ryff next described the Retention-Early Warning (REW) project, which was initiated to bring back participants who had dropped out of the study, given what is known from MIDUS (Radler and Ryff, 2010) and other national studies about selective attrition. The goals were to improve representativeness of the sample and also allow investigation of targeted scientific questions. She reported that 651 attritors were brought back into the study using high incentives and state-of-the-art methods from the University of Wisconsin Survey Center, with initial findings summarized in Song et al. (2021).
Concerns about respondent burden arise in MIDUS, Ryff said, because participants are asked for multiple things beyond the survey. For example, the biomarker project includes a 2-day clinic visit plus travel. Nonetheless, she emphasized high retention in the third wave from among those who had participated in multiple projects. Specifically and beyond their survey participation, 75 percent of those who previously participated in the cognitive project returned, 85 percent of those from the daily project returned, and over 90 percent returned of those who participated in the biomarker and neuroscience projects.
For the biomarker study, Ryff described efforts to overcome barriers to participation, such as providing flexible scheduling, cultivating trust by addressing participant concerns, covering all travel plus companion travel if needed, and covering other expenses such as childcare, pet care, and farm help. They also provide an incentive of $200 at the end of the visit.
MIDUS uses newsletters, which include relevant health information, sent to participant’s homes as a primary way of giving back to them. Ryff shared an example of a recent Purpose in Life newsletter, which explains what purpose in life is, and shows how it matters for promoting longevity and reducing risk of various disease outcomes. Participants in the biomarker project have reported that they are participating in MIDUS because they are interested in the research, they want to contribute to science, and they appreciate the money and health information received.
MIDUS has separate informed consents for each project, some of which have multiple consents within them, the text of which is largely determined by the Institutional Review Boards (IRBs). The IRBs dictate the language to use, much of which is about protecting the institution against legal liability.
She commented that “informed consent” is a strange phrase, given that these documents often confuse more than they inform, as illustrated by the nine-page consent form for the biomarker project. For example, the required text states: “There is no direct benefit to participating,” despite the fact that participants are provided multiple types of health information. There is also text saying participants might lose their health insurance or their job if certain results get into their health record, and that if they are physically injured as a result of participating, they will receive care, but will have to pay for it.
Ryff recapped her key points on how MIDUS has achieved enhanced participation and retention by using targeted incentives within all projects, cultivating rapport through newsletters, using personal interviews in Milwaukee and the REW project, and carefully pacing requests from project to project. She concluded by noting that MIDUS data are extensively used by the scientific community from which over 1,500 publications have been generated by over 24,000 unique users. The MIDUS website provides findings across 34 different topical areas with links to PDFs of the publications.2
National Social Life, Health, and Aging Project (NSHAP)
Linda Waite, the George Herbert Mead Distinguished Service Professor of Sociology at the University of Chicago and senior fellow at NORC at the University of Chicago, is principal investigator of NSHAP.3 NSHAP is a longitudinal, population-based study of health, and especially social factors and social life. The study was designed to understand the links between different components of health and well-being among older community-dwelling Americans. She noted that for the first three rounds of NSHAP, all data collection was done in person.
Waite said that Round 1 of NSHAP was fielded in 2005–2006 and recruited 3,005 completed interviews with a response rate of 75.5 percent. Round 2 in 2010–2011 attempted re-interviews with everyone from Round 1 and added spouses and cohabiting partners. The conditional response rate of the original participants was almost 90 percent, and they were also able to interview 26 percent of Round 1 nonrespondents. Round 3 took place in 2015–2016, and in addition to seeking to re-interview everyone who had been interviewed previously, they recruited a younger cohort, aged 50 to 67 years, so that the full sample had a total age range from 50 to 95 years. She noted that the conditional response rate for those who have been interviewed before was over 90 percent, and the response rate for the new cohort was 76 percent.
___________________
2 See http://www.midus.wisc.edu/index.php.
3 For more information, see https://www.norc.org/Research/Projects/Pages/national-sociallife-health-and-aging-project.aspx.
Waite described the strategies to gain in-person cooperation. NSHAP provided interviewers with a leaflet and a loose-leaf binder, which included newspaper articles, examples of scientific publications, and endorsements by local government, so that the interviewers could tailor to the concerns of each respondent. All Round 1 through Round 3 interviews were done in person, and respondents were given a $100 incentive. Toward the end of the field period, NSHAP increased the incentives to obtain interviews from respondents who had already been asked several times. If a respondent’s spouse had already been interviewed, both were given the higher incentive. They also sent tailored refusal letters, often by FedEx toward the end of the field period, which seemed to increase response.
Round 4, which Waite said is in the field now, has absorbed a tremendous amount of research and scientific effort over the last 3 or 4 years, and is different of necessity. Rounds 1 through 3 were all in person, and consisted of a 2-hour interview that included collection of biomeasures: blood pressure, saliva, sensory function, and physical function. That was a big challenge to conduct. The move to remote data collection (internet, telephone, and mail) is expected to be less expensive, but that is to be determined. Waite noted that remote data collection may be more appropriate for some respondents who prefer it, and it has allowed NORC to develop the tools to consider a hybrid, remote, and in-person approach now and in the future. Work on the remote protocol began prior to the COVID-19 pandemic, which meant that many of the materials were already developed and pretested, and the remote protocol has allowed them to collect data during the pandemic.
Waite described the strategy to categorize participants by their likelihood of participating remotely. The most cooperative respondents, who completed all previous rounds quickly and did not need an increased incentive, are assigned to remote data collection. The second group, which was assigned to be interviewed in person, are those whom the investigators saw as needing more handholding and being more reluctant: They may have participated in only one previous round, needed a higher incentive, or were nonrespondents in the recruitment phase for the second, younger cohort. Approximately 2,500 respondents are initially assigned to remote data collection and 2,700 respondents are assigned to be interviewed in person.
For those participants assigned to a remote mode of data collection, Waite said that they will use mail push to web, in which a request is mailed to respondents with a link to a questionnaire on the internet. Those who complete the web-based questionnaire are asked for permission to mail them a “BioBox,” which is the remote biomeasure data collection, followed by a supplementary self-completion questionnaire, which is also the leave-behind questionnaire for the in-person mode. (See Chapter 4 for more information on the BioBox.)
Waite said that respondents who like the web complete the survey very quickly, so NHSAP has had tremendous success during COVID-19. If respondents do not complete the web-based questionnaire, NORC attempts to reach them via phone. If staff are able to complete the interview on the phone, then respondents are asked for consent to send the BioBox and the leave-behind questionnaire. Some people preferred a paper-and-pencil questionnaire, which they were sent in the mail. All participants interviewed in person have the biomeasures taken in person as well, and they also receive the leave-behind questionnaire.
Finally, Waite described the COVID-19 substudy, which was carried out from October 2020 to January 2021 and was funded by NIA. It was NSHAP’s first attempt at remote data collection and included no biomeasures. For this study, NORC contacted all NSHAP respondents for whom they had any kind of contact information. They first asked participants to complete a survey on the internet. If they did not respond, then they were sent a paper-and-pencil questionnaire to complete and return. The final attempted contact for nonrespondents was via phone. Complete questionnaire data were obtained from approximately 2,700 respondents, which was a response rate of 58 percent.
Waite briefly described the results of a logistic regression used to examine the characteristics of nonrespondents. They found that some demographic characteristics and physical health predicted response to the survey. This information will be used in Round 4 by selecting for in-person data collection more often for respondents who are younger, not married, and in poorer health. NSHAP investigators will also consider other ways to mitigate nonresponse for men, minorities, and those with less education.
National Longitudinal Study of Adolescent to Adult Health (Add Health)
Robert Hummer, the Howard W. Odum Distinguished Professor of Sociology and Fellow of the Carolina Population Center at the University of North Carolina at Chapel Hill, is the director and principal investigator of the National Longitudinal Study of Adolescent to Adult Health (Add Health).4 Add Health is a nationally representative study of people who were in grades 7 through 12 in the mid-1990s, and the original 20,745 individual adolescents in Wave 1 were drawn from a random sample of 80 paired (high school and feeder school) schools throughout the United States. The first four waves of Add Health, which unfolded as the adolescents went through the transition to adulthood and were young adults in 2008, were all in-person data collection efforts, and the response rates can be seen in Table 2-2.
___________________
4 For more information, see https://addhealth.cpc.unc.edu/.
TABLE 2-2 Add Health Longitudinal Design
| In-School Administration | Survey Administration | Biomarker Data Collection | |||||
|---|---|---|---|---|---|---|---|
| Wave I 1994–1995 |
Students N = 90, 118 |
School Admin N = 144 |
Adolescents in Grades 7–12 N = 20,745 (RR = 79.0%) |
Parent N = 17,670 |
|||
| Wave II 1996 |
School Admin N = 144 |
Adolescents in Grades 8–12 N = 14,738 (RR = 88.6%) |
|||||
| Wave III 2001–2002 |
Partners N = 1,507 |
Transition to Adulthood Aged 18–26 N = 15,197 (RR = 77.4%) |
Saliva and Urine N = 14,012 |
||||
| Wave IV 2008 |
Young Adults Aged 24–32 N = 15,701 (RR = 80.3%) |
Blood Spots N = 14,687 |
IIV Study N ~ 100 |
||||
| Wave V 2016–2018 |
Sexual Orientation, Gender Identity, and Health N = 2,665 |
Adults Aged 33–43 N = 12,300 (RR = 72.0%) |
Parent N = 3,000 |
Venous Blood N ~ 5,381 |
IIV Study N ~ 100 |
||
| Wave VI 2022–2024 |
Early Midlife Adults Aged 40–50 Goal N = 13,194 (Goal RR = 73.0%) |
Venous Blood Goal N = 7,500 |
IIV Study N ~ 100 |
||||
SOURCES: Adapted from Robert Hummer workshop presentation, September 27, 2021.
Hummer focused his presentation on the lessons learned from the transition to a predominantly web-based survey due to high costs of in-person surveying and a lower funding level for Wave V. He described how the sample of roughly 20,000 was split into three subsamples to spread data collection costs over 3 years. In Year 2, they further divided the sample into web-based and a traditional in-person interview of roughly 1,100 respondents, which was done to replicate earlier waves of Add Health as an in-person interview and to estimate mode effects. In addition, they shifted from in-person to a mixed-mode interview, which was mostly web based with a little bit of mail collection. They also sampled web and mail nonrespondents in person and interviewed them in their home on a project laptop. The questionnaire length was reduced from 90 to 50 minutes from earlier waves of Add Health because of the new web-based survey design. At the end of the survey interview, respondents were asked to consent to the home health exam. If they consented, then biological data were collected in a separate home health exam by a subcontractor.
Hummer described the results from the Wave V data collection. From the overall sample, they obtained 12,300 respondents for an effective response rate of 72 percent, which was somewhat lower than earlier waves of Add Health, which ranged from 77 to 90 percent. For the web-based samples, they successfully interviewed 52 percent, which increased to 72 percent with extensive nonresponse follow-up (see Table 2-3). Approximately 8,400 survey respondents consented to do the home health exam, which is about a 68 percent consent rate. Importantly, about 90 percent of respondents surveyed in person consented to a home health exam, whereas
TABLE 2-3 Add Health Wave 5 Response and Consent Rates
| Overall sample size of 12,300 (effective response rate of 72%) | ||
|---|---|---|
| Samples 1, 2A, 3 (n = 11,198) | ||
| Web/Mail response rate: | 52.0% | |
| Nonresponse follow-up response rate: | 41.3% | |
| Combined response rate: | 71.8% | |
| Sample 2B (n = 1,102) | ||
| In-person response rate: | 72.2% | |
| Consented 8,379 (of 12,300) survey respondents for home health exam (68%) | ||
| Consent rate ~90% among in-person survey respondents | ||
| Consent rate ~60% among web/mail-based respondents | ||
| Conducted 5,381 exams (of 8,379 consented)… (64%) | ||
SOURCE: Adapted from Robert Hummer workshop presentation, September 27, 2021.
only 60 percent who took the survey largely via web consented to the exam. However, they were only able to conduct about 5,400 home health exams, due to scheduling difficulties and no-shows. More detailed information on the Wave V methods can be found in Biemer et al. (forthcoming) and Harris et al. (2019).
Hummer summarized the 12 lessons learned from Wave V about the survey methods:
- A 50-to-60-minute web survey is feasible. They tested breaking it up into 25-minute segments but found that allowing people to rest or finish another day was not necessary; respondents wanted to complete it all at once.
- The mail option was costly and yielded poorer data than the web.
- Having an email address was a key factor for both web and in-person response.
- Constant reminders were important. They left the web-based survey open for a year or even longer and mailed out postcards, letters, and, toward the end, FedEx mailers.
- The in-person response rate of about 72 percent continues to be higher than the web, which was about 52 percent. Responses via the web were much cheaper: about one-tenth the cost of an in-person survey.
- Any national news about data breaches or confidentiality hurts survey response.
- The nonresponse follow-up was very important in achieving a more representative sample. They subsampled nonrespondents and devoted considerable resources to the nonresponse follow-up operations.
- Higher incentives matter, but it was not a complete solution.
- Parents were not helpful in finding their children in Add Health; they were more likely to protect the confidentiality of their children than to provide their address.
- Many respondents reported high regard for participation in Add Health, and they said they want to contribute to science and see it as a very important research effort.
- There were some mode effects in switching from in-person to web survey.
- The rate of in-person respondents’ consent for the home exam was much higher than that of web or mail-based respondents, which is one of the downsides of moving to a web-based survey.
Hummer described plans for Wave VI, which is now in development with fieldwork anticipated to begin in May 2022. They are planning
to go back to the entire sample, administering a web-based survey to approximately three-fourths of the sample, and an in-person survey to the remaining quarter. Special measures on sensory, physical, and cognitive functioning will be collected for the in-person sample. Each of the two samples will be nationally representative and, importantly for the web-based survey sample, an in-person nonresponse follow-up will go after critically needed nonrespondents.
Hummer noted the ambitious response rate goals for Wave VI: they are projecting a 67 percent raw response rate, a conditional consent rate for exams of 74 percent, and a conditional rate of 77 percent for completing the exams from those who consented. He pointed out many lessons were learned from Wave V regarding how to do a web survey, how to transition from an in-person to a web survey, and so forth. They plan to conduct more intensive panel maintenance with newsletters and tracing activities in order to continue to update addresses and send notifications to sample members. They also have shorter periodicity between Waves V and VI, compared to Waves IV and V, which was a period of 8 to 9 years when they did not conduct interviews. Larger survey incentives in Wave VI compared with Wave V are offered, as well as a larger and high-density targeted nonresponse follow-up for nonrespondents to selectively go after the types of people less likely to respond to a web-based survey. Finally, a larger in-person subsample with oversamples of racial and ethnic minorities will be conducted to obtain data on sensory, physical, and cognitive functioning.
The consent processes for the survey consist of a description written at a very low reading level, Hummer explained. They assess the respondent’s capacity to provide informed consent with a brief series of questions, and then they collect an electronic signature. They plan to collect additional consents for the home exam and the potential for future linkages to Medicare/Medicaid data and educational data through the last four digits of a respondent’s Social Security Number. Planning is under way to increase the incentive for the home exam and to ask respondents both at the beginning and at the end of the survey if they will consent to the home exam, not just at the end.
The Health and Retirement Study (HRS)
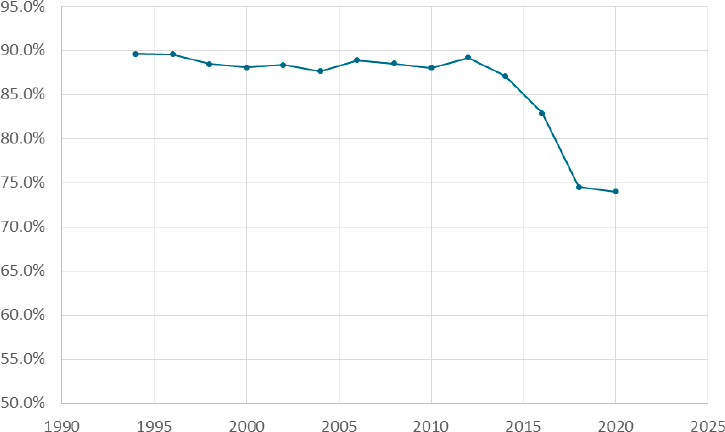
David Weir, research professor in the Survey Research Center at the Institute for Social Research at the University of Michigan, is the director of the Health and Retirement Study (HRS).5 Weir started by showing the growth in publications that use the HRS to underscore that the reason to care about response and consent is the science that can be created from the
___________________
5 For more information, see https://hrsonline.isr.umich.edu/.
data collected. Figure 2-1 shows the response rate to the HRS interviews, which have been administered every other year beginning in 1992. The 15th wave was completed in 2020. Starting in 2014, response rates greatly declined. However, Weir stated, responses rates alone do not show what is happening. He illustrated this in Figure 2-2, with a series of effort-yield curves that have an index for the number of attempts along the horizontal axis, with response rates on the vertical axis. These curves show that the same number of contact attempts results in lower and lower response rates from 2006 on, and that it takes more and more total attempts to reach the same response rate as the last wave; moreover, starting in 2014 the final response rates were slightly lower than the previous wave despite increasing total attempts. Weir also noted that in 2018 and 2020, budget cuts forced limits on the effort. They stopped at a fewer number of attempts than in previous waves and had a noticeably lower response rate. In 2020, the pandemic required converting in-person interviews to phone, but they were able to make more telephone calls and increase the number of attempts about as far as they did in 2016. Weir noted that if the number of attempts had not increased since 2006, the response rate in 2020 would have been about 12 points lower than it was.
Weir provided an overview of what they have learned about nonresponse bias and selection effects. The decline in participation has been
SOURCE: David Weir workshop presentation, September 27, 2021.

SOURCE: David Weir workshop presentation, September 27, 2021.
more prevalent in the White sample than in the minority sample. Blacks have higher response rates than Whites, and Hispanics have about the same response rates as Whites. They have also seen a trend toward lower response rates among less-educated participants, which has grown in the most recent waves. Incentive payments to respondents have increased over time. The payments are a little higher for the in-person than for the telephone interviews, which are $80 for the core interview and another $20 for the in-person interview that also has a leave-behind questionnaire.
Weir described analyses comparing interviewers and the number of attempts it took to get an interview in 2006 and 2018. Interviewers today are more representative of the whole population, and there is more variance in performance across interviewers. However, he reiterated, the main finding is that the whole distribution has shifted toward requiring many more attempts per interview for nearly all interviewers such that even the best interviewers of today do not do as well as the worst interviewers of 15 years ago. He also noted that the length of interviews rose steadily from 2000 to 2012, and in 2014 they made a conscious effort to reduce length.
It increased some in 2016, but has been flat since then. They have also asked respondents to complete mail surveys, and these surveys have shown a similar pattern of decline in response over time.
Weir turned to consent rates for biological samples. Saliva samples are collected for the purpose of getting DNA, and consent rates have been quite stable between 80 and 85 percent. Respondents are asked for consent as part of the in-person interview, and the sample is collected right after they sign the consent. If a participant does not consent, the interviewers ask again in a subsequent wave, and an additional 5 percent does consent. The second request is also helpful in bringing consent rates for Blacks to be more similar to rates for Whites and Hispanics.
Dried blood spots are collected as part of that same in-person interview, Weir continued, and more recently they have been doing whole blood collection. They have seen lower consent rates among Blacks to provide blood samples than Whites or Hispanics. The blood draws are done by a separate contractor, which means that people can refuse to consent at the time of the interview, and they can also refuse when the contractor comes to take their blood, so the overall rate for blood collections is about two-thirds of the sample.
Weir also described how respondents’ consent is sought to link to Medicare records, and those who decline are asked again in subsequent waves. Linkage consent rates have been declining but multiple requests help considerably in raising rates. Blacks are slightly less likely to agree to linking their data to Medicare records, and there is a tendency for the most educated to consent at slightly higher rates.
Weir concluded by noting that they have conducted in-home cognitive assessments to identify dementia, which is a high-priority issue for NIA. An initial expensive in-home assessment took place about 20 years ago and obtained about a 56 percent response rate. Development of a Harmonized Cognitive Assessment Protocol has since proved to be much less expensive and much less burdensome for respondents, and they obtained a 79 percent response rate in 2016.
Discussion
Vetta Thompson began the discussion by asking about the adequacy of funding for continuing to improve or even maintain response rates. Weir pointed out two paths. As part of the puzzle, the first, using the web for data collection, offers low-cost ways of gathering information, but has lower participation. Adjustment can be made to keep web collection representative, so it is a potential path. The other path, he said, is very intensive in-person contact to try to boost participation and response, which is a much more expensive undertaking and may not be feasible with large sample studies.
Thompson next asked the presenters’ views on the most effective way to keep the representativeness of the sample and attend to the needs of the science. Hummer replied that for Add Health, moving to the large web-based survey has been very helpful both because it costs so much less than traditional in-person interviews and it provides a way to get information from the most cooperative respondents. Then they spend more of their resources trying to fill in their sample with those most needed to maintain representativeness. That was Add Health’s strategy for Wave V and is planned for Wave VI. He noted, however, that they have not solved the issue of lower consent for home exams via web than in-person interviews.
IDENTIFYING AND REDUCING SELECTION BIAS
Measuring and Reducing Nonresponse and Linkage Nonconsent Bias
Joe Sakshaug, distinguished researcher at the German Institute for Employment Research, professor of statistics at the Ludwig Maximilian University of Munich, and honorary professor in the School of Social Sciences at the University of Mannheim, began his presentation noting that it is important to look at the conceptual pathway to selection. The typical start is with a gross sample drawn from a frame or administrative database. Some sample members are respondents and some are nonrespondents, which constitutes the first stage of selection. Usually only a subset of respondents give their consent for data linkage or biomarkers. Even among those who consent to the linkage or biomarkers, only a smaller subset can be linked or, as Weir also mentioned, only a subset of those who consent actually have their blood drawn. So, he noted, at least two, maybe more, levels of selection must be considered when identifying and analyzing selection bias. He extended this consideration to the panel framework where a panel survey may be collecting data over multiple time points. He said that nonresponse can occur at each wave of data collection: some sample members may participate in one or two waves and then drop out, so the cumulative nonresponse tends to increase over time.
Sakshaug noted that to identify and correct for both consent and response biases, it is useful to have auxiliary data available, such as administrative data, frame data, paradata, or commercial data. In the longitudinal case, previous wave survey data can be potentially useful for identifying and correcting for nonresponse bias. In the case of linkage nonconsent, he commented, it is useful to have any of the above auxiliary data sources, as well as current wave survey data.
Sakshaug described studies where he looked at the magnitude of nonresponse bias and linkage nonconsent bias. In the first study (Sakshaug and Kreuter, 2012), he and his colleague examined linkage nonconsent bias,
nonresponse bias, and measurement bias in a mixed-mode survey of welfare benefit recipients in Germany by using administrative records. Because they did not need linkage consent in order to link the administrative records, they could ask for consent and then use the administrative data to assess differences between consenters and nonconsenters. The consent rate was about 78 percent (Table 2-4), and nonconsent bias was the lesser of the problems when compared to other traditional sources of survey error, like nonresponse bias and measurement bias. They discovered some significant nonconsent biases for age and for foreign citizenship, but these were quite small relative to measurement bias and nonresponse bias. Measurement bias tended to be the largest source of error compared to nonresponse and nonconsent, and slightly more variables showed nonresponse biases compared to nonconsent biases.
In the second study (Sakshaug and Huber, 2016), he and his colleague examined nonconsent bias and panel nonresponse bias in a longitudinal study of employees in Germany. Looking at the average bias across several characteristics taken from administrative records, they found that panel nonresponse bias tends to be the more dominant source of bias. The average relative nonconsent bias was quite low, which was not surprising since the consent rate in this study was around 90 percent. Nonconsent dropped slightly over time because the respondents who did not consent in the previous wave were asked again and some of them consented in the following waves.
Sakshaug highlighted several research studies on adjusting for panel nonresponse bias. The first study (Silverwood et al., 2020) used previous wave survey data to adjust for panel nonresponse. The authors applied a data-driven multiple imputation approach for nonresponse bias adjustment in the Next Steps Cohort Study, using the previous seven waves of data.
| Characteristics | Nonresponse Bias | Nonconsent Bias | Measurement Bias |
|---|---|---|---|
| Age (years) | 0.1 | –0.3* | –0.0 |
| Foreign (%) | –5.6* | –0.9* | –2.5* |
| Unemployment benefit (%) | 3.2* | –0.3 | –7.5* |
| Disability (%) | 0.4 | 0.0 | 6.1* |
| Employment status (%) | 1.0 | 0.3 | –1.0 |
| Monthly income (EUR) | –71.4* | 1.7 | 402.4* |
NOTE: * p<0.05.
SOURCE: Adapted from Joe Sakshaug workshop presentation, September 27, 2021, from Sakshaug and Kreuter (2012).
They drew upon over 850 eligible predictor variables from earlier waves and imputed nonresponse in the previous seven waves of data collection, applied a variable selection method to identify significant predictors of the Wave 8 nonresponse, and then used these retained predictors to multiply impute the Wave 8 outcomes. Table 2-5 shows results before and after the multiple imputation (MI). The far-right columns show nonresponse bias in these selected characteristics, but after applying the multiple imputation approach, the authors did see some bias reduction in these variables.
Sakshaug next described how to use administrative data in a piggyback longitudinal study to adjust for nonresponse bias. Piggyback longitudinal surveys recruit their participants from a separate, independent cross-sectional survey. Examples include the Medical Expenditure Panel Survey (MEPS) Household Component, which draws its sample from the U.S. National Health Interview Survey. According to Sakshaug, many cross-sectional surveys used in piggyback longitudinal studies perform administrative record linkages, provided that the respondent gives consent to those linkages. He wanted to explore whether it is possible to use these existing linkages from cross-sectional surveys to measure and adjust for nonresponse bias in these piggyback longitudinal surveys. He noted challenges to this approach because not all cross-sectional respondents are willing to participate in the follow-up survey, and not all of them consent to linkage, so further adjustments for these different sources of selection must be made.
Sakshaug briefly referred to a study (Büttner et al., 2021) that has found several administrative variables that were significant predictors of participation in each of the waves of the longitudinal survey. Current and
TABLE 2-5 Adjusting for Panel Nonresponse Bias Using Previous Wave(s) Survey Data
| Characteristics | Wave 1 Rs | Wave 8 Rs | NR Bias | ||
|---|---|---|---|---|---|
| Complete case analysis | MI approach | Before MI | After MI | ||
| Male (%) | 51.5 | 45.0 | 46.6 | –6.5 | –4.9 |
| Non-White British (%) | 14.1 | 12.8 | 14.3 | –1.3 | 0.2 |
| Single parent household (%) | 23.5 | 19.5 | 23.3 | 4.0 | –0.2 |
| Ever suspended (%) | 11.1 | 7.3 | 10.5 | –3.85 | –0.6 |
| Attend university (%) | 36.9* | 44.5 | 38.2 | 7.6 | 1.3 |
| Income (GBP) | 33,022 | 34,756 | 32,673 | 1734 | –349 |
NOTE: *External benchmark (estimated).
SOURCE: Adapted from Joe Sakshaug workshop presentation, September 27, 2021, from Silverwood et al. (2020).
between-wave information was associated with attrition, and incorporating these linked-administrative data in the weighting adjustment reduced nonresponse bias for some variables.
Sakshaug concluded by discussing survey design strategies for reducing nonconsent bias. He described studies that have experimented with the placement of the linkage consent question and noted that most of these studies find that asking for linkage consent at the beginning or at least in the middle of the survey has a higher consent rate than asking at the end. Linkage consent biases exist, he said, but are small relative to nonresponse biases, and using rich survey and linked-administrative data are useful for measuring and adjusting for nonresponse bias. He reiterated that linkage consent rates can be improved by asking for consent at the beginning of the questionnaire, as opposed to the end.
Identifying and Mitigating Nonresponse in a Longitudinal Survey of the Medicare Population
Debra Reed-Gillette is director of the Survey Management and Analytics Group (SMAG) within the Office of Enterprise Data and Analytics (OEDA) of the Centers for Medicare & Medicaid Services (CMS), and she is the director of the current Medicare Current Beneficiary Survey (MCBS). Reed-Gillette began by providing background on the MCBS and the strategies used since 2015 to mitigate nonresponse and to ensure the sample is representative of the Medicare population.
MCBS is a continuous, in-person longitudinal survey representing Medicare beneficiaries aged 65 and over and beneficiaries who are under age 65 who are eligible for Medicare due to disabling conditions, Reed-Gillette explained. The MCBS is used in administering the Medicare program, monitoring and evaluating beneficiary health status, and understanding how the health care policies affect the beneficiaries. The survey has been conducted since 1991, and each survey is interviewed up to three times per calendar year for four consecutive years in a rotating panel design to form a continuous profile of their health care experiences. One panel is retired during each winter round and a new panel is selected to replace those who have retired each fall round.
According to Reed-Gillette, an important feature of the MCBS is its ability to link self-reported data with administrative claims and enrollment data that are available with the Medicare program, which permits an examination of both the health care characteristics of beneficiaries and health care cost and utilization. The MCBS also includes facility-residing beneficiaries, and beneficiaries are followed who go into and out of long-term care facilities and skilled nursing facilities to maintain a comprehensive profile of their health care utilization expenditures and their changes
and transitions through the health care system. Finally, the MCBS includes an oversample of beneficiaries who are Hispanic, who have disabling conditions, who are age 64 and under, and who are age 85 and over to have sufficient sample sizes for analyses of those groups. The sample is selected to be representative of all Medicare enrollees, including enrollees during the current benefit year, and consists of 16,000 respondents annually.
Because they have administrative data on Medicare enrollment, Reed-Gillette said that the demographics of the Medicare population can be compared to the survey respondents. Differential nonresponse can impede observation of change over time in subgroups, degrade the representativeness of the sample, and have a lasting impact across the study for longitudinal analyses, she reported. Several techniques have been used during fielding of the survey to help identify and mitigate this differential nonresponse. They also have conducted a nonresponse bias analysis every 3 years to identify any additional impacts and to determine potential mitigation strategies.
For the most recent round, Reed-Gillette said, the overall response rate was 80.5 percent; the incoming 2020 panel sample had a response rate of 75.3 percent, and the continuing panel had a response rate of 85.1 percent. Once respondents are in the survey for at least two rounds, they almost always continue for all 4 years.
Reed-Gillette described how they are using R-indicators to look at representativeness of respondents, in addition to response rates, to examine the variability of subgroup response rates during data collection. The R-indicators are computed from response propensities modeled using variables on the sample frame, including race, sex, age, ethnicity, stratum, and region of the country. They examine the variability and the changes in these propensities over the rounds of data collection. They also look at weekly response rates as well as R-indicator reports and provide this information to field managers, so that interviewer case priorities can be adjusted if needed during fielding to target respondent groups in need of increased responses and participation. In her presentation slides, Reed-Gillette provided examples of the dashboards shared with field interviewers that highlight the characteristics of respondents that require more targeted interviewing efforts.
Reed-Gillette also pointed to improvements in locating strategies to reduce nonresponse by using administrative and commercial data sources, which may be more up-to-date than the addresses from enrollment information. Administrative data from assessments that are required from Medicare and Medicaid certified facilities can help locate individuals who have been in facilities by using those administrative assessment records.
Contacting strategies are also improving, Reed-Gillette said. The language of the advance letter sent to beneficiaries has been revised to directly
and clearly ask the beneficiary to participate in the survey. The signatory of the letter has been changed to the survey director, rather than the CMS privacy officer, which improved respondents’ understanding of who was asking them to participate. The logos on the letterhead and envelopes were reviewed to make sure the letter looks legitimate, which has helped reduce nonresponse. Reed-Gillette also described coordination with Social Security and within the Medicare program itself to ensure that the MCBS is legitimate in the eyes of respondents. They have provided information on the survey to the 1-800 Medicare hotline, because many respondents will call to determine whether or not the advance letter is indeed legitimate or a scam. They have also provided information to Social Security Offices because beneficiaries may contact them about the legitimacy of the survey.
In conclusion, Reed-Gillette described a new study in the field examining beneficiary response to various types of reminder letters. They are comparing having no reminder with a FedEx reminder, a regular mail letter, or a postcard. The early information is showing that the FedEx reminder is most effective with increased call volume to the respondent 1-800 number and hits on a responsive website shortly after receipt of the FedEx package. Completion rate for the FedEx reminder has been almost 10 percentage points higher than through other contact attempts. Another study will look at the types of materials sent to beneficiaries because they have found that glossy materials are considered to be less official and appear more like marketing. They plan to compare a one-page set of frequently asked questions about the survey to a shiny, glossy brochure. Reed-Gillette provided a link to the MCBS website for more information about the survey.6
Informing Follow-up Strategies to Reduce Nonresponse Bias
Andy Peytchev is a senior survey methodologist and fellow at RTI. He began by discussing the similarities between longitudinal surveys and cross-sectional surveys. Most of the nonresponse occurs in the first wave of data collection, he commented, and that is the similarity with any survey. In terms of representativeness, the first wave of data collection in a longitudinal design probably has the greatest potential for nonresponse bias because of the amount of nonresponse. Peytchev explained the bias in an estimate of a mean is the difference between a respondent and a nonrespondent mean multiplied by the nonresponse rate. Therefore, he pointed out, when the nonresponse rate is large, even relatively small differences between respondents and nonrespondents could lead to biases of substantive importance. Another similarity between cross-sectional surveys and the first wave in longitudinal surveys is that there is typically not much information
___________________
6 For more information, see www.cms.gov/mcbs.
available for nonrespondents. He noted that there has been a lot of research on cross-sectional surveys that is relevant to longitudinal surveys for the first wave of data collection.
In terms of dissimilarities, which was the focus of the rest of his presentation, Peytchev noted that longitudinal surveys have a wealth of substantive information collected in the early waves of data collection, and those variables are often related to measurements in subsequent waves. Therefore, the researcher could use the information collected in the first wave to measure bias after that first wave of data collection, inform data collection efforts after the first wave, and inform the nonresponse adjustments. Peytchev clarified that the measurement of bias after the initial wave assumes that the variables are stable over time, but this is not the bias researchers are interested in because the longitudinal design is usually used to measure change over time. Thus, the researcher will not have information on the estimates of change from the survey. He noted that there is more potential for using information, such as paradata and substantive data from prior waves to inform and tailor the data collection, for example by building models to identify which respondents would contribute to greater bias if they do not respond to the next wave. Finally, he noted that there is a wider array of variables that could be used for nonresponse adjustments.
Peytchev described two case studies to illustrate how longitudinal studies benefit from using the initial data collected to inform later data collections to reduce the risk of nonresponse bias. The first case study was a field test for the Baccalaureate and Beyond Longitudinal Study (B&B), which is a piggyback survey because it consists of a sample of respondents to the National Postsecondary Student Aid Study (NPSAS). NPSAS is like Wave 1 of a longitudinal study and B&B is the follow-up study that is done afterwards as a longitudinal study, Peytchev commented. The field test used three protocols (Table 2-6). All the protocols began with web data collection. The default protocol included CATI interviewing that started several weeks into data collection, offered an abbreviated interview to convert nonrespondents, and provided a $30 incentive for completion. The relaxed protocol simply offered a $20 incentive for web completion; there was no telephone interviewing or offer of an abbreviated interview. The aggressive protocol initiated CATI interviewing much earlier (week 2), included a $10 prepaid incentive and an additional $20 for completion, and offered an abbreviated interview earlier as well (week 4).
Respondents were assigned to the different protocols based on paradata from the prior data collection, NPSAS. The first group are the early respondents in NPSAS, the second group are late respondents to NPSAS, and Groups 3 and 4 are the nonrespondents to NPSAS, who were randomly split into two groups with half receiving the default protocol and half the aggressive protocol.
TABLE 2-6 Treatments Used in 2016/2017 Baccalaureate and Beyond Longitudinal Study (B&B) Field Test
| Phase | Relaxed | Default | Aggressive |
|---|---|---|---|
| Early Completion | Prepaid incentive CATI interviewing (week 2) | ||
| Production | No CATI contact | CATI interviewing (week 5) | Offer abbreviated interview (week 4) |
| Nonresponse Conversion | No abbreviated interview | Offer abbreviated interview | |
| Incentives | $20 completion | $30 promised | $10 prepaid $20 promised |
SOURCE: Adapted from Andy Peytchev workshop presentation, September 27, 2021.
Peytchev noted that the response rate for Group 1, who were the early respondents to NPSAS, was 75 percent, which was the highest response rate with the least effort (Table 2-7). Group 2, the late respondents in NPSAS, achieved a slightly lower response rate at 70 percent. Group 3, nonrespondents to NPSAS, proved to be really difficult respondents, and they had a 25 percent response rate. Group 4, also nonrespondents to NPSAS but who received a more aggressive protocol, had a substantially increased response rate compared to Group 3, with 37 percent.
Peytchev pointed out the importance of this approach in terms of bias (Table 2-7). For Groups 1 and 2, there was relatively little bias based on the available information. In contrast, Group 3 had the greatest bias, which was reduced in Group 4 using the aggressive protocol. Peytchev said it was
TABLE 2-7 Results from 2016/2017 Baccalaureate and Beyond Longitudinal Study (B&B) Field Test
| Group | Response Rate | Average Absolute Relative Bias |
|---|---|---|
| Group 1: Early Respondents, relaxed protocol | 75% | 4% |
| Group 2: Late Respondents, default protocol | 70% | 5% |
| Group 3: Nonrespondents, default protocol | 25% | 18% |
| Group 4: Nonrespondents, aggressive protocol | 37% | 14% |
SOURCE: Adapted from Andy Peytchev workshop presentation, September 27, 2021.
worth spending additional effort based on paradata on prior behavior to reduce overall bias.
Peytchev briefly touched on the second case study due to time constraints, but he noted that the goal was to estimate bias based on data collected from the prior wave, and use it to identify cases who not only respond at the lower rate, but also are different and underrepresented. The example he provided was a survey of renters and owners with multiple waves of data collection. Groups were defined by both response propensity and the values from prior waves. Peytchev showed that the targeted groups who were different and predicted to respond at a lower rate did have lower response rates. They were able to get those groups’ participation to mimic the rest of the groups with an increased incentive, although they were not as effective in reducing nonresponse bias. Peytchev commented when change over time is correlated with nonresponse, it is about the worst situation for a longitudinal study, and that may be what is happening. He concluded by noting that increases in nonresponse requires more complex study designs, and the longitudinal studies provide more information for these designs; however, it is a new challenge to estimate change in these behaviors and desired responses to measure in subsequent waves.
Discussion
John Phillips asked the presenters about administrative data sources that are potentially relevant for U.S. longitudinal studies to reduce nonresponse bias in NIA-supported studies. He asked if the only legitimate option is something like the Social Security Numident file or whether commercial data are a good option. Reed-Gillette said her study updates data with Medicare Social Security enrollment data to have the most recent information to contact samples.
Jennifer Madans asked the presenters about the most promising areas for future research for identifying and reducing selection bias and whether research could be coordinated to build a more comprehensive knowledge base. Sakshaug posited that administrative data have a lot to offer in terms of identifying and adjusting for selection bias in panel surveys. He noted that in Germany, most administrative records are also longitudinal in nature, so that even after panel participants drop out of a study, they can be followed through the administrative records. With these data, researchers can see if panel participants who drop out go on to have very different life course patterns compared to those who stay in the surveys, which is especially relevant for measuring change. Peytchev said a lot more could be done from a responsive and adaptive survey design perspective with data in longitudinal studies. He added that administrative data could be particularly useful in weighting adjustments to improve the quality of the survey
estimates themselves. Reed-Gillette said with the MCBS and the availability of the administrative data, they design the survey and the linkage with the study in mind to improve estimates of the utilization and costs of the health care services. She also said that MCBS is not allowed to use incentives, but they are interested in experimenting with them.
This page intentionally left blank.


